1. Introduction
Three-phase squirrel cage induction motor plays an important role in industrial processing because of its low cost and high reliability. However, sudden failures of the induction motor may lead to the descent of rotation precision or even result in irreversible damage to the whole machine and have to stop to maintain. Therefore, eccentricity fault diagnosis is necessary to guarantee the output precision and prevent the aggravation of the fault.
Airgap eccentricity is one of the most common types of fault occurring in the induction motor [
1]. This type of fault leads to unequal airgaps between the stator and rotor, which has a bad influence on the output rotation accuracy of the motor. If this type of fault is not resolved, it would cause the rotor–stator rub and consequently damage of the whole motor.
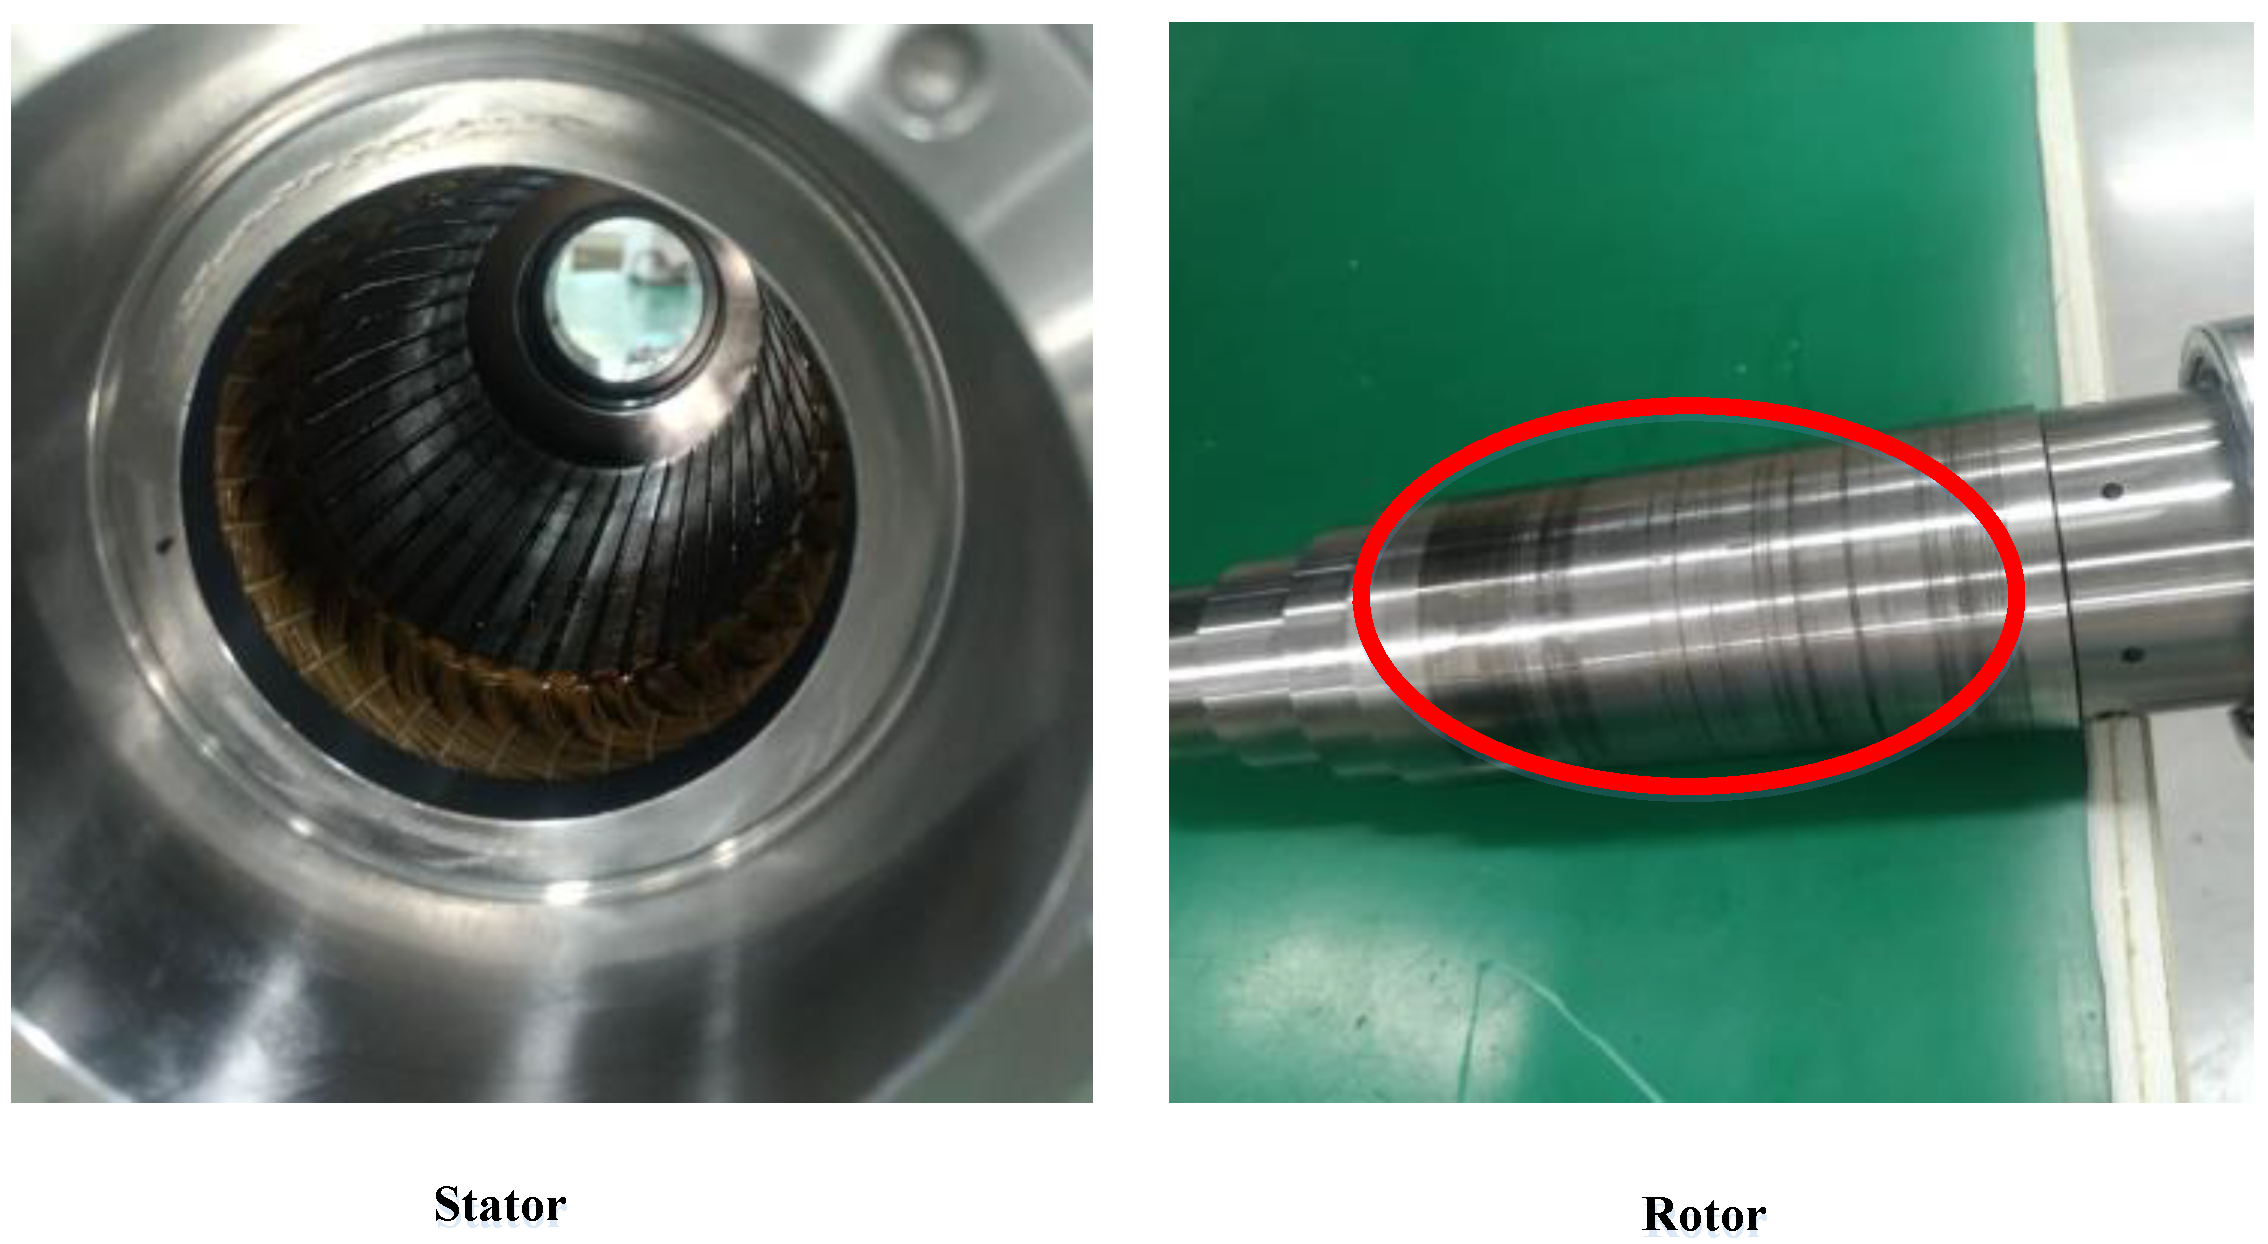
Figure 1 provides the rotor–stator rub fault caused by eccentricity. According to
Figure 1, the scratches are obvious on the outer ring of rotor shown in the red circle. For that cause, the motor is inevitable to maintain and this would inflict economic damage.
There are three forms of eccentricity including static eccentricity (SE), dynamic eccentricity (DE) and a combination of both that is called mixed eccentricity. In the SE, the rotor is displaced from the stator center, but the rotor rotates around its own center. In the DE, the rotor is also displaced from the stator center, but the rotor rotates around the center of the stator center. In most cases, the SE and DE simultaneously occur. In that case, the center of the stator, the center of the rotor and the rotation axis are displaced with respect to each other [
2,
3].
In order to detect the eccentricity fault, several types of techniques are used, such as the monitoring of magnetic flux and vibration [
4]. However, due to the high cost and difficult installation of sensors, the aforementioned methods are less recommended. In decade years, motor current signature analysis (MCSA) [
5] is widely used to detect the fault in the electrical machine, because the stator current signal is relatively easy to obtain and do not need additional complex and expensive sensors. According to the theoretical models, the spectral components related to fault can be located [
6]. The occurrence of airgap eccentricity can introduce the specific harmonic component in the stator current spectrum. Using MCSA, the harmonic frequency sideband associated with the eccentricity fault can be expressed as Equation (1) [
1,
7,
8,
9]:
where
is an integer,
is the number of rotor slots,
is the slip,
is the number of pole-pairs,
is the fundamental frequency,
is an integer representing the eccentricity order,
represents the static eccentricity and
represents the DE,
is the stator time harmonics. Moreover, if the SE and DE simultaneously occur, specific harmonic can be observed around fundamental frequency given by [
1,
7,
9]:
where
.
Using the MCSA, only the single-phase stator current needs to be measured in order to detect the eccentricity fault. Apart from the monitoring of single-phase current, instantaneous power is another signal that contains more information than the single-phase current. Due to the transfer from the fundamental frequency to around DC, the fault signal can be detected clearly and the signal-to-noise ratio (SNR) can be improved [
1]. Because of these advantages, the spectrum of complex apparent power signature has been employed for diagnosis of the mixed airgap eccentricity in the induction motor [
9]. The utilization of instantaneous active power, as well as reactive power signal accompanying with their power factor and phase angle, can help to detect the eccentricity fault and broken rotor bars, as well as discriminating them from mechanical load oscillation [
10]. However, the aforementioned method is based on the fast Fourier transform (FFT), and the sampling frequency and the acquisition time have a significant impact on the analysis solution. Under the load, speed and voltage variations as well as the minor fault in the induction motor and the spectrum of the phase stator current using the FFT become distorted and may lead to inaccuracy detection of airgap eccentricity fault [
8].
Compared to the frequency-domain analysis, other eccentricity fault signature processing methods are employed in order to handle the stationary signal as well as the non-stationary signal. Wavelet transform (WT) provides a time–frequency domain processing method that is known as its multi-resolution analysis application. The utilization of the discrete wavelet transform (DWT) in apparent power signals for diagnosis of airgap eccentricity fault under load torque variation is introduced by simulation as well as experiments [
8]. The wavelet packet decomposition (WPD) has been used to detect the eccentricity fault and distinguished from each other in steady-state operation conditions [
11]. Besides that, a time-domain modified Prony’s method is proposed for diagnosis of the airgap eccentricity with high accuracy only using a 10-ms dataset [
12].
However, the literature reveals that a few contributions have been previously provided to the method for diagnosis of the high levels of eccentricity fault. It is known that inherent airgap eccentricity exists in any electrical machine, even newly manufactured, so it is impossible to avoid it. For that, its level is estimated and accepted under 10% [
13]. This produces a consistent amount of unbalanced magnetic pull (UMP) in one direction, which can gradually lead to bearing wear, bent rotor shaft and finally result in DE fault [
14]. After a prolong operation under the DE, the fault severity may aggravate and even lead to the irretrievable loss. As for the motorized spindle, its rotation accuracy is influenced by undesired motion of rotor. Even low levels of eccentricity may have bad effect on the radial motions. Therefore, it is necessary to develop the study on fault diagnosis for induction motor under low levels of eccentricity fault.
DWT and WPD are widely used for detecting fault in industrial applications. However, under the processing of bandpass filtering using these algorithms, the band overlap is inevitable for the DWT as well as WPD. This can be proved in [
8]. Although the usage of DWT can help to extract the fault component for diagnosis of the airgap eccentricity, the problem of overlap can induce noisy component. As for the induction motor under low levels of eccentricity, the characteristic component is relatively weak, so that these noisy signals may lead to inaccurate diagnosis. Therefore, after using DWT or WPD, data post-processing is necessary in order to improve the SNR and overcome the overlap problem.
In this paper, the combined use of WPD and empirical mode decomposition (EMD) for processing the apparent power signal is proposed. Simulation signals of apparent power under low levels of purely DE are produced using the finite element method. Precise determination of the DE levels and percentages of rated load are both discussed in this study.
2. Modeling of Airgap Eccentricity Fault Using the Finite Element Method
For the purpose of detecting the fault accurately, the proper and precise modeling needs to be established [
15]. By considering the detailed real-world parameters and practical conditions, the finite element analysis (FEA) provides a reliable method. The FEA is based on the equivalent electric and magnetic circuits, which is close to the reality [
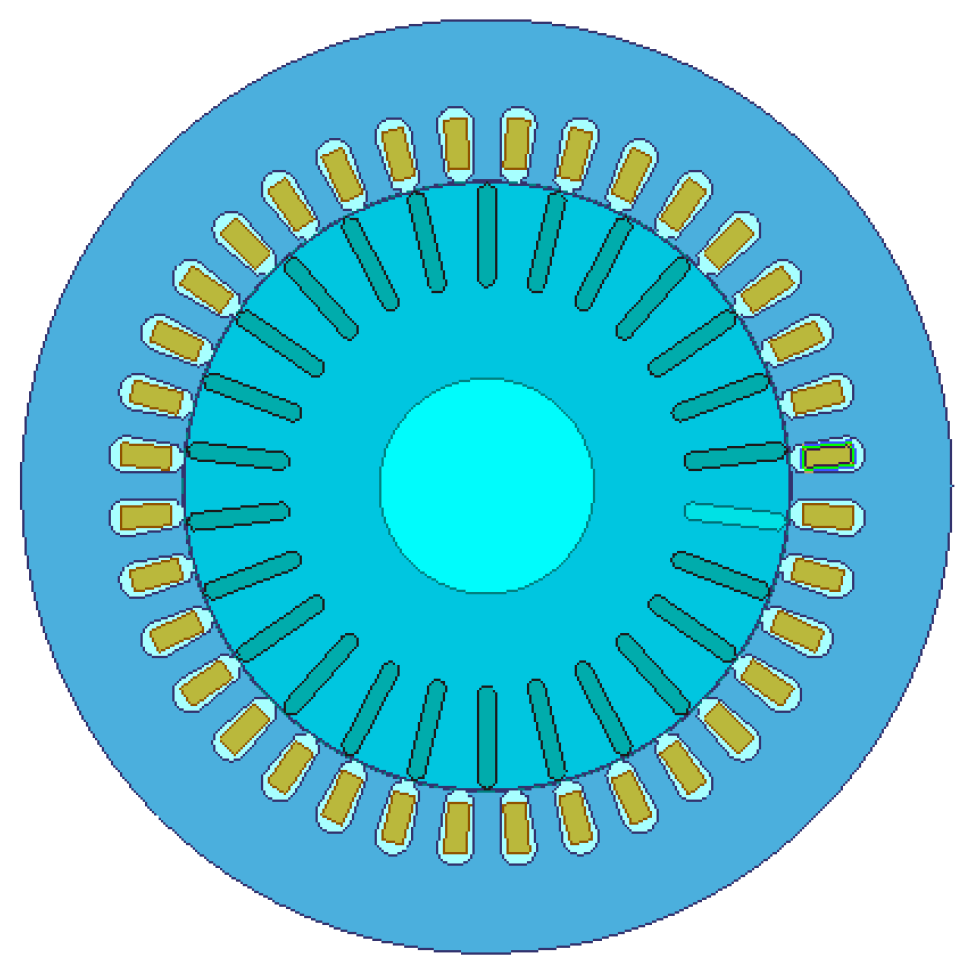
16]. In this paper, the modeling of the induction motor under DE fault is established by the finite element method. The geometric model of all parts of motor, such as rotor, stator and shaft, are all included in the modeling. Besides that, the material property of all components in the motor, the decision boundary, the excitation source, the slot and winding condition are taken into consideration. In this model, the external voltage sources transient equations, the field equations and the motion equations are mutually coupled in the finite element model. Moreover, the nonlinearity of iron is also incorporated into this transient analysis [
2].
Figure 2 shows the modeling of induction motor using the FEM.
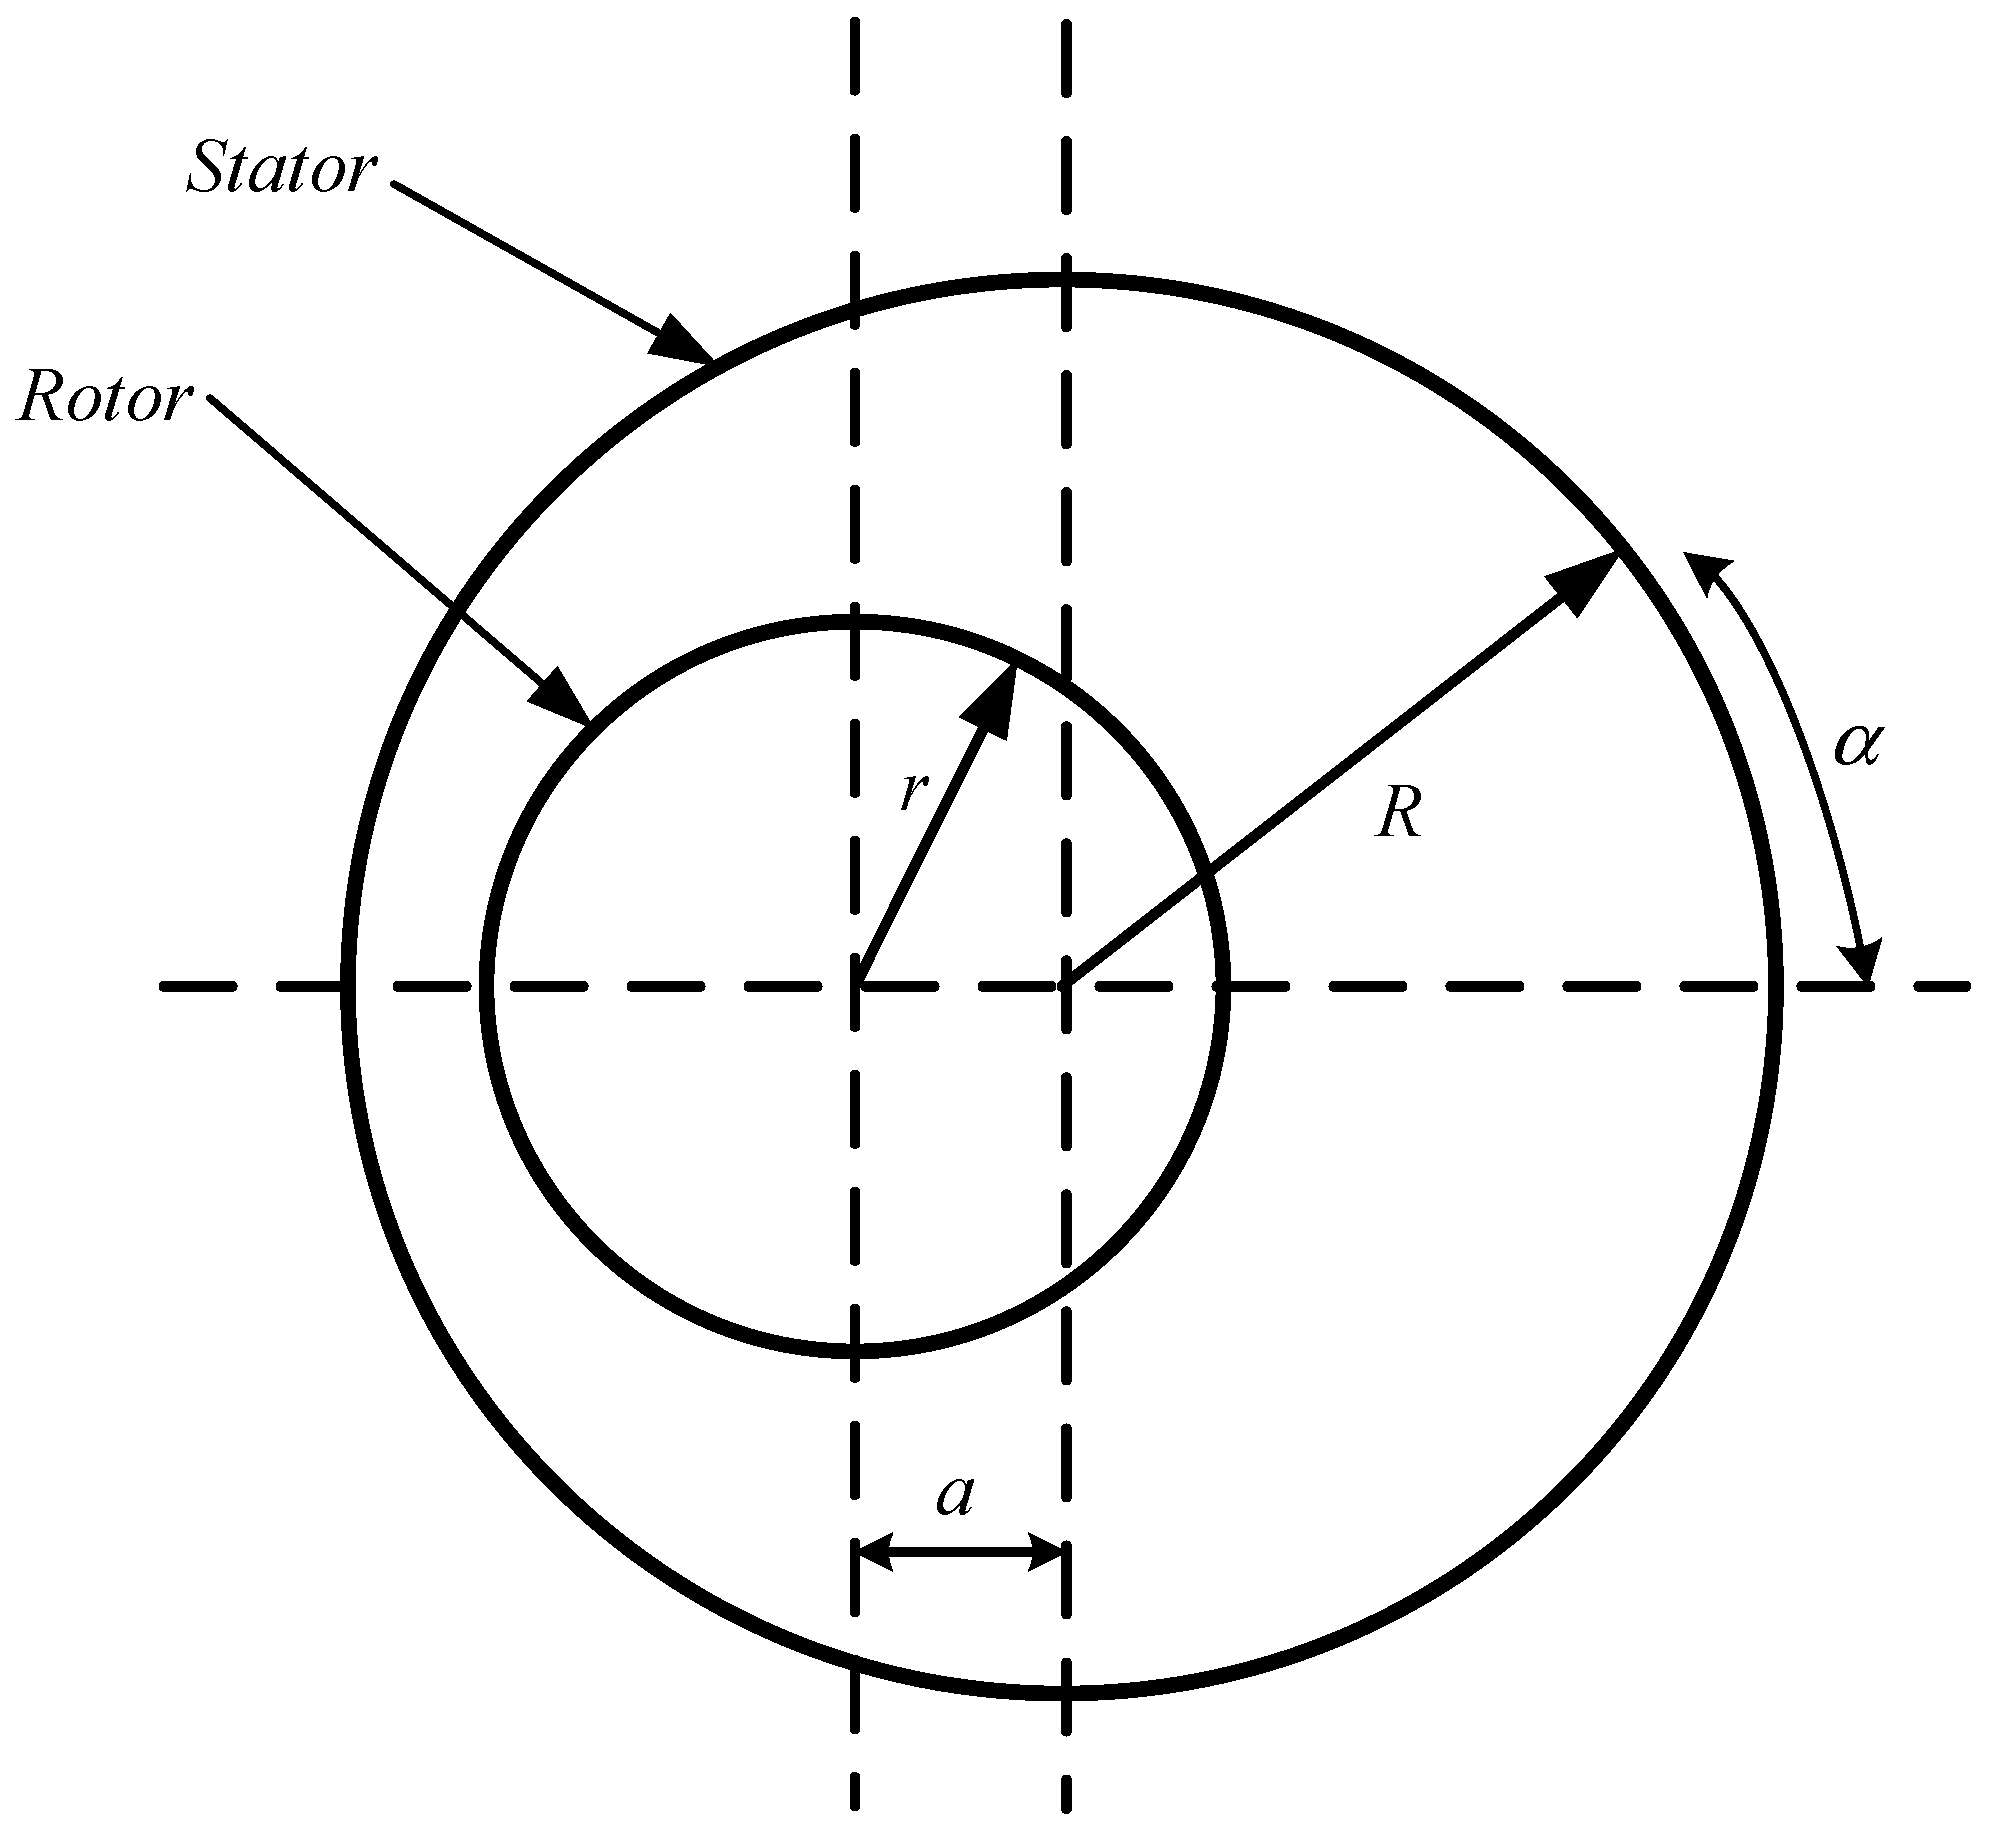
The DE introduces the unbalance of the airgap resulting in the asymmetry of the motor structure. Therefore, the airgap between the rotor and stator is non-uniform due to the eccentricity fault.
Figure 3 illustrates an induction motor model under the DE.
and
represent the radii of stator and rotor, respectively. The occurrence of DE introduces the shift
between the stator symmetrical axis and the rotor symmetrical axis. Hence, the airgap distribution in this case is non-uniform under the reference of stator axis and also time-variant. A most special noteworthiness is that the condition that the axis of the rotor is parallel to the stator axis is considered.
Consequently, due to the DE, specific components appear in the stator current spectrum, at sideband frequencies around fundamental and principle slot harmonics (PSH), the expression is given as follows [
7]:
where
.
In most cases, the SE and DE tend to coexist and the mixed eccentricity needs to be considered in reality [
10].
The specific component under the mixed eccentricity can be detected around the fundamental frequency in the stator current, given by [
1]:
where
.
4. Fast Fourier Transform (FFT) Drawbacks under Low Levels of Dynamic Eccentricity
In order to guarantee the accuracy of the simulation results using the finite element method, the time step must be sufficiently small. Besides that, the simulation time needs to be ensured in order to obtain suitable frequency resolution [
13]. A high sampling frequency and a long-time acquisition are mandatory in order to obtain good results using the FEA. However, this processing obviously increases the computational complexity for simulation study. To extract the fault information, the feature extraction method is based on the low characteristic frequency of airgap eccentricity.
To highlight the FFT drawbacks under low levels of DE, the simulation tests are implemented on a three-phase squirrel induction motor with 11-kW output power, 4 poles, and 26 rotor bars. The stator windings are coupled with delta connection.
Appendix A listed the parameter of the induction motor.
Both the sampling frequency of single current and the corresponding voltage signal are 1000 Hz, while the number of sampling points
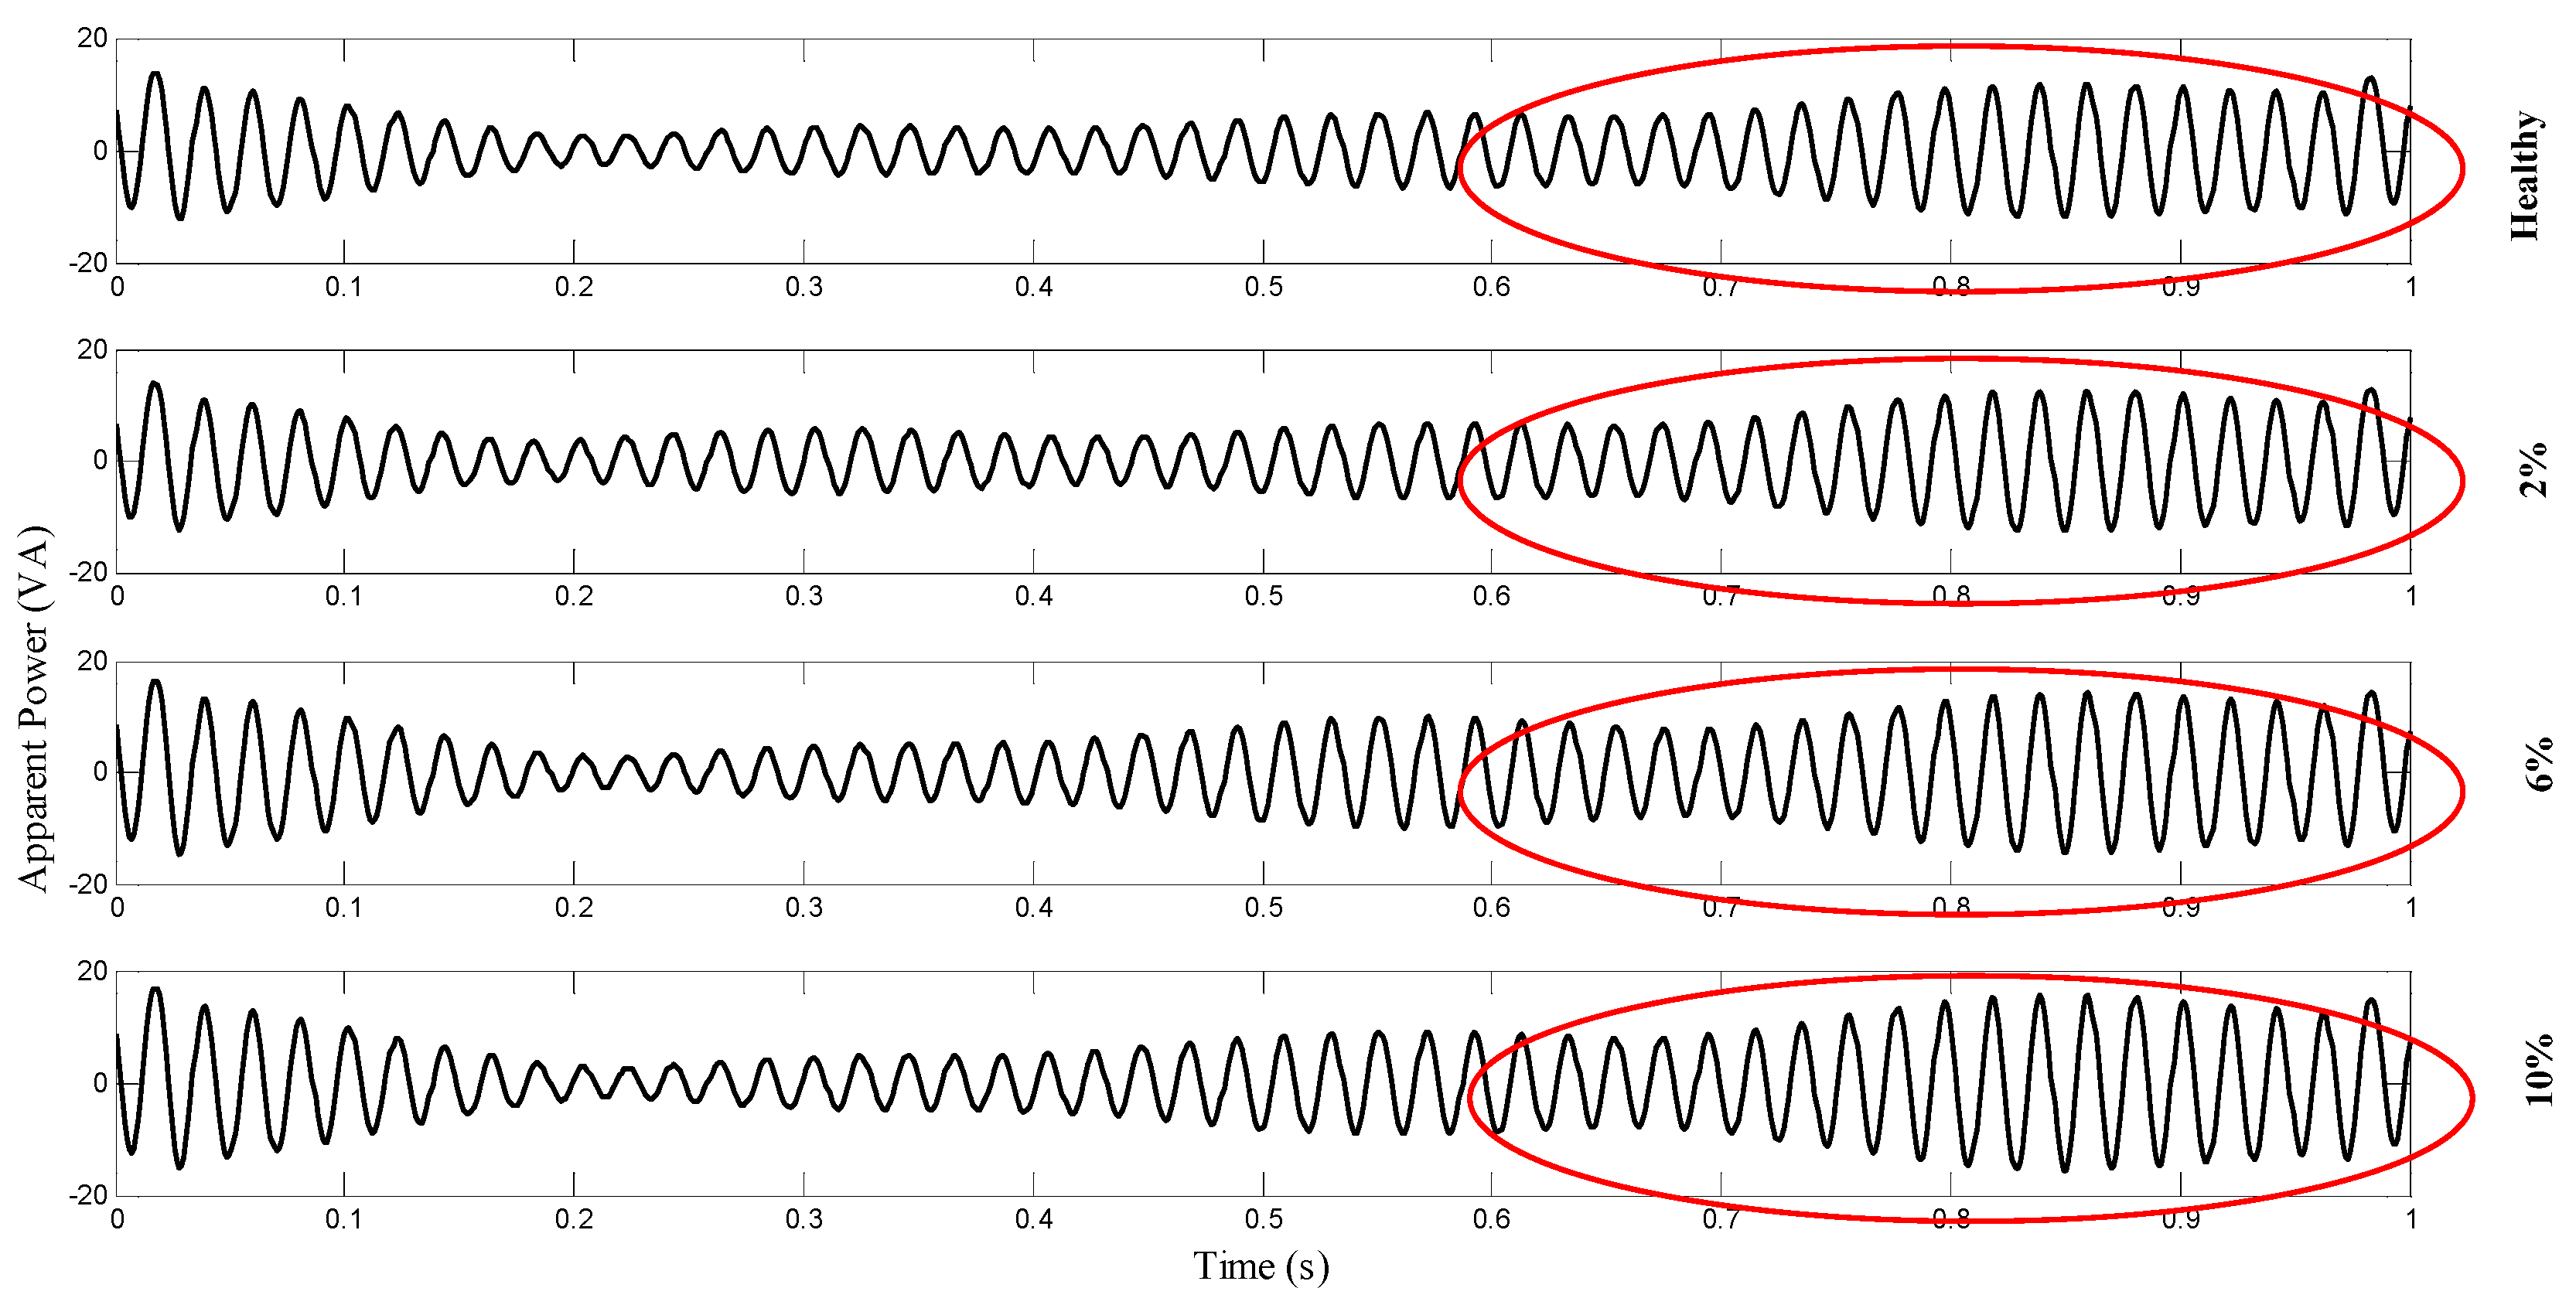
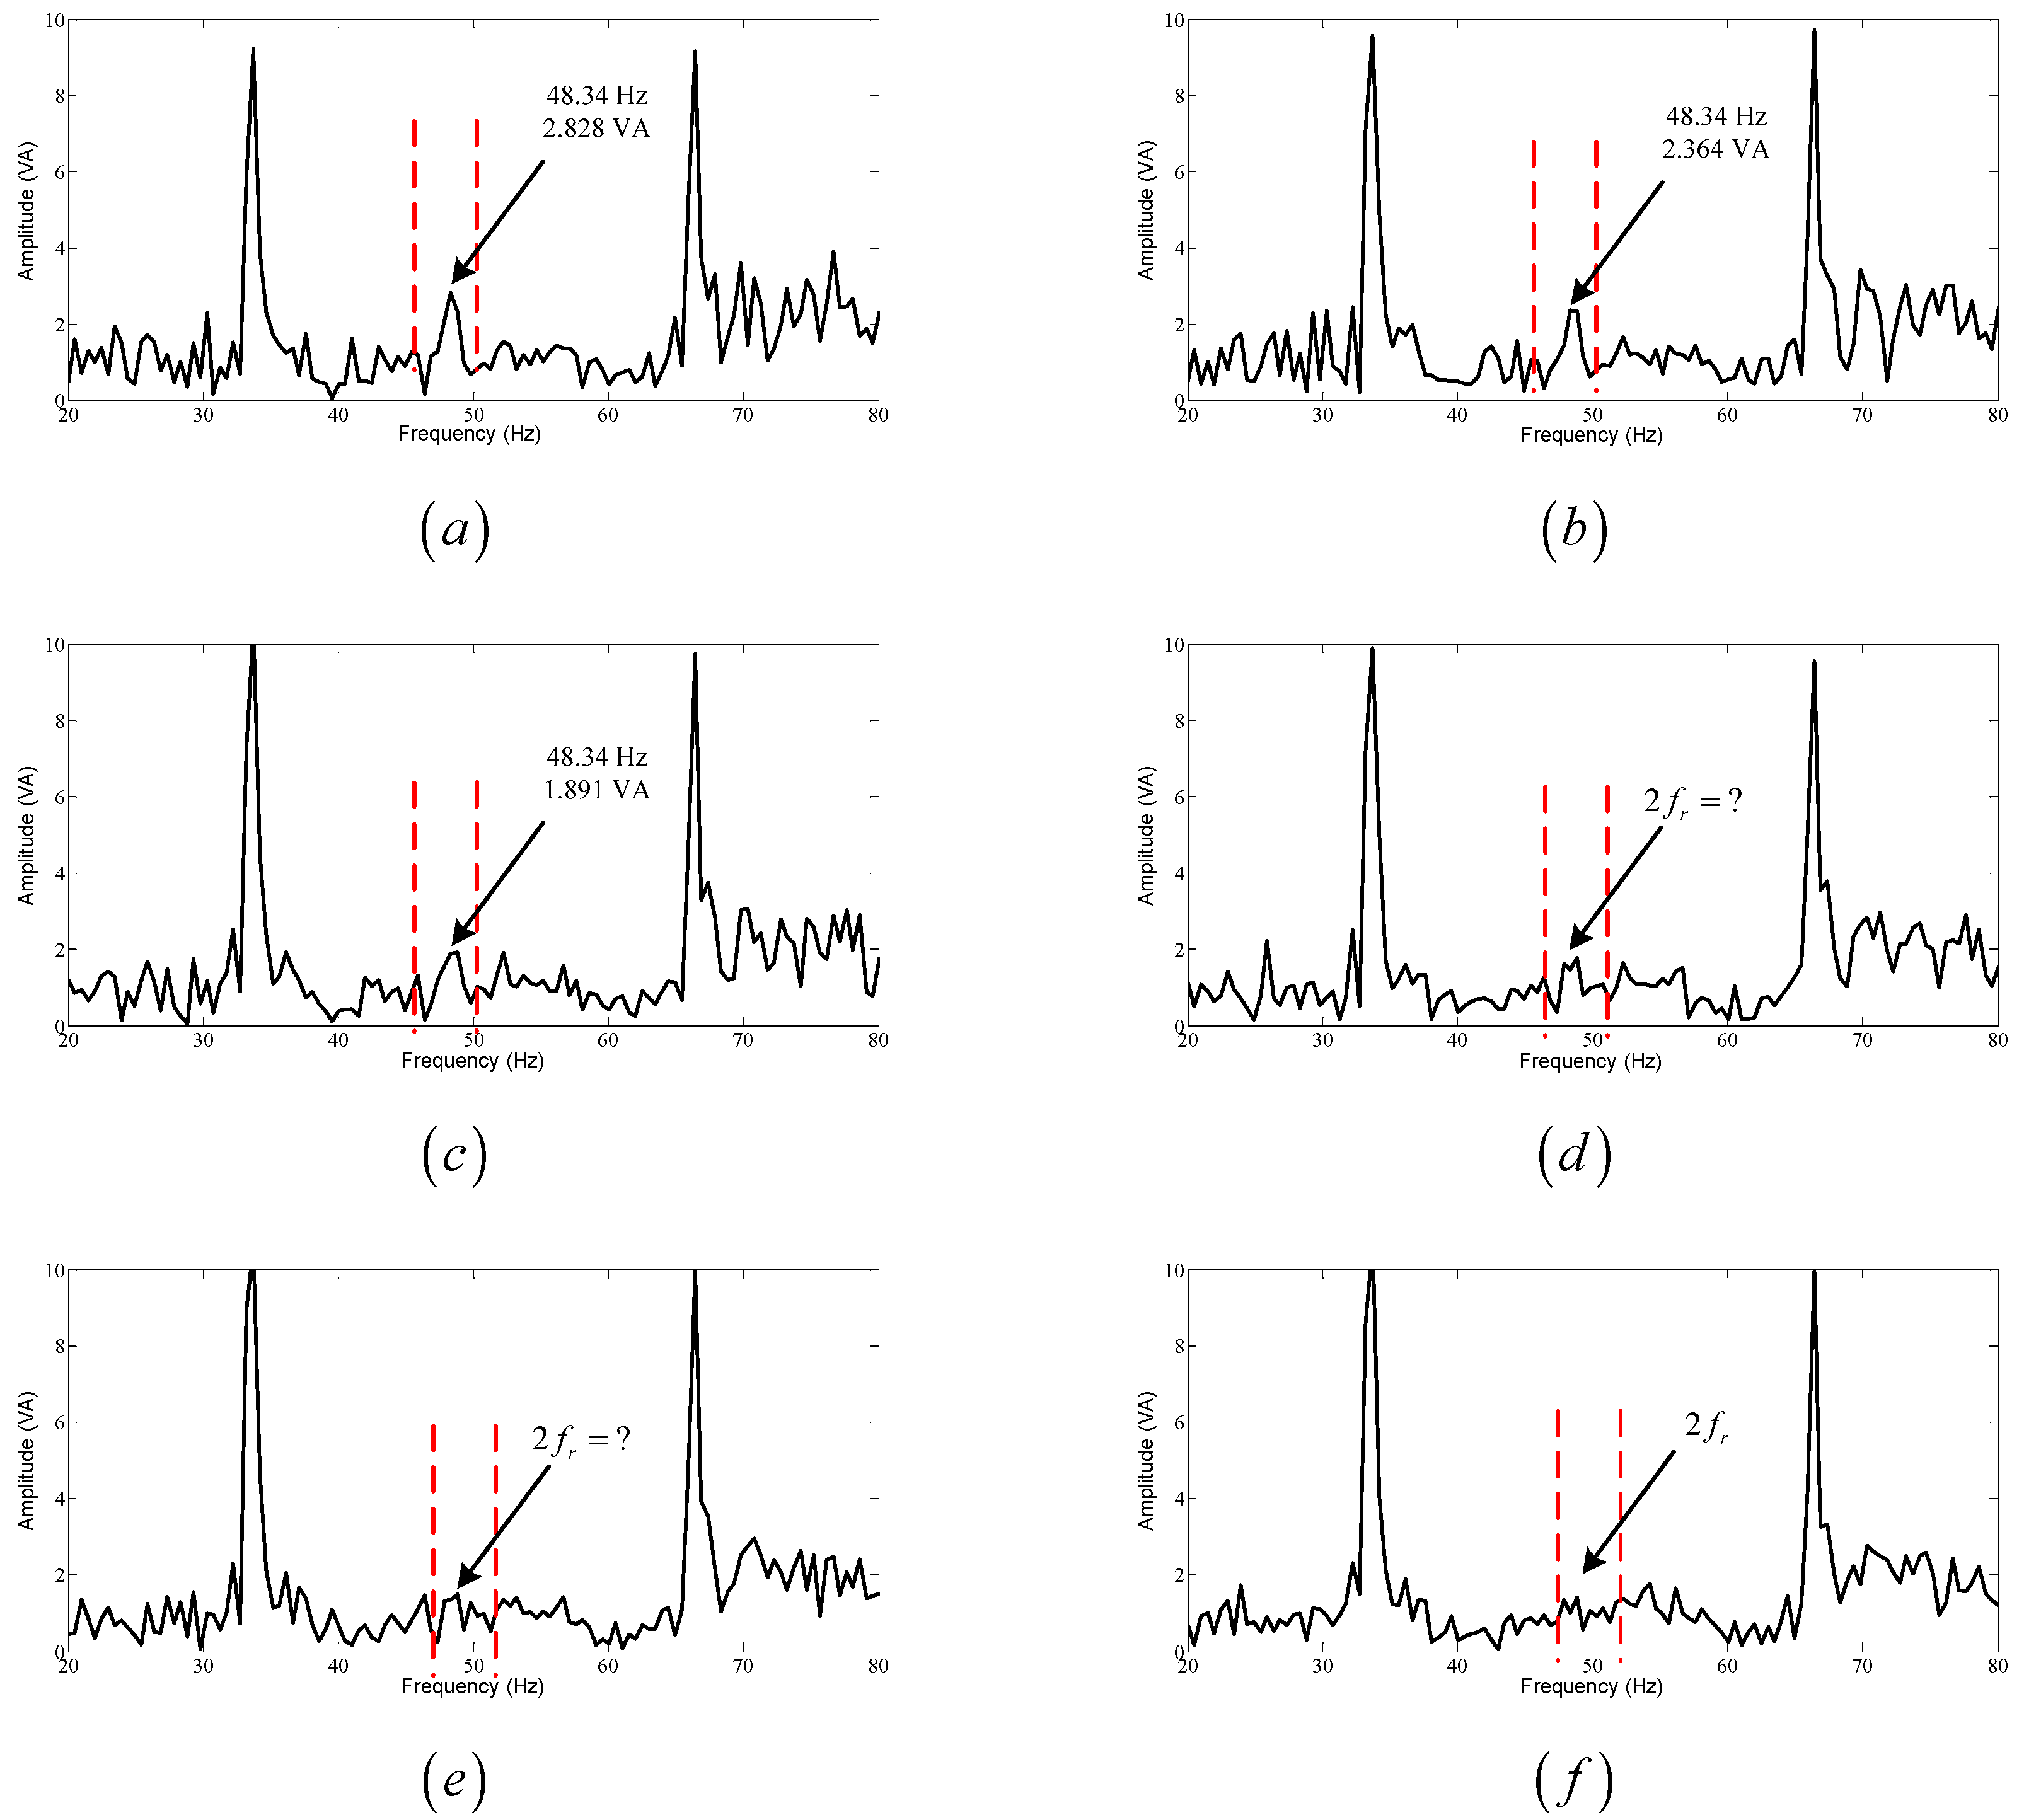
is 1000. The calculated FFT spectrums of the apparent power signature with five types of purely DE levels are shown in
Figure 4a–e. The spectrums shown in
Figure 4a–c confirm that the characteristic harmonic component with over 6% of DE appears clearly at 48.34 Hz. However, due to the weak signal under low levels of DE, the diagnostic method based on the FFT becomes more difficult. The simulation results show that the faulty signature at
is interfered with another noisy signal due to the FFT limitations. It is obvious that the characteristic frequency component-based fault location and amplitude are difficult to extract under lower levels of DE. Hence, this process may lead to erroneous eccentricity fault diagnosis.
5. Apparent Power Signature Processing
In this section, the apparent power signature has been newly processed. The combined use of WPD and EMD has been proposed in order to extract the characteristic harmonic component related to the DE fault. Although EMD is a self-adaption filtering method that decomposes the original signal into different scales, mode aliasing or mode mixing is a common phenomenon in the process of EMD [
19]. Especially when the target signal is difficult to distinguish, EMD may not give an accurate result. Hence, before using EMD, WPD has been used to filtering the massive noisy component.
5.1. Wavelet Packet Decomposition (WPD)
WPD is an extension of the DWT by generalizing the link between multi-resolution approximation and the Mallat algorithm. In this algorithm, WPD splits the approximation and detail space simultaneously. It has been shown that better frequency resolution is obtained so that more features can be extracted from the original signal [
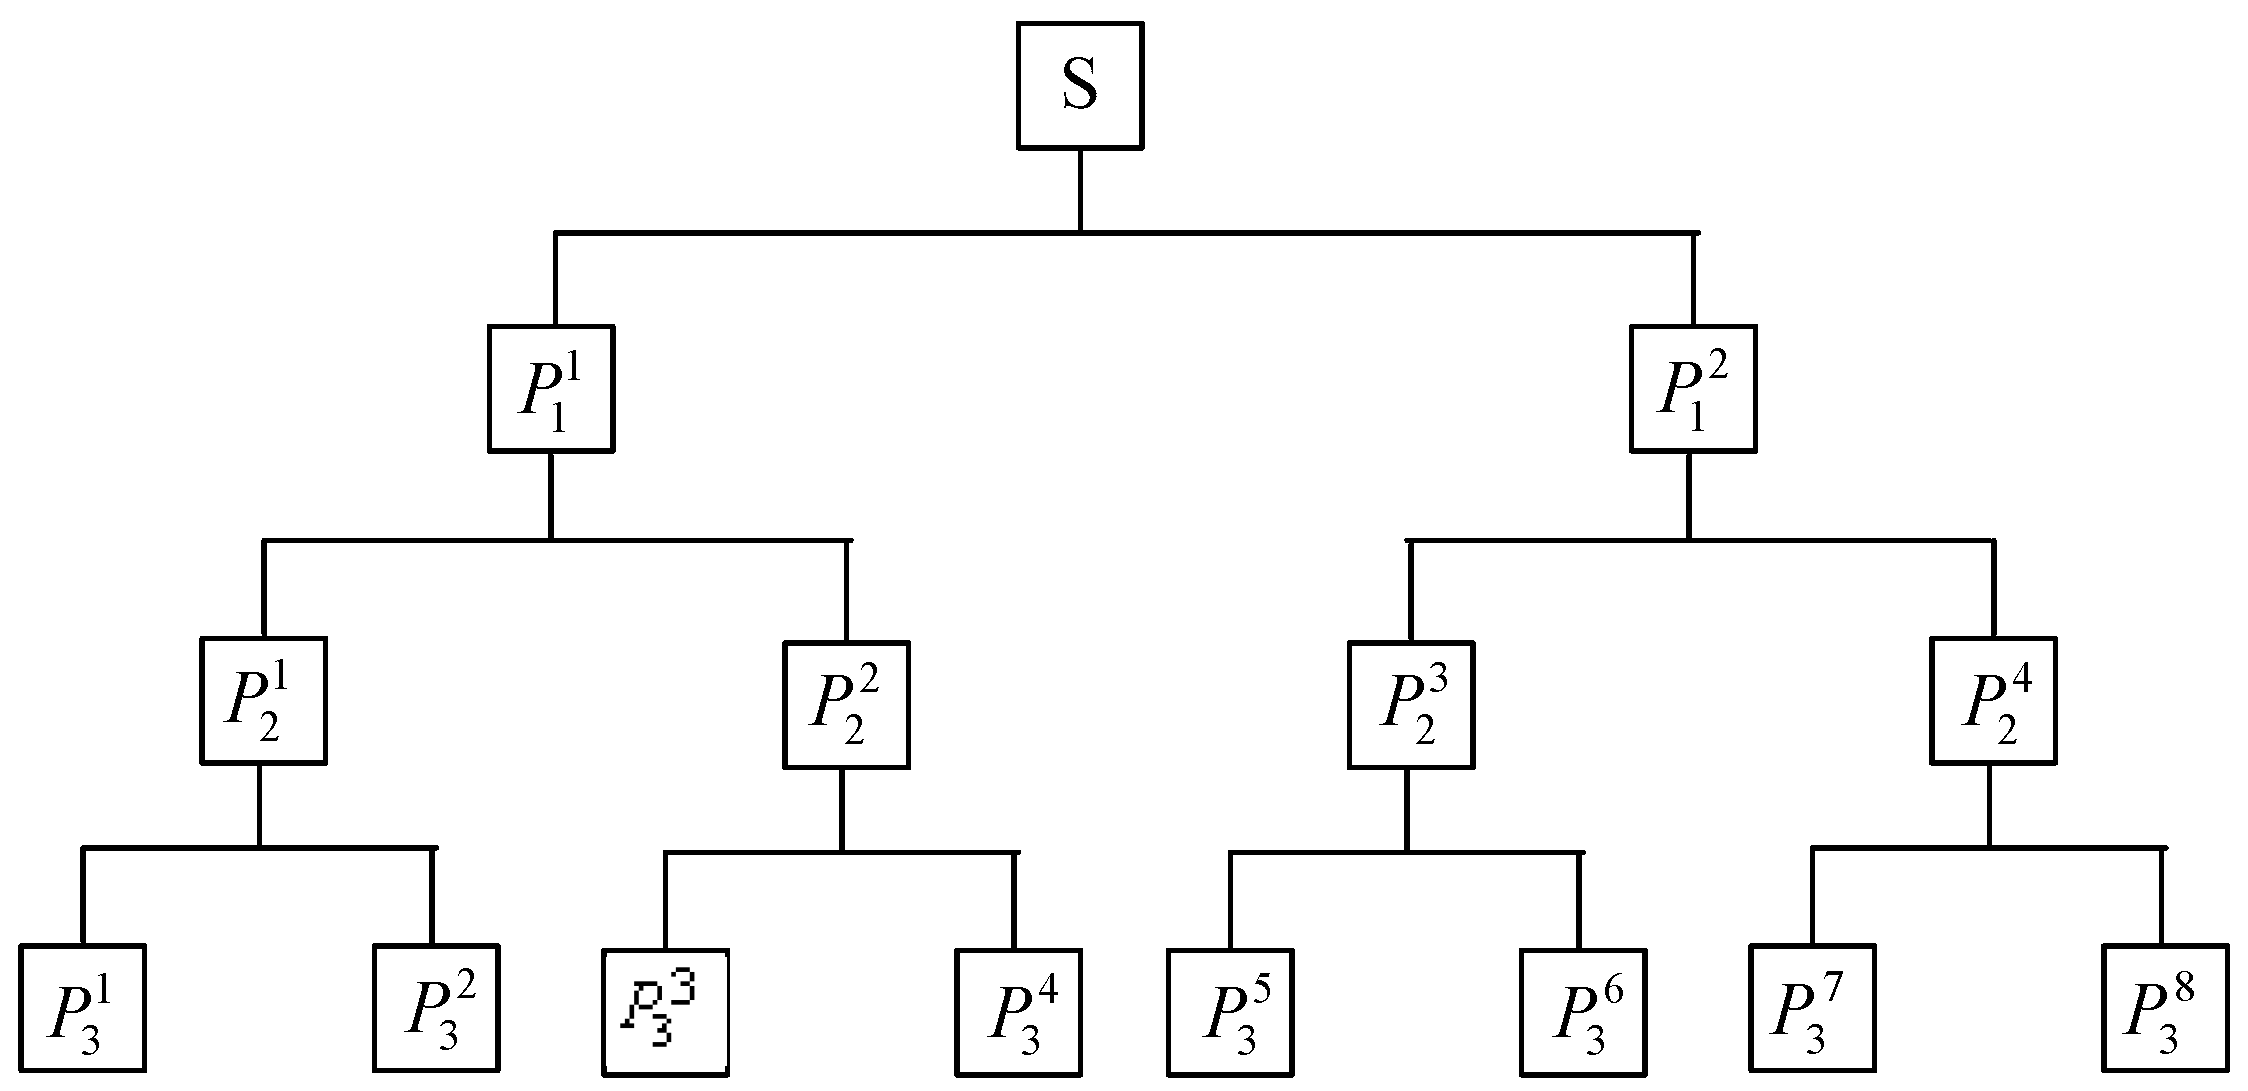
20]. The recursive process of WPD is represented by the type of binary tree in
Figure 5. The wavelet packet coefficients are represented by
. Each node of the wavelet packet tree is denoted with a pair of integers
, where
represents the decomposition level and
represents the order position at the corresponding level. Similar to the DWT, the original signal
is decomposed into the approximation part
and detail part
at the first level. In the next step, the detail part
is spilt into the high-frequency part
and the low-frequency part
. This process is repeated in the following step. According to the coefficient
, a reconstruction signal
of data length
can be generated, by setting all the other coefficients to be zero and implementing the wavelet packet tree in the inverse procedure [
21].
To distinguish the characteristic harmonic component from the apparent-power signature, the type of mother wavelet and the decomposition level must be well selected. The WPD of the original signal can be regarded as projecting the signal onto the wavelet packet basis, in order to obtain a series of the coefficient . For the purpose of extracting the fault signal, the wavelet coefficient should be larger than those of other series. Besides that, the appropriate selection of decomposition level can help to extract the characteristic signal and save the computation time.
In this paper, the db44 mother wavelet is used for simulation results. By considering the computation time using FEA, a sampling frequency is chosen at 1 kHz and the time acquisition is selected at one second with the frequency resolution of 1 Hz. For the simulation case, the characteristic component frequency appears at in the apparent power. Therefore, the original apparent power signal is decomposed into 8 levels. The node (8, 10) and the node (8, 21) which contain harmonic components and are selected in order to reconstruct the signal.
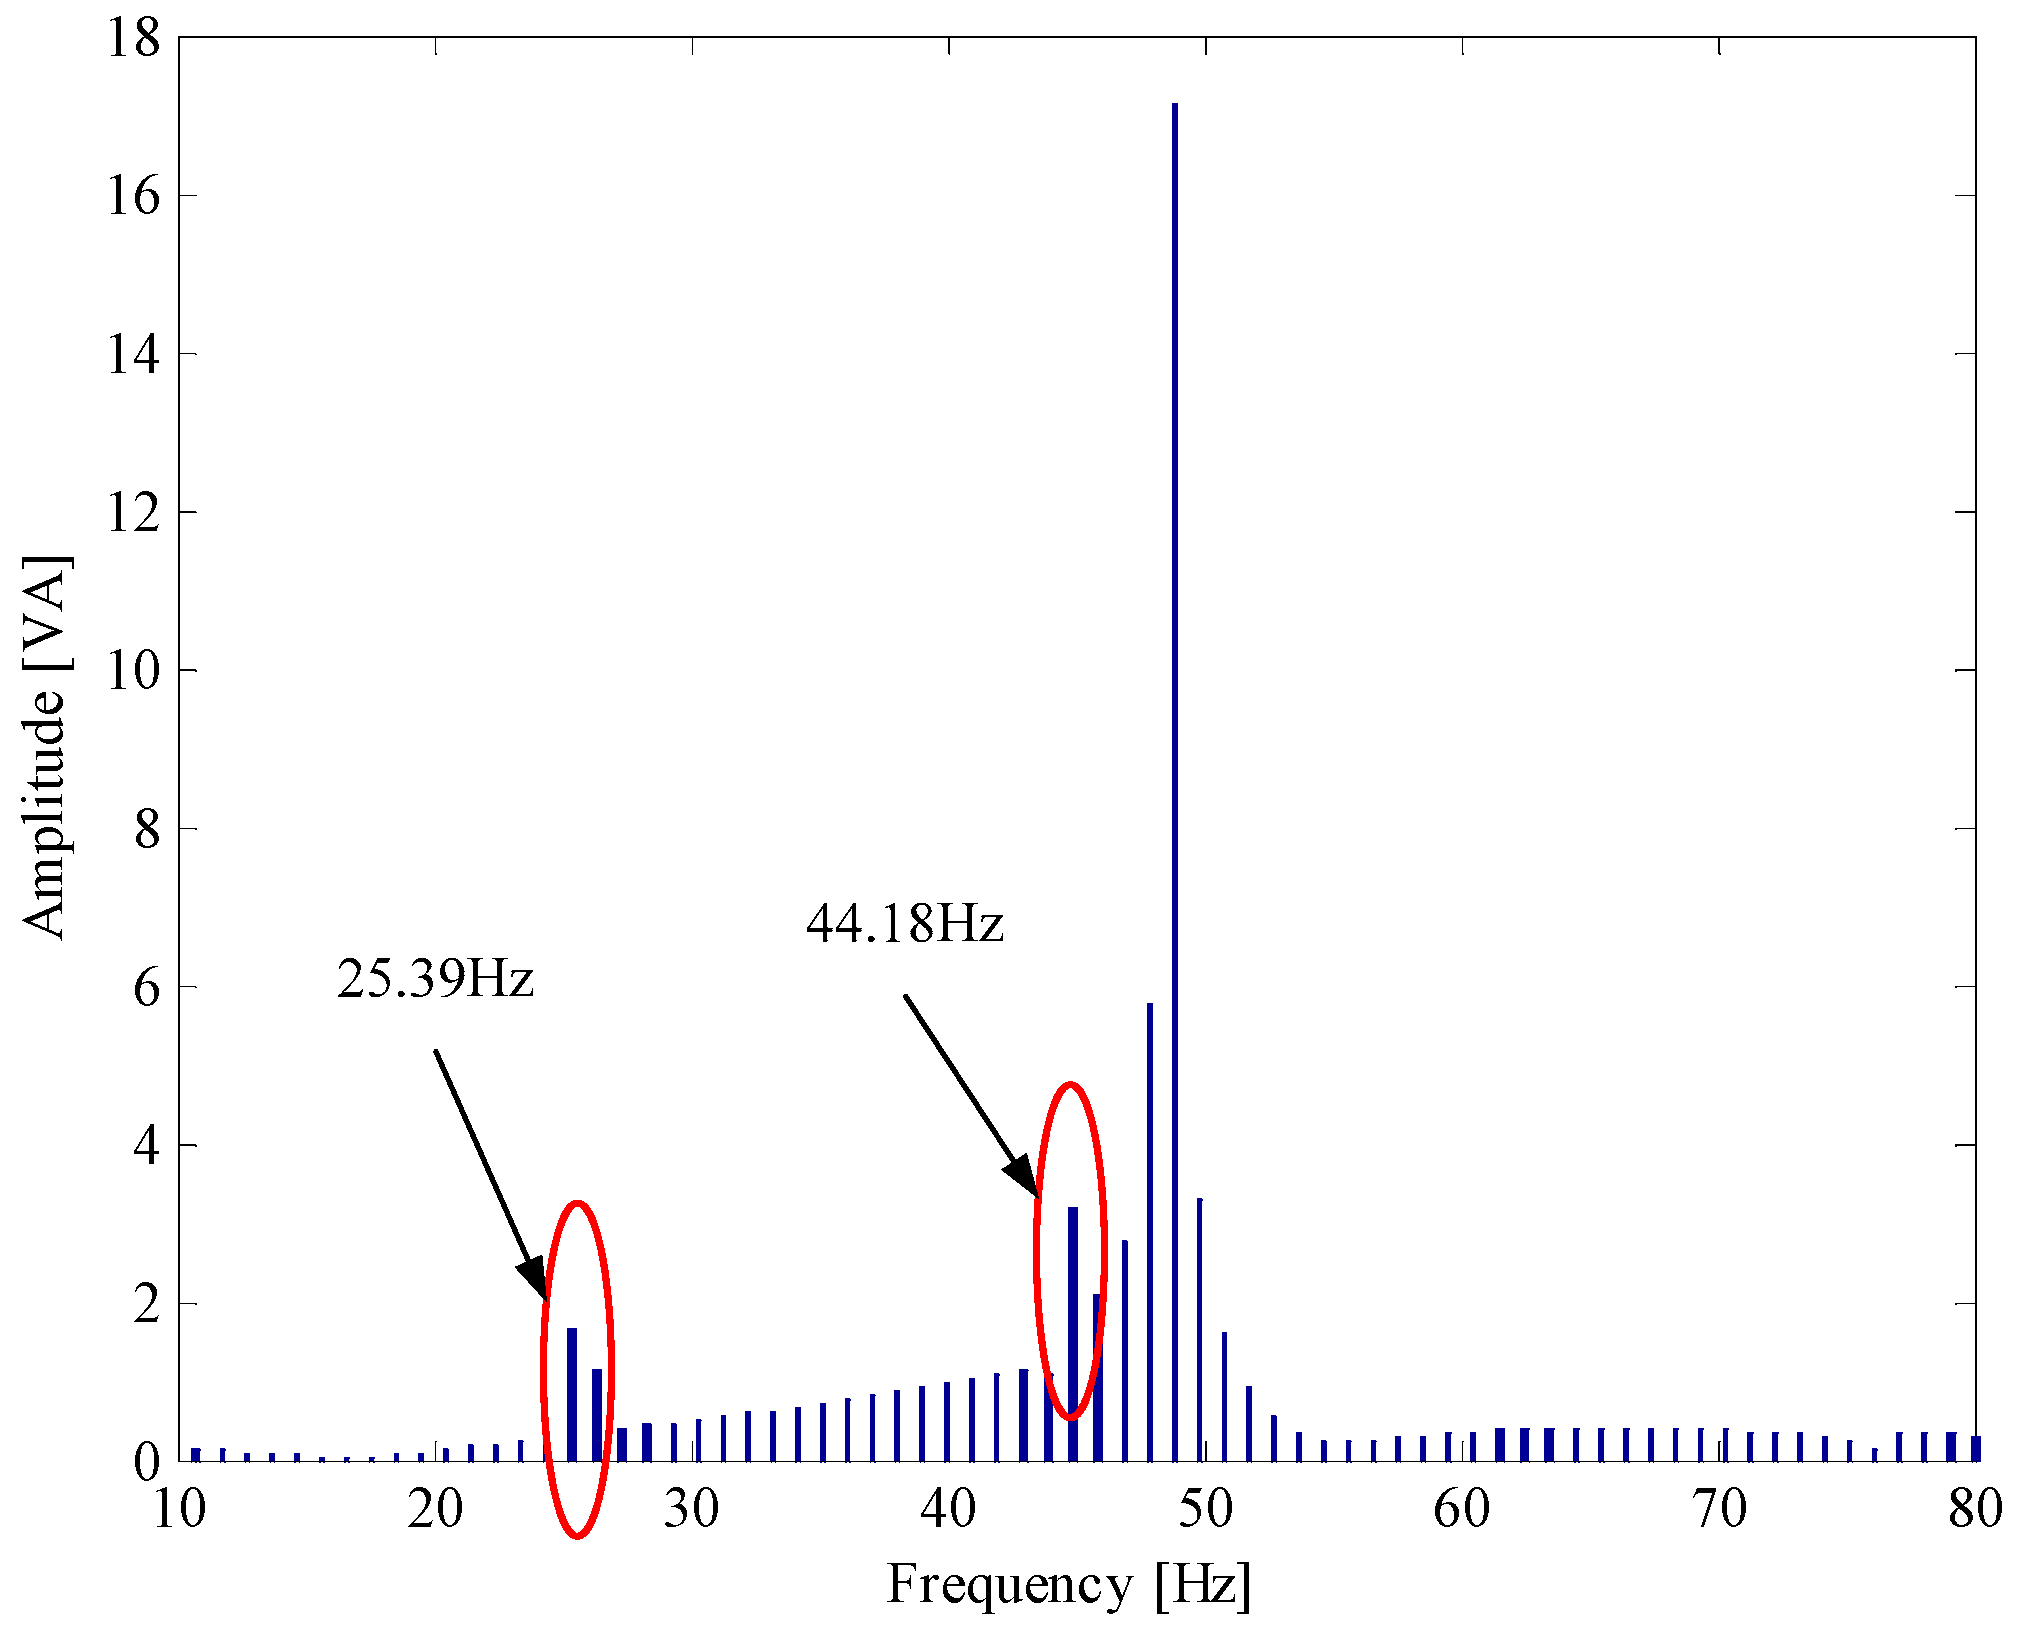
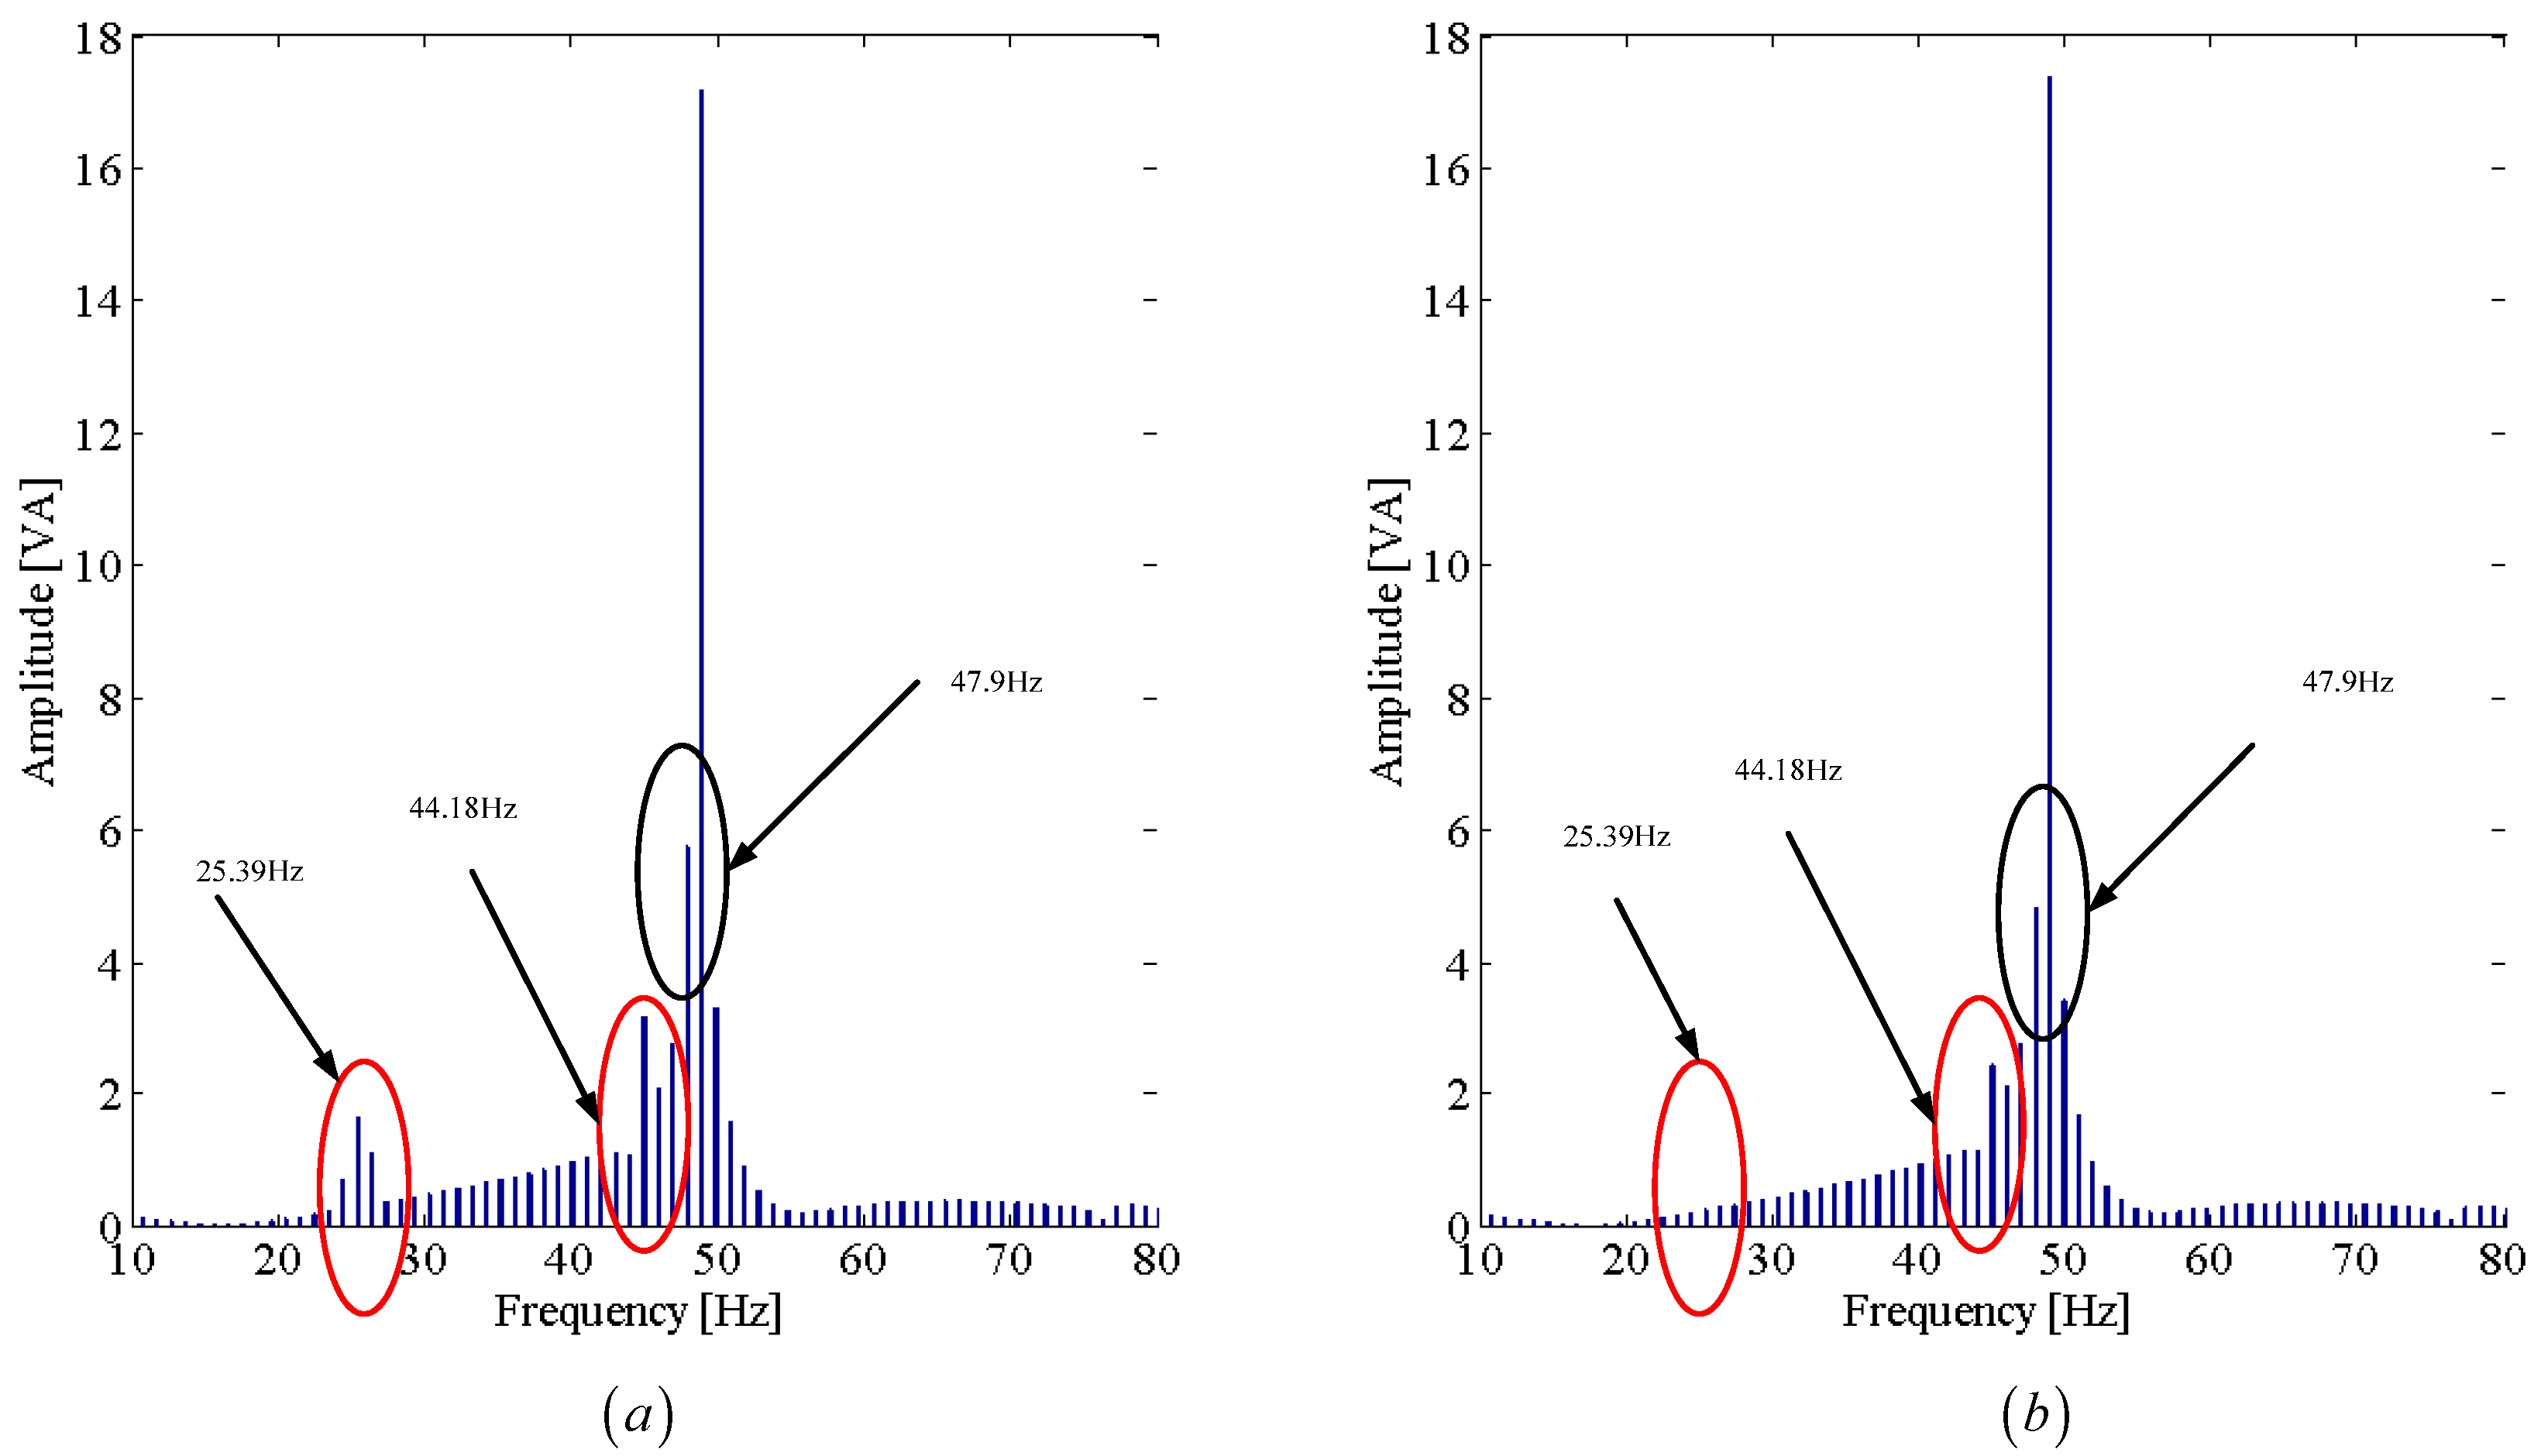
Figure 6 gives the decomposition result based on the simple use of WPD. The characteristic faulty component, which is approximately 48.34 Hz, is chosen as an analytical object. Moreover, the motor is under 33% of rated load with 2% of purely DE. The FFT spectrum shows that the dominant spectral components are located at a frequency of 48.34 Hz. However, it is noticeable that there exist other components of 44.18 Hz and 25.39 Hz in the red circle shown in
Figure 6. These two parts are not related to the eccentricity fault, which is inevitable for the WPD due to the overlap problem between adjacent bands. Therefore, it is essential to filter these two noisy components in order to improve the SNR. After using the WPD algorithm, the filtered signal needs to be post-processed in order to eliminate or suppress the corresponding noisy components.
5.2. Empirical Mode Decomposition (EMD)
WPD, providing a multi-resolution analysis, can be regarded as a design of the band-pass filter. It is noteworthy that the filtering is not ideal which leads to a certain overlap between adjacent frequency bands [
8]. Besides that, another noisy signal, which is irrelevant to the eccentricity fault, may have a bad influence on detecting the characteristic signature, especially in the case of low levels of DE. This process leads to distortion of fault severity and may cause erroneous detection. Therefore, EMD is introduced in order to eliminate or restrain noisy signals and extract the characteristic signature clearly.
The EMD provides a time–frequency analysis method that decomposes the original signature into intrinsic mode functions (IMFs). The essence of this method is to identify the intrinsic oscillatory modes by their characteristic time scales in the data empirically [
22]. For the original data
, the extrema including the local maxima and minima are identified. All the local maxima are connected via a cubic spline interpolation in order to produce the upper envelope
; similarly, the lower envelope
can also be produced. All the data in
should be covered by the upper and lower envelops. The distinction between the original data
and
can be calculated by
. The purpose of this sifting process is to eliminate the riding waves and to make the wave-profiles more symmetric [
23]. Hence, the aforementioned step has to be repeated more times until satisfying the stop criterion and the first IMF
can be obtained from the data. After that, the residue
between
and
can be separated by Equation (15):
In this step, the residue
is treated as the new data and repeated by the above sifting process. Finally, the
can be decomposed into
IMFs and a residue
illustrated by Equation (16) [
24,
25]:
In
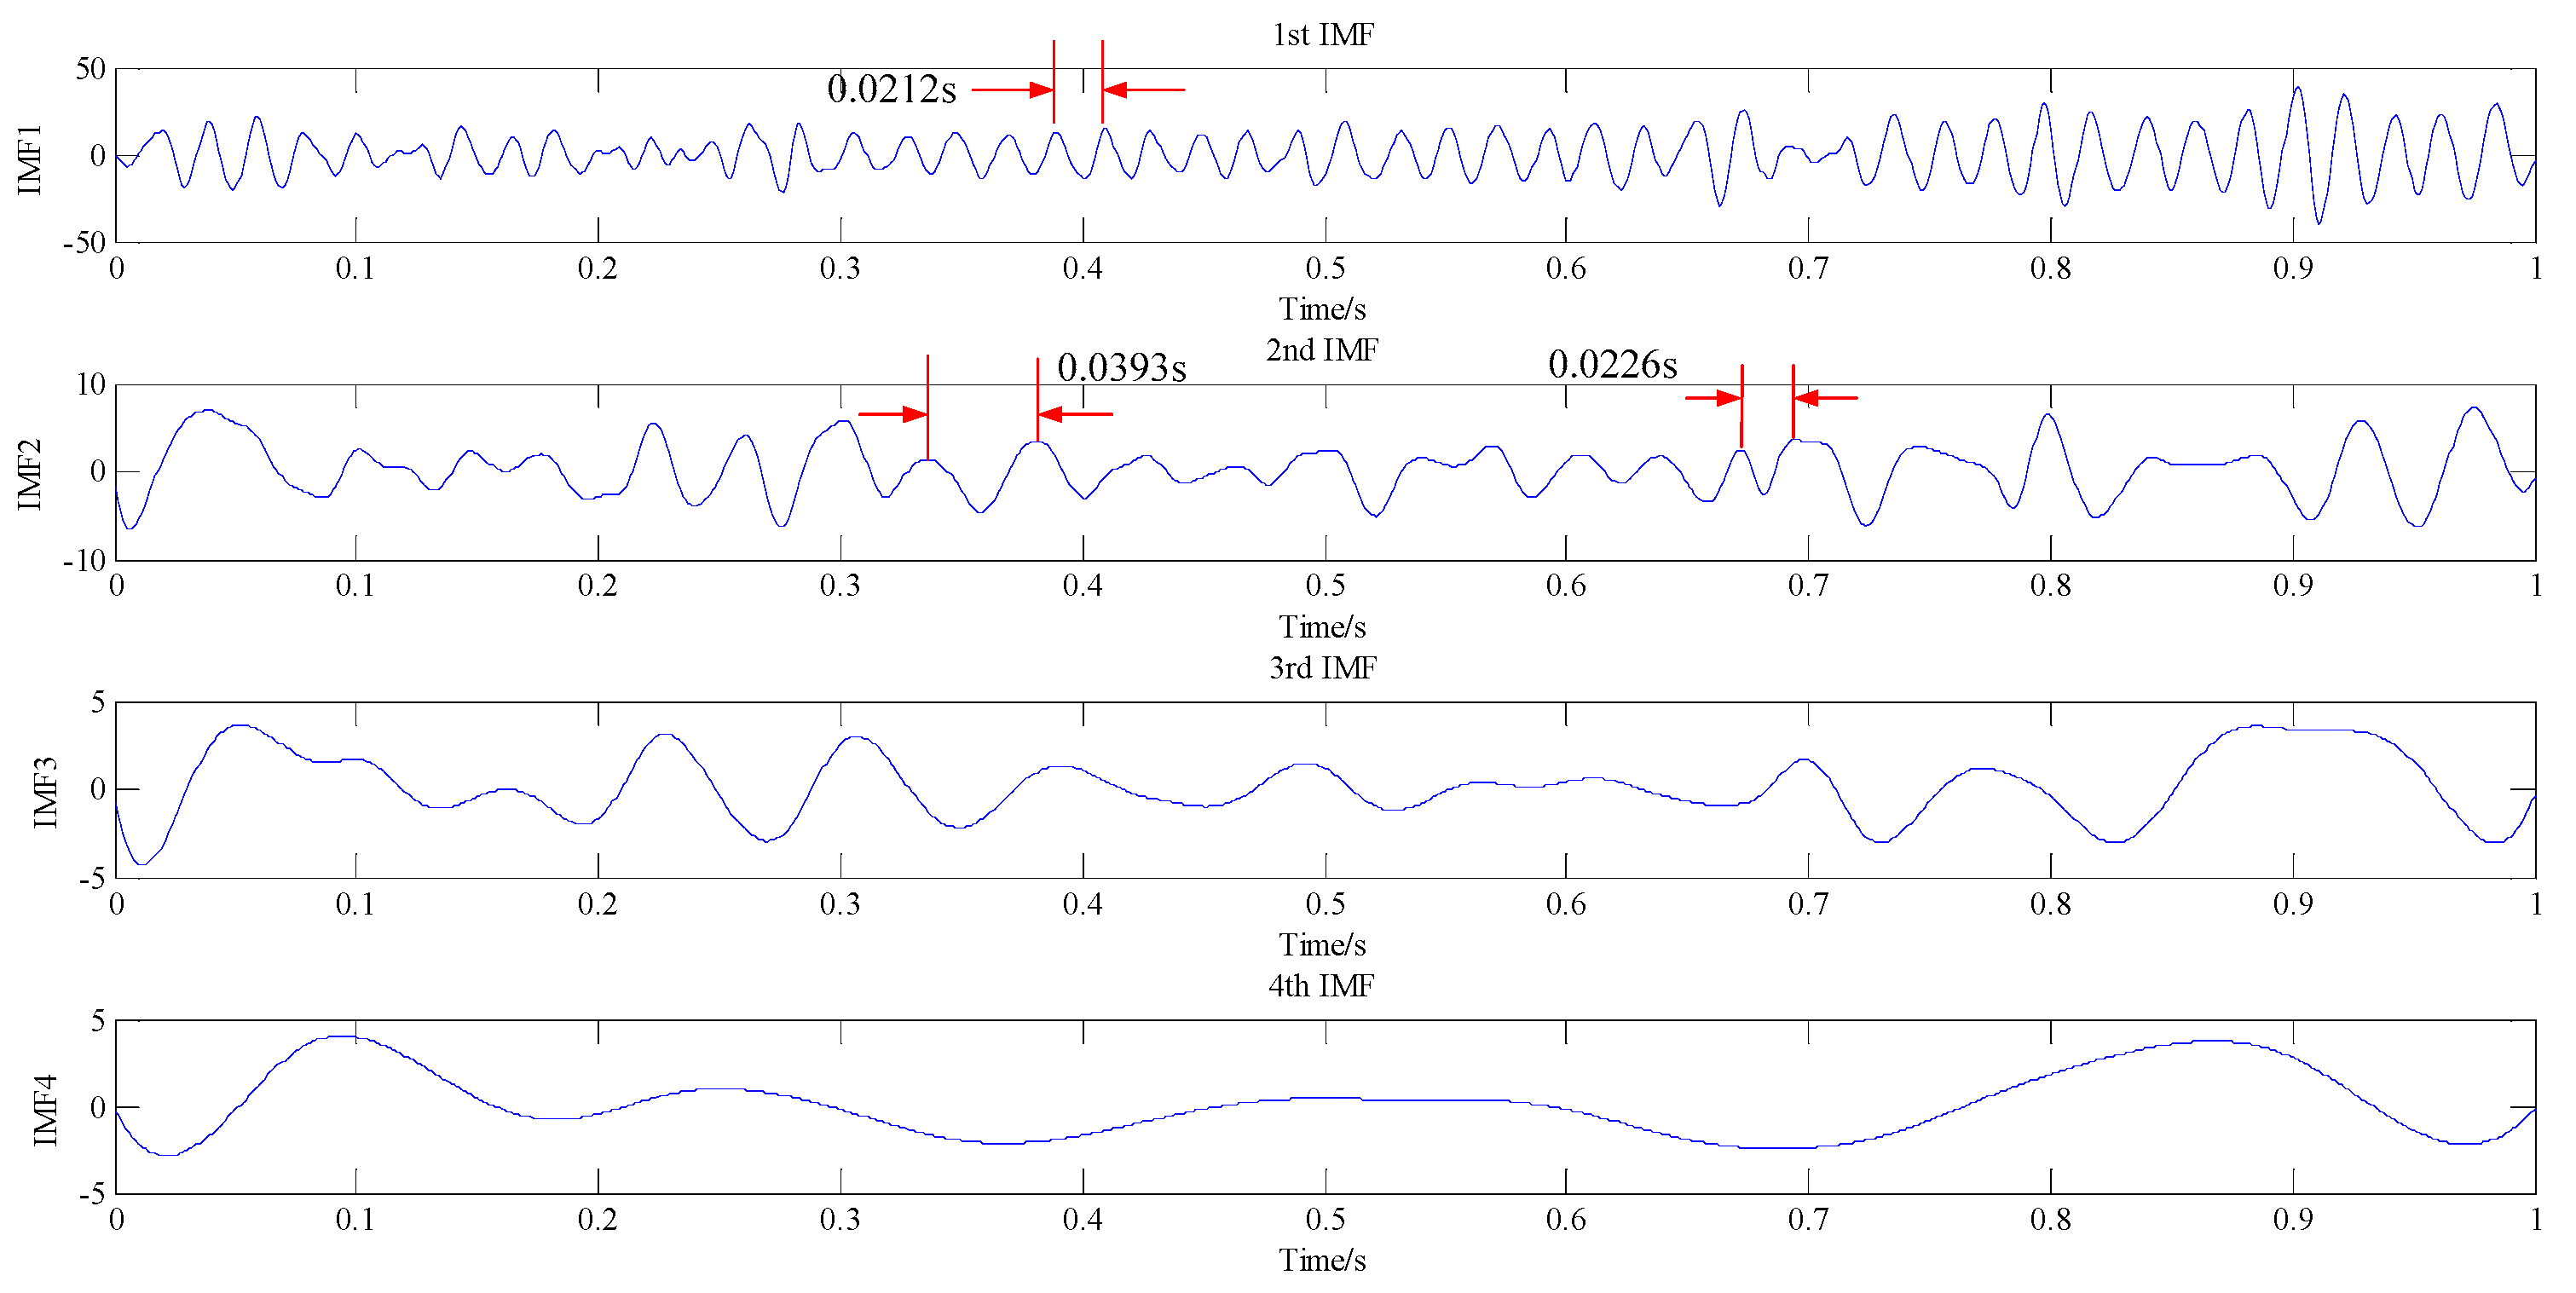
Figure 7, the corresponding frequency of the dominant components is
. It is worth noting that there exist other frequency components decomposed in the 2nd IMF. Moreover, the 2nd IMF is mostly dominated by two components with periods of approximately 0.0393 s and 0.0226 s, and the corresponding frequencies are 25.39 Hz and 44.18 Hz, respectively. It implies that the characteristic harmonic component using WPD includes some noisy signals. These noisy signals may have a bad influence on detecting the fault severity under low levels of DE. Therefore, the combined use of WPD and EMD has the advantages of improving the SNR and also overcomes the drawbacks of simply use of WPD. However, the mode mixing is one of the problems when applying the EMD algorithm, and it can be reflected by the 2nd IMF component shown in
Figure 7. Two parts of noisy frequencies appear simultaneously in the 2nd IMF. However, this problem has no effect on the filtering process. In this part, the 1st IMF component has been extracted in order to identify the fault severity.
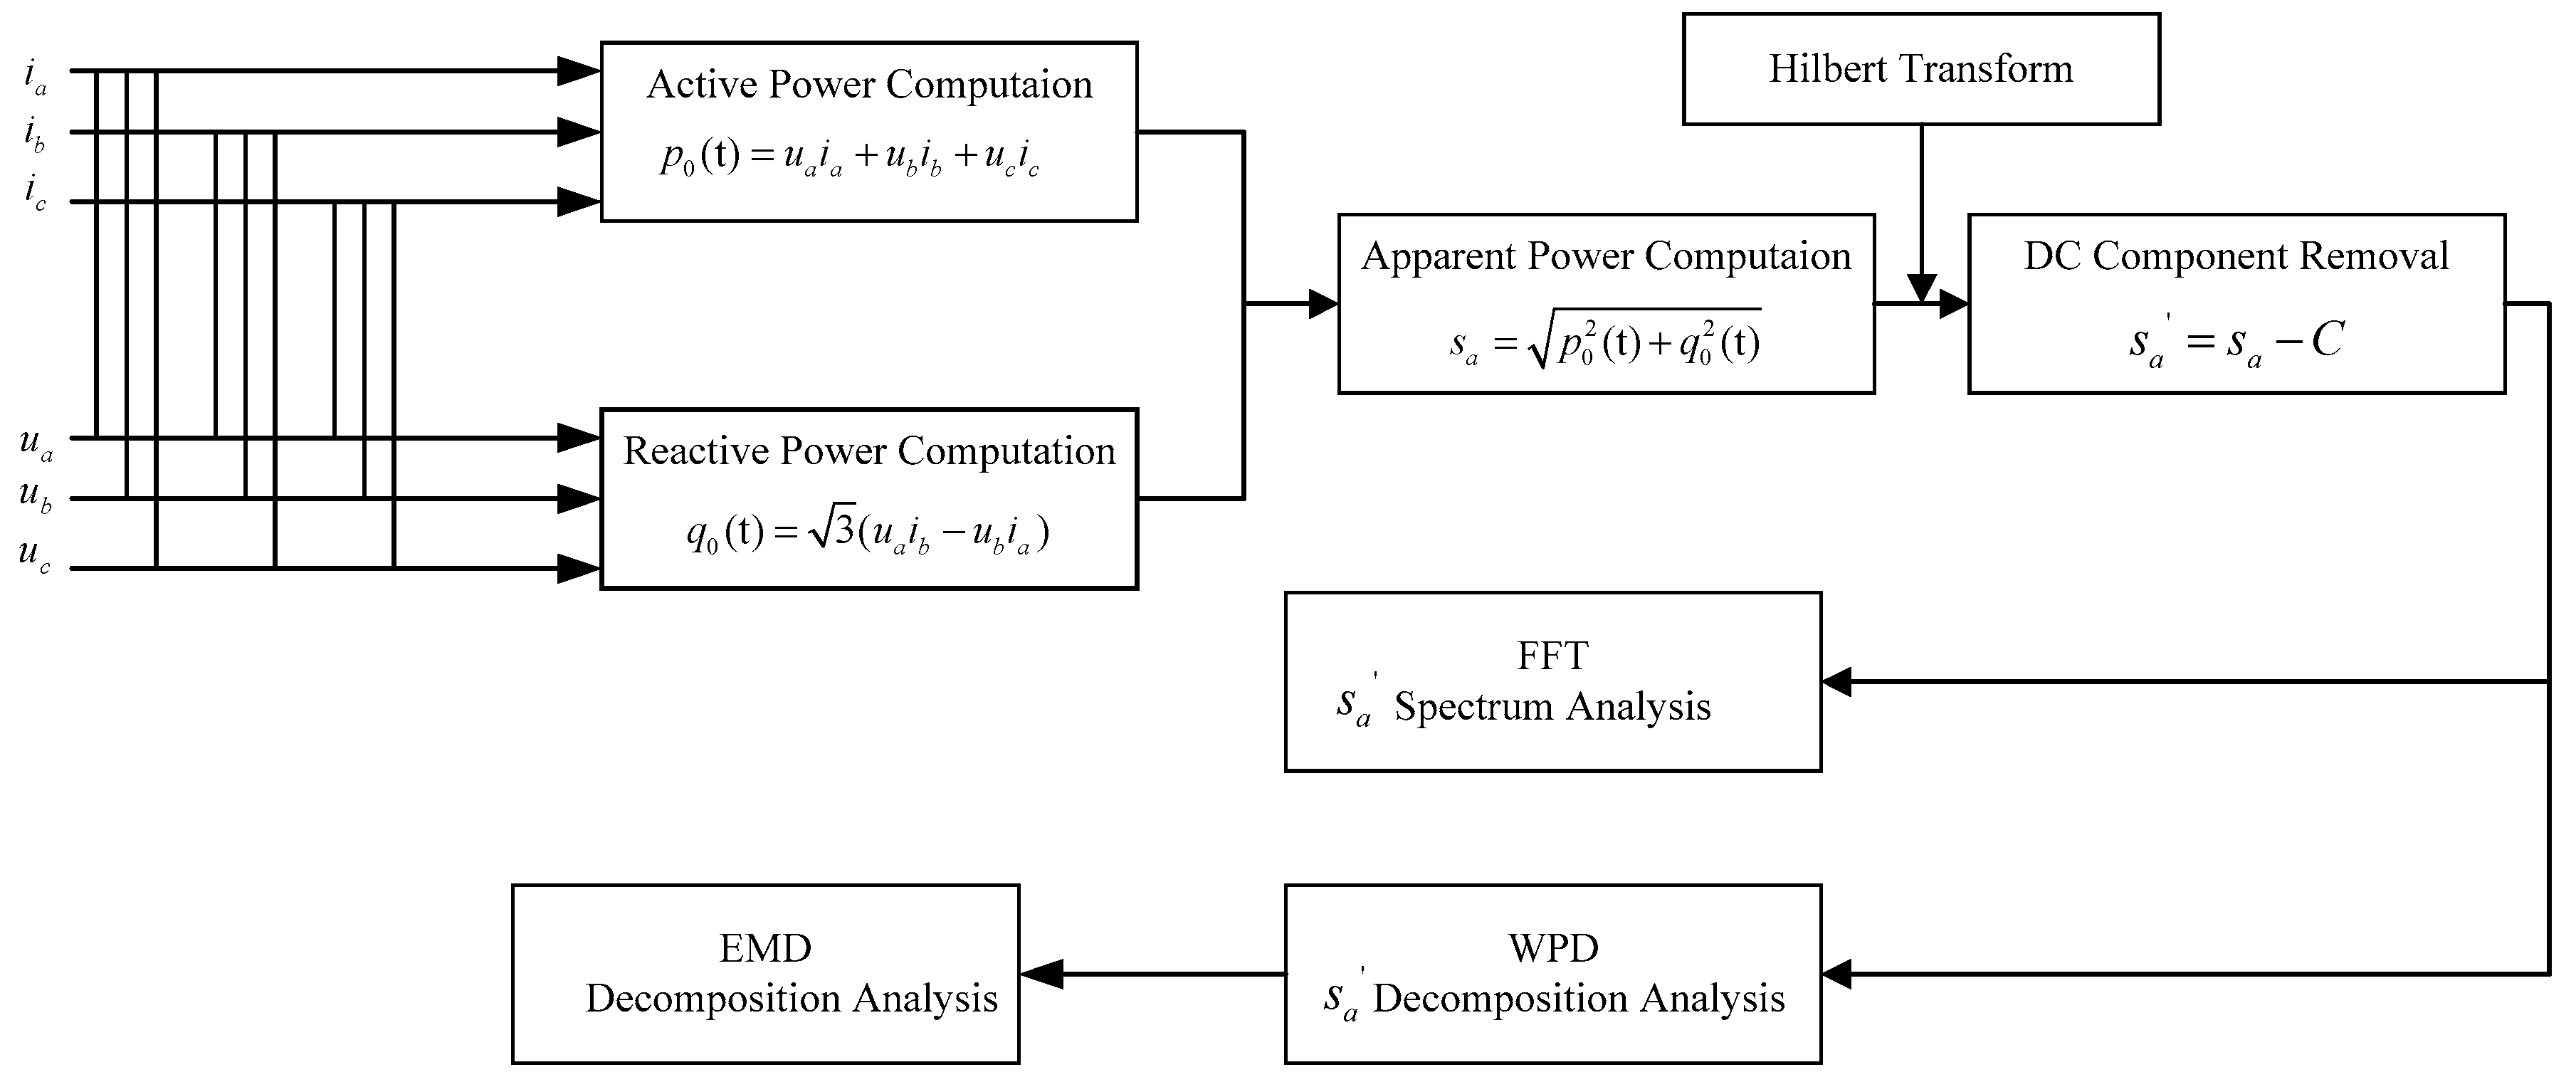
The computation of the apparent power analysis scheme is shown in
Figure 8. Firstly, the apparent power has been calculated after simulating the three-phase current signal and the corresponding voltage signal using FEM. Moreover, HT is used to eliminate the DC component. Secondly, in order to overcome the drawbacks under the simple usage of WPD, the combined use of WPD and EMD has been proposed to eliminate the noise component and extract the characteristic harmonic component related to DE fault. Finally, two factors including DE levels and rated loads are set to illustrate the relationship between the characteristic signal and factors.
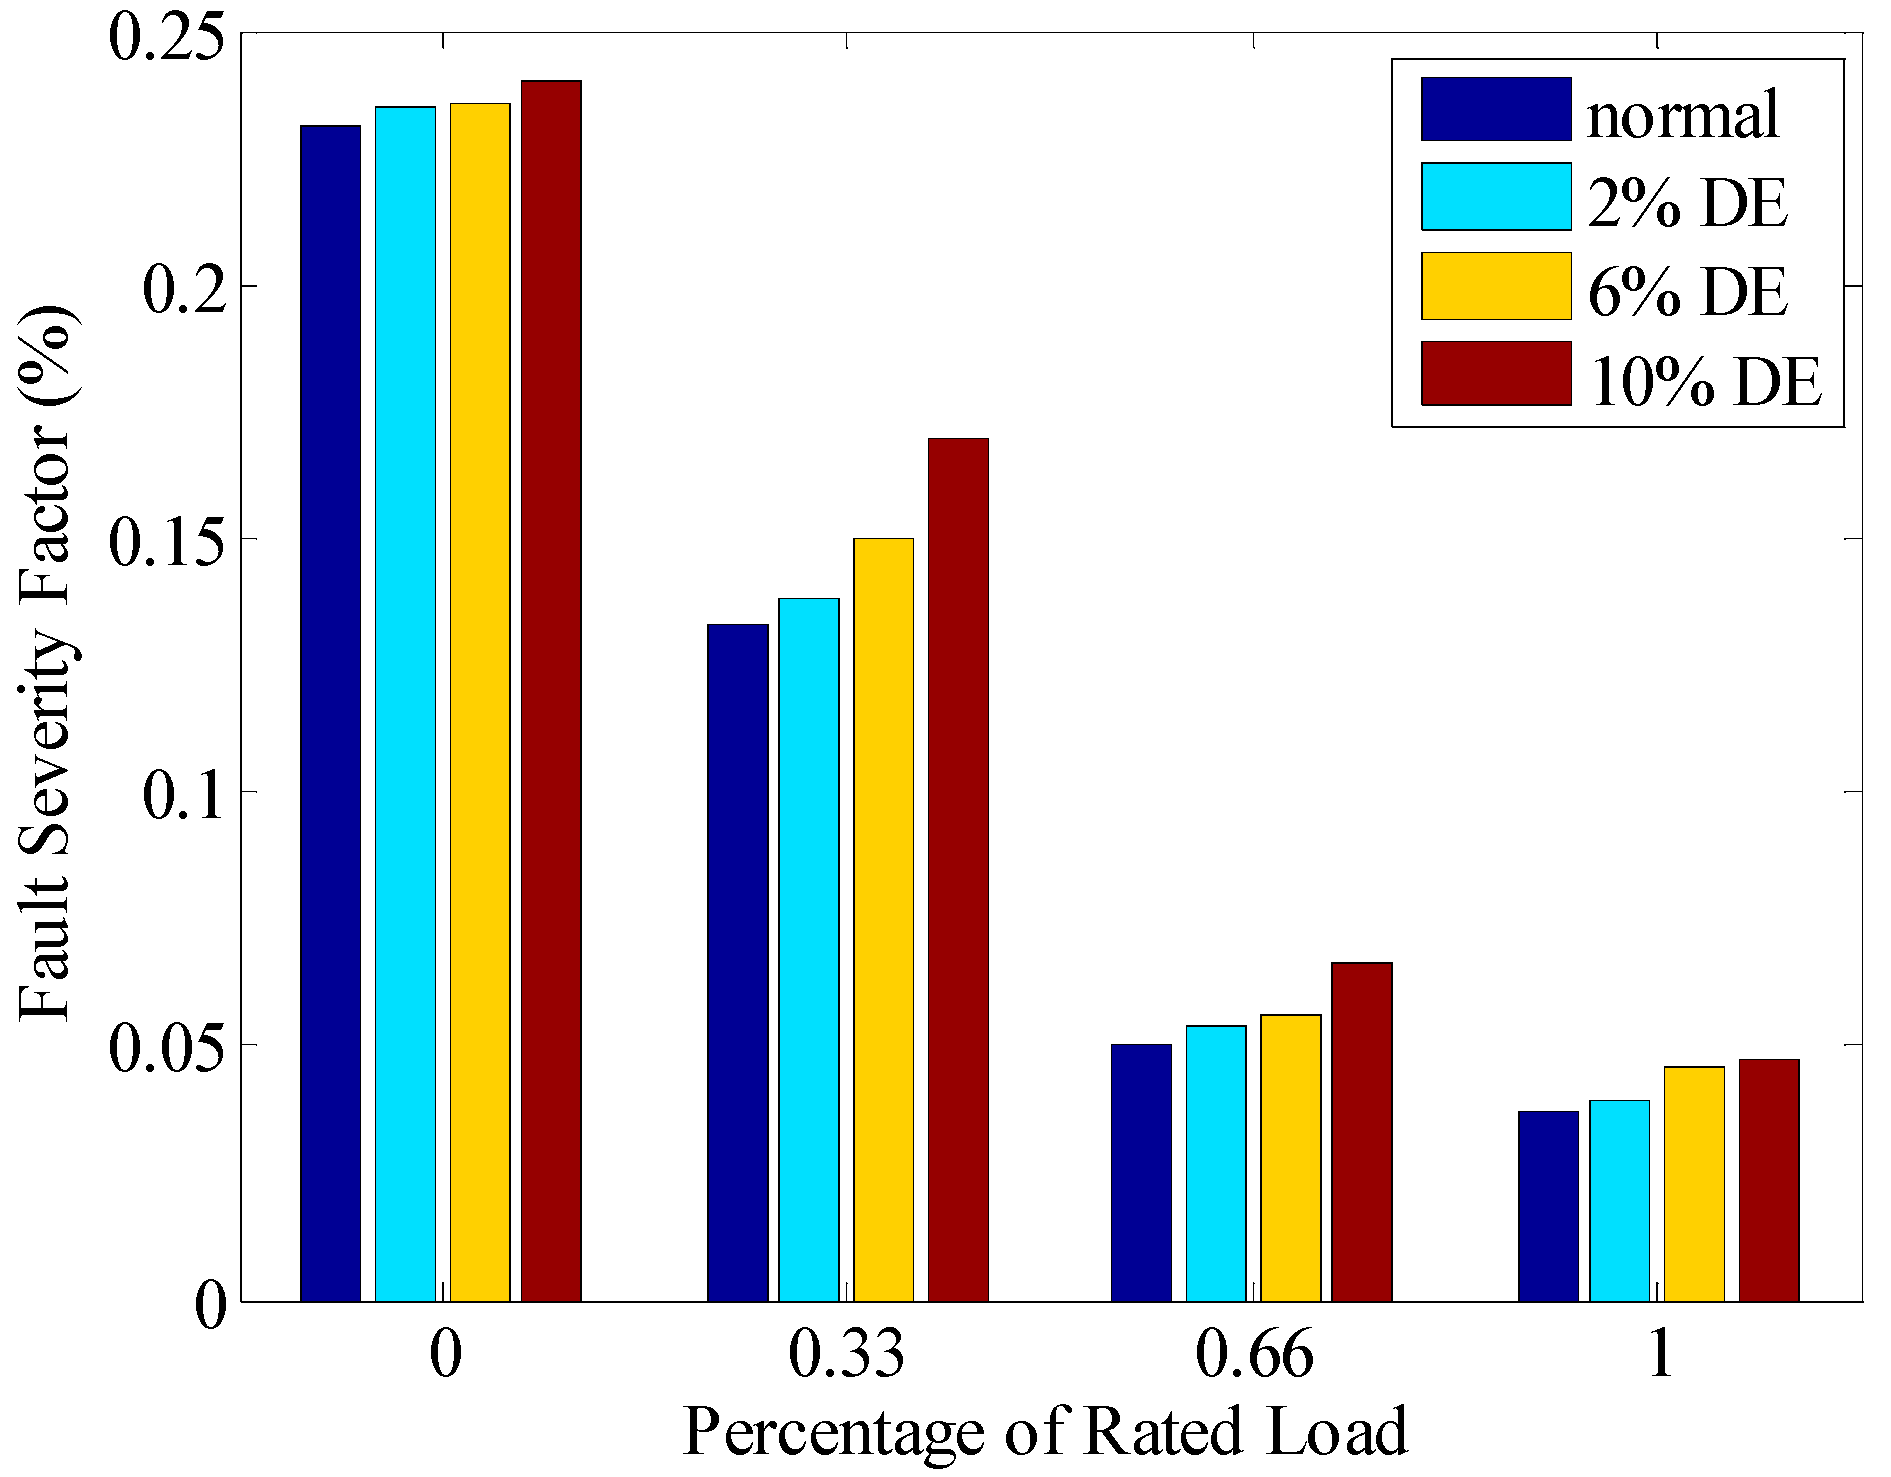
Different motor types will cause different calculating results. The amplitude of the characteristic component spectrum is affected by the motor type and loading condition. This is not an ideal indicator to evaluate the fault severity. Therefore, the fault severity factor (FSF) is proposed in order to evaluate the fault severity.
The energies of the characteristic time-domain signal can be calculated by Equation (17) [
7]:
where
is the length of the characteristic data and
is the characteristic time-domain signal series;
.
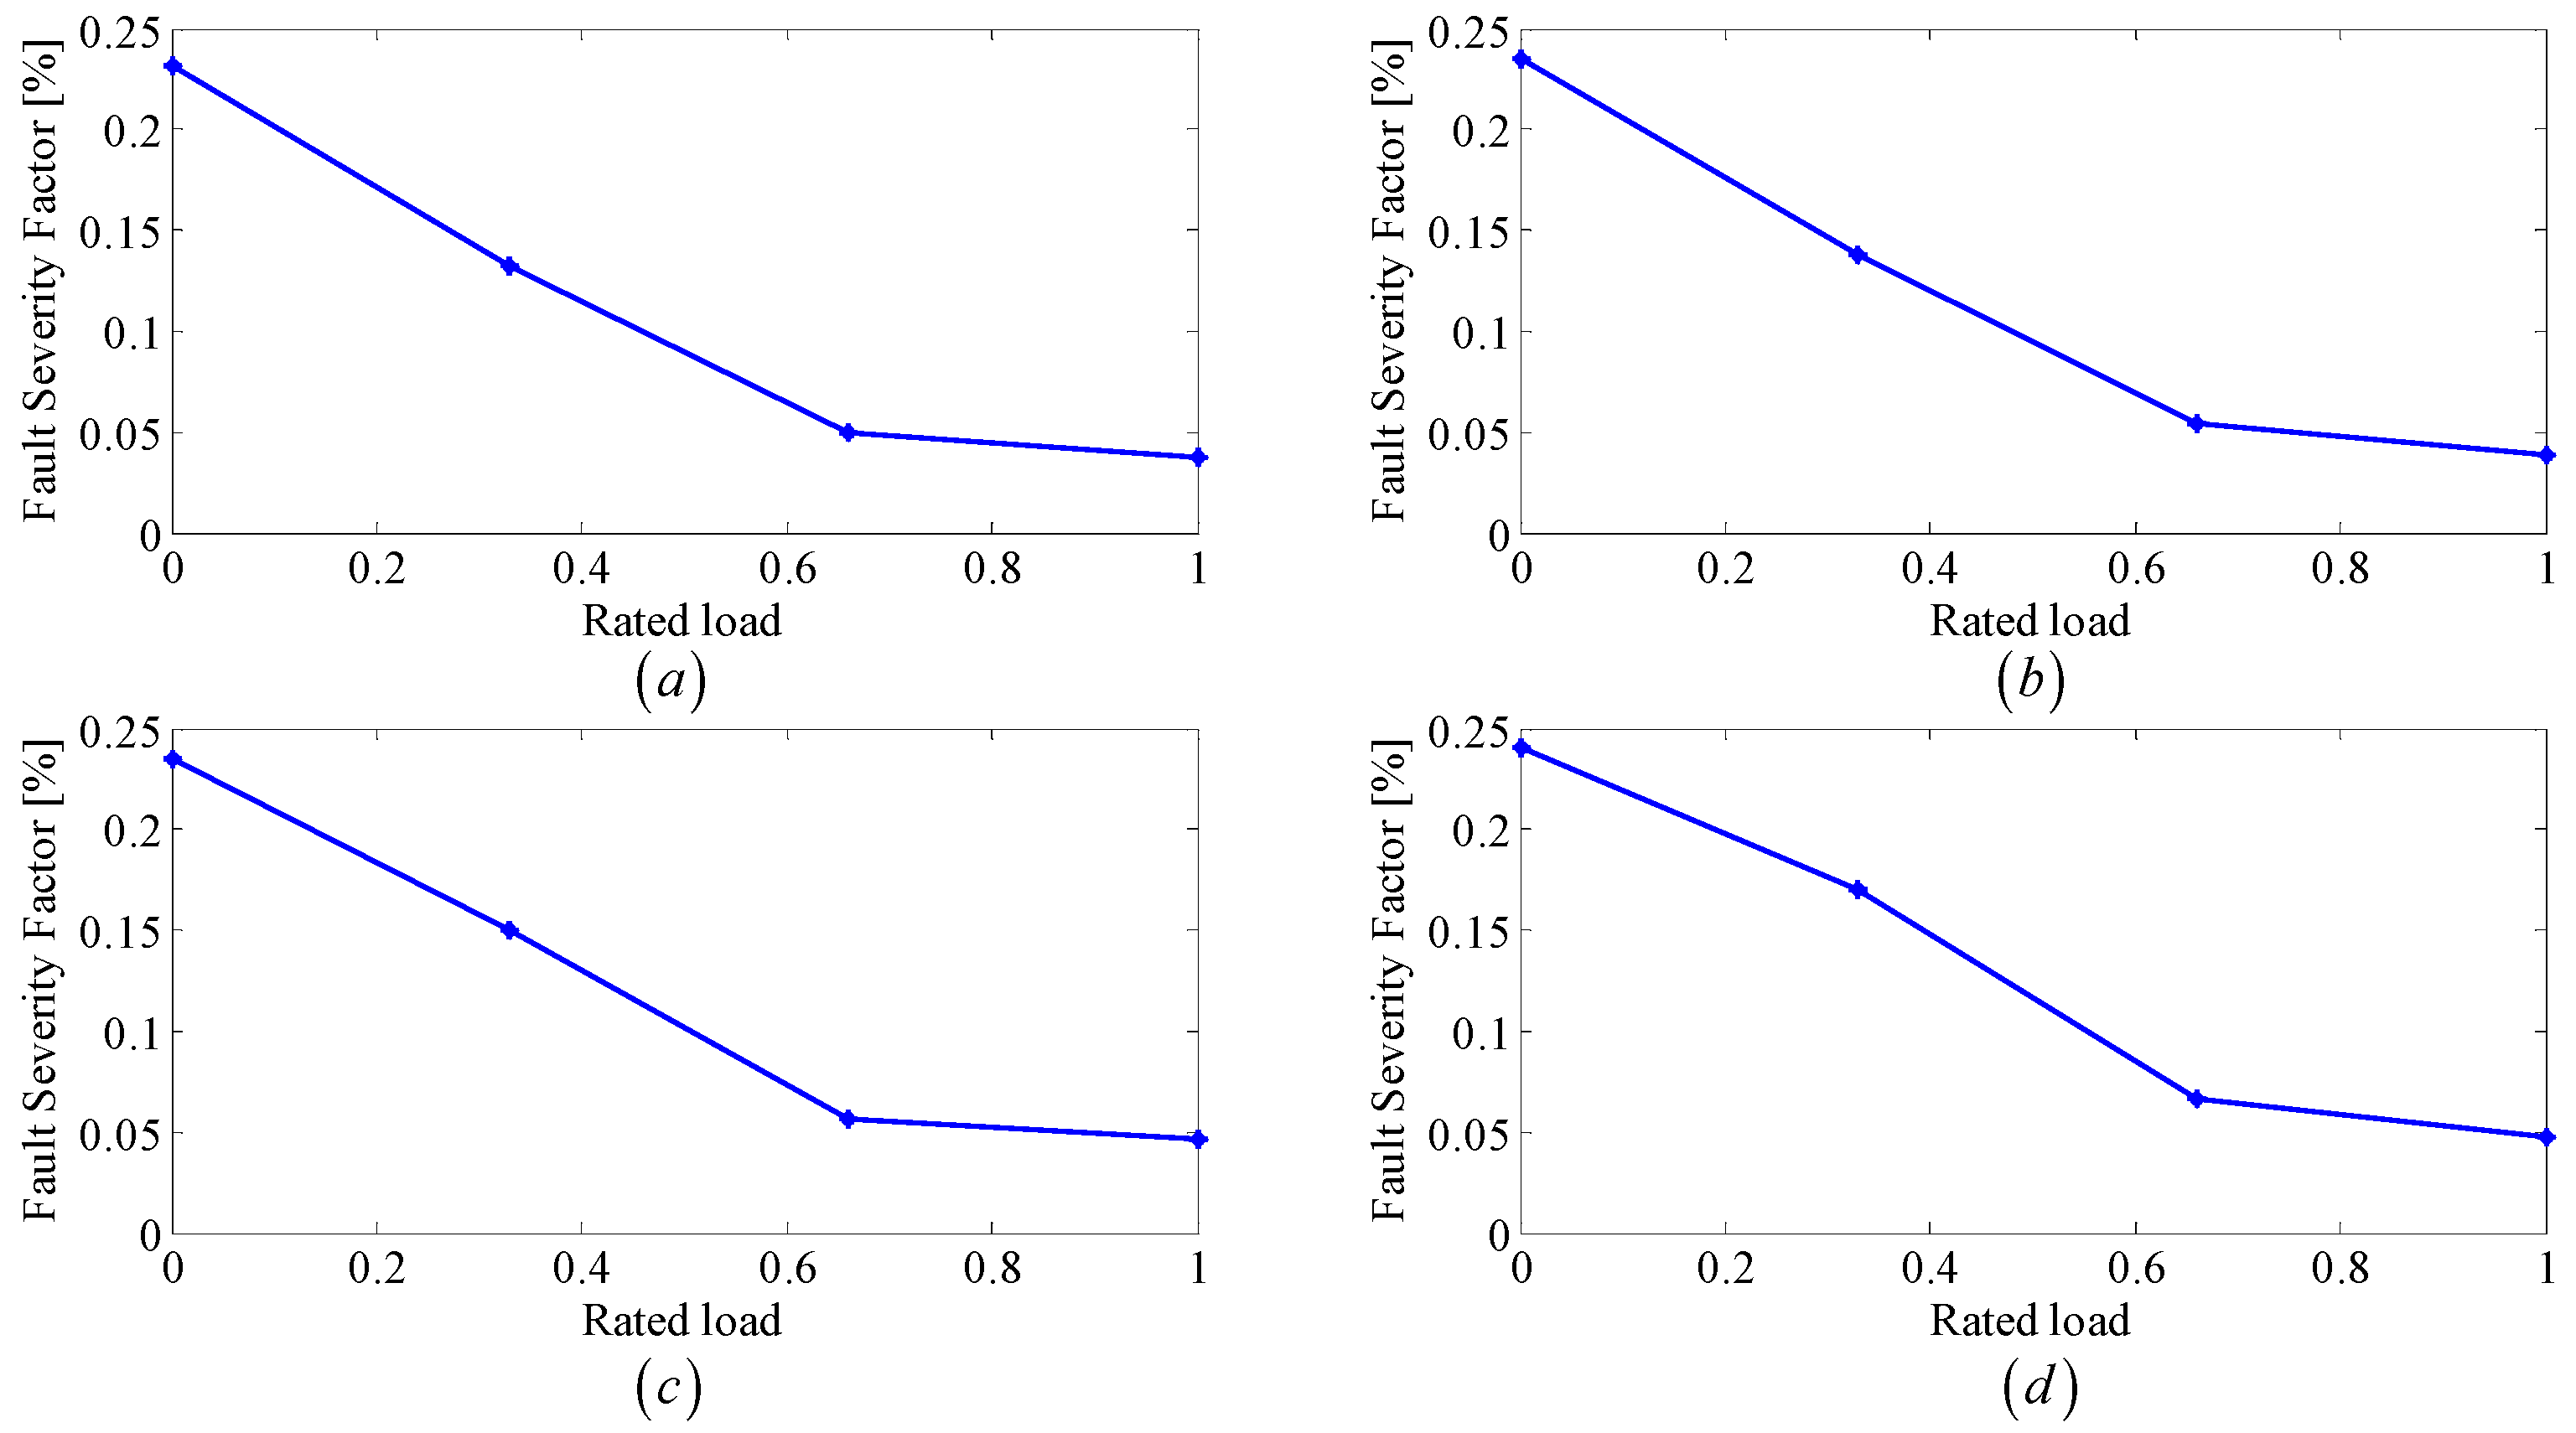
The FSF can be calculated by Equation (18):
where
is the length of the whole apparent power data and
is the time-domain signal sequence of apparent power. In fact, the FSF is the ratio among the energies of the characteristic time-domain signal and entire apparent power.
7. Conclusions
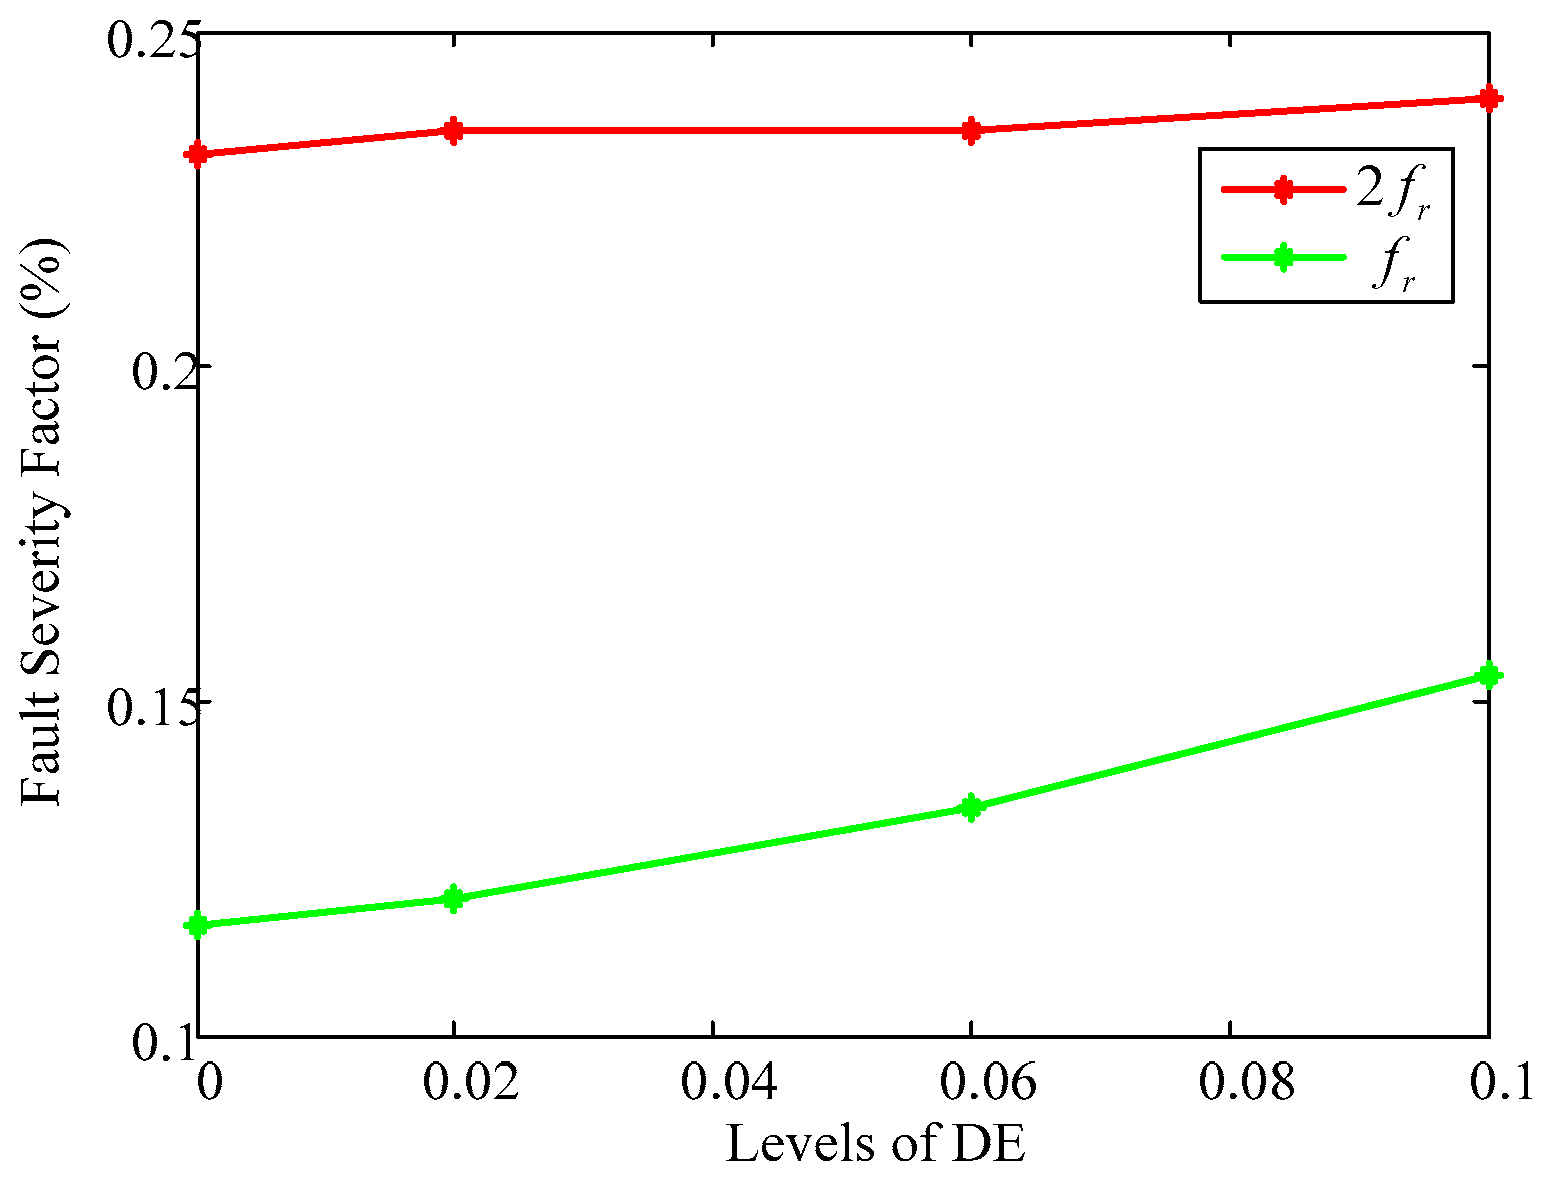
In this work, the purely DE is modeled and analyzed using FEM. The apparent power signal of three-phase squirrel cage induction motor is used to diagnose the fault. Due to the weak signal appearing around the harmonic frequency, the simple use of WPD may not give an accuracy result due to the drawbacks of this method. Therefore, after using the WPD algorithm, the EMD method has been applied to post-process the signal. A combined use of WPD and EMD to the apparent power signal has been presented in this paper. The simulation results show that the purely DE fault can be well diagnosed using the proposed method. It is shown that the FSF based on the harmonic component in the apparent power around can be considered as an index to detect the fault severity. However, under the influence of load, the use of the amplitude at a frequency around can give an ideal solution.
Theoretically, the obtained results are achieved to detect the low levels of purely DE. In practice, the indicator is influenced by noise and the measurement accuracy. Therefore, it is essential to conduct the experiment to verify the FEM simulation results in the future study.
As for the high-precision rotation system, for example, motorized spindle, even with low levels of DE, can lead to the undesired radial error motion. This can lead to the decrease of machining accuracy for the computer numerical control (CNC) machine tools. Therefore, the diagnosis of low-level eccentricity can help to identify the radial error motion caused by the motor. The simulation result has verified the relationship between the low-level eccentricity and the corresponding apparent power signal. In the next step, our group will conduct the experiment on the motorized spindle. Finally, the relationship modeling between the eccentricity fault of the motorized spindle and radial error motion will be studied.

