Developing Automatic Form and Design System Using Integrated Grey Relational Analysis and Affective Engineering

1
Department of Visual Communication Design, National Yunlin University of Science and Technology, Douliu, Yunlin 64002, Taiwan
2
Department of Industrial Engineering and Management, National Chiao Tung University, Hsinchu 30010, Taiwan
*
Author to whom correspondence should be addressed.
Appl. Sci. 2018, 8(1), 91; https://doi.org/10.3390/app8010091
Submission received: 15 November 2017
/
Revised: 28 December 2017
/
Accepted: 4 January 2018
/
Published: 10 January 2018
(This article belongs to the Special Issue Selected Papers from IEEE ICICE 2017)
Abstract
:In the modern highly competitive marketplace and global market environment, product quality improvements that abridge development time and reduce the production costs are effective methods for promoting the business competitiveness of a product in shorter lifecycles. Since the design process is the best time to control such parameters, systematically designing the processes to develop a product that more closely fits the demand requirements for the market is a key factor for developing a successful product. In this paper, a combined affective engineering method and grey relational analysis are used to develop a product design process. First, design image scale technology is used to acquire the best the design criteria factors, and then affective engineering methods are used to set the relationships between customer needs and production factors. Finally, grey relational analysis is used to select the optimal design strategy. Using this systematic design method, a higher quality product can be expanded upon in a shorter lead-time for improving business competition.
1. Introduction
The emergence of the third world economic force that has entered into markets with low-cost production and vicious bidding has led to rapid competition in commercial markets and increasingly radical changes in market demands, while both the profits of enterprises and the marketing period for selling goods are reduced. The problems are reflected in the development process and the control of production and manufacturing costs. The increasingly competitive market has led to many enterprises finding that their production and manufacturing, marketing, and market research have reached the same level as their competitors, and that the only remaining competitive weapons are design innovations and the enhancement of design quality. For design innovation, enterprises conduct market research from the angle of concurrent design and take the spirit of total quality management (TQM) as the basic idea of product design and development, where design is not just a single ring in the policy decision process in enterprises, but also an overall consideration for evaluating the demand for commodities from the perspective of consumers where ideas of function of innovation and design quality can penetrate throughout the decision-making process in product development. However, looking around the current development process in enterprises that operate under antiquated ideas, the idea of product design is often completely decided by the decision-makers of enterprises, and there is a lack of systematic market research and trial processes before new products are designed. Furthermore, when designing a new product, they again neglect analyzing the psychological demands of consumers and the attribution factors of product function in a systematic design process where their failure rates for developed products are very high. Therefore, how to respond quickly to the demands of markets, develop diversified products that satisfy different groups of customers, and design a blue ocean strategy that leads an enterprise in new development direction are issues that are worth serious exploration.
In the process of product development, the design department needs to learn about all of a product’s design factors, including the key design factors of shape, texture, and color. Among these, the application of texture usually focuses on the consideration of the physical characteristics of materials and places less emphasis on the practical development and research of the subject of modeling image and the structural characteristics of manufacturing. Product design needs to both meet product functionality demands and to pay more attention to the effect value that is created by products that give consumers functional and psychological expectations [1]. For example, Apple Inc. smartphones often develop smartphones made of different materials and colors for different user groups based on a single product to expand the consumer groups to different ages and extend the product’s lifecycle [2]. The contents of the cases mentioned above could explain that in the development of products, enterprises could achieve their goals of developing high-texture products that consumers will perceive positively through the different definitions of design attributes. In the past development of product types, the adopted factors of design images typically focus on shape and colors, and rarely on the application of quality perception, molding-related development, and manufacturing methods; they lack any exploration of the correlation between texture and products.
This paper conducts a practical development of the effect of texture words on the forms and images against which the characteristics of product texture are set as the main analytical factor to consider consumers’ reflection degree in their psychological sensibility when they choose products. The research also explores the correlations of matching degrees between product type, texture, and image for design and development, and takes them as research and design ideas. The study uses the products of cup design as the sample to analyze design and development to thus conduct qualitative and quantitative analyses of the effect of product form and texture vocabulary on product image, and uses a fuzzy sensibility assessment pattern to establish research data.
On the exploration of the relationship of mutual effects between the two qualitative variables of texture and form words, it integrates Affective engineering concepts and uses grey system theory to establish model relationships between factors as rules and the basis of a systematic and quantitative theory for product development. In the final stage, we develop a rule for the evaluation of product development processes, product system analyses, and the computer interface for procedures. Companies’ decision-makers and design and development departments could use this computer interface to design consultation functions that will effectively shorten times and reduce costs for developing new products for management and designers.
2. Methodology
The continuous development of business management and design development technology means that both have been widely applied and promoted in business and product development practices. However, the increasing complexity of business message handling systems mean that people have better knowledge about the uncertainty of various systems and researchers can more deeply explore uncertainty systems. Various theories and methods of solutions to the uncertainty of system science and system engineering were introduced in the second half of the 20th century. For example, system theory, information theory, and control theory emerged in the late 1940s, discrete structure theory, catastrophe theory, and fractal theory in the later 1960s and early 1970s, and super cycle theory, dynamical systems theory, and the pan-system theory in the late 1970s that were horizontal, cross-cutting system science. In the 1960s, Zadeh established fuzzy set theory that obtained good results after being combined with artificial neural networks theory in commercial uses [3]. In 1980s, Pawlak created rough sets theory and Deng Ju-long established grey system theory (GST), which are both important results of system science in uncertainty research [4,5]. These theories handle different uncertain information from different angles and different aspects of discourse and explain the applications of systematic quantification, grouping, and modularization to various uncertain issues in business development activities.
In this study it is hoped to establish a transformation model for translating customer needs into optimal combination suggestions of applicable alternatives. Establishing this model requires constructing the relationship between customer needs and product features. Optimal alternative searching is performed by means of grey system theory and Affective engineering, based on the consumer’s subjective needs. This model’s proposed algorithm is then used to construct an internet-aided product customization consultation system. The procedure for establishing this system is described below.
- Establishment of market design demands.
- Establishment of product features and associated components.
- Construction of image configuration.
- Evaluation of consumer requirement features.
- Establishment of design features and their relationship to customer needs.
- Use of statistical methods to analyze product semantic features.
- Affective engineering method setting for feature requirements.
- Calculation of feature requirements.
- Grey system design analysis to establish the design feature degree of associations.
- Establishment of optimized searching for feasible combinations of computer programming applications.
2.1. Affective Engineering Application
In the product design management, meeting demands from markets and developing products that meet consumers’ psychological expectations are factors in the successful introduction of products into commercial markets. Therefore, how consumers’ fuzzy psychological demands can be transformed into the design and development conditions is an important subject in business management science. From the definition of consumers’ demands to the establishment of the quantification of design targets, Affective engineering (AE) is one of the most systematic theories that introduces the quantification of the values of customers’ psychological and sensible demands. Affective engineering (AE) is a consumer-oriented design ideals-based new product development technology that was introduced by Japanese scholar Mituo Nagamachi in the 1970s [6]. Nagamachi explained that AE refers to the vocabulary of Japanese sensibility. The original meaning of AE is the psychological feeling and image that a product brings to people as a whole. When a consumer buys a product, he will have complex feelings in facing the product forms, such as personal, strong, luxurious, and gorgeous. The feelings also include the overall feeling of design, texture, size, color, function, operation, and price that will affect customer’s preference degree and consumption intention when choosing products. AE is a technology that transforms the feeling and image of consumer demands into a new product. Nagamachi defined AE as a technology that transforms customers’ feelings or images of a product into design factors. The purpose of AE is to design a strategy for developing new products according to consumers’ needs. It depends on following four key points as the principles of the design and development of products that are entering markets.
- Grasp how consumers feel about a product through ergonomic and psychological estimation.
- Determine the product design characteristics through consumers’ sensibility.
- Establish a technological methodology based on the human sensibility degree.
- Modify the product design directions with social changes and consumer preference trends.
Generally, AE faces a consumption phenomenon, in which prior to consumption, consumers will have motivation, form expectations, and feelings about the digital and transform vocabulary of feeling and form images into the factors of design. There are three AE method models, Model 1 is stratified scope classification, Model 2 uses computer systems, and Model 3 applies mathematical modeling to establish design conditions, and scope. The following are descriptions of the three models:
2.1.1. Model 1: Stratified Scope Classification
Such scope classification means that while designing new digital factors, the basic components of digital are decomposed into concepts of stratum and these concepts are broken down by the digital sensibility degrees into a tree structure to obtain the details of the design. Starting from Stratum-0, it gradually breaks down into clear and meaningful sub-concepts like Stratum-1, Stratum-2…, Stratum-N, until we obtain a description of the detailed design. Horiguchi and Suetomi argued that the purpose of the development of AE is to meet consumers’ demand through sensible psychology [7]; sensibility analysis law could clarify consumer’s fuzzy demands. Horiguchi applied AE to vehicle development. We could see the applications of AE from the development of the new car “Miyata” by Mazda Motor Corporation. From the start point of the design and the Miyata’s development, Stratum-0 was decomposed into four sub-concepts: sense of intimacy, sense of control, sense of speed, and sense of communication. The sense of intimacy refers to the close collocation with the car body and the proper size of internal space; the research and design team set an appropriate length for the car with this sub-concept in mind. If the team cannot obtain the details about the design, they will use this method to break it down until they obtain detailed quantitative, grouping, and modularized details for the design. Taking the development of a new sports car for female singles, as an example, as Figure 1 shows, the design’s initial concept begins from Stratum-0 in the classification of AE (Figure 1). In the next stage, we want to discuss the factors that constitute a female single. These may be sub-concepts, such as small, exquisite, dignified, and noble, which are the first stratum in the classification. The sub-concepts will continue being decomposed into many items.
2.1.2. Model 2: The Computer System of Affective Engineering
Model 2 of AE adopts computer information handling technology that only needs to input Affective-words into the system to obtain an output of design results. Affective engineering systems are similar to the database of the expert system, an artificial neural network, and are computerized systems that transform consumer feeling images from expert systems into design factors.
2.1.3. Model 3: Constructed Mathematical Model
The purpose of establishing a mathematical model is to understand human factor quantitative results through Affective-words. Such mathematical models only represent a conceptual logic that provides design systems with reference values when analyzing policy decisions.
2.2. Grey System Theory
Grey system theory (GST) was introduced by Deng Ju-long in 1982 (Zhu and Deng, 1986) [8]. It is a systematic analysis of grey correlation for the uncertainty of systematic model and the incompleteness of information. On model construction, it uses some forecasting and policy decision methods to explore and understand system. The reason why GST is widely used is that it can effectively handle the information about the uncertainty of the things, multivariate input, discrete data, and the incompleteness of data.
In GST, the concept of grey box is used to describe the characteristics of message in practical environment. In any grey event, the completeness of message could be expressed by the degree of grey. The system that fully knows the message is expressed by white color, completely not know is expressed by black color, and part know and part not know expressed by grey summarily. The darker the color is, the more incomplete the message will be. The grey system could become white or black step by step by the supplement or reduction of message. The entire grey system is a system that could change with the temporal dynamics.
GST simulation is different from the description by past traditional theories. It makes indepth understanding not through the variables of system, but considers the system as a dynamic system and believes that the output of system is the results of synthetic performance of all messages in the system. The contents of message include “explicit” or “implicit”, “known”, or “unknown” messages. That is, GST believes that the output values of the system must include some degree of system message. Through the accumulative operation, regressive operation, mean value operation, and generating operation of output values, the random error of output values could be reduced. Thus, we could find out the internal regularity of system and achieve the goal of simulation and forecast and further to establish the correlation of system and install grey system model. The characteristics of GST is not directly operating the original series, but conducting modeling forecast of generating space that is formed after generating operation before restore to original series to reach the new technology field of modern system engineering science and achieve the goal of forecast and the establishment of model (Zhu and Deng, 2001; Chang and Lin, 1999) [9,10]. The main difference between grey relational analysis (GRA) and traditional mathematics is the summary framework offered by grey relational analysis for analyzing sequential relations or system behaviors. With the framework, even the volume of message for analyses is small, you can conduct grey relational analysis [2,11]. The implementation procedures of grey relational analysis are as follows:
- Establish reference sequence in the system and assume X as a sequential set,Then . Generate a comparative sequence as follows: .Then . From this, we could consider the reference sequence as follows:
- Transform sequential data and make its value between 0 and 1,the expectation items include nominal the best, larger the better, and smaller the better.
- (1)
- When larger the better, xi(j) is transformed into (j), the formula is as follows:
- (2)
- When Nominal the best, when the target value is xob(j) and , then its formula is as follows:
- (3)
- When smaller the better, its formula is as follows:When implement computation, the sequential data also needs standardization. Use Equation (2) to Equation (4) as the standardized transformation, in which x0(j) replaces the original xj(j).
- (4)
- Implement the computation of grey relational coefficient, the computational formula is as follows:
- (5)
- The degree of grey relation is expressed as , its computational formula is as follows:Among which , then and .
- (6)
- Compute the degree of grey relation and consider the computation of weight Wi. If the weight value is different, the overall decision making of design will be measured on the basis of the degree of grey relation and establish data distance space. It could also be expressed as , the computational formula is as follows:
3. Experimental
This technical report integrates AE and GRA to construct a systematic product design process to develop products that meet the requirements of consumers’ expectations. In the research, we first adopted Design Image Scale Analysis (DISA) to determine the optimal design parameters before establishing the relationship between consumers’ psychological demands and design parameters, and further developed design ideas. In the final step, we used grey relational analysis to determine solutions for the optimal design strategy.
In the study, the cup design set was assumed as the designed product to explore the relationship between forms, texture, and the product image of a coffee cup. Users’ product demands were significantly affected by related factors. We obtained the significance factor by first conducting an analysis of two parameters that would have the most direct and largest effect on consumers’ mental image of products: form and texture. In the practical design, we adopted various forms of static product model samples, and we adopted practical samples that were coupled with different primary materials through various image-words, used fuzzy evaluation methods to conduct questionnaire surveys, and obtained images of surveyed product textures and forms.
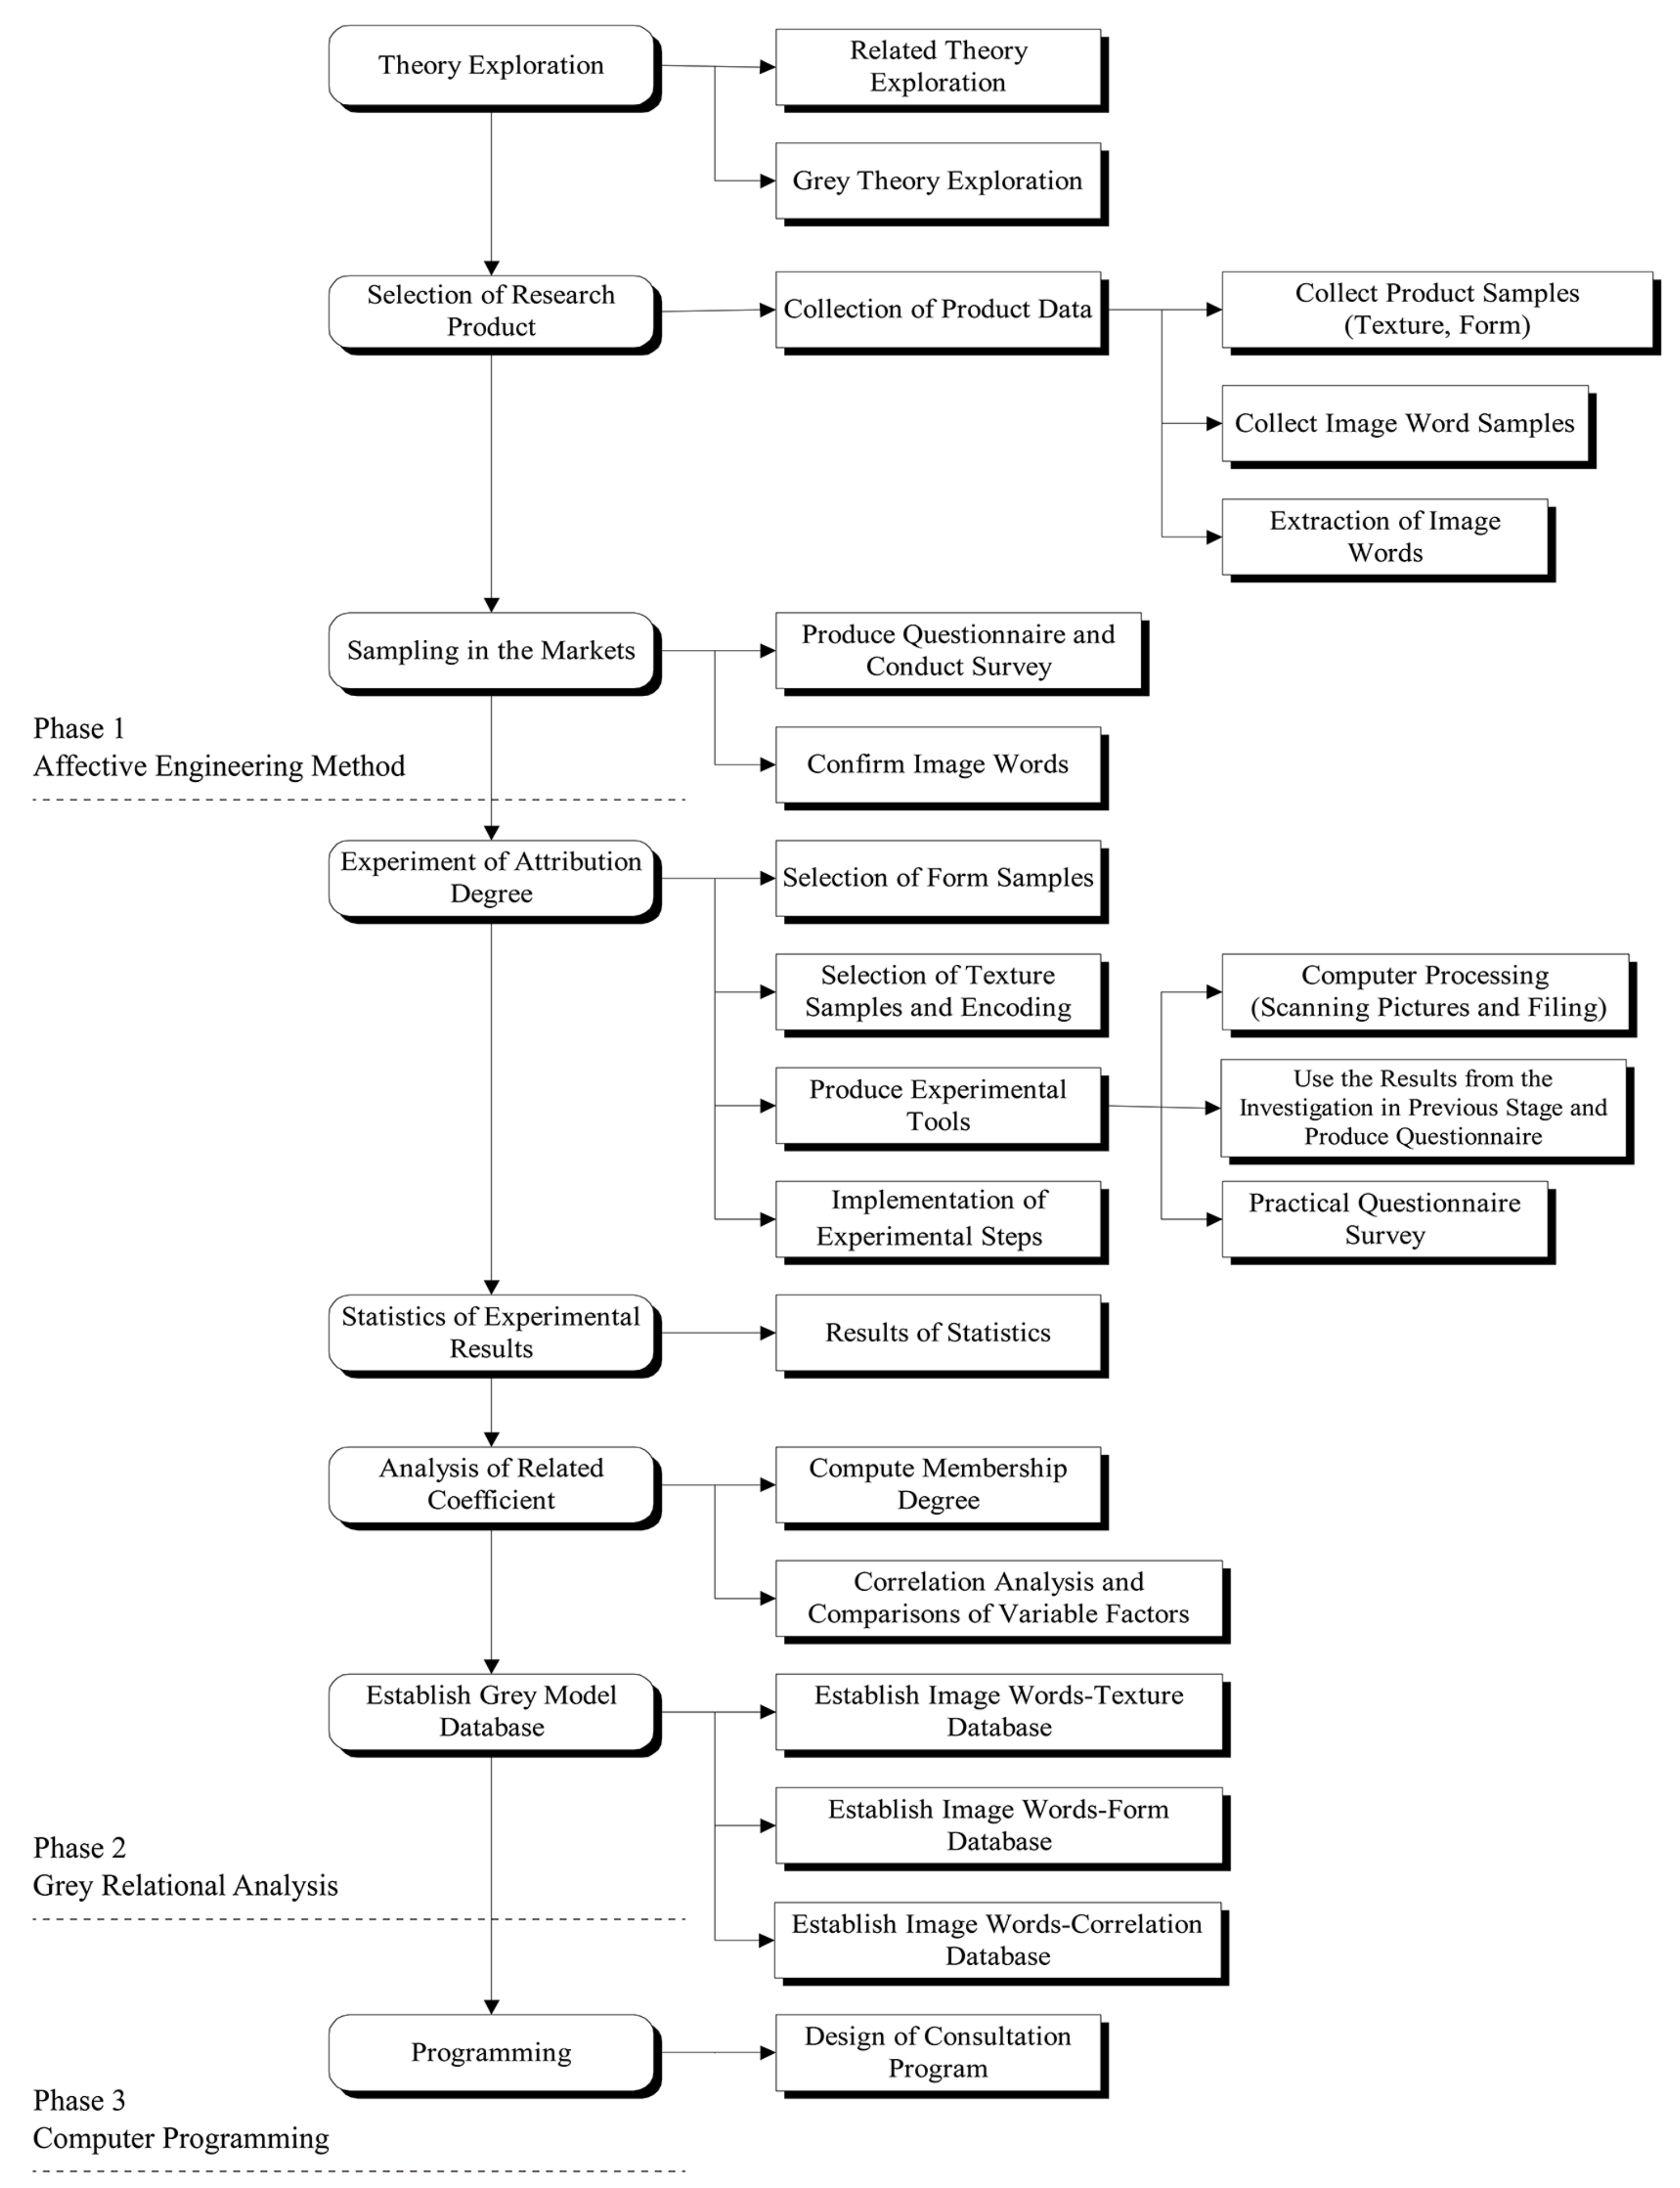
3.1. The Implementation Method of Affective Engineering
The study uses the concept of AE to obtain consumers’ overall descriptions of a set of coffee cups, including research on digital words, digital texture, and digital forms, and exploring whether there are any conflicting relationships between forms, textures, and images of experimental digitals. We obtained significant factors by first analyzing the two main parameters of the consumers’ mental image of digital feeling. The results will be applied in the digital development decision-making process. In the contents of Figure 2, we conducted phase analysis by AE before design and development. Investigation in the first phase confirmed image-words, and investigation in the second phase was a final questionnaire survey and reorganization. Through the Affective engineering method, the product design semantics were transformed from qualitative adjectives to quantitative semantic studies (Figure 2). The details of the implementation are as follows:
- Extract from Affective engineering-stratum to investigate and select product-related texture words and analyze and implement coding.
- Confirm consumers’ feeling degree of images on texture and product forms and establish a feedback database accordingly.
- Confirm the quantitative weighted relationship and establish grey system analysis data.
- Establish the experiment’s quantitative results.
- Examine the quantitative weighted relationship and implement grey system analysis to confirm relevant coefficients and establish a model.
- Examine the quantitative contents of the experiment and test the quantitative results.
The system design procedure with the grey theory and AE as its framework introduced by the article could effectively enhance quality, shorten product development lead times, and is helpful in the enhancement of enterprise’s competitiveness.
3.2. Fuzzy Attribute Analysis of Product Factors
When a consumer chooses digitals, their degree of emotion regarding overall digital factors is sometimes clear and sometimes fuzzy, as it is a complicated mutual fuzzy attribute process. We clarified the fuzzy attribute process using a semantic difference method (SD) questionnaire to obtain images of the surveyed digital forms and texture words [12,13,14]. SD could avoid the interference of other factors in the two factors and investigate simply by texture and image words or form and image-words [15,16,17]. Meanwhile, we also considered the correlation between texture, form, and image words [18,19,20]. The results were encoded and obtained from continuous mutual comparisons of texture. In the computation of questionnaires, we used the marks from those that were surveyed to conduct correlation analysis to examine the correlation between words and texture, matching between words, forms, and coupling degree between texture words and form [21,22].
In this stage of technological development, we selected a set of coffee cups to set potential digital developments and explored the correlation degree between the form, texture, and digital image of coffee cups [23]. Users’ demands and their impression of the cups are significantly affected by related affective factors such as color, function, and usability, which are not considered in other research, thus we obtained simple variable factors by only analyzing the form and texture that might affect consumers’ digital image feeling [24].
3.3. Confirm the Factors of the Design
As Figure 3 shows, when design factors are confirmed in each step of the design and development process, grey system theory was adopted to analyze the correlation degree between the obtained factors (Figure 3). The data obtained from the analysis by grey theory should be a reference in follow-up design and development, and thus establish a database for automatic designs [25].
3.4. Extract Digital Form Image
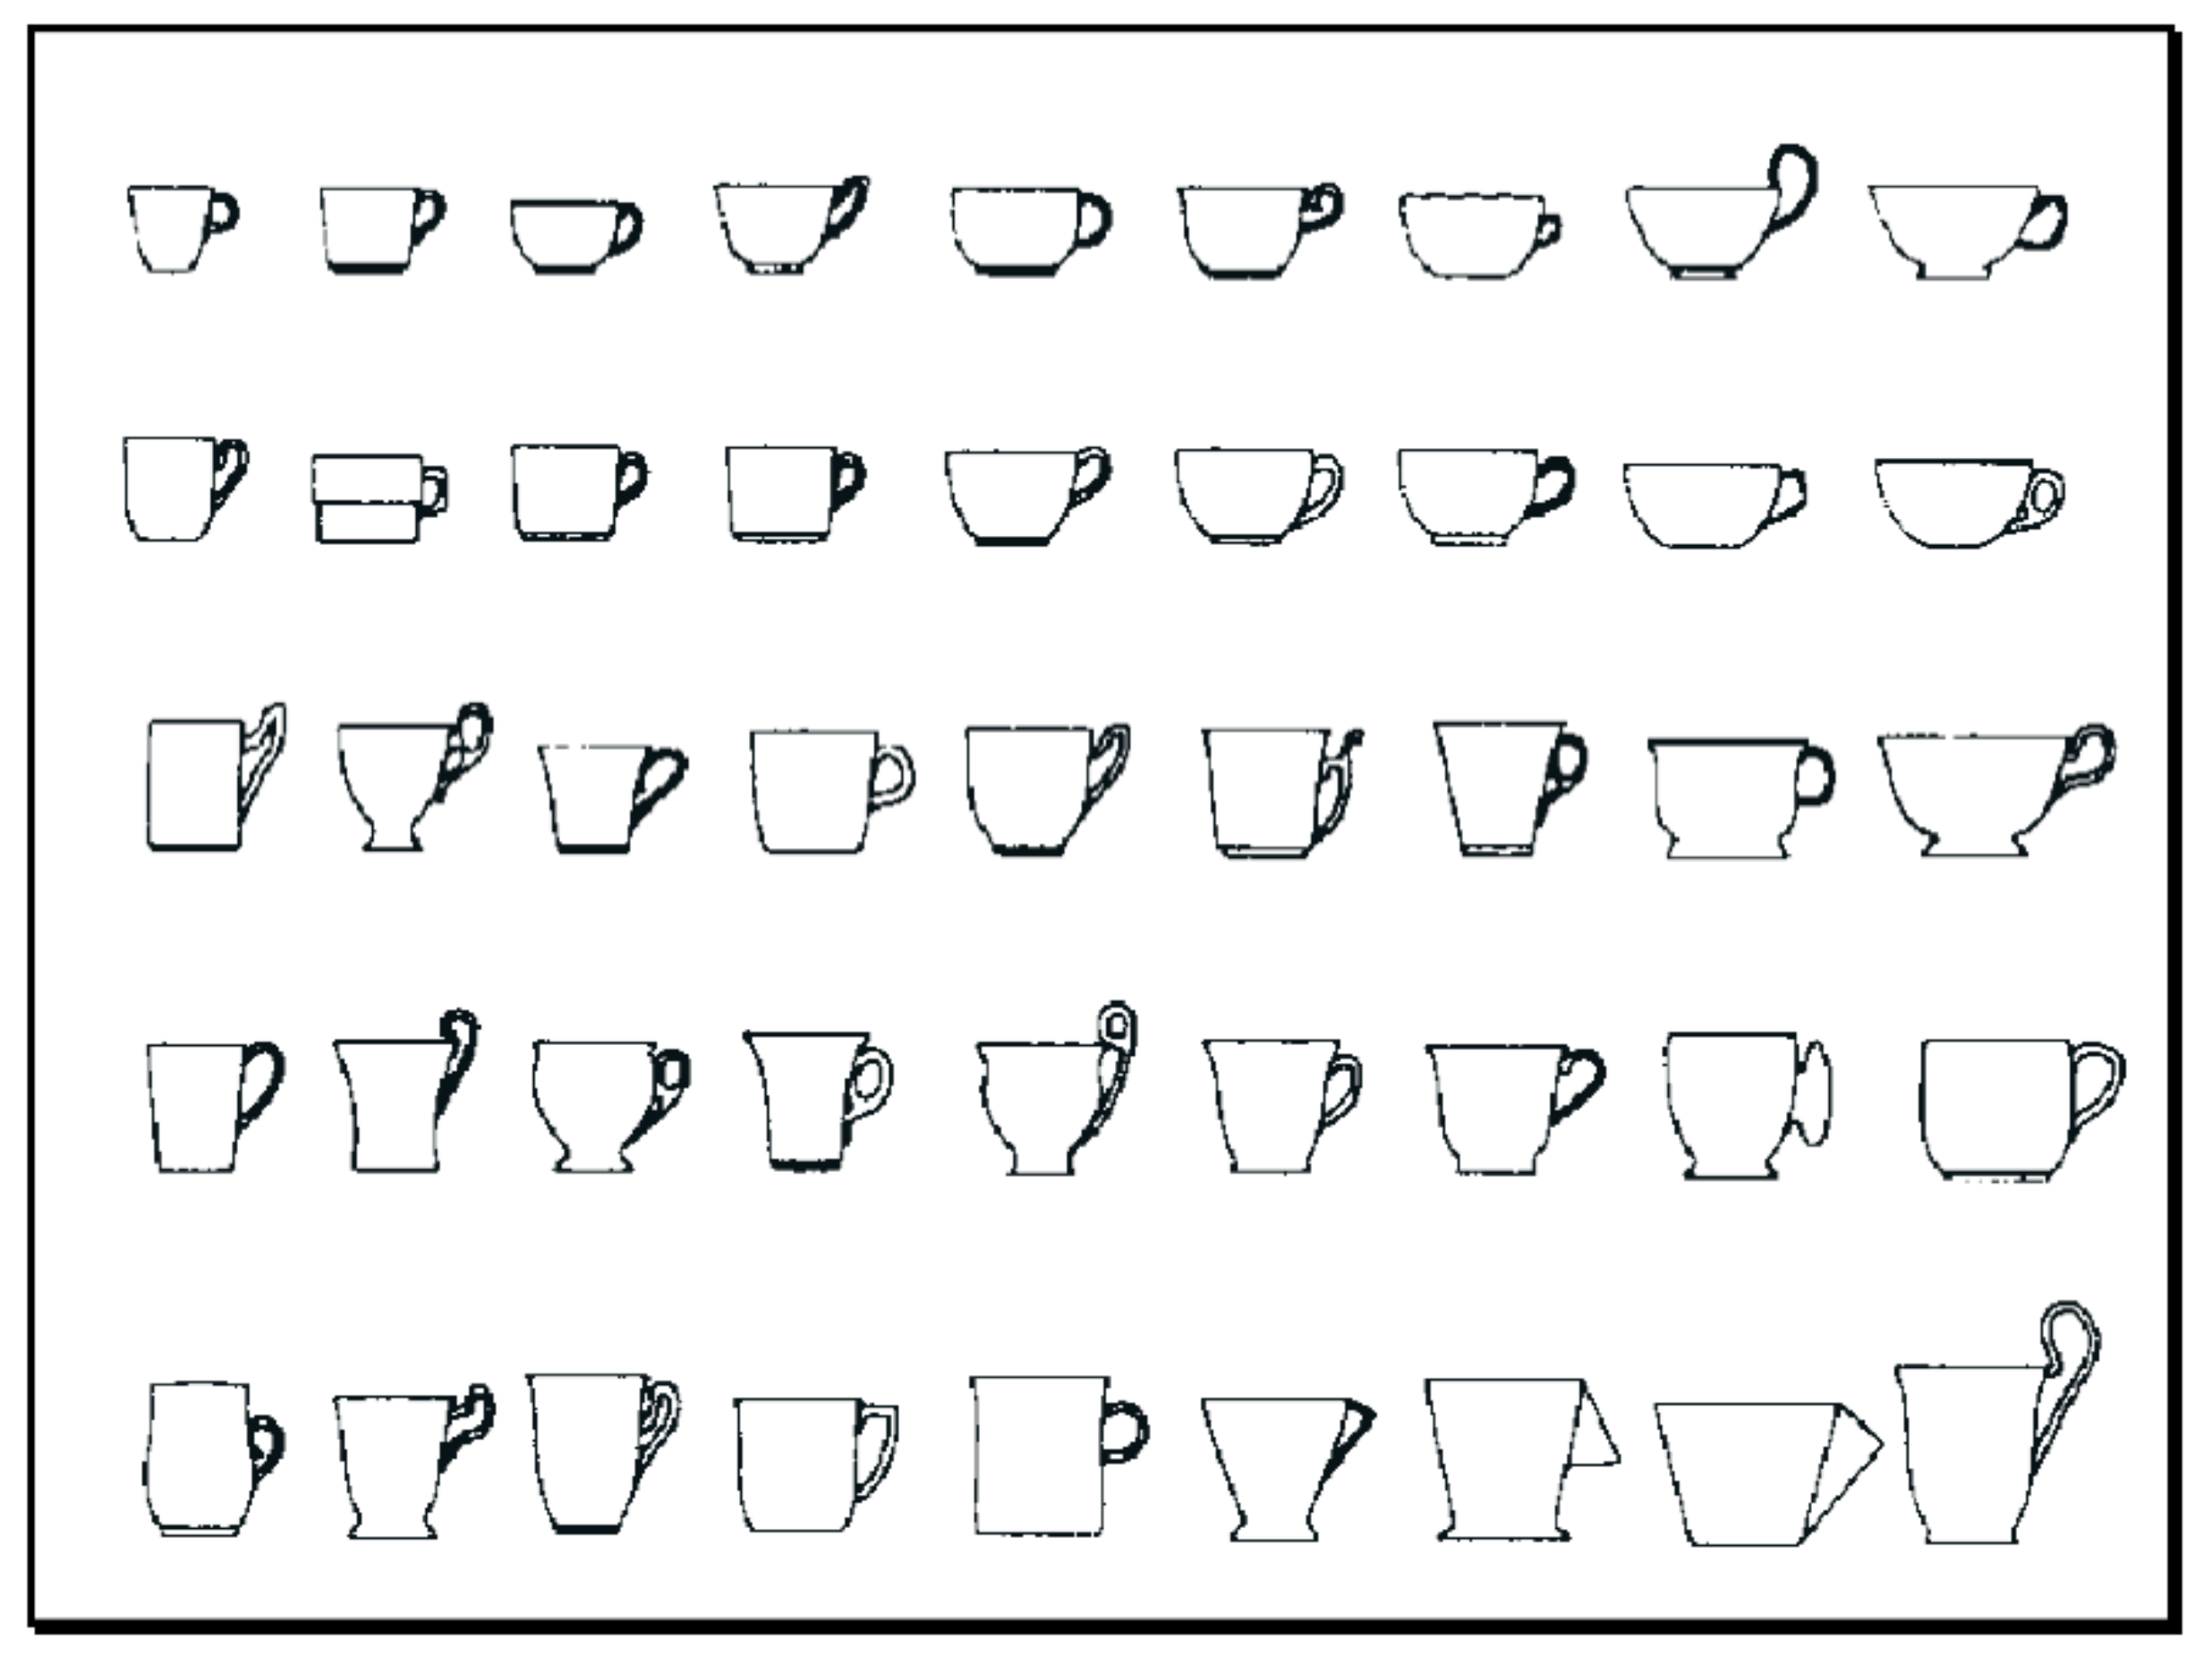
In the development, the selected target digital is a pure form. We collected existing coffee cup samples from markets, particularly cups with significantly different shapes. In addition to the consideration of shape, their geometric shapes after the simplification of motions were the reference conditions for experimental samples and they are variable factors of control experiment analysis. The development case did not take price, appearance pattern, color, or the weight of the coffee cups into the consideration in the experiment analysis. After the company’s sales department investigated and collected 108 sets of coffee cup form samples in markets, the selection results were expressed as set values of the form set (Figure 4). Among them, five sets of cups were analyzed in simplified forms via digital software. Digital signal process (DSP) technology was used to extract digital form factors (Figure 5).
3.5. Digital Form Selection
First, the selected enterprise’s targeted digital and took coffee cup sets in the design and development as selected digital samples of image words in the design case. Market research personnel in the company collected the form samples of target digitals of related image for the selection of image words. Affective engineering methods were used to select adjective words for correlation, and digital adjective words were divided into Design Image Scale Analysis (DISA) for different scopes of attribution by correlation degree (Figure 6). Then, the company designers and design researchers selected 80 sets of adjective words that described the target coffee cups in the research from closed-model interview-administered questionnaires. Furthered to encode the 80 sets of adjective words and produced them to be in the form of SD questionnaire. The factors in their consideration of buying coffee cups and the correlations of adjective words will be judged and selected by chosen design and development personnel in the company and by consumers. Those surveyed had to fill in a questionnaire according to their subjective preferences [25,26].
At this stage, data collection was carried out by the Marketing Department that issued 500 questionnaires to consumers for the survey. They set the ratio and distributed them according to the table. The questionnaires’ expectation error value was set to α = 0.05. Affective words were selected that had a significance level greater than 95% from the presented results, in order of value, these were uniqueness V1, modern V2, meticulous V3, classical V4, strong V5, and dexterous V6. In this research, we included six sets of adjective words in a set function Vi that was the value of image words, and included six elements.
3.6. Confirm Texture Factor
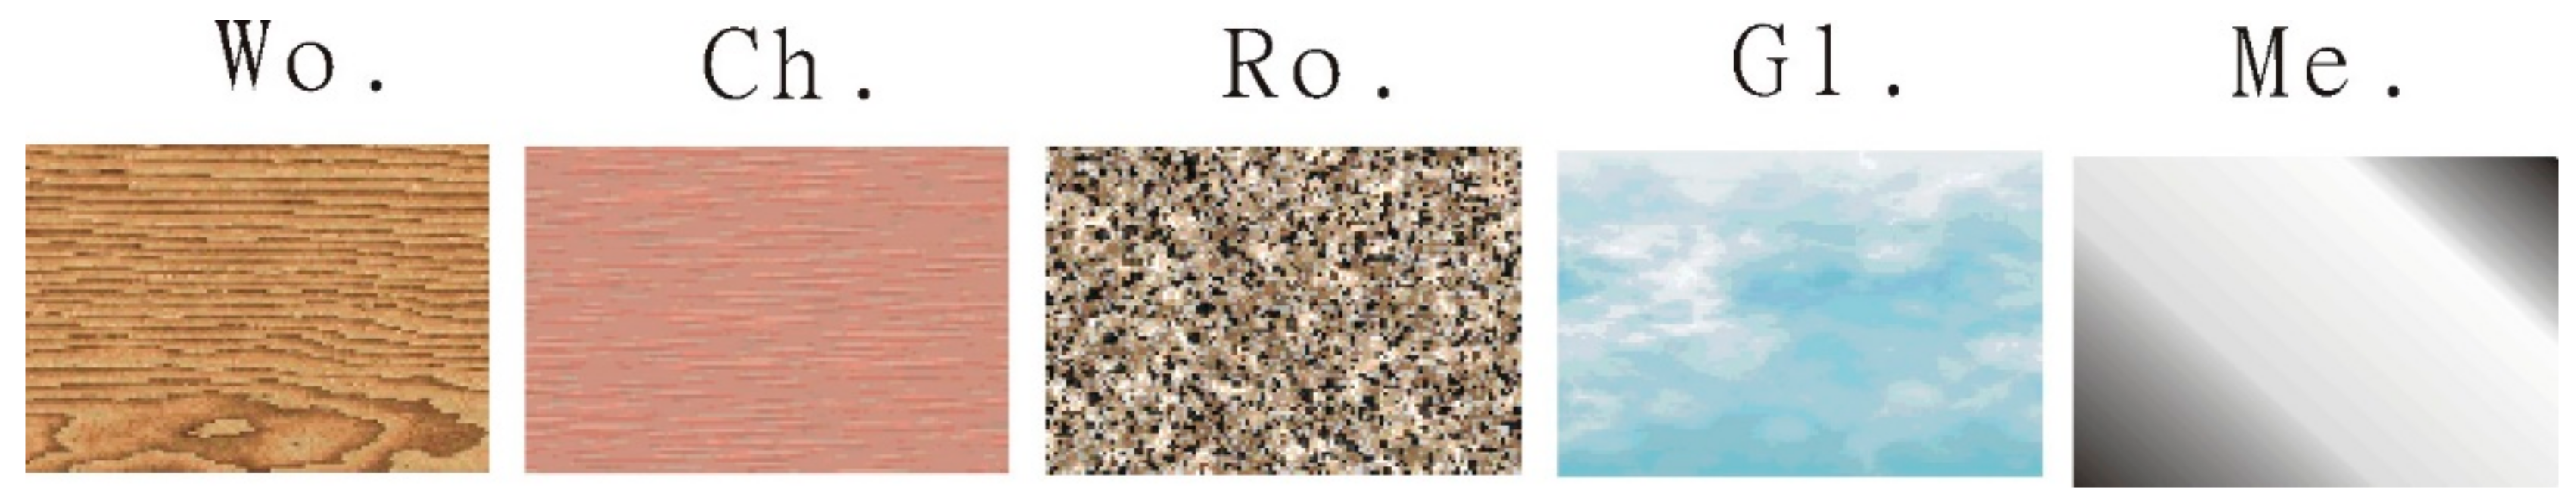
The first stage of the investigation in the development case was the image words investigation of coffee cups in the markets to obtain image words that were suitable for the research. In the digitals, 20 sets of coffee cup texture properties in markets were screened and coded. These were reproduced into close and open models for two-stage SD questionnaires. Customers would choose the degree of correlation for expected generated adjective words when they bought coffee cups. In the order of customer selection time, the texture factors that had significant differences between texture semantics were wood texture T1, pottery texture T2, stone texture T3, glass texture T4, and stainless steel texture T5. Actual samples were used to express texture factors Wo, Ch, Ro, Gl, and Me. The property words of five digitals were expressed as a set of values for an image word set function that included five related elements. For the texture part of the computer image handling, we used computer graphic pattern to demonstrate samples and a related software materials database or graphic database like shared material databases, such as Alias, MAYA, and three-dimensional (3D) max, as Figure 7 shows, and established a material database for the digital solid model design in the post engineering stage. (Figure 7).
3.7. Grey Relational Analysis
Once the maximum effects of all words orientation were obtained, the greatest characteristics of each image word and attribute on the target products were analyzed clearly to help the designers find the greatest value for each word and the strength and characteristics of the correlations between texture and forms that could effectively speed up design judgments [27].
We set the maximum significant effect value of all the word orientations for coffee cup in which the larger the number, the better the characteristics of the attribute value in each image word lie on the coffee cup and its reference sequence value is presented on the basis of the characteristics. Its formula is expressed as follows:
In the experiment we set X and x as for the texture factor domain and the continuous quantity of coupling degree between the form factor domain (Table 1), and image words were expressed as , as Table 2 shows; please refer to the contents of this experiment. According to the setting of the significance value of the grey correlation analysis, evaluate and assume , then compute the grey correlation analysis.
Among which, sample is the representative, as it is nearest to the set optimal value in texture and form versus the image words in the grey correlation analysis effects set in previous research. The order arrangement was conducted for the remaining samples, according to the grey correlation sequence values. Through the composition of the grey correlation sequence (such as the following sequence arrangement of ), and upon observing the order of the degree of nearest for the entire grey correlation model, the value becomes the design quantitative value that can be continuously expressed as the reference basis value for design and development, as the formula shows. As Table 3 shows, the sample set by can be an optimal interval with the nearest value to the set optimal value in texture and form versus image words in the set grey correlation analysis effects in the previous research (Table 3). The arrangement of order was conducted for the remaining samples according to the grey correlation sequence values. Through the composition of the grey correlation sequence (such as the following sequence arrangement: ) and observing the order of the degree of nearness for the entire grey correlation model, the value becomes the design quantitative value that can be continuously expressed.
According to the setting of the significance value for grey correlation analysis, evaluate and assume , then compute the grey correlation analysis. Among this, the sample is the nearest value to the set optimal value in texture and form versus image words in the set grey correlation analysis effects in previous research.
Order arrangement was conducted for the remaining samples, according to the grey correlation sequence values. Through the composition of grey correlation sequence (such as the following sequence: ), and observing the order arrangement for the degree of nearness for the entire grey correlation model, the value becomes the design quantitative value that can be continuously expressed as a reference basis value for design and development (Table 3).
As Table 3 shows, the sample set of can be optimally internalized with the nearest value to the set’s optimal value in texture and form versus image words in the set grey correlation analysis effects in previous research. The arrangement of order was conducted for the remaining samples, according to the grey correlation sequence values. Through the composition of grey correlation sequence (such as the following sequence of ) and observing the order of the degree of nearing of entire grey correlation model, the value becomes the design quantitative value that can be continuously expressed. According to Table 3, we can obtain the following continuous sort function for the grey correlation.
4. Developing Automatic Form Interface System
4.1. Background Description of Program Development
Texture and form have significant effects on digital images, in that there is much space for research on the effects of form and texture on digital image. We grasp this deficiency by considering form and texture as two groups of related dependent variables that affect digital images to explore the association and match the effects of form and texture on image feeling, and thus build a correlation database between form, texture, and digital images. According to such a database, we built a digital word consultation software package and achieved the goal of designing computerization using texture and word images to help designers and related design and development personnel design and choose digital concepts. However, it could be used in the domain of a consumer shopping consultation system because there were considerable niche factors. Therefore, building a set of consultable forms and a texture image analysis system can help the market development-related personnel, including planners, seek strategies that best meet consumers’ psychological demands [28]. This could effectively further shorten the time required for digital development and the enhancement of enterprise competitiveness.
4.2. The Description of the Consultation Program Structure
Program design results show that the results can be used in the design automation domain. We achieved the purpose of automation, based on the results of research, using the database building-related computer software SQL to write a program. Meanwhile, we also used C++ to create object-oriented development programs and thus write the theoretical structure and research results in window software for the convenience of designers when using software to obtain many design-related messages that would help designers develop new digitals [15]. However, its most important purpose is to function as a preview advisory program for users to inquire about their forward buying. It was also designed for the convenience of enterprises and manufacturers to grasp consumers’ consumption trends so that it is easy to formulate the segmentation of digital attributes and shorten the time frame for digital development. The program that was developed by the design and development program interface includes three parts:
- Sample Database: integrate all information in the sample database that could be used by each other.
- Affective engineering Number: The explanation of image value by texture, words, and form.
- Grey System Query: The main function of a sample database is to describe the detailed numerical value of each sample used the research such as texture, words, and form that will help designers understand the various factors that may affect design results. Grey System Query provides four query patterns that are designed to meet customers’ different demands:
- The analysis value query about the absolute word grey system sequence.
- The analysis value query about the absolute correlation between form and texture.
- The analysis value query about the absolute form, word grey system.
- The analysis value query about the absolute form of the word grey system.
Use fuzzy assessment methods to build a sample database; the building pattern was constructed using the SQL database. In consideration of the mutual effects between two variables of texture word and form, we used variance analysis and grey relational analysis in GST to analyze the weight ratio of the effects of texture word value and form on digital images. Use a computer program to design a set of consultable programs and software that could input and output digital words in order to help develop, plan, and design personnel to effectively grasp the digital scale of consumer’s psychological demands and help the digital market positioning. Eventually, the above-mentioned functions of the above-mentioned parts will be integrated into a series of grey consultation systems [29].
4.3. The Implementation Steps of Selection and Analysis by Program
In this development program, we consider form and texture as two groups of related dependent variables that affect digital images to explore the association and matching effects of form and texture on image feeling and further to build a correlation database between form, texture, and digital image in Figure 8. According to such a database, we built a set of digital word consultation software to achieve the above-mentioned four dynamic query patterns (only words, words and form, form and texture, words and texture), and build a sample database grey system query (Figure 9, Figure 10 and Figure 11) [15].
4.4. The Motion Model of Consultation Selection
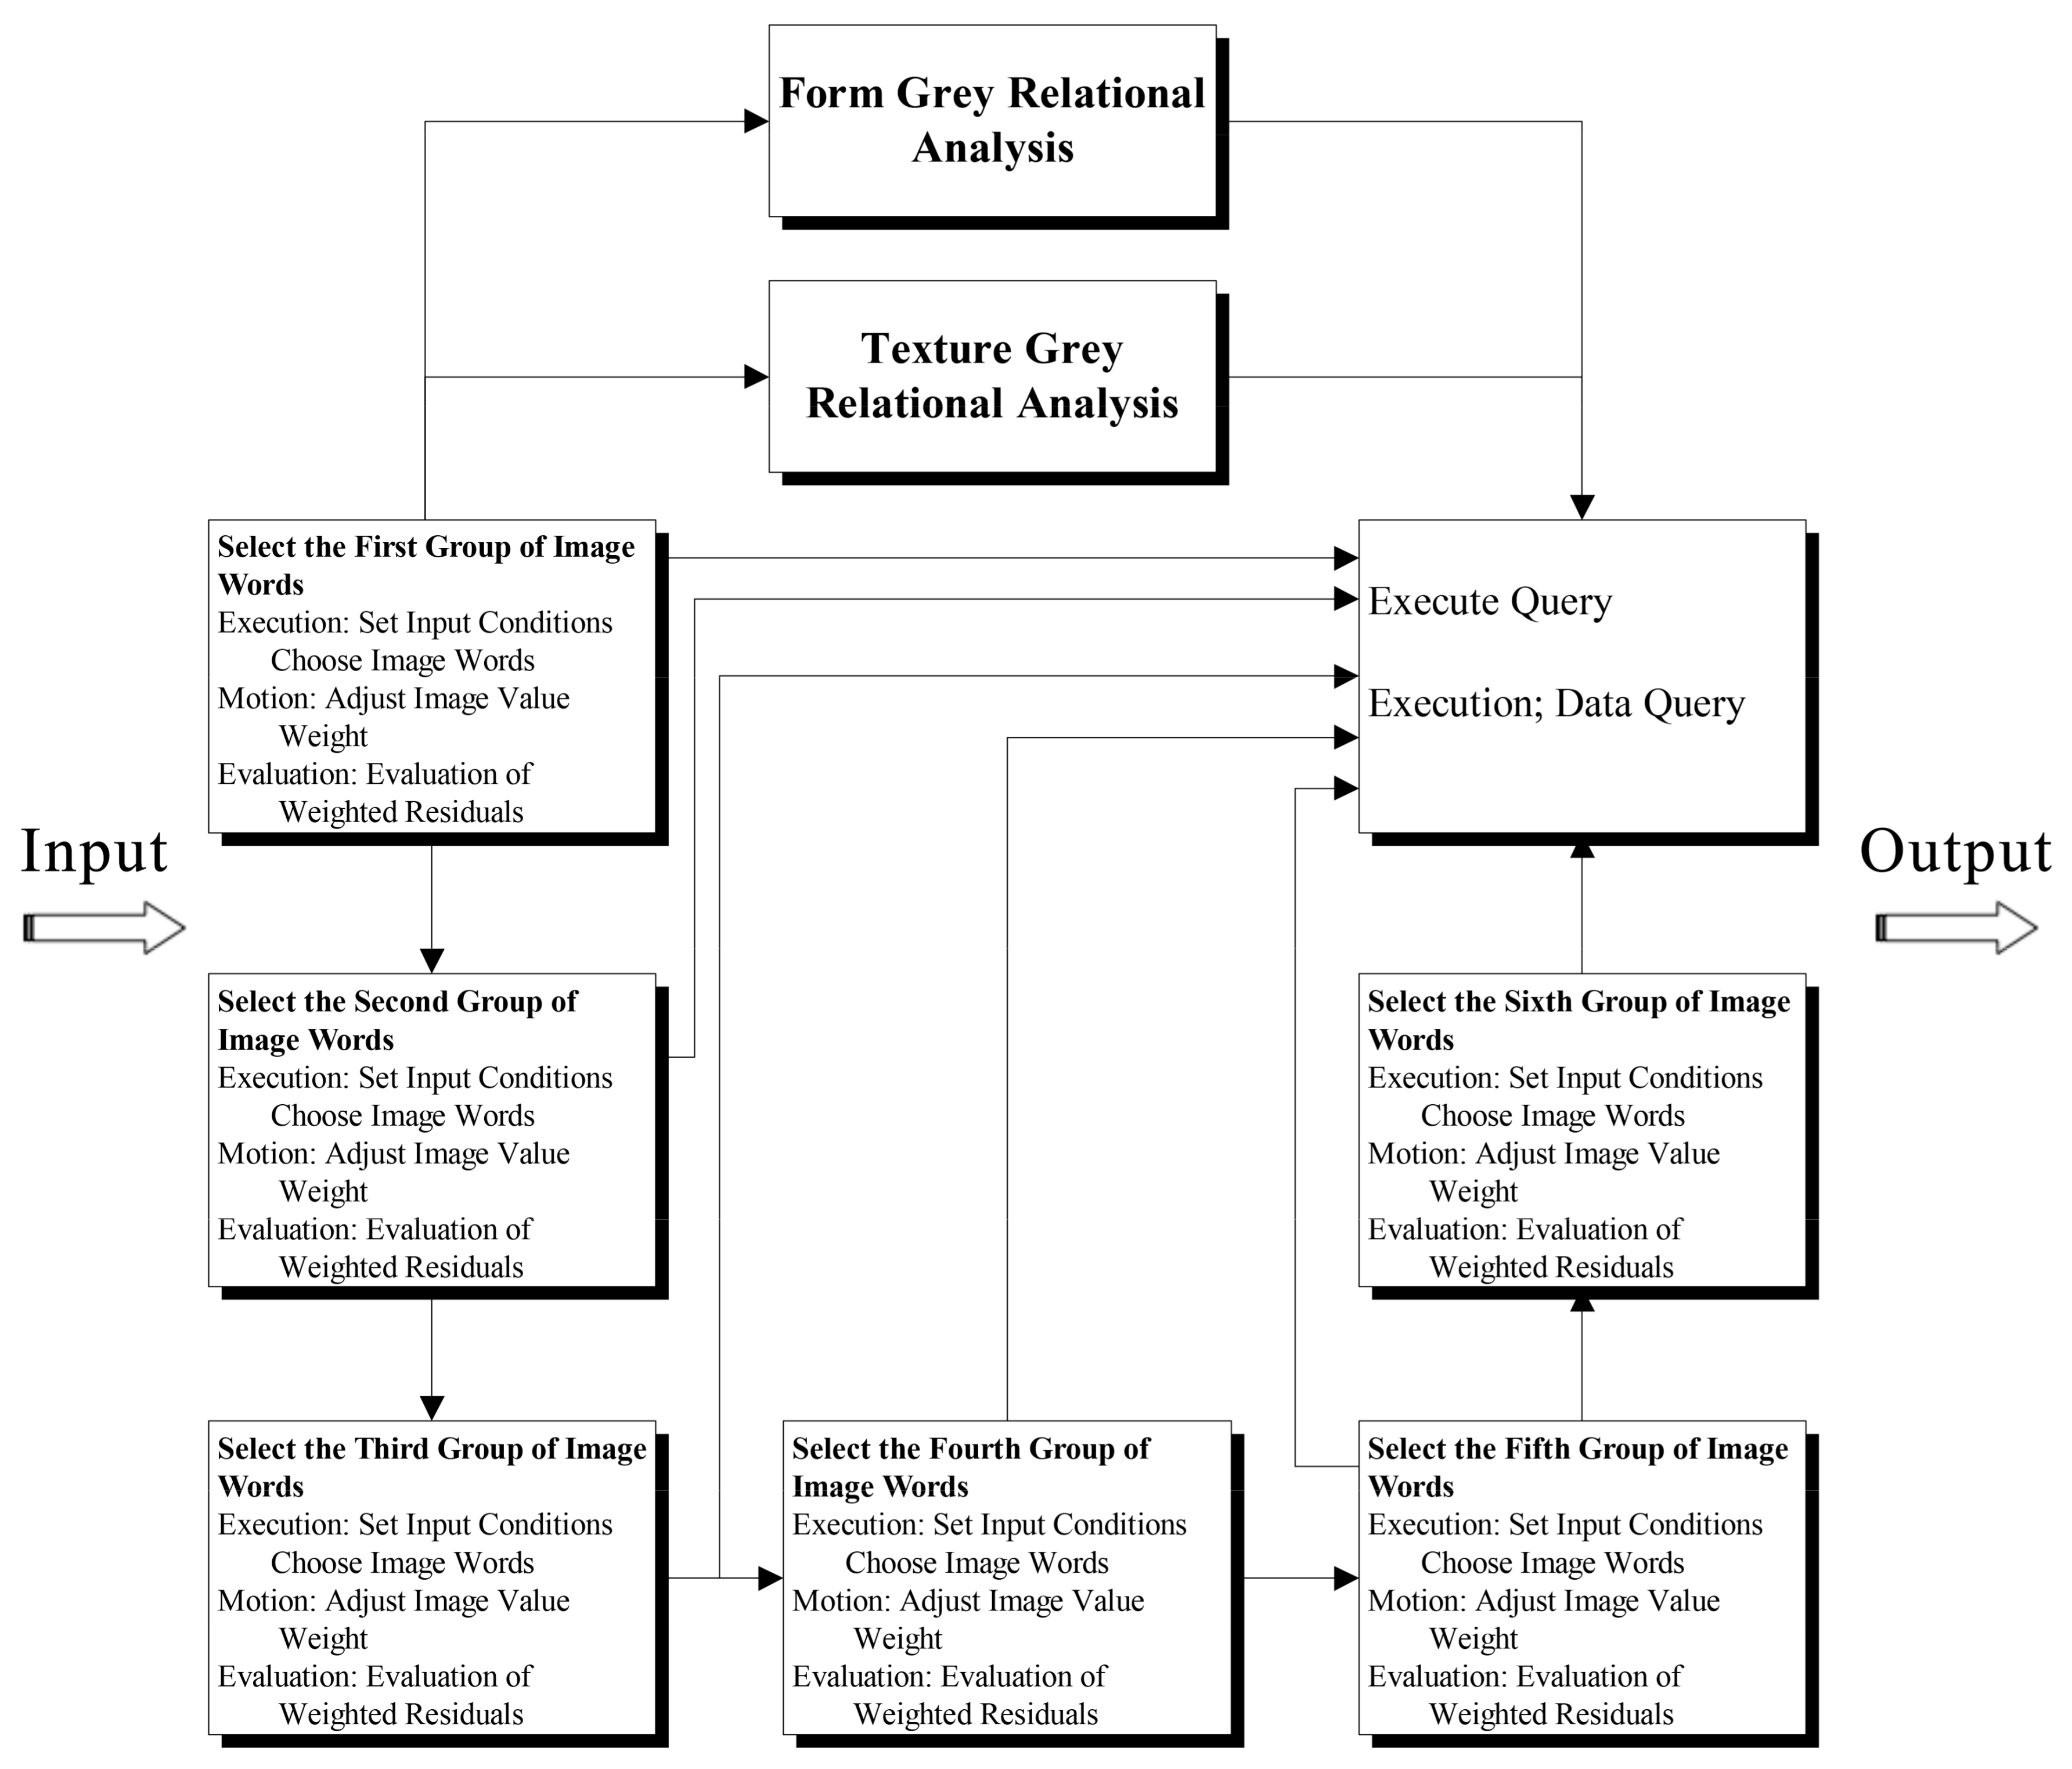
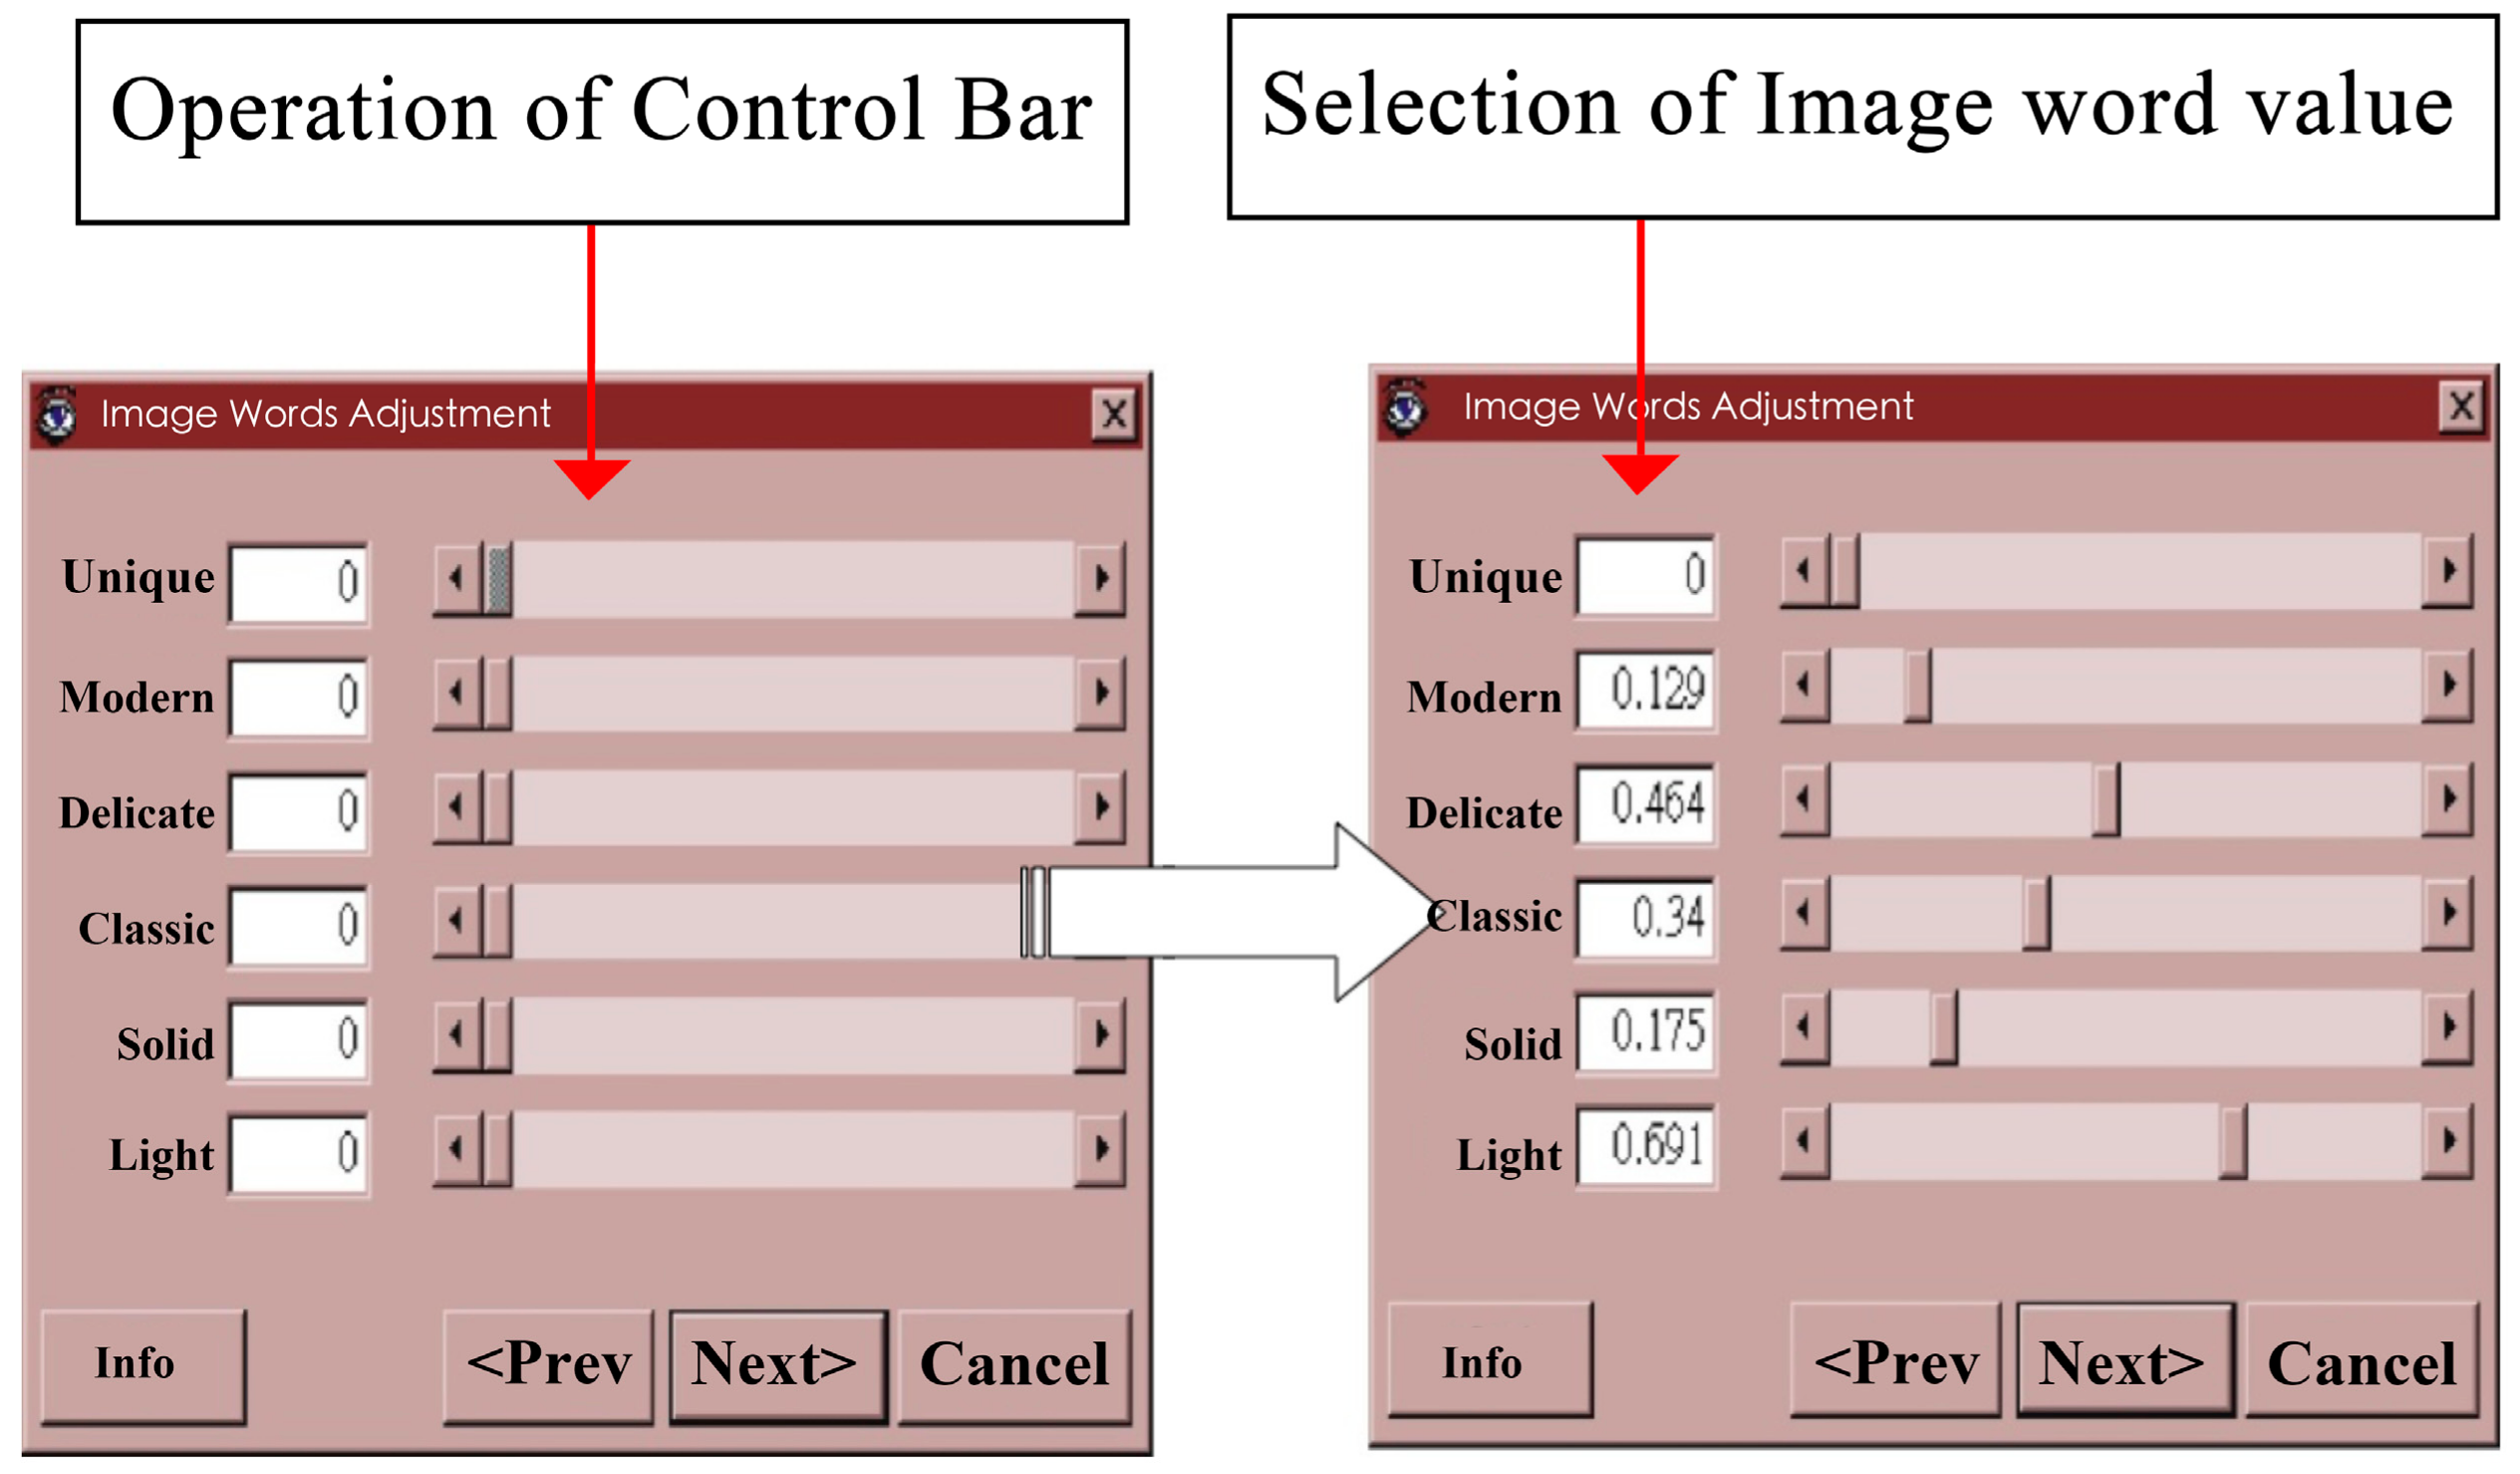
Citing the idea of system engineering science theory, which is the academic basis of this technical report, we inferred Equation (9), and applied it to the analysis value query model about the absolute word grey system sequence. The operation method is to move the control bar to control the necessary image word weight (Figure 9, Figure 10, Figure 11 and Figure 12). In setting the image word, we could input a group or several groups of image word weights, as shown in Figure 13 [30]. The out value is used in the program to implement the grey relationship coefficient operation and compute the weighted residual assessment to obtain the value nearest to the expectation value set by the grey relationship [31]. Assume the weighted residual formula as follows:
where : Relation reference sequence value set for coffee cup image; : The implemented optional motion of input word value by user; : The user’s input word ratio value in the formula, it acts as weight value that will be used to highlight the expected significance value by user.
- Adopted query model of grey relation analysis value.
- Adopted query model of the “form-texture” grey relation analysis value.
- Adopt query model of “form-word” grey relation analysis value.
- Adopt query model “texture-word” grey relation analysis value.
These three operation models are patterns that are designed to select two groups of conditional formulas to determine a target digital. In image word operation pattern, you need only to move bar to control necessary weight of image word. For setting the image word, the operator could input as his wish a group or several groups of image word values. In other parts, the operator could freely select the elements of texture or form or simply select texture and form.
On the part of selection of texture and form, we could also use the method of linking database. All of the output values are implemented grey relational sequence value computation and weighted residual in the program to compare the computation contents as Formula (10) shows and select a digital value that is the nearest the value set by grey relation.
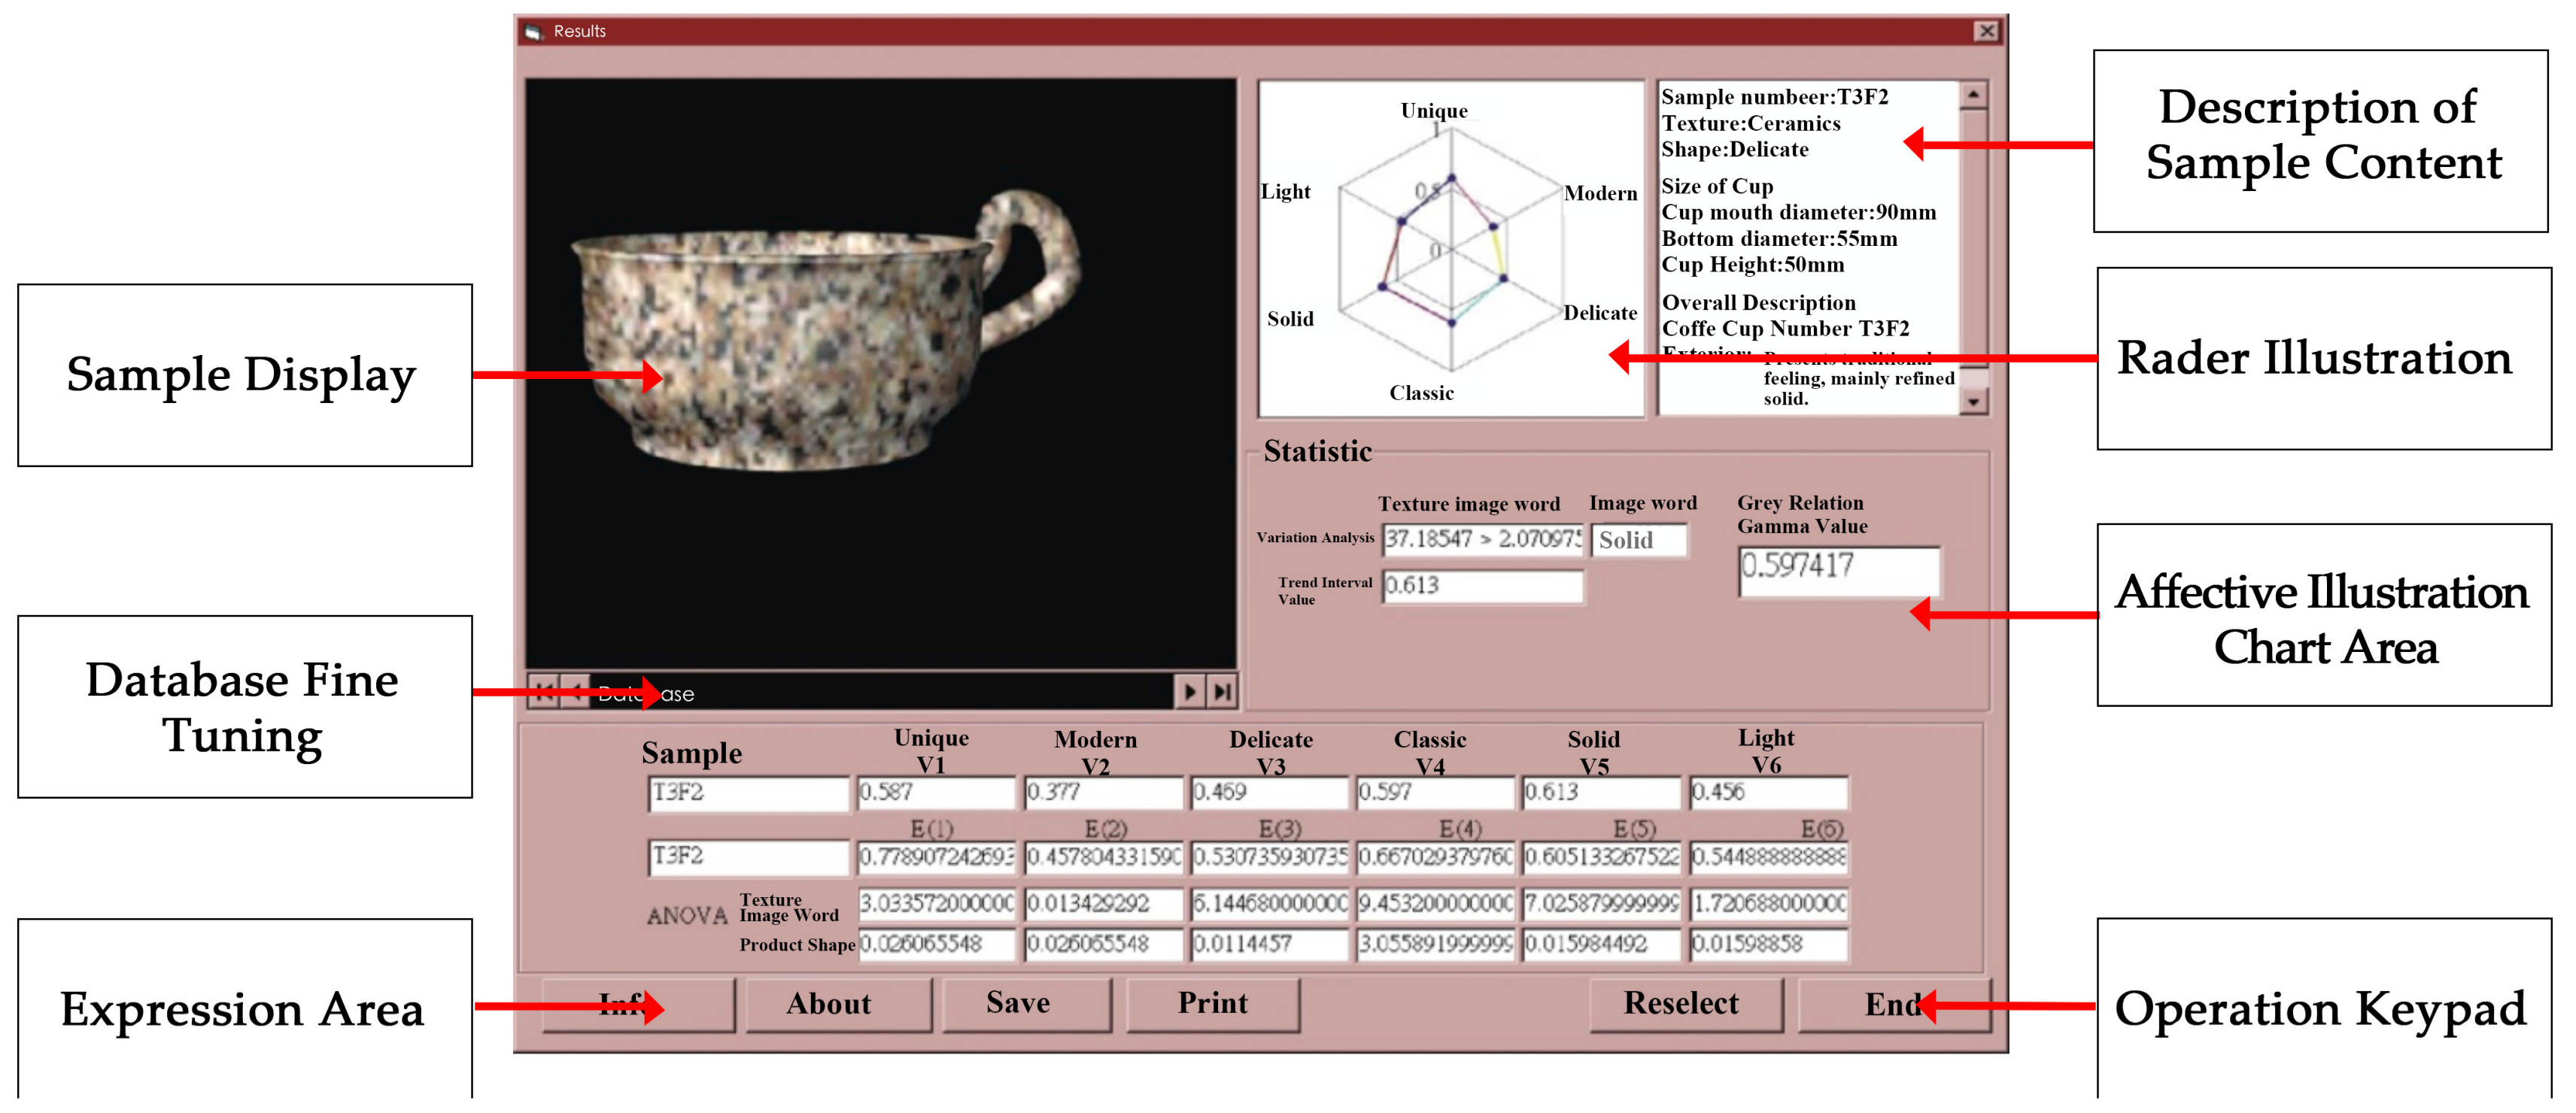
4.5. The Presentation of Final Output Data by the Program
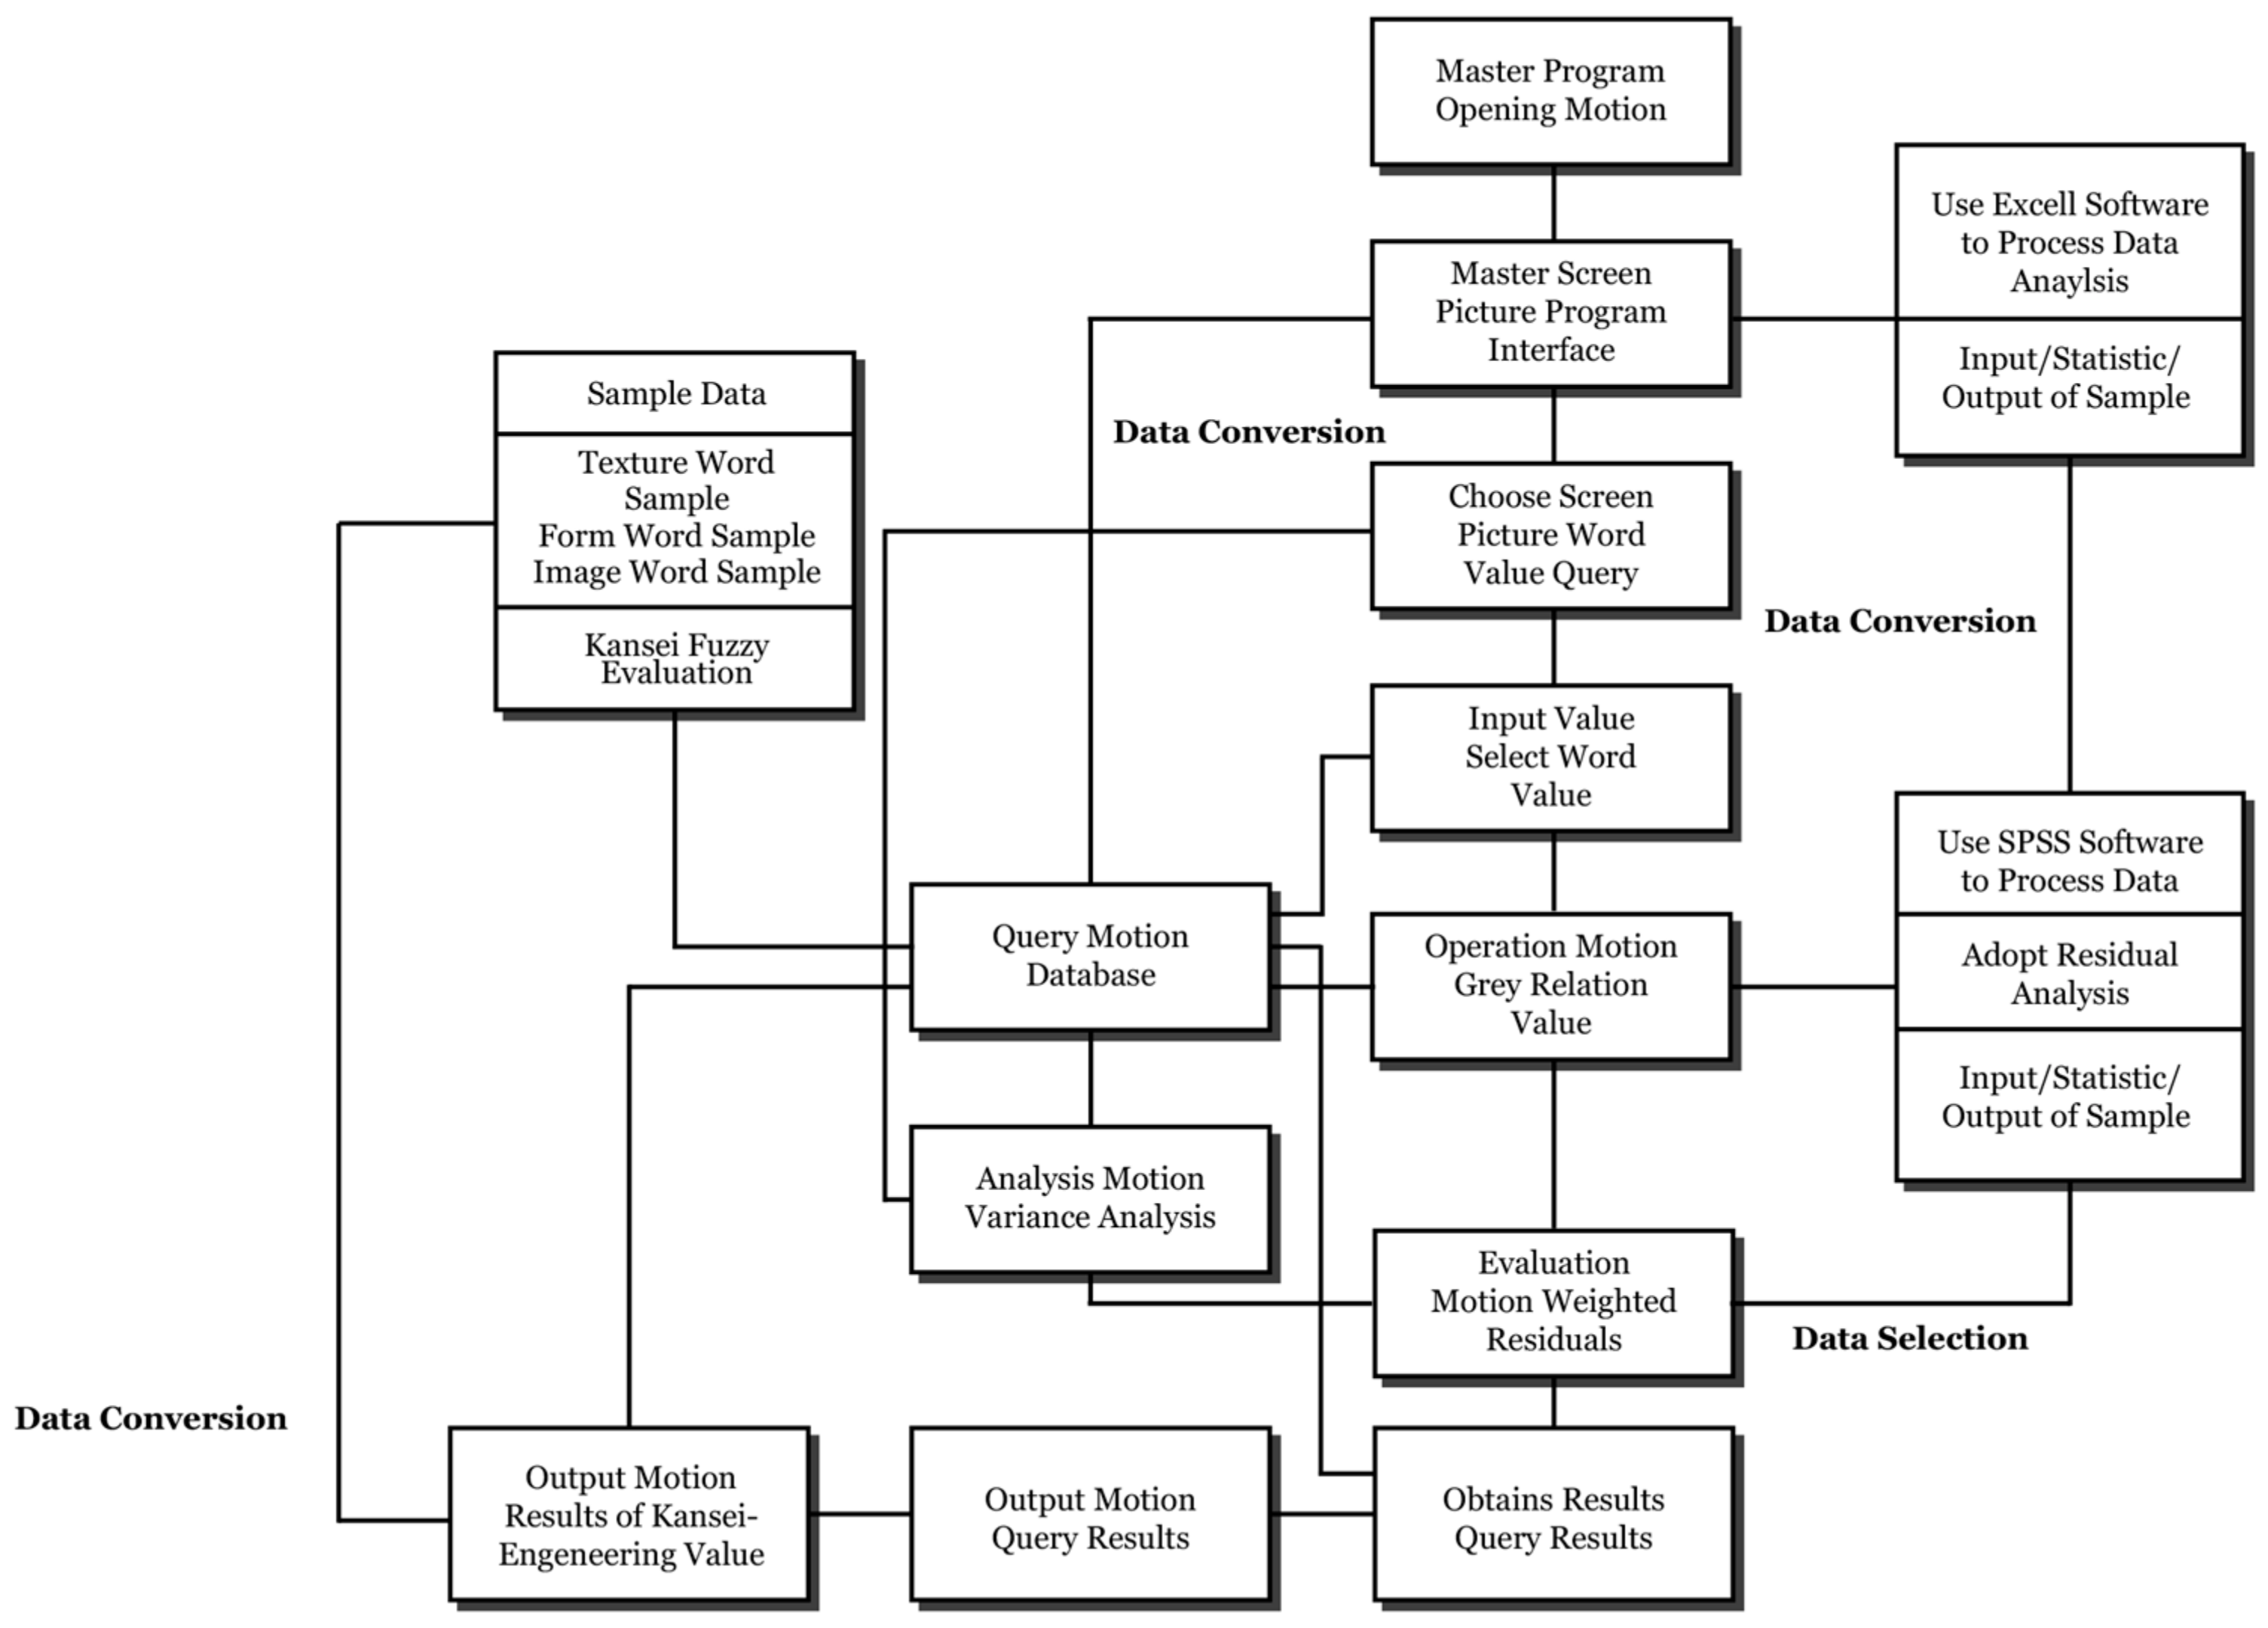
The presented data in the output of final consultation formula could be divided into five areas: sample display area, database micro-adjustment area, affective illustration chart display area, sample statistic numerical value area, and sample grey relation operation numerical value area (Figure 14 and Figure 15).
5. Conclusions
In the traditional product design process, the designer and management go back and forth between manufacturers and markets to collect data or distribute market questionnaires before they start designing and developing new products, according to the results of their analyses. However, the data collection and analytical patterns are too complicated and time-consuming processes. Besides, not all the results of data collection and analyses could be used repeatedly and shared, and during redesigns, designers need to repeat the same actions [31]. Such recurrence development models have high time and monetary costs, so it is difficult for traditional product design processes to achieve the goal of introducing enterprises into automatic systems. Effectively improving traditional design processes and shortening the time required for decision-making in detailed design are important issues [32].
This design and development project aims to explore the product design knowledge that many enterprises need in the process of development [33]. Through product and object development patterns and quantitative decision-making, we develop a qualitative quantified algorithm in the process of design and development system to conduct research on form design, product texture, and AE image words. The research’s concrete contributions have been reorganized, as follows:
- The grey theory could be applied to the design, speculation, and assessment. The application of GRA in grey theory could effectively determine the correlation between design and analytical factors.
- Different textures and forms will affect the feeling about products in Affective engineering-words, and there is correlation in mutual traction and repulsion. Please refer to factors and . From the results of GRA, we can describe that the attributes of the two factors are too close. Two factors are stone texture and wood texture, and the characteristics of texture are national texture. When a consumer buys a product, if the change of form is not significant and the colors are the same, they may easily have divided feelings about the whether the shape of a product is a natural or artificial attribute. However, if the difference between attributes is significant, it will affect and repel people.
- We could use grey relational value to set the optimal sequence of product segmentation that will favor the market positioning and segmentation analyses for new follow-up new products. The sorting trend of overall grey relational grade could act as a reference basis for the design development and assessment.
- The grey relational quantification process will help the form and texture of a product to generate continuous relative values with affective engineering words. The quantification values could be effectively recorded, reorganized, expanded, and linked with other factors, such as mass and color, to become a model of a complete product design database and act as a reference basis for a redesign and automatic system.
- Integrate the results of AE and GRA to establish an AE database of texture that can clearly explain fuzzy affective engineering factors. Regarding the exploration of the effects of texture factors and the product form factors on the integral feeling about products in AE words, the significance of texture factor is greater than the product form factor. Therefore, when a company’s development department re-develops a product, they should emphasize the changes in texture to win consumers’ new sensory agreement, shorten development times, and reduce design costs.
- Based on the considerations of ability and research time, this research did not cover all possible affecting factors, such as style situations. However, we could develop computerization that would effectively shorten the investigation procedures in the preceding stage of GRA and integrate research factors to improve related research.
- Design and development programs can mutually link and develop with other programs, such as some utility programs.
- The design methodology for system engineering scientific design established in the technical report could be applied to fields, including related architectural designs, urban planning, planning management, information management, economic research, operation research, ecological research, culture surveys, medical analysis, traffic and transportation analysis, and industrial production control.
Acknowledgements
The research was applied to Jian Sheng Industrial Ltd. and Sun Link Sea Resort Ltd. interactive interface website page design and of the industry-university cooperative research project, and supported in part by the National Yunlin University of Science and Technology, LCY Digital Design Lab, Taiwan under Grant No. 103-L01-3, Taiwan. The achievement of the project is practical. However, studies are insufficient for a variety of website design factors may also relates to human perception. The results provide designers with an effective design progress to electronic commerce website and utilize design factors to cross-platform.
Author Contributions
Chen-Yuan Liu conceived and designed the experiments, performed the experiments; Lee-Ing Tong and Chen-Yuan Liu analyzed the data; Chen-Yuan Liu and Lee-Ing Tong contributed analysis tools and checked the paper; and Chen-Yuan Liu wrote the paper.
Conflicts of Interest
The authors declare no conflict of interest.
References
- Kuang, J.; Jiang, P. Product platform design for a product family based on Kansei engineering. J. Eng. Des. 2009, 20, 589–607. [Google Scholar] [CrossRef]
- Jiao, J.; Zhang, Y.; Helander, M. A Kansei mining system for affective design. Expert Syst. Appl. 2006, 30, 658–673. [Google Scholar] [CrossRef]
- Zadeh, L.A. Fuzzy sets. Inf. Control 1965, 8, 339–353. [Google Scholar] [CrossRef]
- Pawlak, Z. Rough sets. Int. J. Comput. Inf. Sci. 1982, 11, 341–356. [Google Scholar] [CrossRef]
- Zhou, C.S.; Deng, J.L. The Stability of Grey Linear System. Int. J. Control 1986, 43, 313–320. [Google Scholar] [CrossRef]
- Nagamachi, M. Kansei engineering: A New Ergonomic Consumer-Oriented Technology for Product Develop-ment. Int. J. Ind. Ergon. 1995, 15, 3–11. [Google Scholar] [CrossRef]
- Horiguchi, A.; Suetomi, T. A Kansei Engineering Approach to a Driver/Vehicle System. Int. J. Ind. Ergon. 1995, 15, 25–37. [Google Scholar] [CrossRef]
- Zhu, C.Q. Grey Prediction Modeling via Grey Relational Weighting. J. Grey Syst. 2001, 13, 225–258. [Google Scholar]
- Zhu, C.S.; Deng, J.L. Stability analysis of gray discrete-time systems. IEEE Trans. Autom. Control 1989, 34, 173–175. [Google Scholar] [CrossRef]
- Chang, T.C.; Lin, S.J. Grey Relational Analysis of Carbon Dioxide Emissions from Industrial Production and Energy Uses in Taiwan. J. Environ. Manag. 1999, 56, 247–257. [Google Scholar] [CrossRef]
- Chen, Y.K.; Tan, X.R. Grey Relational Analysis on Serum Markers of Liver Fibrosis. J. Grey Syst. 1995, 7, 63–68. [Google Scholar]
- Cross, N. Engineering Design Methods: Strategies for Product Design; John Wiley & Sons: Chichester, UK, 2008; ISBN 9780470519264. [Google Scholar]
- Alessi, A. Alessi: The Design Factory; Academy Editions; John Wiley & Sons: UK, 1994; ISBN 978-0471978572. [Google Scholar]
- Hayes, G.E. Quality Assurance: Management and Technology; Charter Productions: Los Angeles, CA, USA, 1983; ISBN 9780937752036. [Google Scholar]
- Tsai, H.C.; Hsiao, S.W.; Hung, F.K. An Image Evauation Approach for Parameter-Based Product Form and Color Design. Comput. Aided Des. 2006, 38, 157–171. [Google Scholar] [CrossRef]
- Beck, J.; Sutter, A.; Ivry, R. Spatial Frequency Channels and Perceptual Grouping in Texture Segregation. Comput. Vis. Graph. Image Process. 1987, 37, 299–325. [Google Scholar] [CrossRef]
- Jindo, T.; Hirasago, K.; Nagamachi, M. Development of a Design Support System for Office Chair Using 3D Graphics. Int. J. Ind. Ergon. 1995, 15, 49–62. [Google Scholar] [CrossRef]
- Jindo, T.; Hirasago, K. Application Studies to Car Interior of Affective engineering. Int. J. Ind. Ergon. 1997, 19, 105–114. [Google Scholar] [CrossRef]
- Karnes, C.L.; Sridharan, S.V.; Kanet, J.J. Measuring Quality from the Consumer’s Perspective: A Methodology and Its Application. Int. J. Prod. Econ. 1995, 39, 215–225. [Google Scholar] [CrossRef]
- Baxter, M. Product Design; Chapman & Hill: London, UK, 1995; ISBN 978-0748741977. [Google Scholar]
- Niles, B. White by Design; Stewart, Tabori & Chang: New York, NY, USA, 1984; ISBN 9781556702778. [Google Scholar]
- Pahl, G.; Beitz, W. Engineering Design; The Design Council: London, UK, 1988; ISBN 9781846283192. [Google Scholar]
- Pedersen, B.M. Graphis Product by Design; Graphic Press Crop: Zurich, Switzerland, 1994; ISBN 978-3857094521. [Google Scholar]
- Ravishankar, R. A Taxnomy for Texture Description and Identification; Springer: New York, NY, USA, 1990; ISBN 9781461397779. [Google Scholar]
- Rao, A.R. Identifing High Level Features of Texture Perception. Graph. Model. Image Process. 1993, 55, 218–233. [Google Scholar] [CrossRef]
- Saaty, T.L.; Vargas, L.G. Diagnosis with Dependent Symptoms: Bayes Theorem and the Analytic Hierarchy Process. Oper. Res. 1998, 46, 491–502. [Google Scholar] [CrossRef]
- Liu, C.Y.; Tong, L.I. Developing Product Design Using Integrated Grey Relational Analysis and Kansei-Engineering. J. Qual. 2009, 16, 165–177. [Google Scholar]
- Bhushan, N.; Rai, K. Strategic Decision Making: Applying the Analytic Hierarchy Process (Decision Engineering); Springer: London, UK, 2004; ISBN 9781852337568. [Google Scholar]
- Xiao, J. On A Kind of Information Grey Number. J. Grey Syst. 1995, 7, 111–130. [Google Scholar]
- Xiao, X.P. On Parameters in Grey Models. J. Grey Syst. 2000, 11, 315–324. [Google Scholar]
- Tseng, F.M.; Yu, H.C.; Tzeng, G.H. Applied Hybrid Grey Model to Forecast Seasonal Time Series. Technol. Forecast. Soc. Chang. 2001, 67, 291–302. [Google Scholar] [CrossRef]
- Kesteren, I.; Bruijn, S.; Stappers, P.J. Evaluation of materials selection activites in user-centred design projects. J. Eng. Des. 2008, 19, 417–429. [Google Scholar] [CrossRef]
- Chen, C.H.; Khoo, L.P.; Yan, W. An investigation into affective design using sorting technique and Kohonen self-organizing map. Adv. Eng. Softw. 2006, 37, 334–349. [Google Scholar] [CrossRef]
Figure 1.
The hierarchical analysis of affective engineering.
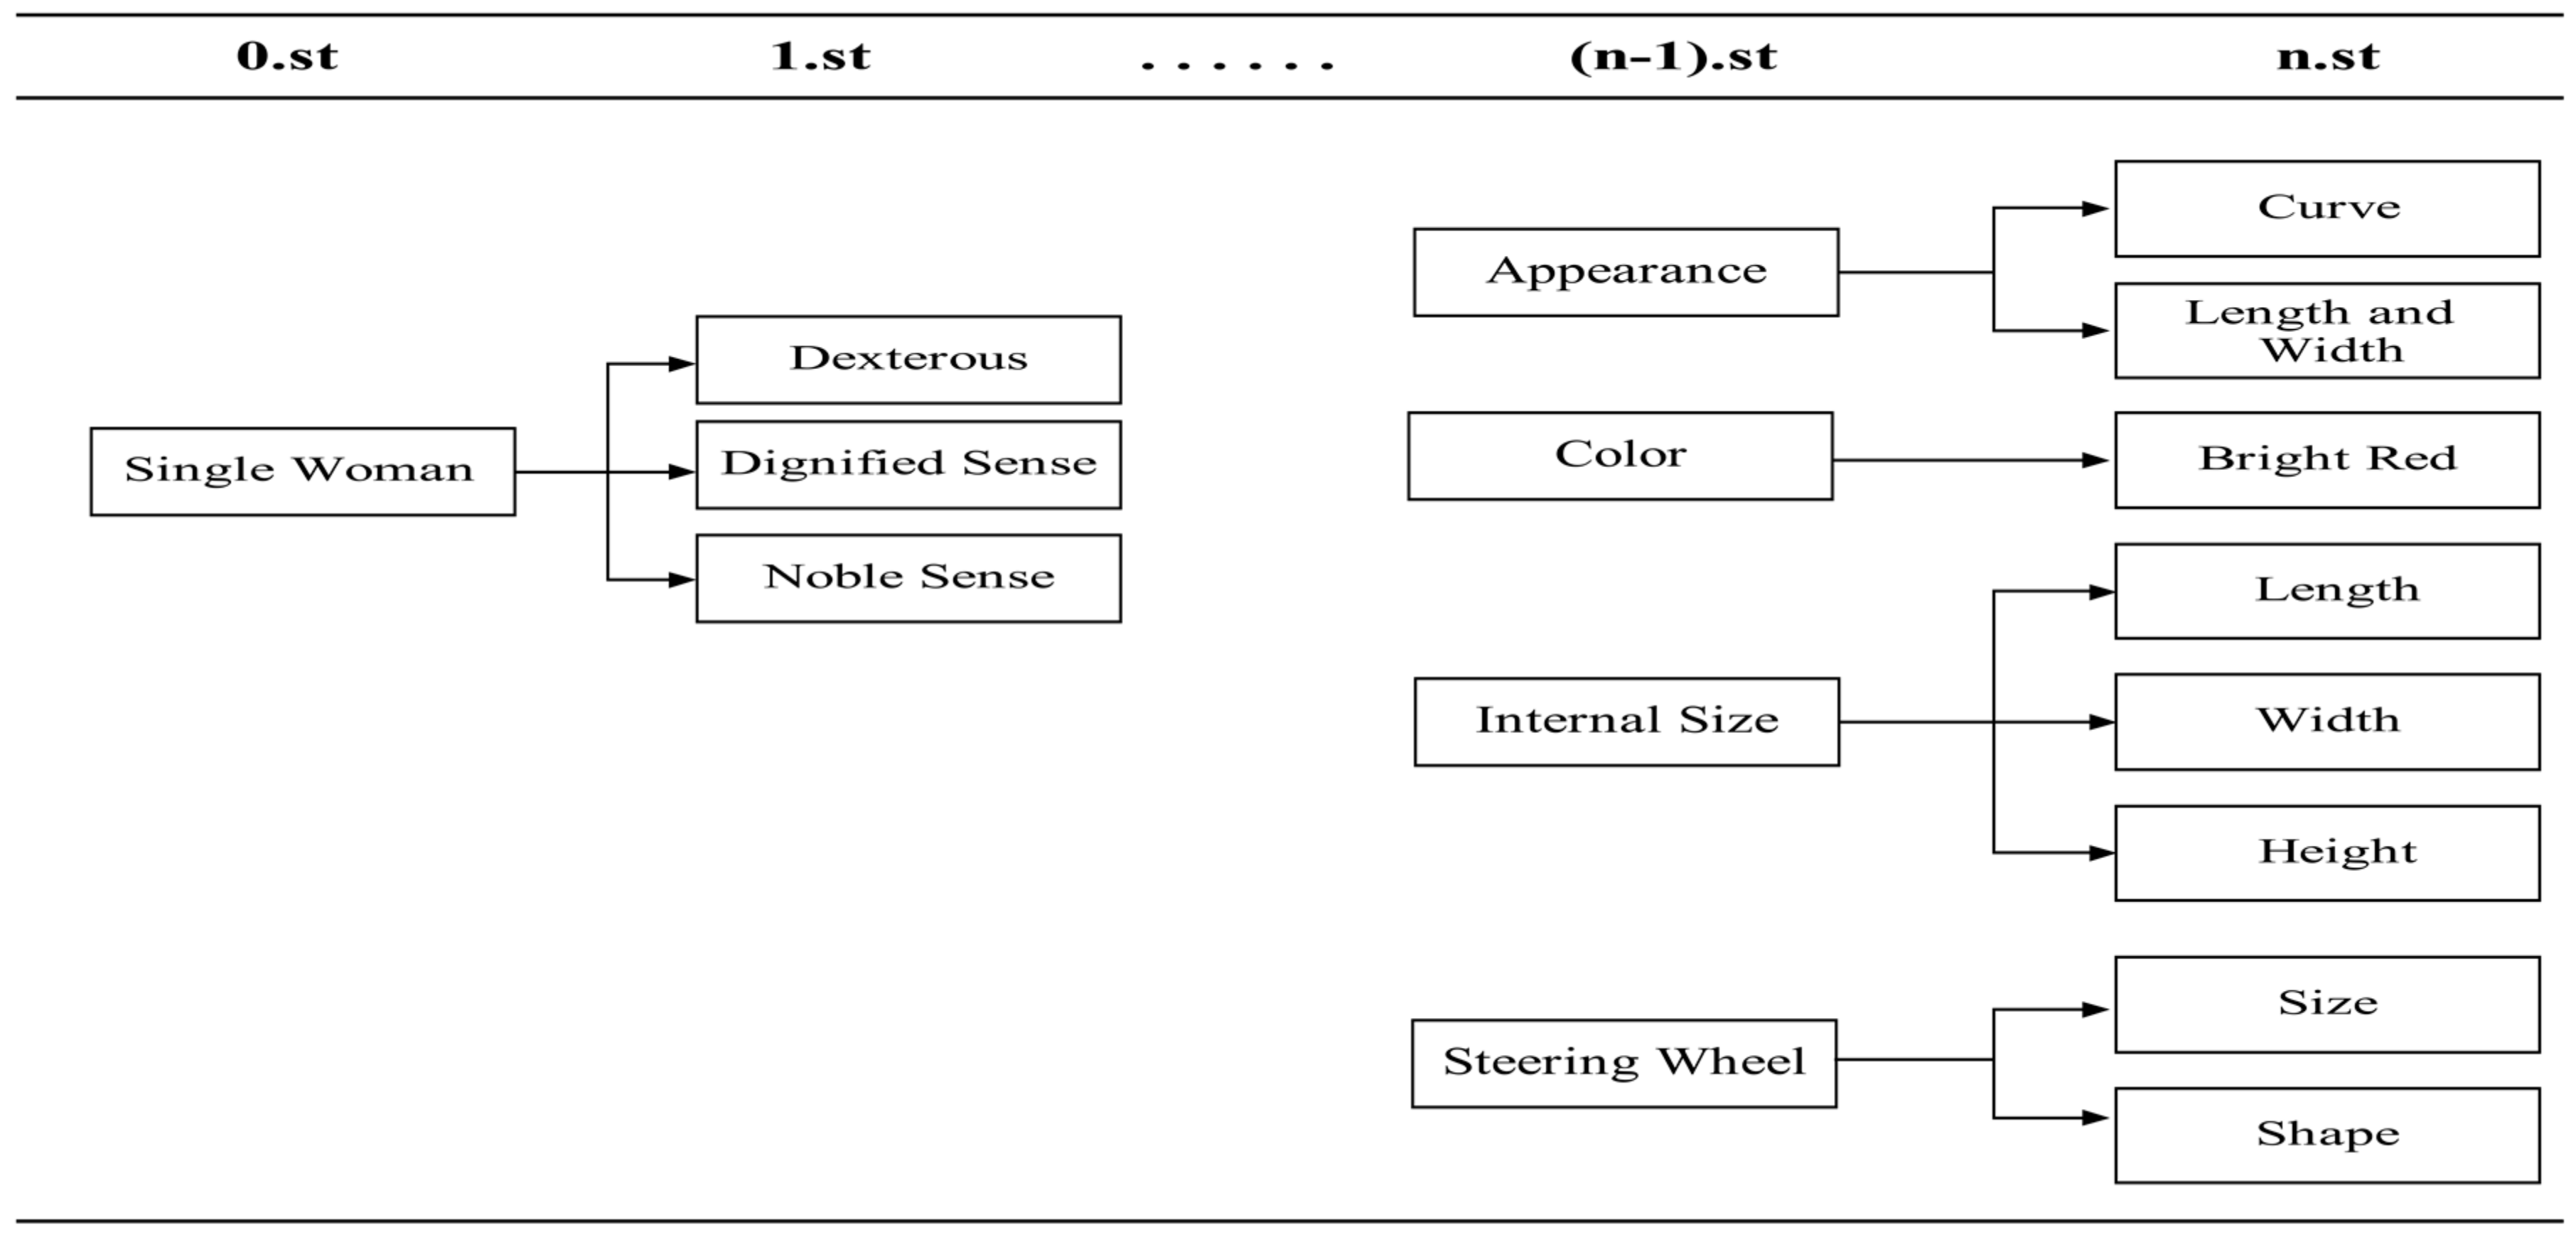
Figure 2.
The flow chart of affective engineering analysis.
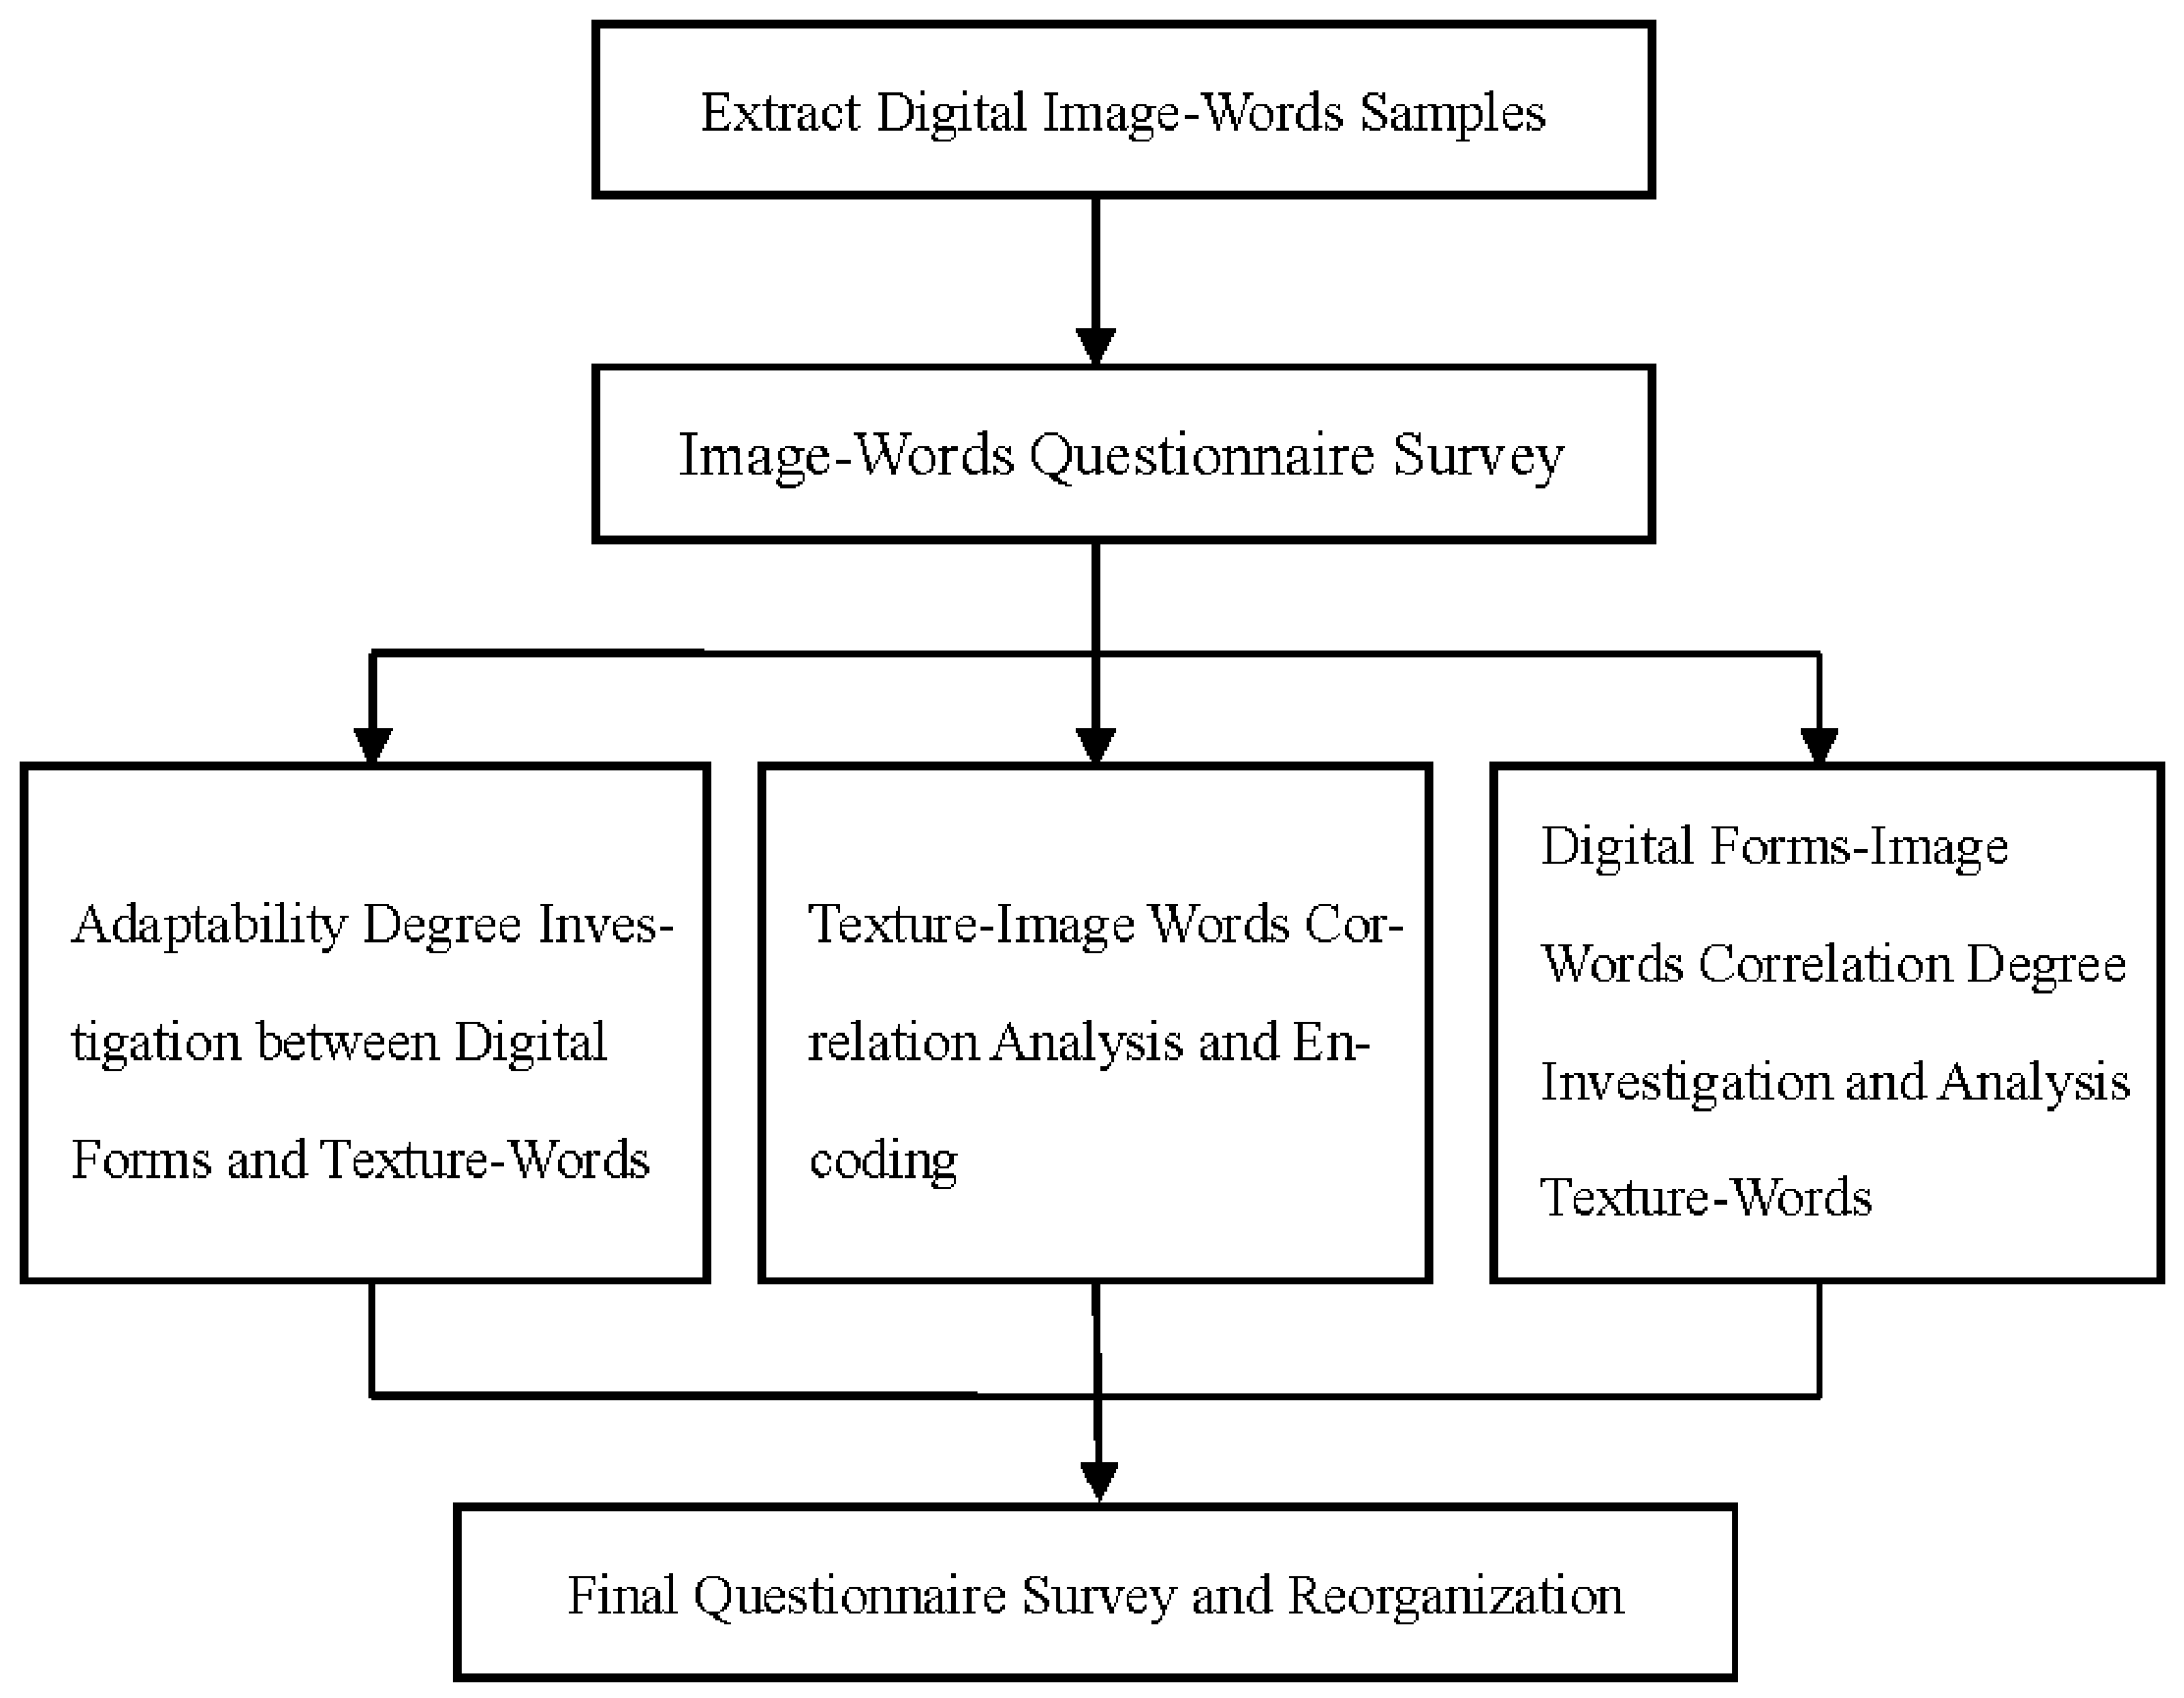
Figure 3.
The flow chart of development strategy of automatic form design system.

Figure 4.
Part of form samples of coffee cup.

Figure 5.
Extract coffee cup: the process of using digital signal process (DSP) technology to conduct the extraction of form factors Fi.
Figure 5.
Extract coffee cup: the process of using digital signal process (DSP) technology to conduct the extraction of form factors Fi.

Figure 6.
Design Image Scale Analysis (DISA) chart.
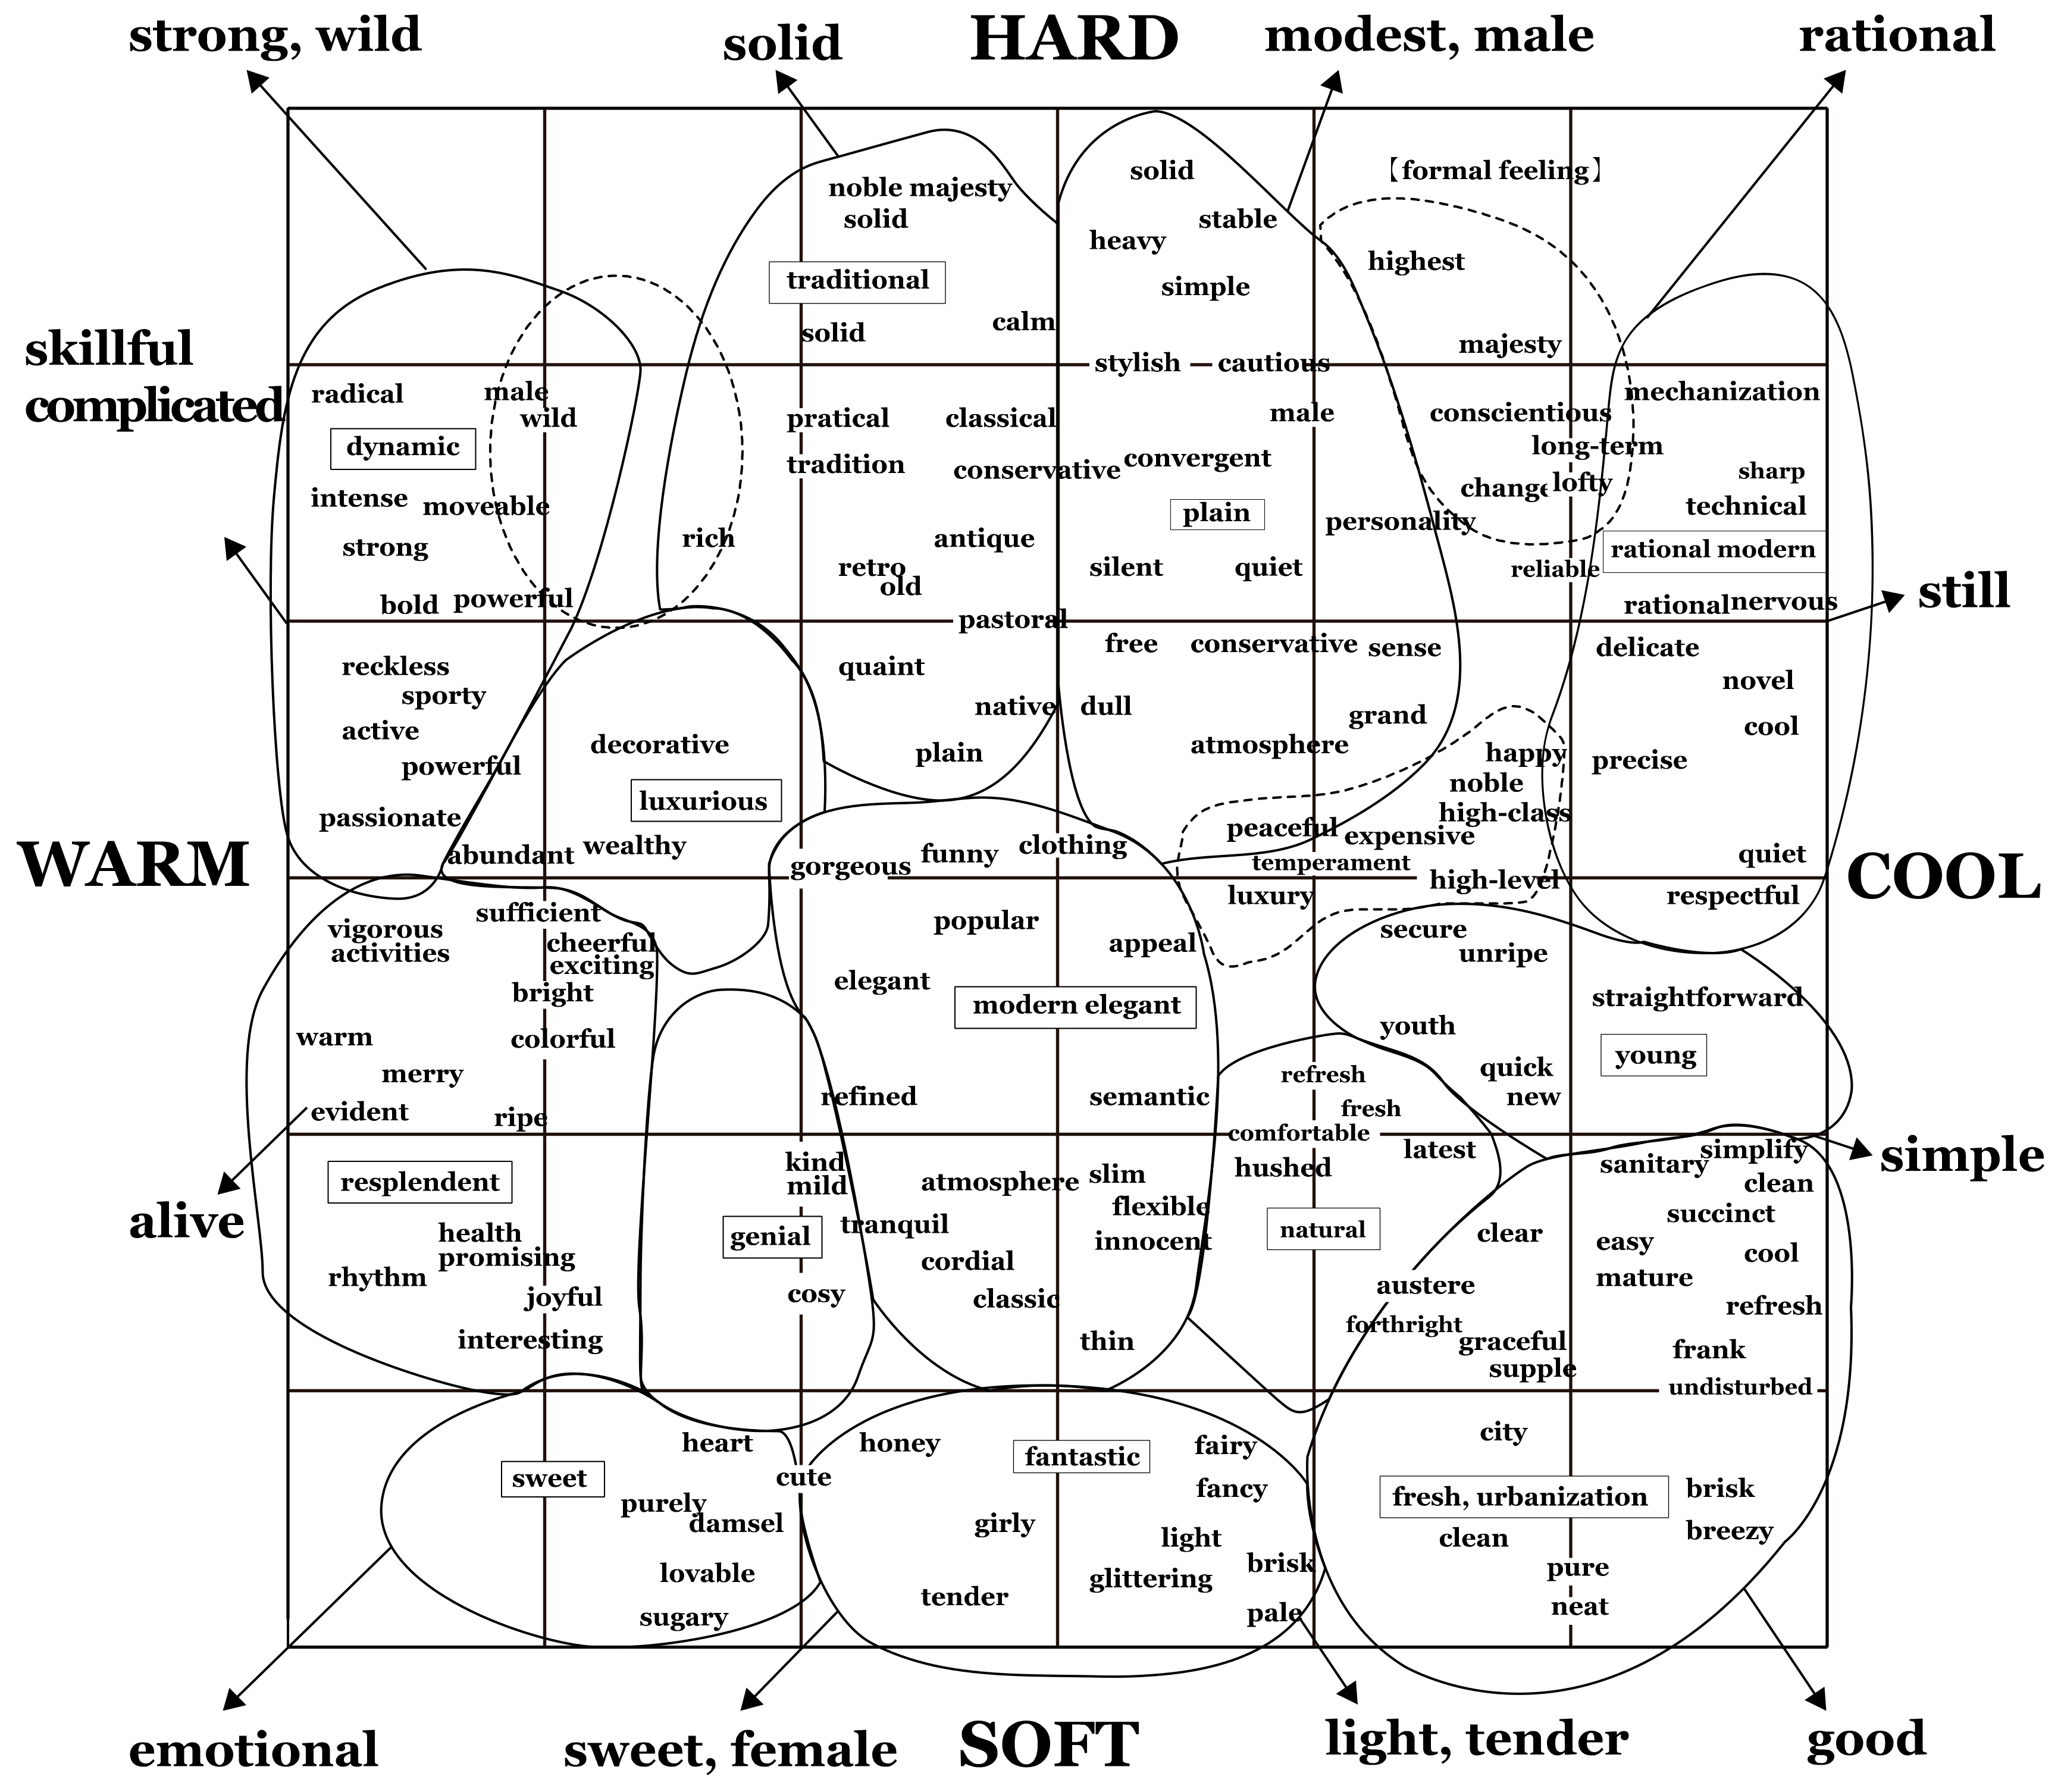
Figure 7.
Digital texture factor.

Figure 8.
The relational operation model of program development.

Figure 9.
Simply consider a selected word value as main input model.

Figure 10.
Simply consider multiple input word values as main set input models.
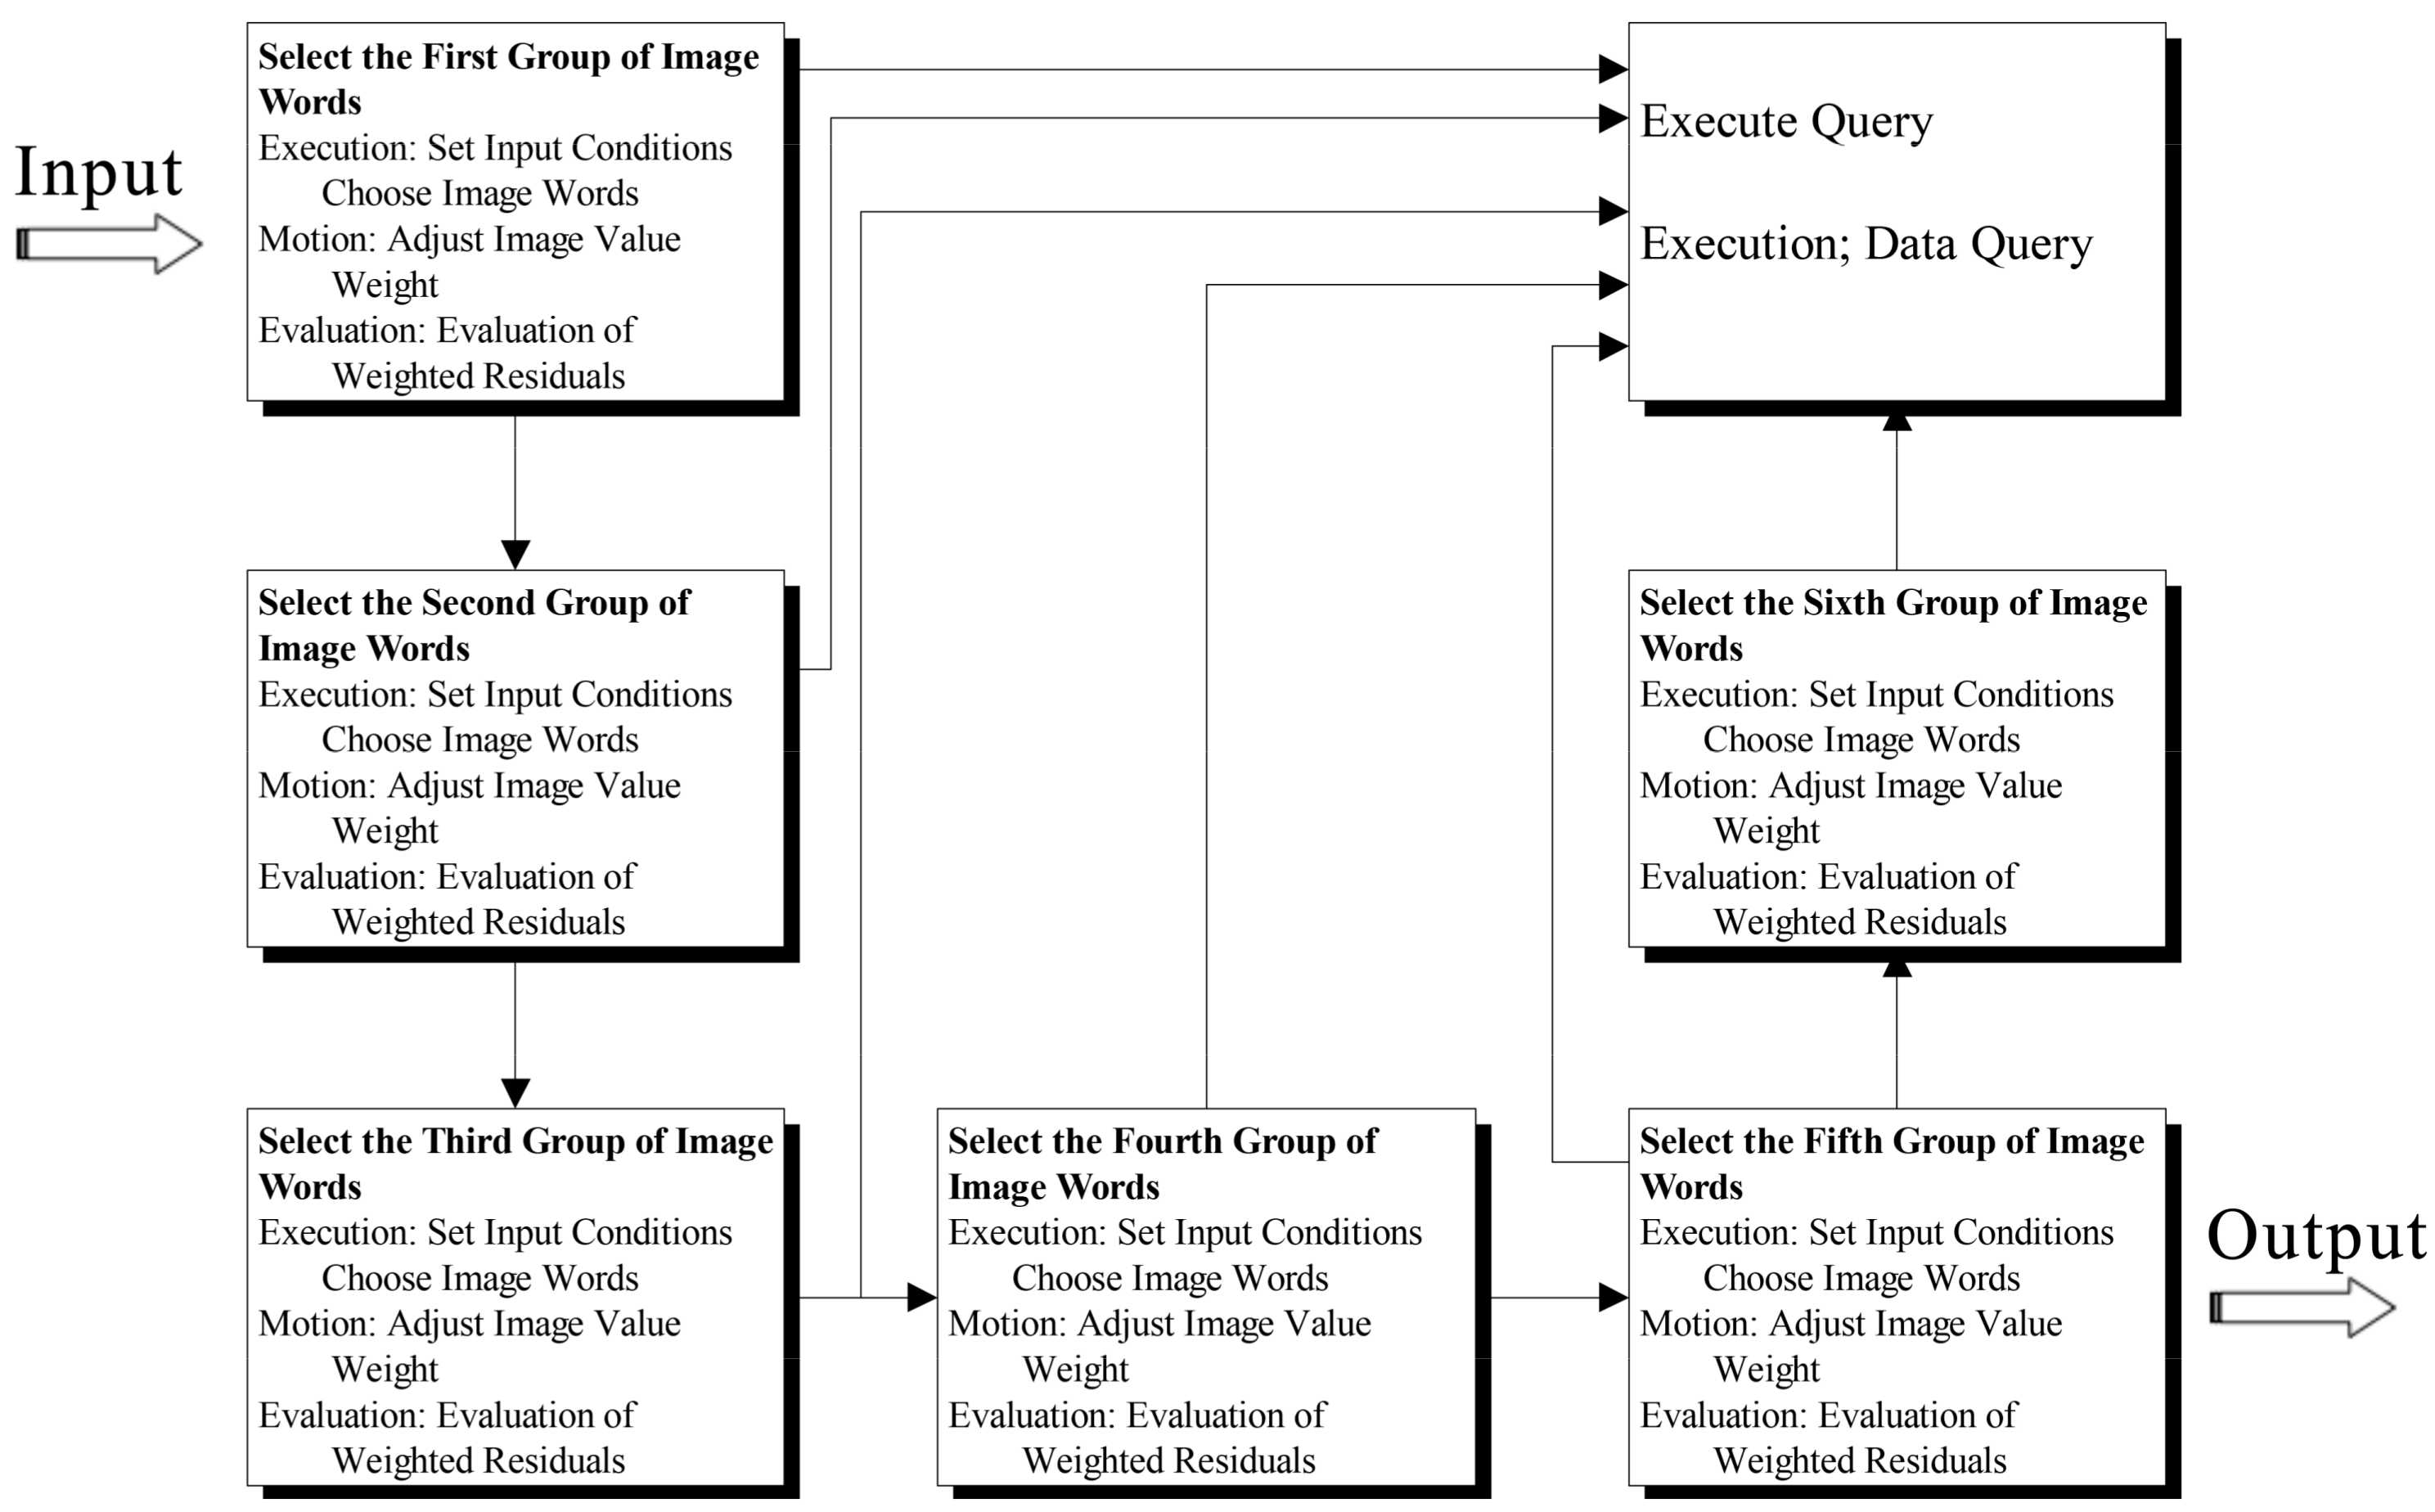
Figure 11.
Simply consider input word, form and texture as the main set models.

Figure 12.
The footage of item-choosing motions in executing operation of automatic form design interface.
Figure 12.
The footage of item-choosing motions in executing operation of automatic form design interface.

Figure 13.
The operation of program interface of automatic form design system.

Figure 14.
The Illustration Chart of Functional Sub-Areas of Master Program in Automatic Form System.
Figure 14.
The Illustration Chart of Functional Sub-Areas of Master Program in Automatic Form System.

Figure 15.
The Illustration Chart of Detailed Interface of Master Program.

Table 1.
The setting of grey correlation reference sequence of the digitals.
| Texture Factors | T1 | T2 | T3 | T4 | T5 | Form Value | |
|---|---|---|---|---|---|---|---|
| Design Factors | |||||||
| (V1) | 0.540 | 0.449 | 0.502 | 0.389 | 0.251 | 0.540 | |
| 0.674 | 0.365 | 0.587 | 0.510 | 0.278 | 0.674 | ||
| 0.395 | 0.401 | 0.552 | 0.374 | 0.377 | 0.401 | ||
| 0.511 | 0.510 | 0.575 | 0.455 | 0.494 | 0.575 | ||
| 0.619 | 0.448 | 0.391 | 0.490 | 0.291 | 0.619 | ||
| (V2) | 0.230 | 0.429 | 0.358 | 0.629 | 0.465 | 0.929 | |
| 0.302 | 0.505 | 0.377 | 0.620 | 0.420 | 0.620 | ||
| 0.165 | 0.581 | 0.316 | 0.584 | 0.529 | 0.584 | ||
| 0.207 | 0.540 | 0.487 | 0.541 | 0.654 | 0.654 | ||
| 0.363 | 0.740 | 0.419 | 0.600 | 0.429 | 0.740 | ||
| (V3) | 0.265 | 0.484 | 0.374 | 0.542 | 0.559 | 0.559 | |
| 0.360 | 0.526 | 0.469 | 0.641 | 0.576 | 0.641 | ||
| 0.380 | 0.550 | 0.487 | 0.621 | 0.497 | 0.621 | ||
| 0.204 | 0.505 | 0.514 | 0.740 | 0.588 | 0.740 | ||
| 0.306 | 0.520 | 0.500 | 0.500 | 0.520 | 0.520 | ||
| (V4) | 0.640 | 0.561 | 0.509 | 0.290 | 0.206 | 0.640 | |
| 0.638 | 0.491 | 0.597 | 0.410 | 0.198 | 0.638 | ||
| 0.510 | 0.544 | 0.422 | 0.235 | 0.137 | 0.544 | ||
| 0.537 | 0.506 | 0.508 | 0.275 | 0.274 | 0.537 | ||
| 0.750 | 0.553 | 0.572 | 0.270 | 0.290 | 0.750 | ||
| (V5) | 0.360 | 0.414 | 0.535 | 0.460 | 0.695 | 0.695 | |
| 0.528 | 0.410 | 0.613 | 0.600 | 0.756 | 0.756 | ||
| 0.391 | 0.362 | 0.657 | 0.545 | 0.813 | 0.813 | ||
| 0.500 | 0.361 | 0.634 | 0.396 | 0.779 | 0.779 | ||
| 0.421 | 0.404 | 0.537 | 0.460 | 0.746 | 0.746 | ||
| (V6) | 0.300 | 0.371 | 0.254 | 0.661 | 0.415 | 0.661 | |
| 0.400 | 0.357 | 0.456 | 0.651 | 0.595 | 0.651 | ||
| 0.309 | 0.410 | 0.315 | 0.620 | 0.604 | 0.620 | ||
| 0.370 | 0.424 | 0.464 | 0.600 | 0.712 | 0.712 | ||
| 0.322 | 0.460 | 0.474 | 0.661 | 0.660 | 0.661 | ||
| Reference Sequence Value of Texture Factor | 0.750 | 0.740 | 0.572 | 0.740 | 0.813 | ||
Table 2.
Affective-words correlation of digital design.
| V1 | V2 | V3 | V4 | V5 | V6 | Values | |
|---|---|---|---|---|---|---|---|
| 0.540 | 0.230 | 0.265 | 0.640 | 0.360 | 0.300 | 0.640 | |
| 0.674 | 0.302 | 0.360 | 0.638 | 0.528 | 0.400 | 0.674 | |
| 0.395 | 0.165 | 0.380 | 0.510 | 0.391 | 0.309 | 0.510 | |
| 0.511 | 0.207 | 0.204 | 0.537 | 0.500 | 0.370 | 0.537 | |
| 0.619 | 0.363 | 0.306 | 0.750 | 0.421 | 0.322 | 0.750 | |
| 0.449 | 0.429 | 0.484 | 0.561 | 0.414 | 0.371 | 0.561 | |
| 0.365 | 0.505 | 0.526 | 0.491 | 0.410 | 0.357 | 0.526 | |
| 0.401 | 0.581 | 0.550 | 0.544 | 0.362 | 0.410 | 0.581 | |
| 0.510 | 0.540 | 0.505 | 0.506 | 0.361 | 0.424 | 0.540 | |
| 0.448 | 0.740 | 0.520 | 0.553 | 0.404 | 0.460 | 0.740 | |
| 0.502 | 0.358 | 0.374 | 0.509 | 0.535 | 0.254 | 0.535 | |
| 0.587 | 0.377 | 0.469 | 0.597 | 0.613 | 0.456 | 0.613 | |
| 0.552 | 0.316 | 0.487 | 0.422 | 0.657 | 0.315 | 0.657 | |
| 0.575 | 0.487 | 0.514 | 0.508 | 0.634 | 0.464 | 0.634 | |
| 0.391 | 0.419 | 0.500 | 0.572 | 0.537 | 0.474 | 0.572 | |
| 0.389 | 0.629 | 0.542 | 0.290 | 0.460 | 0.661 | 0.661 | |
| 0.510 | 0.620 | 0.641 | 0.410 | 0.600 | 0.651 | 0.651 | |
| 0.374 | 0.584 | 0.621 | 0.235 | 0.545 | 0.620 | 0.620 | |
| 0.455 | 0.541 | 0.740 | 0.275 | 0.396 | 0.600 | 0.740 | |
| 0.490 | 0.600 | 0.500 | 0.270 | 0.460 | 0.661 | 0.661 | |
| 0.251 | 0.465 | 0.559 | 0.206 | 0.695 | 0.415 | 0.695 | |
| 0.278 | 0.420 | 0.276 | 0.198 | 0.756 | 0.595 | 0.756 | |
| 0.377 | 0.529 | 0.497 | 0.137 | 0.813 | 0.604 | 0.813 | |
| 0.494 | 0.654 | 0.588 | 0.274 | 0.779 | 0.712 | 0.779 | |
| 0.291 | 0.429 | 0.520 | 0.290 | 0.746 | 0.660 | 0.746 | |
| Affective Engineering Values | 0.674 | 0.740 | 0.740 | 0.750 | 0.813 | 0.712 | 0.813 |
Table 3.
Arrangement of order of grey correlation degrees for digital development.
| 0.72854 | 0.67067 | 0.62394 | 0.62297 | 0.62178 | 0.60071 | 0.60369 | 0.59974 | 0.59818 | 0.59742 | 0.59733 | 0.59697 | 0.59402 | 0.55402 | 0.55184 | 0.54983 | 0.54849 | 0.54121 | 0.52770 | 0.52405 | 0.51503 | 0.50443 | 0.50490 | 0.48985 | 0.45744 |
© 2018 by the authors. Licensee MDPI, Basel, Switzerland. This article is an open access article distributed under the terms and conditions of the Creative Commons Attribution (CC BY) license (http://creativecommons.org/licenses/by/4.0/).
Share and Cite
MDPI and ACS Style
Liu, C.-Y.; Tong, L.-I. Developing Automatic Form and Design System Using Integrated Grey Relational Analysis and Affective Engineering. Appl. Sci. 2018, 8, 91. https://doi.org/10.3390/app8010091
AMA Style
Liu C-Y, Tong L-I. Developing Automatic Form and Design System Using Integrated Grey Relational Analysis and Affective Engineering. Applied Sciences. 2018; 8(1):91. https://doi.org/10.3390/app8010091
Chicago/Turabian StyleLiu, Chen-Yuan, and Lee-Ing Tong. 2018. "Developing Automatic Form and Design System Using Integrated Grey Relational Analysis and Affective Engineering" Applied Sciences 8, no. 1: 91. https://doi.org/10.3390/app8010091
Note that from the first issue of 2016, this journal uses article numbers instead of page numbers. See further details here.