Near-Infrared Spectroscopy Applied to Complex Systems and Human Hyperscanning Networking


1
Research Unit in Affective and Social Neuroscience, Catholic University of the Sacred Heart, Largo Gemelli 1, 20123 Milano, Italy
2
Department of Psychology, Catholic University of the Sacred Heart, Largo Gemelli 1, 20123 Milano, Italy
*
Author to whom correspondence should be addressed.
Appl. Sci. 2017, 7(9), 922; https://doi.org/10.3390/app7090922
Submission received: 24 July 2017
/
Revised: 5 September 2017
/
Accepted: 6 September 2017
/
Published: 8 September 2017
Abstract
:Concepts and techniques developed to investigate complex systems have found practical implications in the study of many complex physical, biological, and social phenomena. Social neuroscience is coherently moving to new investigation and analysis approaches to properly explore social dynamics and to qualify neural processes that mediate and define them. The present paper aims to sketch a global picture of the application of the concept of synchronization to study complex social systems and the neural signatures of interpersonal coupling during interaction dynamics. We then focus on an innovative experimental paradigm—hyperscanning—that allows researchers to sample, compare, and integrate information flows related to the bodily activities of two (or more) individuals involved in a shared naturalistic or experimentally-controlled task, thus giving the opportunity to explore inter-individual synchronization and inter-brain coupling. In particular, the potential of functional Near-Infrared Spectroscopy (fNIRS) as a primary investigation tool in the field is discussed. Finally, we introduce the most-used quantification and analysis methods for hyperscanning applications.
1. Introduction
The traditional “one-person” approach to the study of human social abilities is now deemed to be too limited to properly investigate how our brains support us during real-life social interactions, thus allowing us to co-regulate and act together with other inter-agents. Recent theoretical and methodological advances have since underlined the importance of considering interacting agents as inter-dependent parts of a complex system in order to properly understand social behavior [1,2]. It has thus been suggested to directly explore inter-person synchronization and inter-brain coupling associated with social interaction dynamics while such dynamics take place, moving towards a “two-person” approach to the study of human social skills [3,4]. This a novel approach stresses the importance of understanding the inter-dependences between contexts and inter-agents. Two agents in interaction do not simply receive and send chunks of information, but influence each-other by modulating a bidirectional information exchange in real time and by co-regulating implicit and explicit aspects of their social behavior.
The application of concepts and techniques developed to investigate complex systems became—in particular in the last decade—more and more widespread, and constructs such as synchronization, entrainment, and dynamical coupling are now commonly used when presenting behavioral and bodily correlates of social interactions and when discussing the building blocks of social skills. New investigation and analysis approaches—such as hyperscanning—have coherently been devised to properly explore social dynamics and to qualify the neural processes that mediate and define them. The present paper is meant as an introductory theoretical-methodological paper on the application of the concept of synchronization to study complex social systems, and on the contribution of the functional Near-Infrared Spectroscopy (fNIRS) technique to do so. In particular, it first aims to sketch a global picture of the constructs of interpersonal synchronization and dynamical coupling as well as their implications in the investigation of the neural signatures of interaction dynamics.
We then focus on an introduction to the hyperscanning paradigm, which allows researchers to sample, compare, and integrate information flows related to the bodily activities of two (or more) individuals involved in a shared naturalistic or experimentally-controlled task, thus giving the opportunity to explore inter-individual synchronization and inter-brain coupling. Specifically, we discuss the potential of fNIRS as a primary investigation tool in the field. Finally, we introduce the most-used quantification and analysis methods for hyperscanning applications.
2. The Social Context and Social Dynamics as Critical Examples of Complex Systems
Complex systems can be defined as systems composed of subunits that might mutually affect each other, thus showing different grades of association and interdependency. The combination of interactions between the constituents of the complex system leads to the transient development of emergent properties that cannot be reduced to the properties of the constituents and that manifest by the creation of hierarchical and modular self-organized states [5]. Concepts and techniques developed to investigate such systems have found practical implications in the study of many complex physical, biological, and—relevant to the present work—social phenomena.
During social interactions, indeed, multiple agents share an environment that they can interact with and are part of articulated dynamics that can be modeled by actual exchanges between them and by contextual factors. As a result of such exchanges, they share information, create emergent inter-subjective meanings, and intentionally modify and act upon the shared social context. This is true for both face-to-face and mediated communication. Besides being a pervasive phenomenon that frames the vast majority of human everyday activities, social exchanges are a critical example of complex system dynamics. Trying to account for such intrinsic complexity, social neuroscience research recently tried to find new ways to capture the essence of such phenomena and to qualify neural processes that mediate and define them.
The first tentative accounts trying to model complex interacting social systems come from the philosophy of mind. Searle, in particular, faced the question of modeling collective actions and proposed a theoretical model to explain how shared intentions develop and to identify their link with individual intentions [6]. By studying multi-agent behavior, he realized that the mere sum of x individual intentions or z individual actions cannot account for the collective intentional behavior. A simple summative account indeed lacks explicative power and does not do justice to the complexity of the phenomenon. Then, he concluded that the distinctive feature of a collective action cannot be found at the physical level, but has to be a mental component. That component is represented by a collective intention: a complex form of strategic plan that overarches individual specific intentions and behaviors and coordinates them towards the shared goal.
While Searle’s and subsequent theorizations had the merit of suggesting that interacting agents form a complex system characterized by specific attributes that emerge thanks to the interaction (e.g., interpersonal syntonization or collective intentions), the latest research lines in social neuroscience now aim to describe and measure such attributes.
According to Di Paolo and De Jaegher [7], a social interaction is “the autonomous engagement that can emerge between two or more autonomous agents who are mutually regulating their dynamical coupling” (p. 4). The authors embraced the enactive approach to life and mind [8], so with the term “coupling” they mean unidirectional or mutual dependence between the laws of transformation of states in one of the interacting entities and the state variables of the other(s). Following this line, investigations of inter-individual syntonization and behavioral synchronization have been matched up with the quantification of inter-brain coupling.
3. The Origins of Synchronization Studies
Classically, the study of synchronization had to do with the progressive adjustment of the rhythmic behavior of autonomous periodic oscillators as a consequence of their weak interaction [9]. The first definition and report of the such phenomenon dates back to the 17th century, when the Dutch scientist Christiaan Huygens noted that two pendulum clocks hanged on a shared wooden beam started, after a while, to tick in unison and the motion of their pendulum was in complete agreement. Further, the tendency to coordinate was so strong to re-establish quite quickly following external interferences. In that specific case, the interaction was supported by the wooden beam, which acted as a medium for the transmission of kinetic energy between the clocks. Similar phenomena were successively reported even with respect to other oscillatory phenomena, such as sound. Lord Rayleigh observed synchrony between different organ pipes and, in the 19th century, William Strutt observed that the sound of two organ pipes can be attenuated if they generate the same pitch and timbre and are placed too close to each other.
Synchronization can then be deemed as an emerging feature of (at least) two non-identical oscillator systems—whose activity over time can be described in terms of specific combinations of phase, amplitude, and frequency components (i.e., Fourier series)—which begin to oscillate with an overlapping frequency profile. To date, similar conceptions have been applied even to study the behavior of complex chaotic systems, such as brains [10,11], in interactions. In this specific case, when two or more chaotic systems characterized by different natural frequencies do interact, it is possible to observe the entrainment of their mean frequencies while amplitudes remain chaotic and only weakly correlated [9]. Thus, cross-correlation and coherence analyses have been used to try to quantify the coupling of phase and frequencies between the brain activity of interacting people, in order to detect a physiological signature of interpersonal synchronization within the complex individual pattern of neural activity.
4. Synchronization and Dynamical Coupling in Human Interactions
From the human system perspective, sometimes referred to as interpersonal entrainment, the phenomenon of interpersonal synchronization proved to be present at different levels of interaction dynamics, from behavior to neurophysiological variables. As suggested by Repp and Su [12], it is possible to distinguish different manifestations of such phenomenon: intentional, unintentional, and spontaneous. While intentional interpersonal synchronization can be observed when participants deliberately decide to act together and then synchronize their movements or are involved in a common task where they have to consciously synchronize, unintentional and spontaneous interpersonal synchronization can be observed in the absence of any conscious intention to act similarly. They differ in the fact that unintentional interpersonal synchronization is a form of emerging behavioral coordination, even if the performed task discourages synchronization or if participants are asked not to coordinate, whereas spontaneous interpersonal synchronization can be easily observed when participants’ behavior is not constrained by any explicit instruction related to coordination.
The outcomes of those pervasive synchronization processes have been traditionally detected by looking at synergies in movements [13,14], posture [15], breathing cycles, heart rates and autonomic responses [16,17], and even central nervous system activity [1,18,19]. Synergies at those levels are commonly quantified using metrics based on correlation, coherence, and phase attraction analyses.
5. The Hyperscanning Paradigm
In order to properly perform similar integrated analysis of the structure of recorded signals, it is important to collect them concurrently and simultaneously. Technical and computational advances occurred in the last few years have allowed researchers to devise, test, and share novel methodological and analytical approaches that have allowed them to overcome previous limitations and to accurately sample, compare, and integrate different information flows related even to the brain activity of two (or more) individuals [20,21]. Such an approach has been defined as hyperscanning and is based on the simultaneous recording of the bodily activities of interacting agents in real-time, i.e., while social dynamics develop.
The hyperscanning approach has been applied via functional Magnetic Resonance Imaging (fMRI) [22,23,24], electroencephalography (EEG) [18,20,25], magnetoencephalography (MEG) [26,27,28], and functional Near-Infrared Spectroscopy (fNIRS) [4,19,29,30,31,32,33]. Independently from the data recording technique that is actually used, one of the methodological issues that is mostly stressed and discussed in hyperscanning research is the temporal synchronization of data series. Given the primary aim of such an experimental approach and the intrinsic meaning of the metrics that are consistently computed, the time course of biosignals recorded from different participants critically needs to be consistently and accurately tracked. Since the individual contribution of co-agents to complex social dynamics occurs concurrently and since—notably—it is modulated in real-time depending on the continuous flow of information between subjects and on behavior co-regulation, any attempt to sample physiological processes supporting such phenomena has to be comparably precise and sensitive to quick fluctuations. That would foster the creation of a sufficiently realistic picture of the correlates of social exchanges. Nonetheless, as noted even by Bilek and colleagues [24], the advantages of precise overlapping and synchronicity of the time courses of participants’ biosignals may be partially reduced by the limited time resolution of specific techniques, such as fMRI, due to sampling constraints and to the slow time course of the physiological processes they track (e.g., the rise and fall of the blood oxygen level-dependent (BOLD) response).
Because of that, electrophysiological techniques—i.e., EEG-based investigations—are thought to be peculiarly apt and promising. Indeed, they are characterized by fine-grained sensitivity to subtle changes in brain states and by high time resolution [34]. Still, the very same reason why such techniques present such notable precision with regard to time—namely, the link to fast electromagnetic correlates of neural activity—also leads to their known limited spatial resolution. Electrical biosignals, indeed, tend to smear, attenuate, and spread across biological tissues [34,35]. In order to try and overcome some of the limitations of traditional neuroimaging and electrophysiological techniques, hyperscanning research has recently moved to fNIRS-based investigations (see Figure 1), which show a good balance between spatial and temporal resolution [36,37,38].
6. Optical Imaging and Methods for fNIRS Hyperscanning Applications
Similar to fMRI, Positron Emission Tomography (PET), and Single-Photon Emission Computed Tomography (SPECT), optical imaging is a form of indirect hemodynamic imaging techniques. The measurement of neural activity indeed grounds on fluctuations of oxygenated and deoxygenated hemoglobin in the cerebral blood flow instead of being directly based on electromagnetic properties of active neurons. In particular, the physiological phenomenon at the basis of hemodynamic techniques is neurovascular coupling [39,40], which describes the link between functional activity, energetic and metabolic demands, and cerebral blood flow. Getting down to specifics, when a neural population activates to process information in response to external or internal events and stimuli, it consumes oxygen molecules extracted from local blood supplies. This initial consumption of local resources leads to an increased concentration of deoxygenated hemoglobin (HHb) and a relative decrease of the concentration of oxygenated hemoglobin (O2Hb). In order to compensate for such physiological changes, afferent blood flow is increased following the localized dilation of cerebral blood vessels. This increase of the blood supply exceeds the needs of neuronal oxygen consumption, and then leads to another localized unbalance between the concentration of oxygenated/deoxygenated hemoglobin molecules, with a notable increment of the first and a decrement of the latter. Besides being the constituents of blood oxygenation level-dependent (BOLD) signal, such physiological modulations are tracked via optical imaging by taking advantage of differences in optical and light absorption properties of chromophores within molecules constituting different biological tissues.
Functional Near-Infrared Spectroscopy (fNIRS), in particular, uses specific near-infrared light radiations (range: 650–950 nm) to quantify the concentration of different biological elements—such as hemoglobin—in tissues such as skin, muscles, and cerebral cortex. Those wavelengths do indeed define radiations that are primarily absorbed by hemoglobin while skin, bone, and other tissues are mostly transparent to them. Furthermore, by using multiple single wavelengths it is possible to independently obtain specific pieces of information on the amount of hemoglobin in its two states (O2Hb vs. HHb) that is present within the transilluminated area of tissue [41,42,43].
In applications of fNIRS to investigate brain functioning, scalp skin is usually illuminated by laser diodes or light emitting diodes (LED), in order to grant accuracy of stimulation and control over the amount of emitted energy. Light then travels through surface and cortical tissues and is then recaptured by highly-sensitive detectors, usually constituted by glass fibers. Pairs of light sources and detectors constitute fNIRS recording channels. They are commonly placed at fixed distances depending on technical requirements of the used system and on methodological factors linked to the intended recording resolution. It is worth noting that near-infrared light follows a curve trajectory when travelling through biological tissues and is then commonly deemed to shows a penetration depth of about one half of the distance between the source-detector pair. Given that this distance is usually approximately 3–4 cm (also depending on the system), fNIRS is thought to show a penetration power of about 2 cm, sufficient to reach cortical tissues layers. For further in-depth discussion of the technical details of fNIRS recordings, we suggest the following reviews: [36,37,43,44,45]. The position of sources and detectors is usually reported by referring to the 10-10 or the 5-10 International Systems for electrode placements [46,47]. By increasing the number of recording channels, it is possible to improve the spatial sampling of hemodynamic changes associated with brain function and, thanks to advanced processing algorithms, even to create 2D or 3D reconstructions of the blood perfusion within the cortex and of associated neural activations.
As for time resolutions, latest fNIRS systems allow for recording from multiple channels with a relatively good sampling rate (up to 100 Hz, even if it is typically limited to around 6 or 10 Hz). While the slow nature of measured biosignals limits the time-domain information that can be obtained, advances in signal processing methods and experimental designs might allow for effectively recording informative signal changes in the order of hundreds of milliseconds [48]. It is important to note, however, that such progresses in hemodynamic signal processing and their application to optical imaging are still a matter of limited experimental testing. Given the localized and circumscribed distribution of hemodynamic modulations and the sensitivity of the technique, fNIRS spatial resolution is usually reported in the centimeter range (≈1 cm), with a tissue penetration potential of about 2 cm—enough to reach cortical layers [43]. It is, however, worth noting that the actual spatial resolution of an fNIRS recording also depends on specific methodological and technical aspects, such as the recorded scalp/cortical regions that are transilluminated, the source-detectors distance, and settings of the recording system.
In order to properly organize, split, and integrate emitted and recaptured light signals, fNIRS systems include a multiplexer. With the increasing complexity of optical imaging systems, such an element became even more important, since it allows for the coordination of data flows from multiple recording channels measuring hemoglobin modulations from multiple points on the scalp (and then different cortical areas) in a single device. Some fNIRS-based hyperscanning studies [4,30,31,49] took advantage of this potential and of technical features of optical imaging systems to overcome two known methodological issues: synchronization of different devices and potential differences in their sensitivity. Since fNIRS recordings are reference-free—contrary to EEG recordings, which require individual isoelectric reference sensors to compute differential waveforms—it is then possible to connect two individuals to the same recording system, by splitting light sources and detectors between them. This solution prevents potential issues concerning the comparability of different systems calibration and the lack of synchrony between the time courses of data recoded from different co-agents.
In addition, with respect to EEG, fNIRS can be similarly used in event-related experimental designs, but its measurement benefits from a greater spatial resolution, though limited to cortical structures [36,44,45]. Indeed, the recording of electrical biosignals—such as in EEG—is known to be negatively affected by attenuation and smearing. These phenomena are due to the electrical nature of the recorded signals, since electrical activity tends to spread out through conductive medium such as biological tissues. Further, the fact that different biological tissues show different electrical conductivity makes the problem of spatial resolution and the localization of EEG data even more complex. While source localization techniques offer a notable opportunity to locate the source of scalp-recorded EEG data, spatial resolution still strongly depends, even in that case, on the distribution and density of spatial sampling (i.e., the placement and number of recording channels), and localization data represent an estimate of the most probable solution to the inverse problem. Moreover, spatial localization is commonly deemed as a weak point of the EEG technique, because scalp-recorded data are the outcome of electric activity potentially generated in various points of the brain, and thus potentially mirroring the summation of the contribution of different systematically-active structures. fNIRS applications, instead, take advantage of the circumscribed distribution of hemodynamic modulations due to neurovascular coupling and of the specific sensitivity of optical measurement to even the slightest changes in both oxygenated and deoxygenated hemoglobin in the capillary components of cortical tissues. Thus, while the actual spatial resolution of an fNIRS recording partially depends on specific aspects of data recording and on the optode montage that is used, the technique allows for the sketching of finer-graded pictures of cortical activations with respect to the majority of EEG applications, even if the two techniques share the coordinate systems used to place sensors. In addition, similar to EEG but differently from other neuroimaging methods, fNIRS is both easy to use and always more cost-effective, thanks to ongoing progresses in the development and miniaturization of recording systems.
Again, when compared to fMRI-based investigations, fNIRS offers the unique opportunity to track changes of oxygenated, deoxygenated, and total hemoglobin, and not only of a single or compound measure [37,44]. Future investigations might capitalize on this richness of information to better define and differentiate between physiological, non-specific, and task-driven changes of cortical hemodynamics during interaction via optical imaging. Moreover, with respect to fMRI, PET, and SPECT, fNIRS measurement is robust against environmental exogenous noise and has a greater temporal resolution [44]. Indeed, while still poorer than electrophysiological techniques, the time resolution of optical imaging in terms of sampling rate is greater than that of other traditional imaging techniques (such as fMRI and PET). By increasing the sampling rate, by implementing specific methodological expedients, and by aptly designing experimental tasks, it seems indeed possible to track fast modulations of brain activity via optical techniques even in the sub-second range, even though such advanced applications are still a matter of debate and experimental testing.
Finally, it is worth noting that fNIRS is deemed as a promising technique in the field of hyperscanning research due to the advantage of being easily complemented by other neuroscientific measures, to its remarkable usability, and to the opportunity to make recordings more ecological [36,37,44,50]. Indeed, if compared to alternative techniques such as EEG and fMRI, optical imaging allows for the measurement of brain activity in more natural real-life situations, since it imposes considerably milder physical constraints (e.g., staying still) and psychological-physiological burdens (e.g., injection of radioactive agents) than other imaging techniques. fNIRS considerably reduces limitations concerning participants’ posture and bodily movements, since they are not requested to lie down and remain still in a scanner and since sources and detectors are placed on a recording cap, as in EEG recordings. Freedom to act and the opportunity to implement face-to-face settings allow for the investigation of realistic interaction dynamics and prevent misrepresentations of the complexity of interacting systems. In addition, fNIRS recordings are thought to be more robust against muscular and head motion artefacts and against external electromagnetic noise when compared with EEG and fMRI [44,51]; this is a critical characteristic, in particular, for formal investigation of naturalistic social dynamics and unconstrained interactions.
Nonetheless, as underlined by Scholkmann and colleagues [38], some methodological and technical limitations of fNIRS recording (with regard to both single-brain and hyperscanning applications) still have to be properly tackled. Namely, potential recording biases due to the confounding influence of superficial blood perfusion might affect measured hemodynamic signals. To control for or to reduce such potential bias, specific signal processing and hardware expedients (e.g., spring-loaded sensors able to keep good sensor-skin contact or manipulation of the ideal source-detector distance) are being developed and tested. Further, as mentioned above, the technique only allows for an exploration of the activity of cortical structures, with no possibility to directly measure the contribution of subcortical structures. Such a limitation is structural and cannot be overcome. It then has to be taken into account when devising fNIRS-based investigations. Again, the technique is based on the measurement of hemodynamic responses and, thus, its ability to finely follow the subtlest and quickest modulations of neural activity is poorer with respect to hyperscanning applications based on electrophysiological techniques. Finally, it is important to acknowledge that even if fNIRS recordings are robust against motion artefacts, broad body movements (e.g., sudden postural changes) might still induce confounding events due to venous pooling or orthostatic hypotension [51].
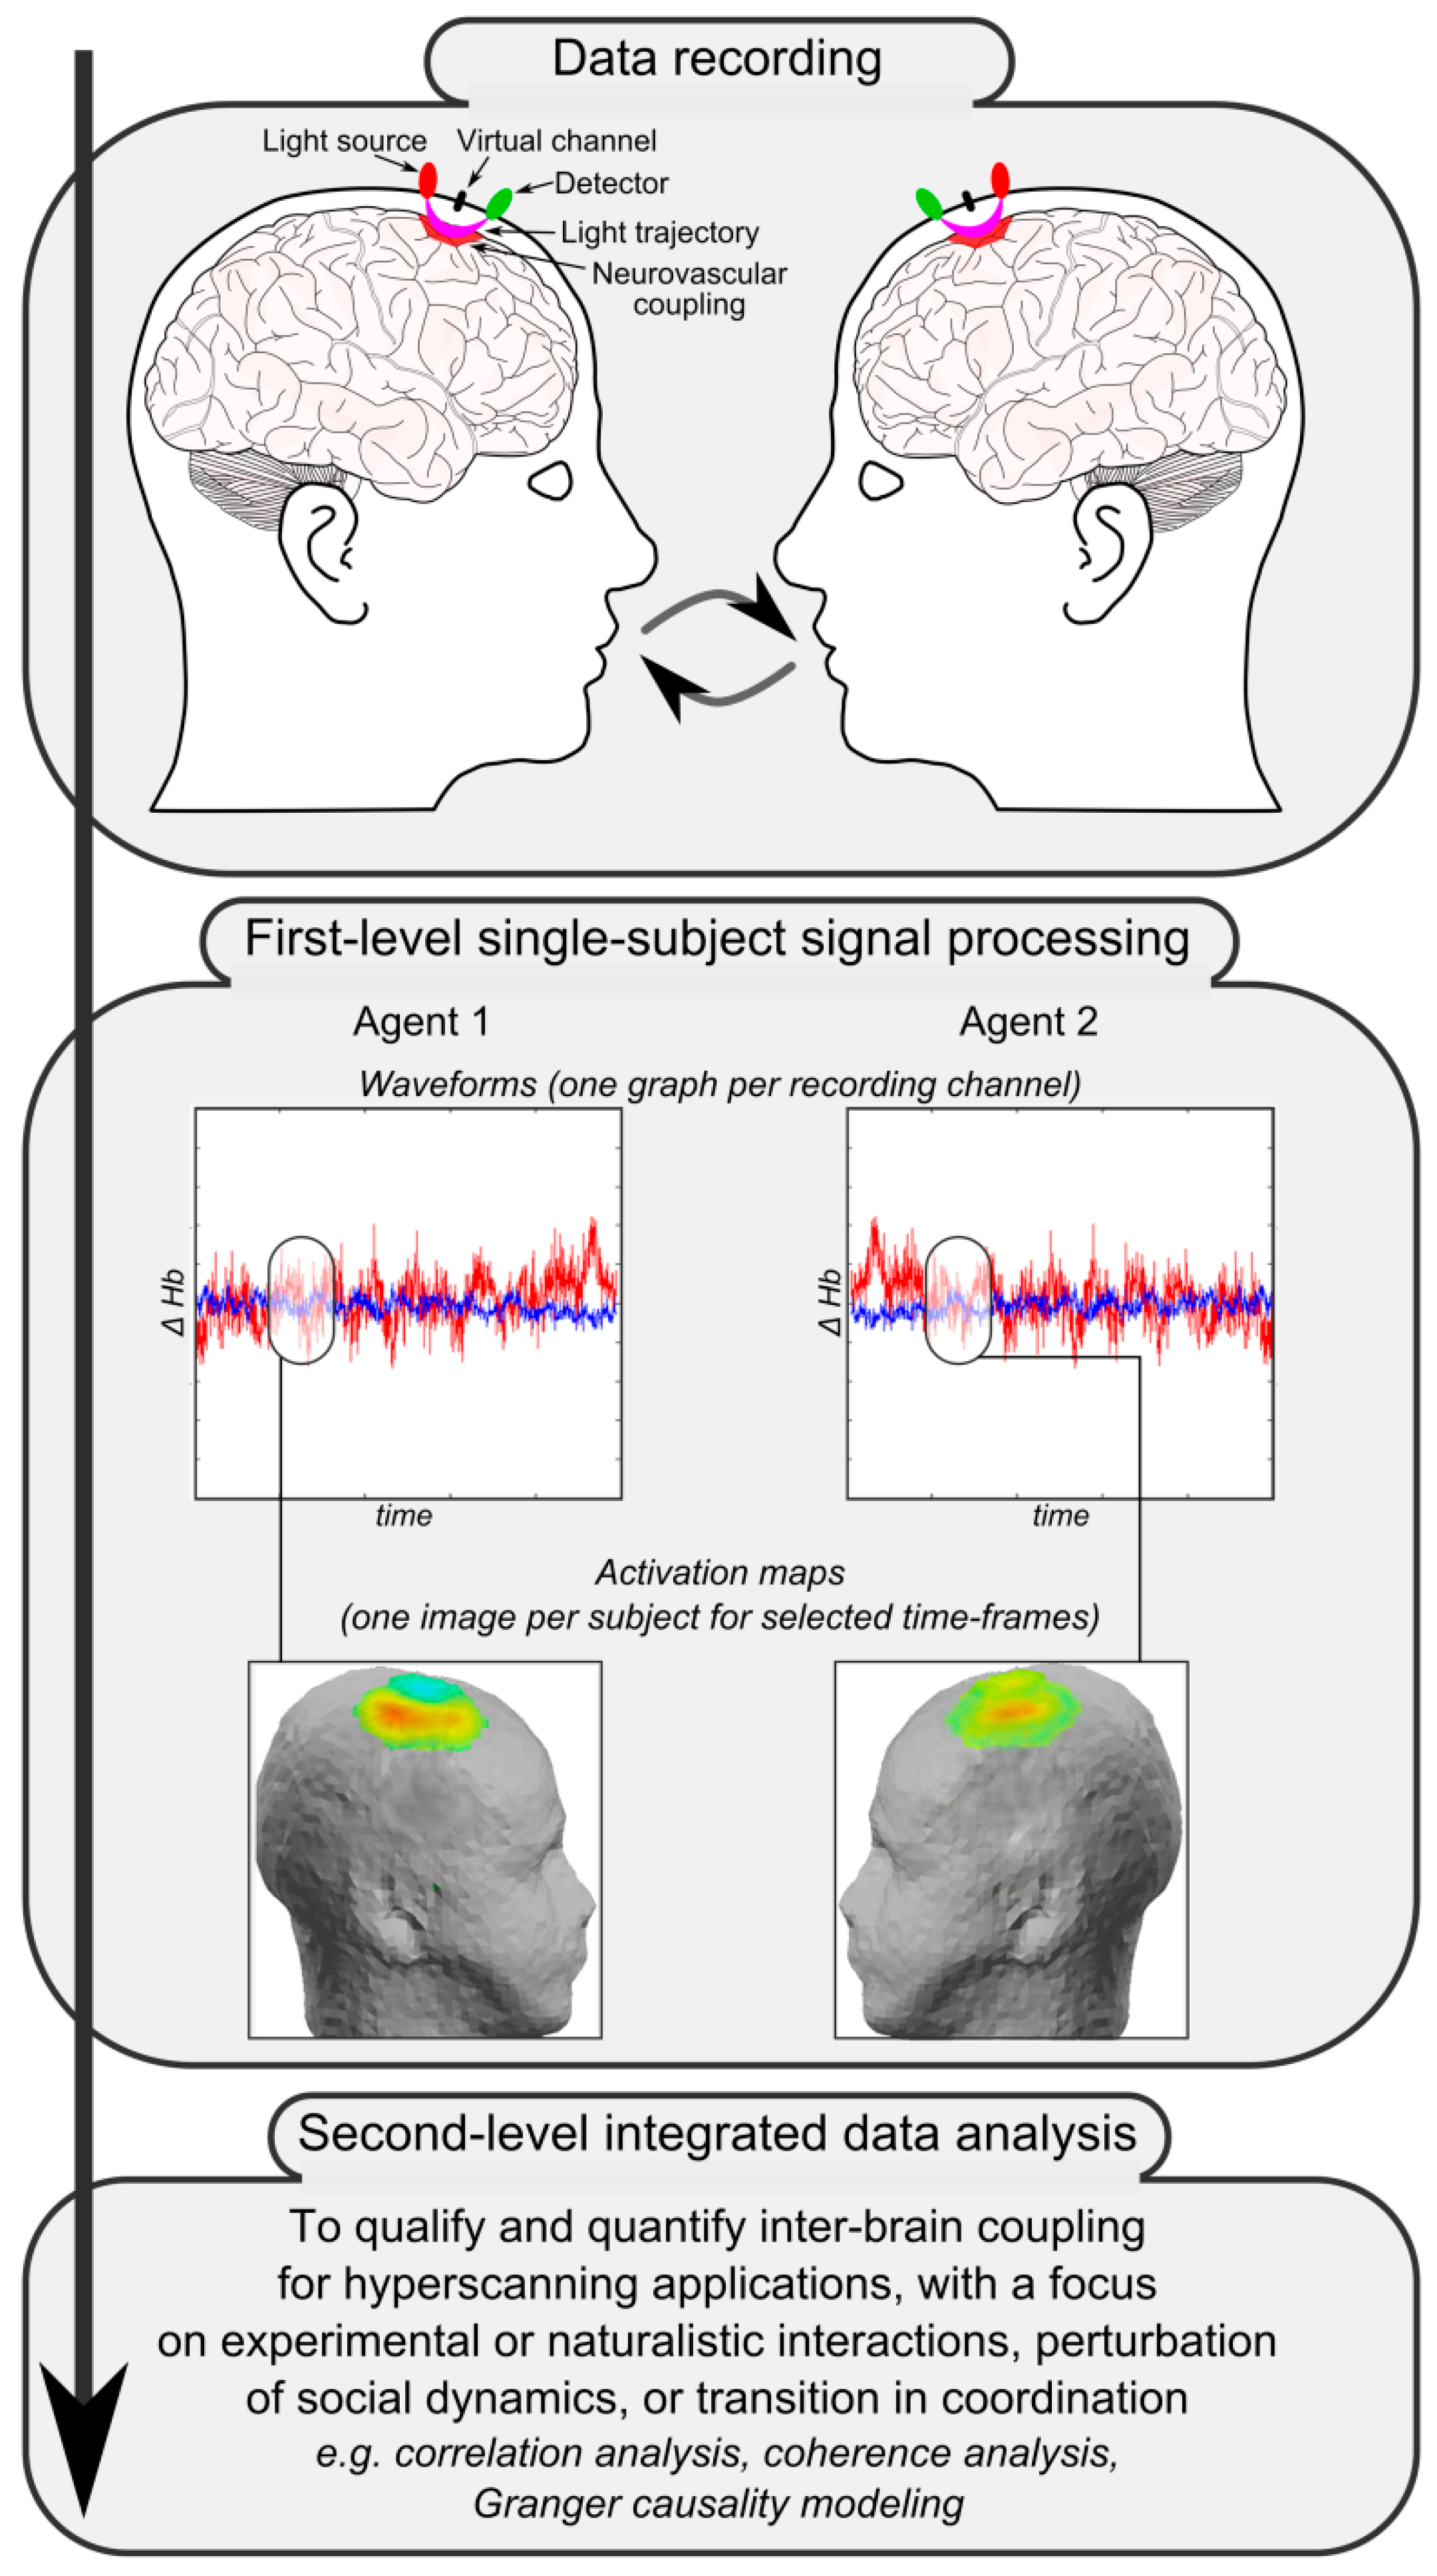
Figure 2 reports a simplified schema of the main steps for fNIRS-based hyperscanning applications. The first crucial step is data recording. Apart from the setup of the recording system and the accurate placement of light sources and detectors thanks to adjustable caps or rubber bands, the most critical point is the design of an appropriate shared task or the definition of a significant naturalistic interaction. Given the complexity of investigated phenomena, functional correlates of social processing and interaction dynamics are indeed maximally informative when they relate to knowable or well-devised situations. Collected raw biosignals then have to be processed separately for each participant to obtain individual channel-specific waveforms—which represent local fluctuations of oxygenated, deoxygenated, and total hemoglobin across time due to neurovascular coupling—and individual activation maps—which usually depict the distribution and topography of hemodynamic changes in selected time frames over a head or brain model (first-level single-subject signal processing). Finally, single-subject data and individually-computed indices mirroring hemodynamic activity are integrated, matched, and compared to qualify and quantify inter-brain coupling and to investigate associations and dependencies between the cortical activity of interacting participants (second-level integrated data analysis).
Methodological Remarks on Integrated Data Analysis: Primary Indices and Statistical Issues
As underlined by Babiloni and Astolfi [21], the availability of a complex set of data constituted by the recording of brain activity from multiple co-acting or interacting individuals allows for the investigation of not only the association or dependence between brain activity and behavior within each agent (first-level analyses), but also the investigation of associations and dependencies between brain activity of various inter-agents (second-level integrated analyses, see Figure 2). Such an opportunity, however, opens new questions on proper analysis tools and approaches to quantify and qualify those potential associations. Answers to those questions have been found, to date, by looking at procedures and algorithms used to explore functional connectivity. The term functional connectivity defines statistical associations between physiological responses or activation patterns of distributed neural structures, without any stringent assumption or constraint concerning the actual existence of a structural connection between them (an assumption that could never be met when analysing the consistency of data series from different people). As a consequence, a key feature of functional connectivity is that it is strongly time-dependent. In other words, even if the pattern of statistical associations can arise in multiple time scales and may present only for short time windows, a consistency in the time course of different series of data needs to be present. However, as within-individual statistical associations are typically estimated via correlation, spectral coherence, or phase-locking analyses, novel methods had to be defined to focus on inter-individual analysis, since traditional methods assume that data concerns different facets of the activity of the same system.
Depending on the nature of collected hyperscanning data, on the defining features of the recorded biosignals, and on the interest in associations vs. dependencies in analyzed data, different methods can be selected for second-level integrated data analyses. Nevertheless, the most diffused and tested analysis tools when working with hemodynamic data are correlation and coherence analyses [4,49]. In particular, the first are mainly used when exploring data in the time-domain, while the latter are used when exploring data in the frequency-domain. Furthermore, correlation indices mirror time consistency between different neural responses (as represented by waveforms), whereas coherence indices mirror phase consistency for different frequency components between oscillating signals. Both the kinds of analyses are based on bivariate tests and can then only offer information on pairs of signals one at a time.
An alternative is offered by the application of methods based on Granger causality [52,53]. Granger causality is a definition of causality and dependency between series of data based on prediction and on the theoretical premise that if a time-varying signal causes another time-varying signal, then past values of the first should contribute more than past values of the latter in explaining its present values and predicting its future values. The spreading application of this concept to intra-individual and inter-individual coupling analyses is due to the fact that the Granger-based modeling approach is data-driven and does not necessarily require setting an a priori model of potential underlying data structure. While this feature seems peculiarly relevant in hyperscanning research, where an a priori model of inter-brain associations can hardly be defined, some methodological points need to be taken into consideration. Potential interpretation biases have been reported in case of spurious findings from Granger causality models [52] and depending on inter-individual variability in hemodynamic responses [54]. Again, the use of relative indices related to the modulation of connectivity patterns between different experimental conditions has been suggested to account for such potential limitations [55]. Further, the comparison of intra-individual and inter-individual spatiotemporal patterns of neural activity across different experimental conditions, different stages of a social exchange, or even across reiterated interaction opportunities might offer interesting pieces of information on cortical adaptation and plasticity processes. By tracking the modulations of brain signals and connectivity indices, it might be possible to single out neural structures that are mostly involved in and modeled by complex social dynamics.
Finally, following the remarks of Di Paolo and De Jaegher [7], the nature and stability of observed inter-brain synchronization patterns and of related measures may be investigated via perturbation-based studies, where interpersonal coupling is perturbed (for example, by adding noise or delays in the communication flow) and the effects of such perturbation on functional correlates of social dynamics are collected and analyzed. Or, again, research may benefit from focusing on “transitions in coordination”, i.e., from comparing the modulation of behavior and physiological activities when individual agents gradually pass from uncoordinated activities to shared coordinated activities or when interactions recover from behavioral breakdowns. Those peculiar phenomena can be both investigated in ecological interaction situations (for example, by focusing on turn-taking in conversation and joint-actions) and experimentally induced (for example, by changing between complementary and unrelated task instructions or between symmetric and asymmetric roles). Since coordination breakdowns and recoveries are critical events in social dynamics, the complex system constituted by interacting agents will promptly react to face them. The analysis of behavioral and neural events prior to, co-occurring with, and following transitions might then capitalize the salience of those events to capture highly informative data on mechanisms sustaining individual engagement in the interaction, participatory sense-making, and inter-individual synchronization. Even if these implications are still mainly theoretically discussed, those modulations could be measured via dynamical systems techniques [14] or quantified by looking at long-term correlations [56]. Again, machine-learning methods might be useful to mine neural data and identify relevant markers of sustained/broken coordination [57].
As a closing remark, it is worth underlining that, besides the computation and interpretation of estimated association/dependency indices, the interpretation and proper discussion of hyperscanning findings is a critical step. Indeed, as underlined by Babiloni and Astolfi [21], the fact that two time-varying biosignals significantly correlate or consistently co-vary does not imply the existence of an actual physical channel for communication (i.e., a physical connection) between the biological systems originating them. Relevant correlation or synchronization indices point out associations between recorded brain activations, suggesting the presence of a complex indirect chain of events that links initial cerebral responses of one co-agent to the activity of neural structures of the other in a continuous loop. To date, hyperscanning investigations are only able to highlight and describe complex forms of intra-individual and inter-individual spatiotemporal maps of neural processes and brain activations supporting the interaction dynamics and shared tasks in which participants are involved.
7. Conclusions
The present paper aimed to sketch a global picture of the application of the concept of synchronization in order to study complex social systems and the neural signatures of interpersonal coupling during interaction dynamics. Such phenomena are now usually investigated via hyperscanning, an experimental paradigm that is based on the simultaneous collection of bodily activities of two (or more) individuals performing a shared task (e.g., naturalistic communication exchanges or ad hoc cooperative/competitive experimental tasks). Indeed, in addition to investigations of inter-individual syntonization and behavioral entrainment, research is now focusing on the quantification of inter-brain coupling. Optical imaging has thus been recently used to track and analyze the inter-brain coherence of cortical activations marking realistic interaction dynamics. Empirical evidences and notable technical strong points with respect to alternative neuroscientific techniques has pointed out the potential of fNIRS as a primary investigation tool in the field. While additional research is yet needed to better qualify interpersonal synchronization processes and their functional correlates and to fully disclose the potential of the fNIRS technique in supporting such investigations, one of the most critical questions on the nature of inter-brain coupling also remains to be answered: in the field of hyperscanning research, what does act as the “wooden beam” mediating synchronizations between people and between their interacting brains? Probably only after descriptions and explanations of observed coupling phenomena have been established will research be able to focus on the proper explanandum—i.e., the nature of human interpersonal connection.
Author Contributions
Both D.C. and M.B. substantially contributed to the conception of the work and to drafting the work or revising it critically for important intellectual content. Both D.C. and M.B. gave their final approval of the version to be published and agreed to be accountable for all aspects of the work in ensuring that questions related to the accuracy or integrity of any part of the work are appropriately investigated and resolved.
Conflicts of Interest
The authors declare no conflict of interest.
References
- Hasson, U.; Ghazanfar, A.A.; Galantucci, B.; Garrod, S.; Keysers, C. Brain-to-brain coupling: A mechanism for creating and sharing a social world. Trends Cogn. Sci. 2012, 16, 114–121. [Google Scholar] [CrossRef] [PubMed]
- Balconi, M.; Venturella, I.; Pala, F.; Salati, M.E.; Ripamonti, S.C.; Natili, F.; Vanutelli, M.E. Cervelli in dialogo. Leadership e neuroscienze. La neurometrica applicata alla valutazione delle prestazioni [Brains in dialogue. Leadership and neuroscience. Neurometrics for the assessment of performance]. Dir. Del Pers. 2016, 179, 14–17. [Google Scholar]
- Schilbach, L. A second-person approach to other minds. Nat. Rev. Neurosci. 2010, 11, 449. [Google Scholar] [CrossRef] [PubMed]
- Balconi, M.; Vanutelli, M.E. Interbrains cooperation: Hyperscanning and self-perception in joint actions. J. Clin. Exp. Neuropsychol. 2017, 39, 607–620. [Google Scholar] [CrossRef] [PubMed]
- Camazine, S.; Deneubourg, J.-L.; Franks, N.R.; Sneyd, J.; Theraulaz, G.; Bonabeau, E. Self-Organization in Biological Systems; Princeton University Press: Princeton, NJ, USA, 2003. [Google Scholar]
- Searle, J.R. Collective Intentions and Actions. In Intentions in Communication; Cohen, P.R., Morgan, J., Pollak, M.E., Eds.; MIT Press: Cambridge, MA, USA, 1990; pp. 401–415. [Google Scholar]
- Di Paolo, E.; De Jaegher, H. The interactive brain hypothesis. Front. Hum. Neurosci. 2012, 6, 163. [Google Scholar] [CrossRef] [PubMed]
- Varela, F.; Thompson, E.T.; Rosch, E. The Embodied Mind: Cognitive Science and Human Experience; The MIT Press: Cambridge, MA, USA, 1991. [Google Scholar]
- Pikovsky, A.; Rosenblum, M.; Kurths, J. Synchronization: A Universal Concept in Nonlinear Sciences; Cambridge University Press: Cambridge, UK, 2003. [Google Scholar]
- Friston, K.J. Hierarchical models in the brain. PLoS Comput. Biol. 2008, 4, e1000211. [Google Scholar] [CrossRef] [PubMed]
- Tozzi, A.; Peters, J.F.; Fingelkurts, A.A.; Fingelkurts, A.A.; Marijuán, P.C. Topodynamics of metastable brains. Phys. Life Rev. 2017. [Google Scholar] [CrossRef] [PubMed]
- Repp, B.H.; Su, Y.-H. Sensorimotor synchronization: A review of recent research (2006–2012). Psychon. Bull. Rev. 2013, 20, 403–452. [Google Scholar] [CrossRef] [PubMed]
- Richardson, M.J.; Marsh, K.L.; Isenhower, R.W.; Goodman, J.R.L.; Schmidt, R.C. Rocking together: Dynamics of intentional and unintentional interpersonal coordination. Hum. Mov. Sci. 2007, 26, 867–891. [Google Scholar] [CrossRef] [PubMed]
- Riley, M.A.; Richardson, M.J.; Shockley, K.; Ramenzoni, V.C. Interpersonal synergies. Front. Psychol. 2011, 2, 38. [Google Scholar] [CrossRef] [PubMed] [Green Version]
- Varlet, M.; Marin, L.; Lagarde, J.; Bardy, B.G. Social postural coordination. J. Exp. Psychol. Hum. Percept. Perform. 2011, 37, 473–483. [Google Scholar] [CrossRef] [PubMed]
- Konvalinka, I.; Xygalatas, D.; Bulbulia, J.; Schjødt, U.; Jegindø, E.-M.; Wallot, S.; Van Orden, G.; Roepstorff, A. Synchronized arousal between performers and related spectators in a fire-walking ritual. Proc. Natl. Acad. Sci. USA 2011, 108, 8514–8519. [Google Scholar] [CrossRef] [PubMed]
- Müller, V.; Lindenberger, U. Cardiac and respiratory patterns synchronize between persons during choir singing. PLoS ONE 2011, 6. [Google Scholar] [CrossRef] [PubMed]
- Lindenberger, U.; Li, S.; Gruber, W.; Müller, V. Brains swinging in concert: Cortical phase synchronization while playing guitar. BMC Neurosci. 2009, 10, 22. [Google Scholar] [CrossRef] [PubMed]
- Liu, Y.; Piazza, E.A.; Simony, E.; Shewokis, P.A.; Onaral, B.; Hasson, U.; Ayaz, H. Measuring speaker–listener neural coupling with functional near infrared spectroscopy. Sci. Rep. 2017, 7, 43293. [Google Scholar] [CrossRef] [PubMed]
- Babiloni, F.; Cincotti, F.; Mattia, D.; Mattiocco, M.; De Vico Fallani, F.; Tocci, A.; Bianchi, L.; Marciani, M.G.; Astolfi, L. Hypermethods for EEG hyperscanning. In Proceedings of the 28th Annual International Conference of the IEEE Engineering in Medicine and Biology Society, New York, NY, USA, 30 August–3 September 2006; pp. 3666–3669. [Google Scholar]
- Babiloni, F.; Astolfi, L. Social neuroscience and hyperscanning techniques: Past, present and future. Neurosci. Biobehav. Rev. 2014, 44, 76–93. [Google Scholar] [CrossRef] [PubMed]
- Koike, T.; Tanabe, H.C.; Okazaki, S.; Nakagawa, E.; Sasaki, A.T.; Shimada, K.; Sugawara, S.K.; Takahashi, H.K.; Yoshihara, K.; Bosch-Bayard, J.; et al. Neural substrates of shared attention as social memory: A hyperscanning functional magnetic resonance imaging study. Neuroimage 2016, 125, 401–412. [Google Scholar] [CrossRef] [PubMed]
- Stolk, A.; Noordzij, M.L.; Verhagen, L.; Volman, I.; Schoffelen, J.-M.; Oostenveld, R.; Hagoort, P.; Toni, I. Cerebral coherence between communicators marks the emergence of meaning. Proc. Natl. Acad. Sci. USA 2014, 111, 18183–18188. [Google Scholar] [CrossRef] [PubMed]
- Bilek, E.; Ruf, M.; Schäfer, A.; Akdeniz, C.; Calhoun, V.D.; Schmahl, C.; Demanuele, C.; Tost, H.; Kirsch, P.; Meyer-Lindenberg, A. Information flow between interacting human brains: Identification, validation, and relationship to social expertise. Proc. Natl. Acad. Sci. USA 2015, 112, 5207–5212. [Google Scholar] [CrossRef] [PubMed]
- Sciaraffa, N.; Borghini, G.; Aricò, P.; Di Flumeri, G.; Colosimo, A.; Bezerianos, A.; Thakor, N.; Babiloni, F. Brain interaction during cooperation: Evaluating local properties of multiple-brain network. Brain Sci. 2017, 7, 90. [Google Scholar] [CrossRef] [PubMed]
- Hasegawa, C.; Ikeda, T.; Yoshimura, Y.; Hiraishi, H.; Takahashi, T.; Furutani, N.; Hayashi, N.; Minabe, Y.; Hirata, M.; Asada, M.; et al. Mu rhythm suppression reflects mother-child face-to-face interactions: A pilot study with simultaneous MEG recording. Sci. Rep. 2016, 6, 34977. [Google Scholar] [CrossRef] [PubMed]
- Hirata, M.; Ikeda, T.; Kikuchi, M.; Kimura, T.; Hiraishi, H.; Yoshimura, Y.; Asada, M. Hyperscanning MEG for understanding mother-child cerebral interactions. Front. Hum. Neurosci. 2014, 8, 118. [Google Scholar] [CrossRef] [PubMed]
- Baess, P.; Zhdanov, A.; Mandel, A.; Parkkonen, L.; Hirvenkari, L.; Mäkelä, J.P.; Jousmäki, V.; Hari, R. MEG dual scanning: A procedure to study real-time auditory interaction between two persons. Front. Hum. Neurosci. 2012, 6, 83. [Google Scholar] [CrossRef] [PubMed]
- Osaka, N.; Minamoto, T.; Yaoi, K.; Azuma, M.; Shimada, Y.M.; Osaka, M. How two brains make one synchronized mind in the inferior frontal cortex: fNIRS-based hyperscanning during cooperative singing. Front. Psychol. 2015, 6. [Google Scholar] [CrossRef] [PubMed] [Green Version]
- Balconi, M.; Vanutelli, M.E. When Cooperation Was Efficient or Inefficient. Functional Near-Infrared Spectroscopy Evidence. Front. Syst. Neurosci. 2017, 11, 26. [Google Scholar] [CrossRef] [PubMed]
- Liu, N.; Mok, C.; Witt, E.E.; Pradhan, A.H.; Chen, J.E.; Reiss, A.L. NIRS-based hyperscanning reveals inter-brain neural synchronization during cooperative Jenga game with face-to-face communication. Front. Hum. Neurosci. 2016, 10, 82. [Google Scholar] [CrossRef] [PubMed]
- Zhang, M.; Liu, T.; Pelowski, M.; Yu, D. Gender difference in spontaneous deception: A hyperscanning study using functional near-infrared spectroscopy. Sci. Rep. 2017, 7, 7508. [Google Scholar] [CrossRef] [PubMed]
- Tang, H.; Mai, X.; Wang, S.; Zhu, C.; Krueger, F.; Liu, C. Interpersonal brain synchronization in the right temporo-parietal junction during face-to-face economic exchange. Soc. Cogn. Affect. Neurosci. 2016, 11, 23–32. [Google Scholar] [CrossRef] [PubMed]
- Crivelli, D.; Balconi, M. Event-Related Electromagnetic Responses. In Reference Module in Neuroscience and Biobehavioral Psychology; Elsevier: Amsterdam, The Netherlands, 2017. [Google Scholar] [CrossRef]
- Mulert, C.; Lemieux, L. (Eds.) EEG-fMRI: Physiological Basis, Technique, and Applications; Springer: Berlin, Germany, 2010. [Google Scholar]
- Quaresima, V.; Ferrari, M. Functional Near-Infrared Spectroscopy (fNIRS) for assessing cerebral cortex function during human behavior in natural/social situations: A concise review. Organ. Res. Methods 2016. [Google Scholar] [CrossRef]
- Scholkmann, F.; Holper, L.; Wolf, U.; Wolf, M. A new methodical approach in neuroscience: Assessing interpersonal brain coupling using functional near-infrared imaging (fNIRI) hyperscanning. Front. Hum. Neurosci. 2013, 7, 813. [Google Scholar] [CrossRef] [PubMed] [Green Version]
- Koike, T.; Tanabe, H.C.; Sadato, N. Hyperscanning neuroimaging technique to reveal the “two-in-one” system in social interactions. Neurosci. Res. 2015, 90, 25–32. [Google Scholar] [CrossRef] [PubMed]
- Roy, C.S.; Sherrington, C.S. On the regulation of the blood-supply of the brain. J. Physiol. 1890, 11, 85–158. [Google Scholar] [CrossRef] [PubMed]
- Fox, P.T.; Raichle, M.E. Focal physiological uncoupling of cerebral blood flow and oxidative metabolism during somatosensory stimulation in human subjects. Proc. Natl. Acad. Sci. USA 1986, 83, 1140–1144. [Google Scholar] [CrossRef] [PubMed]
- Chance, B. Rapid and sensitive spectrophotometry. III. A double beam apparatus. Rev. Sci. Instrum. 1951, 22, 634–638. [Google Scholar] [CrossRef]
- Jöbsis, F.F. Noninvasive, infrared monitoring of cerebral and myocardial oxygen sufficiency and circulatory parameters. Science 1977, 198, 1264–1267. [Google Scholar] [CrossRef] [PubMed]
- Ferrari, M.; Quaresima, V. A brief review on the history of human functional near-infrared spectroscopy (fNIRS) development and fields of application. Neuroimage 2012, 63, 921–935. [Google Scholar] [CrossRef] [PubMed]
- Balconi, M.; Molteni, E. Past and future of near-infrared spectroscopy in studies of emotion and social neuroscience. J. Cogn. Psychol. 2016, 28, 129–146. [Google Scholar] [CrossRef]
- Scholkmann, F.; Kleiser, S.; Metz, A.J.; Zimmermann, R.; Pavia, J.M.; Wolf, U.; Wolf, M. A review on continuous wave functional near-infrared spectroscopy and imaging instrumentation and methodology. Neuroimage 2014, 85, 6–27. [Google Scholar] [CrossRef] [PubMed] [Green Version]
- Chatrian, G.-E.; Lettich, E.; Nelson, P.L. Modified nomenclature for the “10%” Electrode System. J. Clin. Neurophysiol. 1988, 5, 183–186. [Google Scholar] [CrossRef] [PubMed]
- Oostenveld, R.; Praamstra, P. The five percent electrode system for high-resolution EEG and ERP measurements. Clin. Neurophysiol. 2001, 112, 713–719. [Google Scholar] [CrossRef]
- Gratton, G.; Fabiani, M. Fast optical imaging of human brain function. Front. Hum. Neurosci. 2010, 4. [Google Scholar] [CrossRef] [PubMed]
- Cui, X.; Bryant, D.M.; Reiss, A.L. NIRS-based hyperscanning reveals increased interpersonal coherence in superior frontal cortex during cooperation. Neuroimage 2012, 59, 2430–2437. [Google Scholar] [CrossRef] [PubMed]
- Boas, D.A.; Elwell, C.E.; Ferrari, M.; Taga, G. Twenty years of functional near-infrared spectroscopy: Introduction for the special issue. Neuroimage 2014, 85, 1–5. [Google Scholar] [CrossRef] [PubMed]
- Balardin, J.B.; Morais, G.A.Z.; Furucho, R.A.; Trambaiolli, L.; Vanzella, P.; Biazoli, C.; Sato, J.R. Imaging brain function with functional Near-Infrared Spectroscopy in unconstrained environments. Front. Hum. Neurosci. 2017, 11. [Google Scholar] [CrossRef] [PubMed]
- Schippers, M.B.; Roebroeck, A.; Renken, R.; Nanetti, L.; Keysers, C. Mapping the information flow from one brain to another during gestural communication. Proc. Natl. Acad. Sci. USA 2010, 107, 9388–9393. [Google Scholar] [CrossRef] [PubMed]
- Pan, Y.; Cheng, X.; Zhang, Z.; Li, X.; Hu, Y. Cooperation in lovers: An fNIRS-based hyperscanning study. Hum. Brain Mapp. 2017, 38, 831–841. [Google Scholar] [CrossRef] [PubMed]
- Deshpande, G.; Sathian, K.; Hu, X. Effect of hemodynamic variability on Granger causality analysis of fMRI. Neuroimage 2010, 52, 884–896. [Google Scholar] [CrossRef] [PubMed]
- Roebroeck, A.; Formisano, E.; Goebel, R. Mapping directed influence over the brain using Granger causality and fMRI. Neuroimage 2005, 25, 230–242. [Google Scholar] [CrossRef] [PubMed]
- Kello, C.T.; Brown, G.D.A.; Ferrer-i-Cancho, R.; Holden, J.G.; Linkenkaer-Hansen, K.; Rhodes, T.; Van Orden, G.C. Scaling laws in cognitive sciences. Trends Cogn. Sci. 2010, 14, 223–232. [Google Scholar] [CrossRef] [PubMed]
- Konvalinka, I.; Roepstorff, A. The two-brain approach: How can mutually interacting brains teach us something about social interaction? Front. Hum. Neurosci. 2012, 6, 215. [Google Scholar] [CrossRef] [PubMed]
Figure 1.
Schematic representation of hyperscanning recording settings. (a) Example of functional Near-Infrared Spectroscopy (fNIRS)-based side-by-side hyperscanning during experimentally-controlled tasks, such as cooperative or competitive computerized games; (b) Example of fNIRS-based face-to-face hyperscanning during naturalistic interactions, such as real-life verbal and non-verbal communication exchanges; (c) Examples of single-brain 3D topographical activation maps based on local oxygenated hemoglobin (O2Hb) concentration during a cooperative task and turn-based interaction. Images have been created based on data recorded at our laboratory. Pairs of reconstructed heads refer to different couples of co-agents. Left: modulation of O2Hb concentration during a shared cognitive task. Right: modulation of O2Hb concentration during turn-based face-to-face conversation. Green-to-blue colors mark a decrease in oxygenated hemoglobin concentration; green-to-red colors mark an increase in oxygenated hemoglobin concentration. Lines connecting pairs of 3D activation maps exemplify graphical representation of hyperlinks between co-agents. Yellow-to-red colors mirror the increasing strength of the hyperlink between different cortical areas as measured by correlation indices.
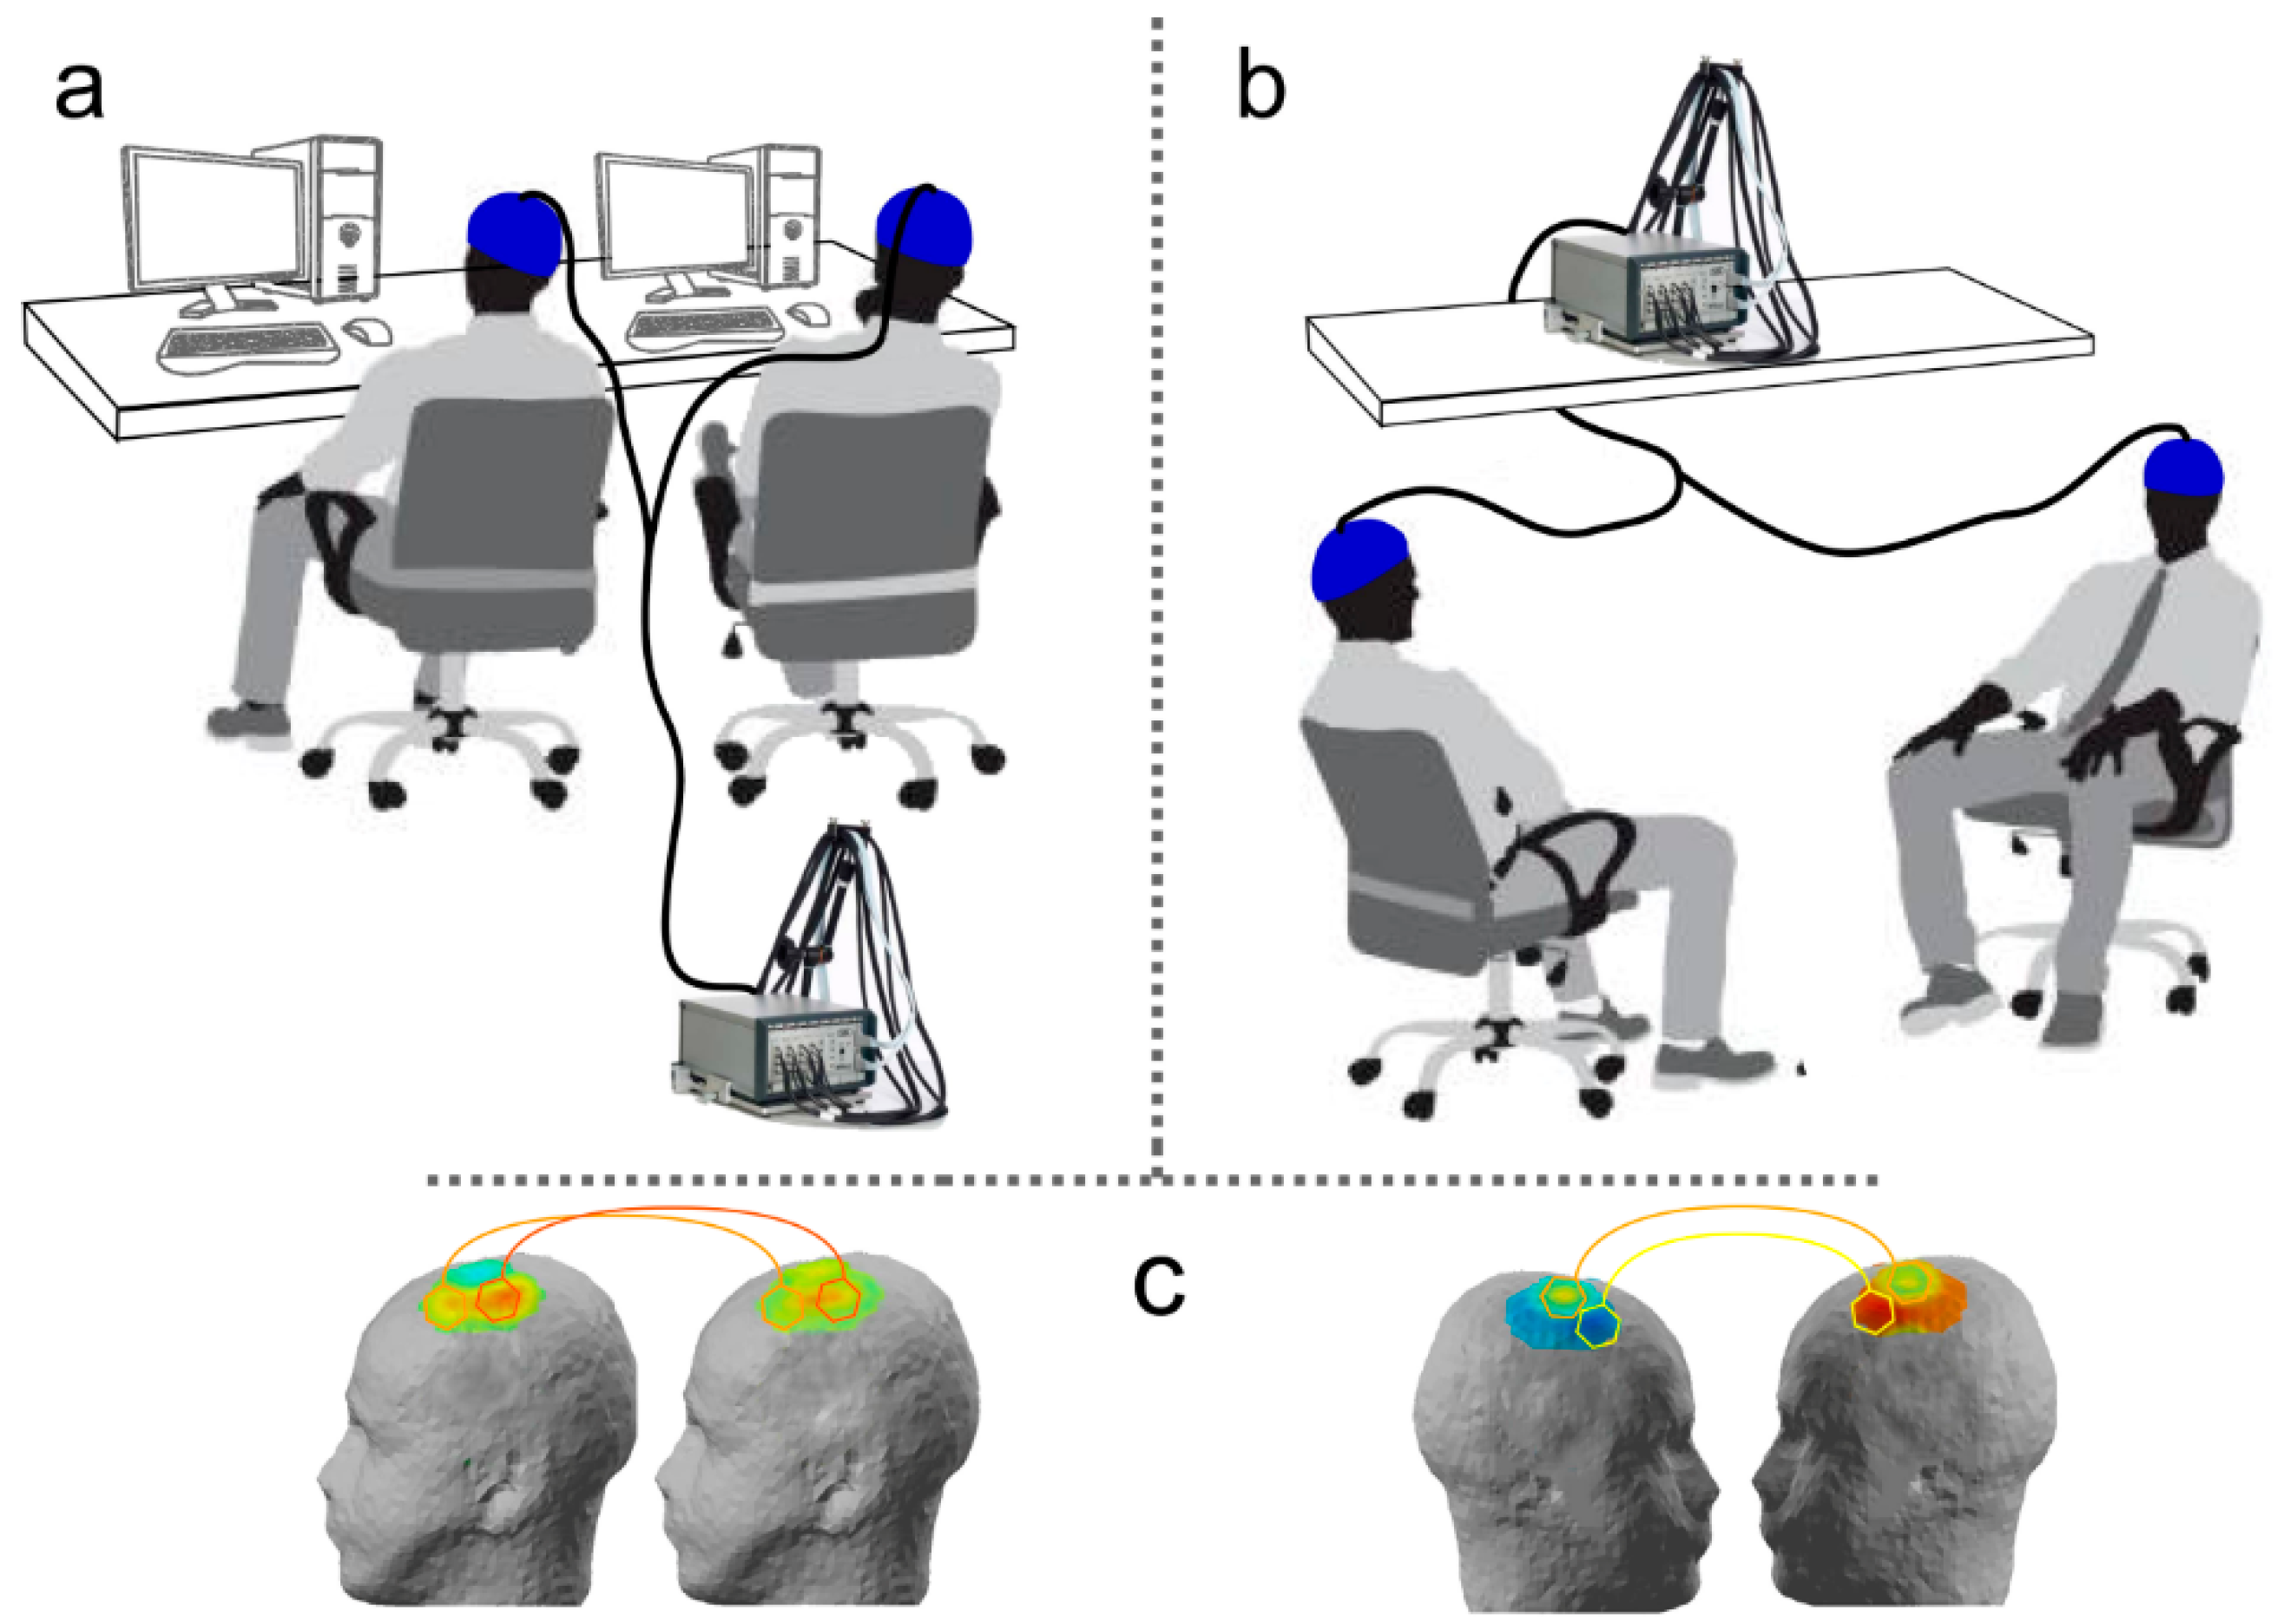
Figure 2.
Simplified schematic representation of the main steps for fNIRS-based hyperscanning applications with regard to, for example, face-to-face social exchanges. The “Data recording” step refers to the concurrent collection of optical imaging data from multiple participants in a hyperscanning setting. The “First-level single-subject signal processing” step refers to the initial processing of recorded signals to obtain information on individual hemodynamic activities for each participant. Waveforms and activation maps are the two most-used representations for single-brain data. The “Second-level integrated data analysis” step refers to the final integrated analysis of individual data to explore interpersonal synchronization and inter-brain coupling in hyperscanning applications.

© 2017 by the authors. Licensee MDPI, Basel, Switzerland. This article is an open access article distributed under the terms and conditions of the Creative Commons Attribution (CC BY) license (http://creativecommons.org/licenses/by/4.0/).
Share and Cite
MDPI and ACS Style
Crivelli, D.; Balconi, M. Near-Infrared Spectroscopy Applied to Complex Systems and Human Hyperscanning Networking. Appl. Sci. 2017, 7, 922. https://doi.org/10.3390/app7090922
AMA Style
Crivelli D, Balconi M. Near-Infrared Spectroscopy Applied to Complex Systems and Human Hyperscanning Networking. Applied Sciences. 2017; 7(9):922. https://doi.org/10.3390/app7090922
Chicago/Turabian StyleCrivelli, Davide, and Michela Balconi. 2017. "Near-Infrared Spectroscopy Applied to Complex Systems and Human Hyperscanning Networking" Applied Sciences 7, no. 9: 922. https://doi.org/10.3390/app7090922
Note that from the first issue of 2016, this journal uses article numbers instead of page numbers. See further details here.