4.1. Supervised Machine Learning Analysis for Pattern Recognition
There are various supervised machine learning used in classification techniques, which can be sorted into a few categories: logic-based, perceptron-based, instance-based, statistical learning-based and vector-based [
54]. The classifiers for each category are shown in
Table 8. For this study, three algorithms which have been used in many applications, especially involving odour or smell classification, have been chosen: MLP (perceptron-based), KNN (instance-based), and LDA (statistical learning-based) [
55,
56,
57]. All of these classifiers have been run using MATLAB’s 2015 functions library that supports supervised machine learning. At the end of the program, the MATLAB R2015b (version 8.6, The MathWorks Company, Natick, MA, USA, 2015) produced an output file which then embedded to the system.
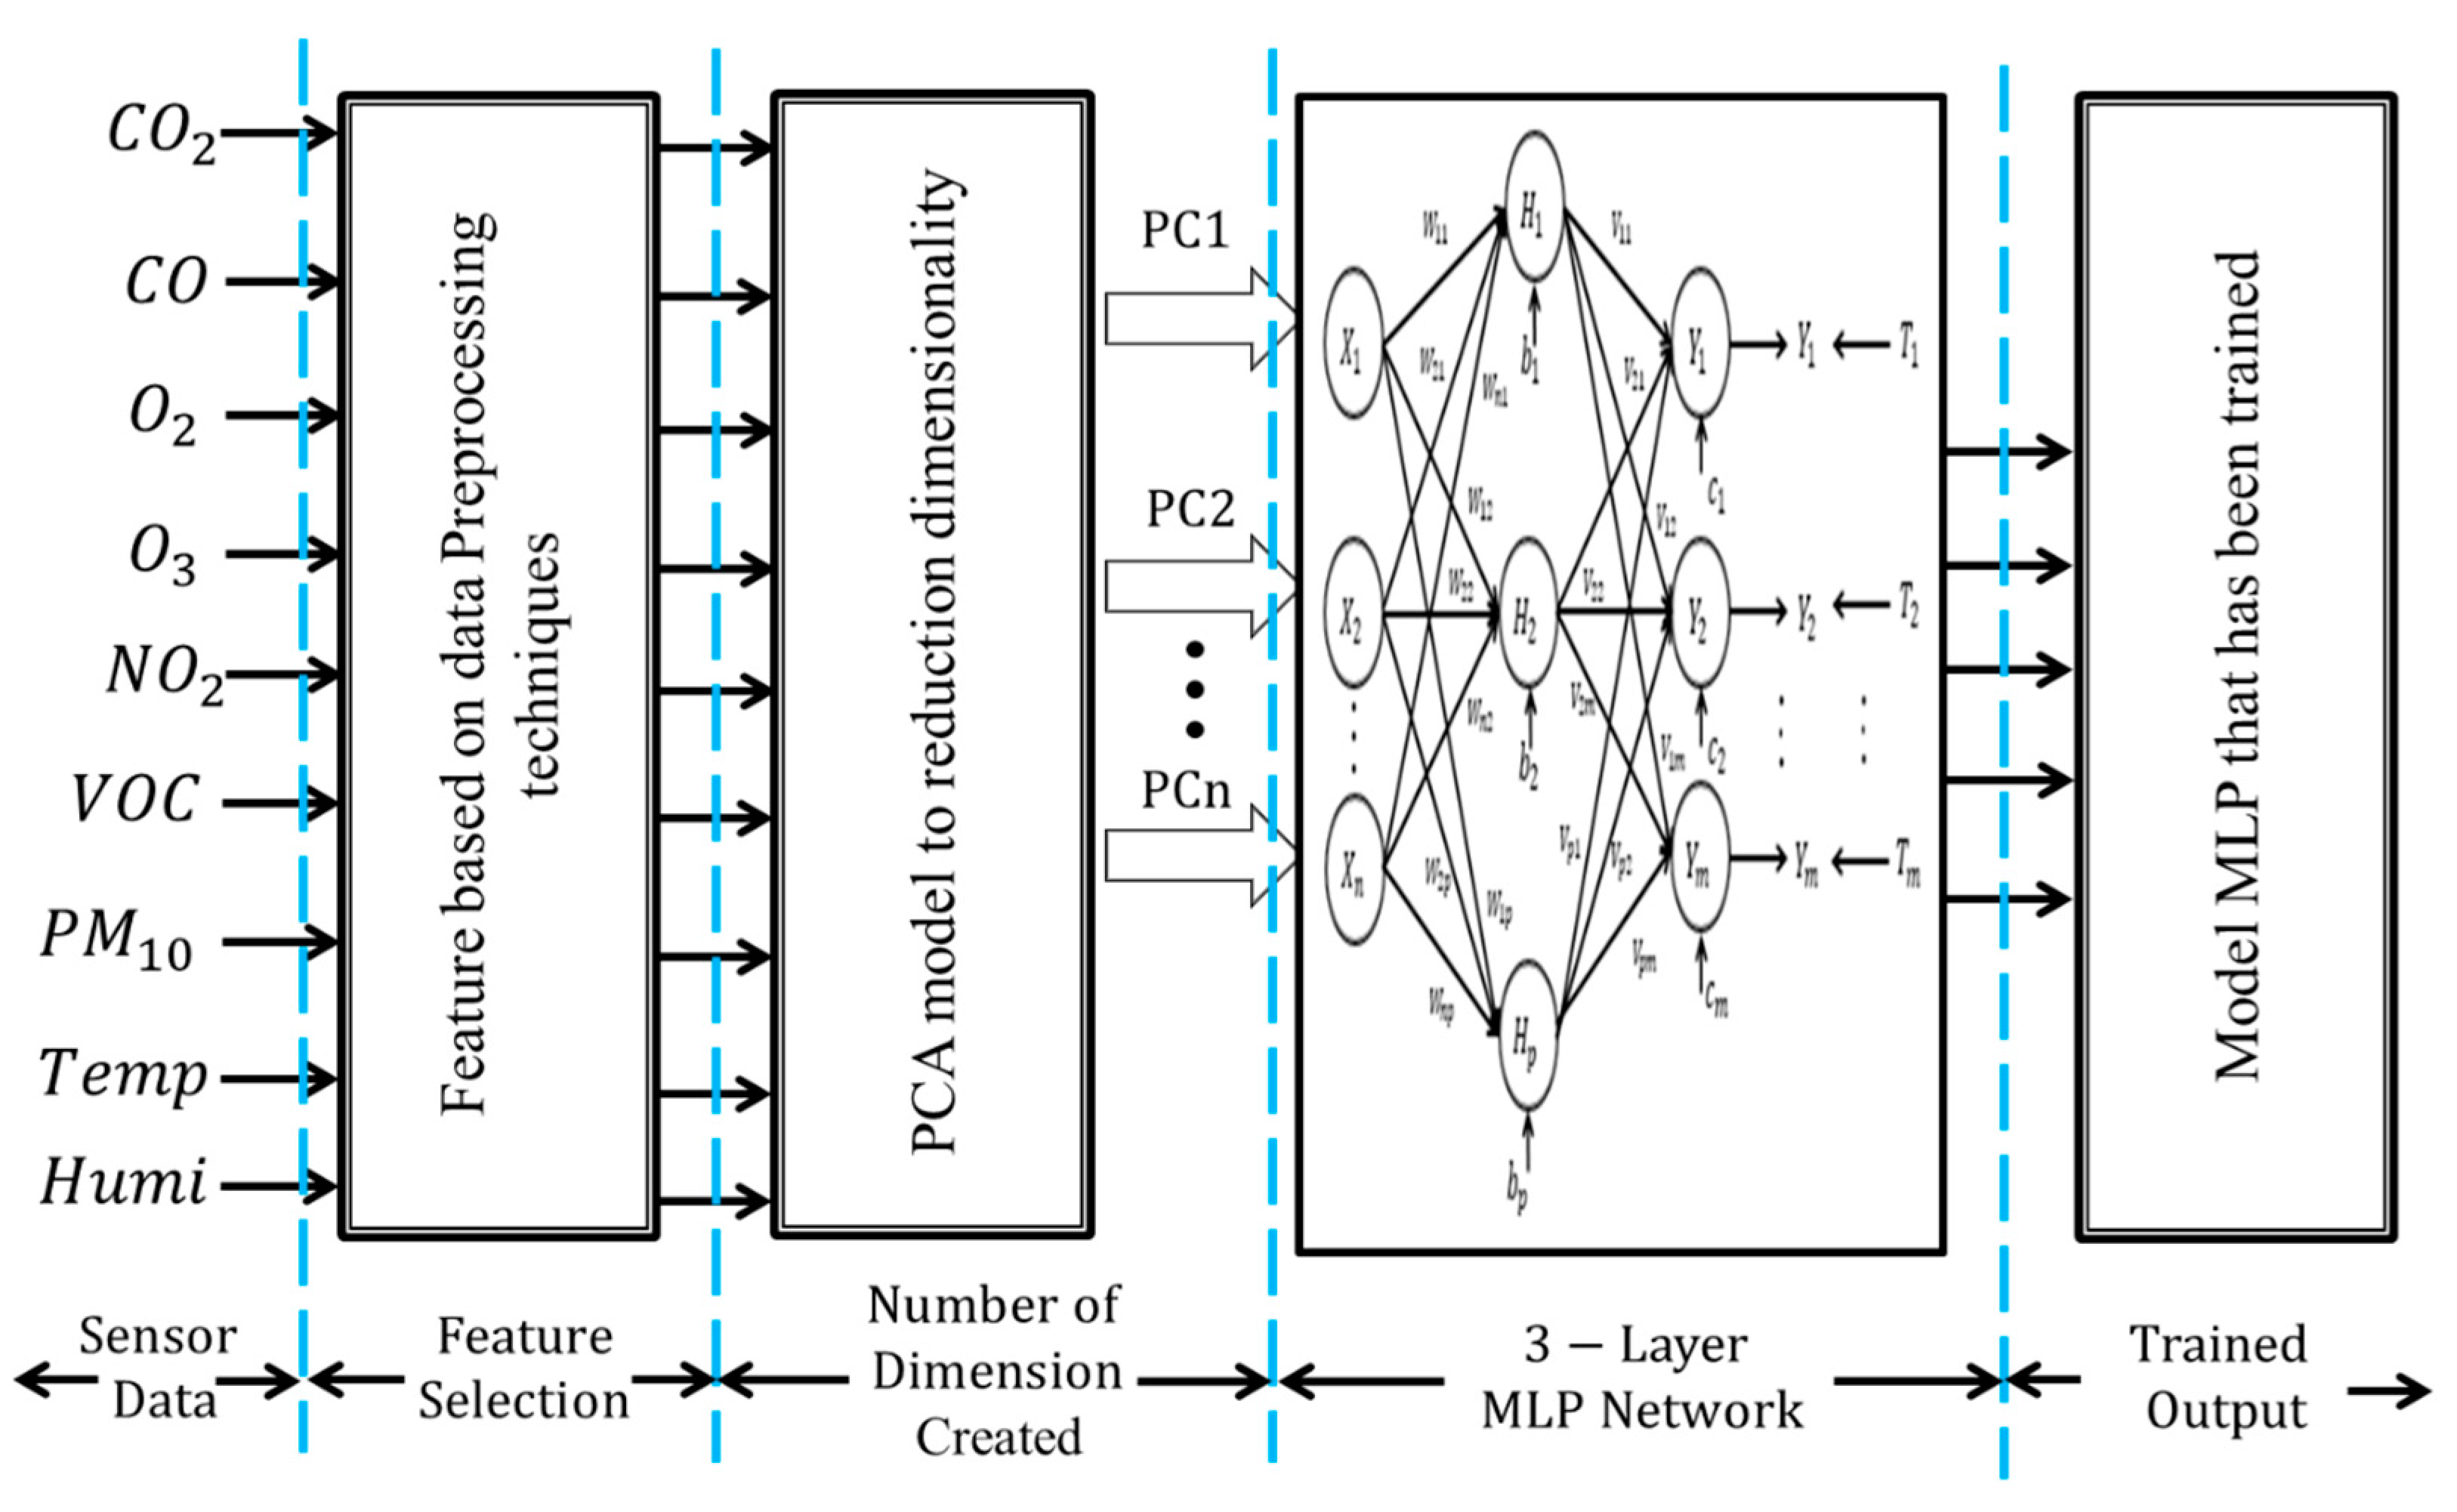
The example of one of the algorithms, such as the MLP model, along with its classification performance of six features is discussed in this section. For each of the features, a separate MLP model was formulated. Separate models need to be formulated as the aim of the research is to find the optimal classification accuracy for each feature. In order to identify the source affecting the IAQ, this study used the MLP, which consists of three layers: the input layer, hidden layer and output layer. As network architecture, a 3-layer perceptron model as shown in
Figure 7 was used. The first input layer contains the input variables for the network, which is the data after the pre-processing technique. For the data set before PCA, the input layer contains nine neurons of IAQ parameters, which are CO
2, CO, O
3, NO
2, O
2, VOC, PM
10, temperature and humidity, while, for the data set after PCA, the input layer contains the dimensions for each feature after reduction. There is one hidden layer used and the numbers of hidden neurons were not fixed and were adjusted until the desired performance was achieved. The last layer of the model is the output layer, which consists of five target outputs that represent five types of sources of indoor air pollution, such as combustion activity, the presence of fragrances and so on. Sixty percent of all data is selected randomly to become the training set. A goal is set (in this case, a mean square error (MSE) of 0.0001 has been chosen as the goal) and the training dataset is trained until the desired MSE is obtained. MSE was used as the stopping criterion. Training was conducted until the MSE fell below 0.0001 or a maximum epoch limit of 1000 is reached. This is to ensure that the model is trained with minimum error iteration and not over-trained. The learning rate and momentum factor were chosen based on experimental analysis. The number of hidden neurons was adjusted by the network to achieve this goal. The testing tolerance of the neural network model was chosen as 0.1. This value is the maximum allowable tolerance level for the testing.
The detailed parameter for MLP training is given in
Table 9. For example, to train the dataset (before PCA) for the condition of ambient air, the data from all 9 IAQ parameters become the neurons for the input layer. Randomly, 60% of each IAQ parameter was selected to be the training set (60% out of 960 data for ambient air). The training was conducted until the targeted MSE was reached or until a maximum epoch limit of 1000 was reached. This process was repeated with the other four conditions. In the end, the network would produce a model which was then tested against the 40% of the remaining data for all conditions (the testing set) in order to find the classification accuracy. The whole process was repeated again for different features. The model of the feature that gave the highest classification accuracy may be chosen to be embedded into the system after being compared to the model of other type of classifiers, such as KNN or LDA.
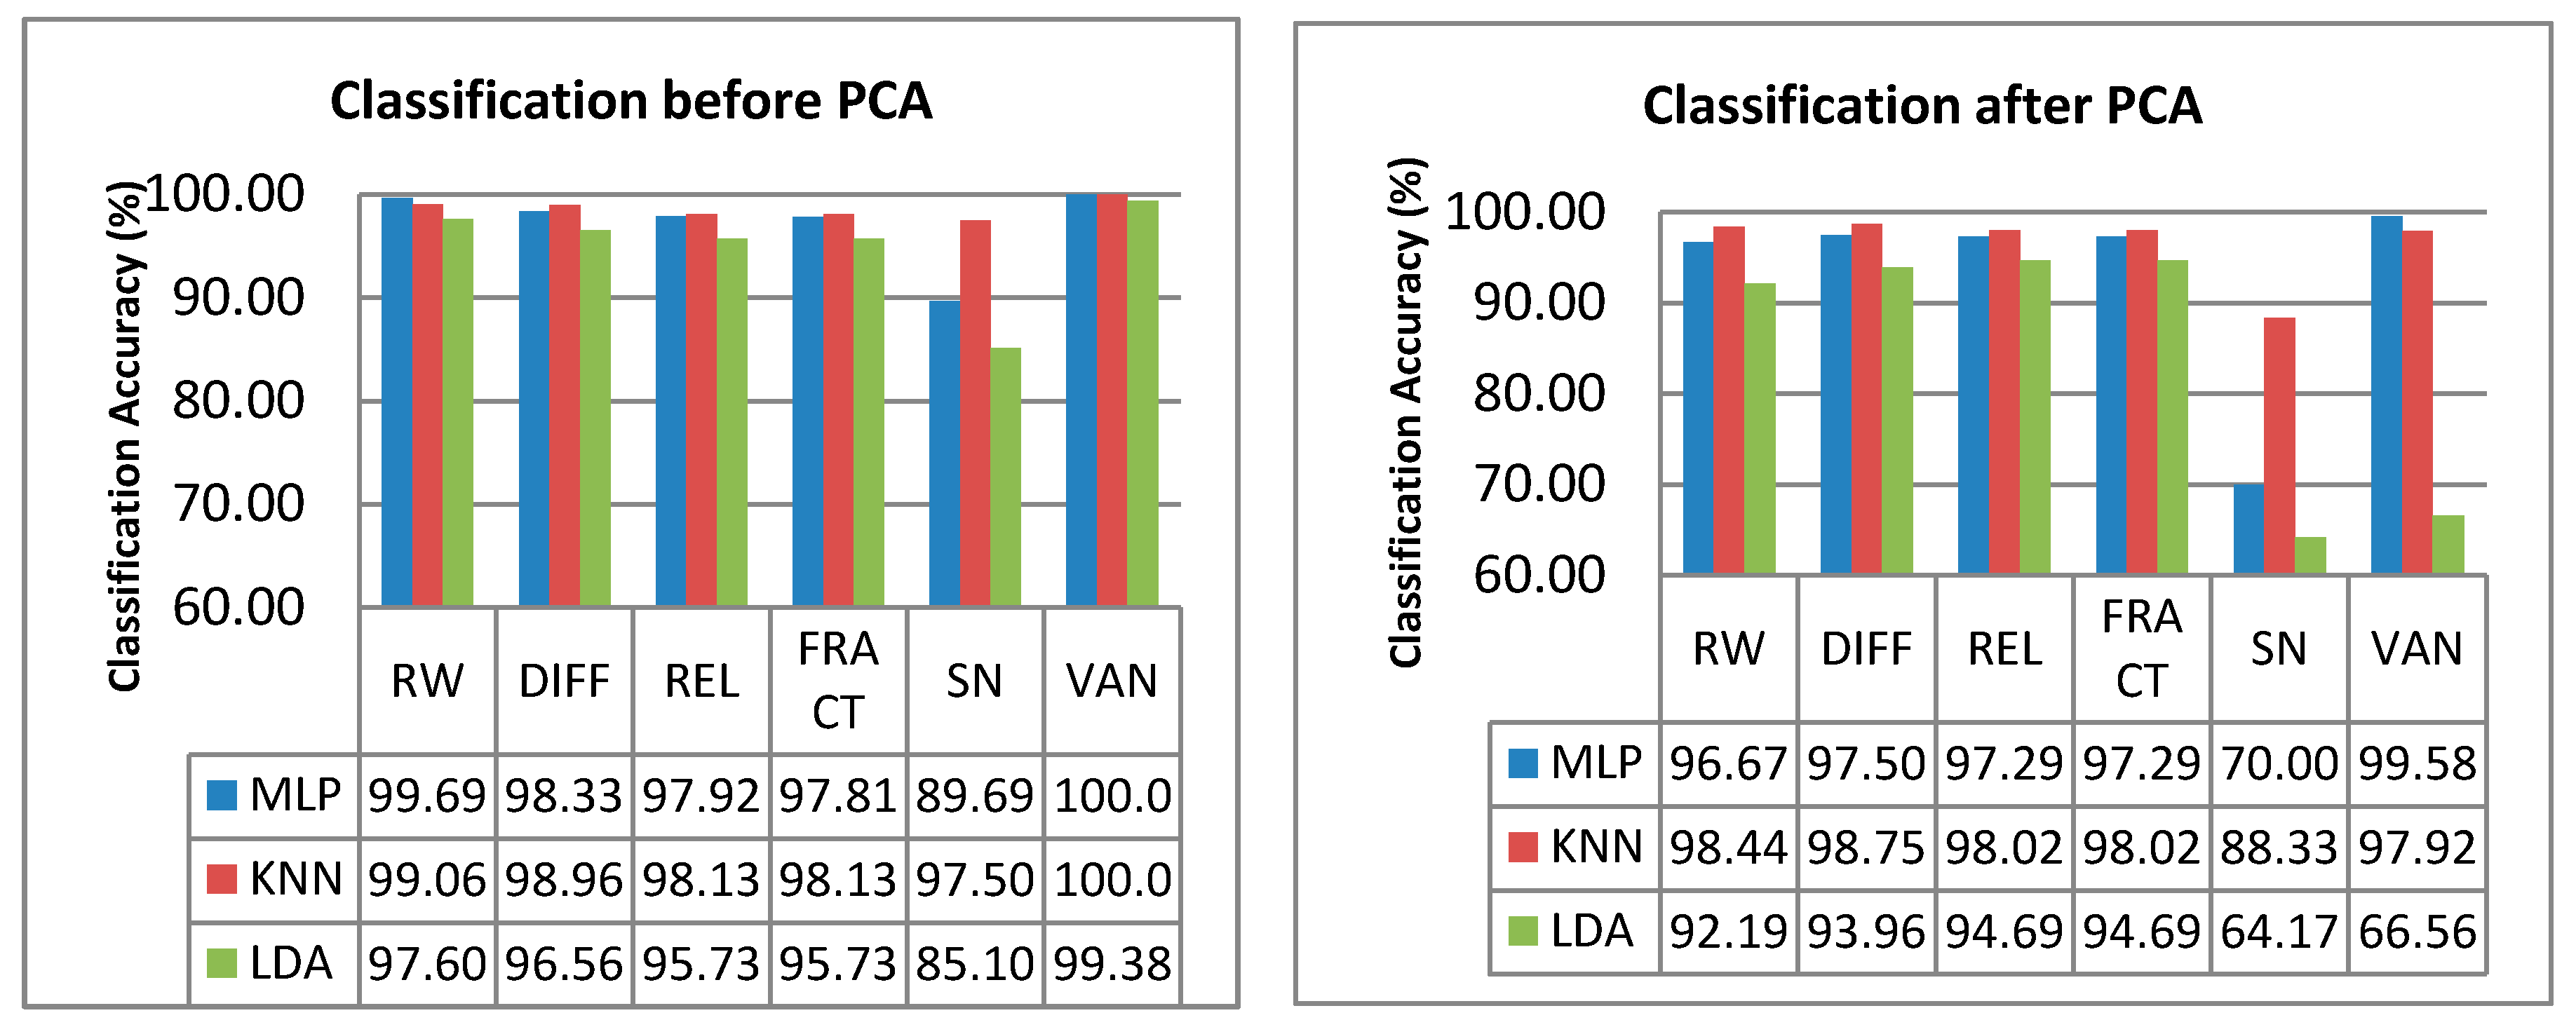
The classification performance of the MLP, KNN and LDA using the six features for the dataset before-PCA and after-PCA are shown in
Figure 8. The PCA was performed because PCA is known to be able to increase the classification accuracy of certain datasets by reducing the number of variables, losing only a minimum of variability [
46]. However, as shown in
Figure 8, the classification rate for dataset after PCA is less than the classification rate before PCA for all features. This result is due to the information loss during PCA. According to [
58], for datasets with very low complexity (few PCs), the relevant information has been excluded during the process of PCA, which resulted in a lower classification accuracy for datasets after PCA. The PCA could give a higher classification accuracy to datasets with very high complexity (many PCs), where the dataset before PCA does not only have relevant information, but also contains noise [
59]. With the presence of noise, the classifier over-fits the training data and thus does not generalize well. Based on the explanation by [
58], it can be seen that this study has a dataset with a very low complexity (only 9 PCs). Thus, the PCA process has excluded relevant information that could contribute to the high classification accuracy, which explains the lower classification accuracy for the dataset after PCA. Nevertheless, although the dataset after PCA (VAN feature) could not give 100% classification accuracy, it could classify 99.58% of the dataset using only two variables instead of nine variables needed for the dataset before PCA.
The validation in identifying pollutants by the proposed machine learning algorithm can be obtained by looking at the confusion matrix. A confusion matrix is a table that is often used to describe the performance of a classification model (or “classifier”) on a set of test data for which the true values are known. For example, in the case of the MLP classifier, the confusion matrix for the features giving the lowest and the highest classification accuracy are shown in
Table 10 and
Table 11. Rows and columns represent actual and predicted values, respectively.
Table 10 shows the confusion matrix for feature SN (after PCA) as it gave the lowest confusion matrix. Based on the table, it can be observed that every condition contributes to the confusion level, with human activity having the highest confusion level at 50%. This means that MLP can classify only 50% of combustion activity correctly and it cannot classify the other 50% correctly as combustion activity.
Table 11 presents the confusion matrix for VAN (before PCA) which has the highest classification accuracy. Compared to the confusion matrix of SN in
Table 10, MLP does not have any confusion in classifying all the five conditions. It means that it can classify all of the five conditions correctly. This confusion matrix validates the classification rate for VAN (before PCA), which is 100%.
The classification accuracy that has been achieved by this study is quite similar to the classification result achieved by a previous researcher [
46]. They have developed a laboratory-made malodour sensing system, used to identify five typical sources of olfactive annoyance: printing houses, a paint shop in a coach building, wastewater treatment plant, urban waste composting facilities and a rendering plant. The researcher adopted various data pre-processing techniques, such as the VAN feature, which was also used in this study. Their results also show that the best classification results are obtained using a VAN feature with 100% classification accuracy. The objective of testing these three classifiers is to see which classifier gives the highest classification accuracy. Based on the results of the classifiers discussed before, there are four sets of classifiers with one feature (VAN before PCA) which gave 100% classification accuracy:
- (1).
MLP-VAN feature before PCA (model 9-3-5),
- (2).
MLP-VAN feature before PCA (model 9-9-5),
- (3).
MLP-VAN feature before PCA (model 9-12-5), and
- (4).
KNN-VAN feature before PCA (K factor is 2).
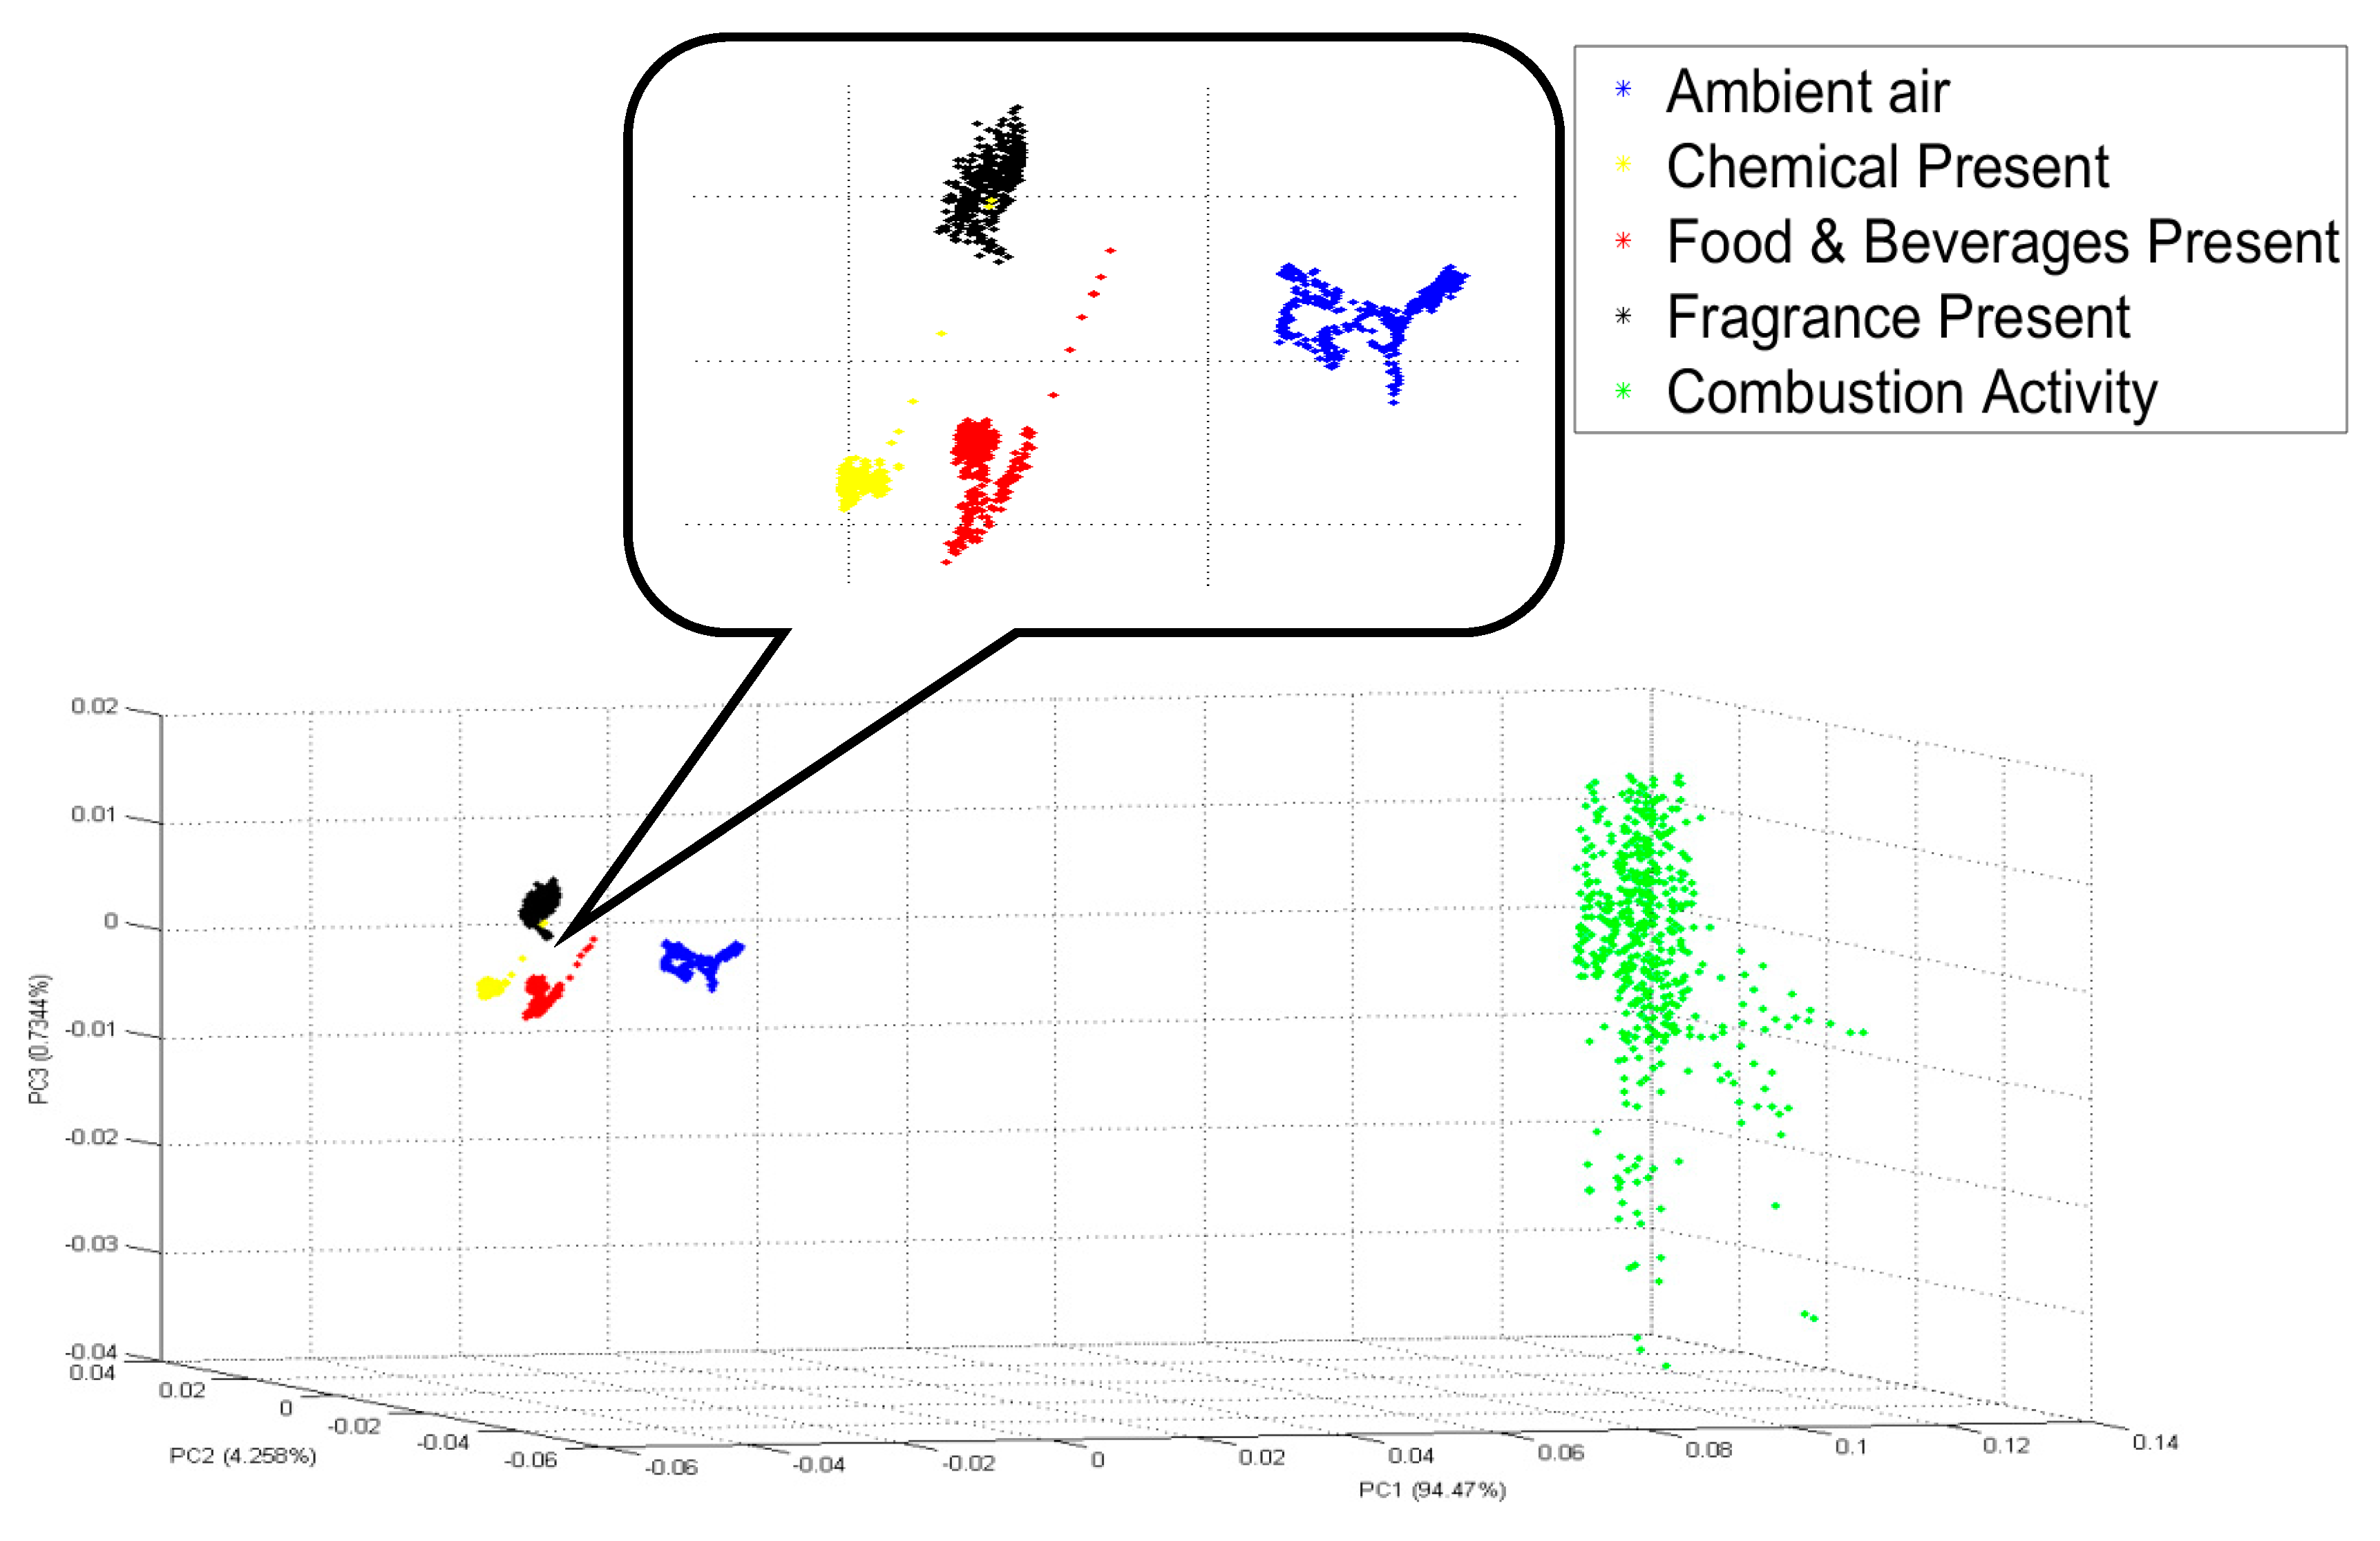
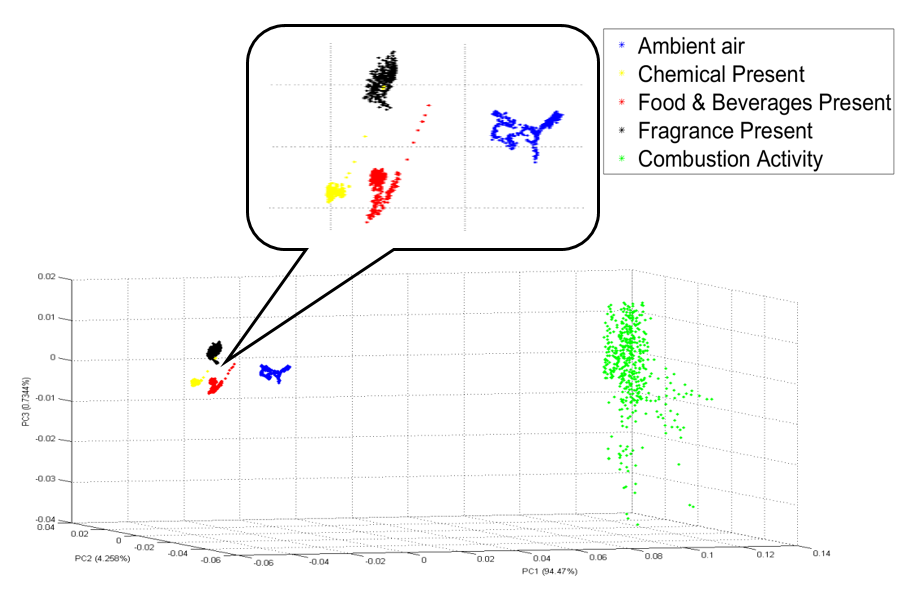
To prove that the VAN feature before PCA really gave 100% classification accuracy, another analysis has been done. The PCA visualization for the VAN feature before any dimensionality reduction is constructed in s 3D plot as shown in
Figure 9. From
Figure 9, it can be seen that none of the five conditions coincide with each other, and therefore they are mutually exclusive. After the feature has been identified, it is now time to choose between the two classifiers: MLP or KNN. This study chooses MLP with a model structure of 9-3-5 because it is easier to be embedded in the system. Model 9-3-5 only has three hidden variables, while the other two model structures have nine and 12 hidden variables. A model structure with fewer hidden variables has a less complicated formula and is therefore easy to be embedded. As far as KNN is concerned, KNN requires a large storage space in the system because it saves every data that it receives. MLP, on the other hand, does not require a large storage system. Due to these reasons, an MLP classifier is chosen for this study.
4.2. Classification of Multiple Sources of IAP
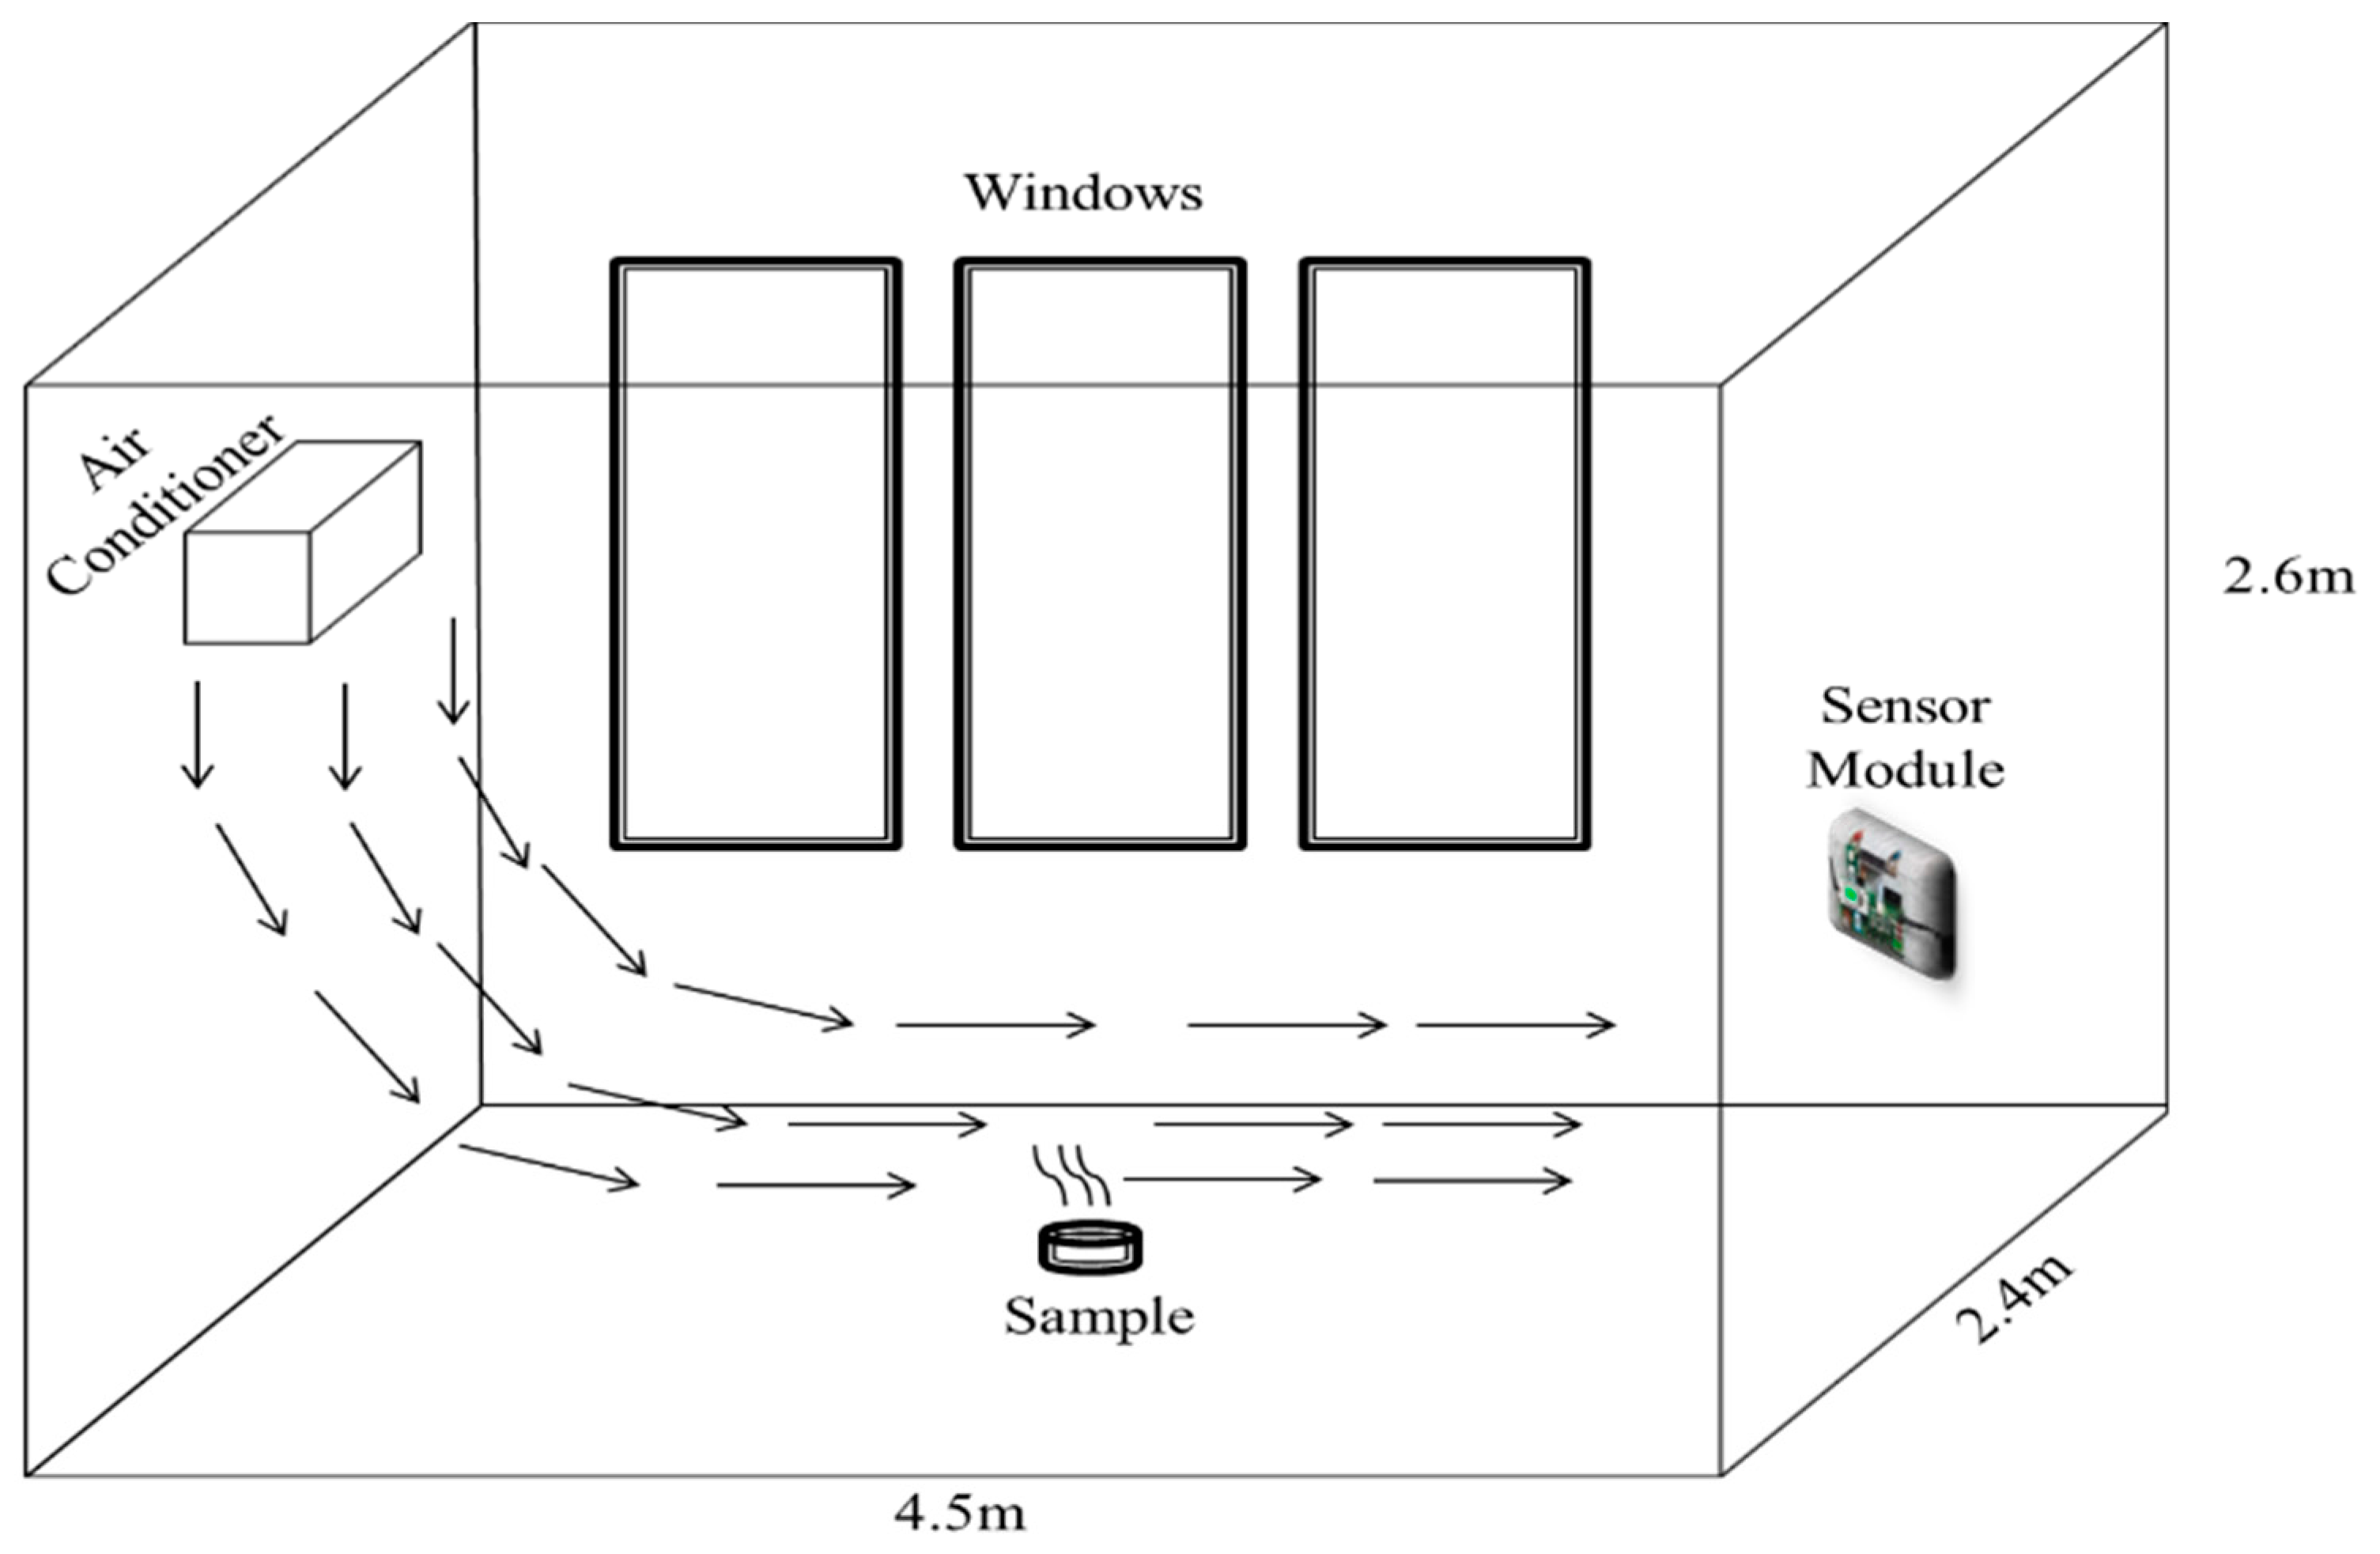
This section shows results for the classification of sources of IAP when multiple sources are present at the same time. Based on the previous result, the MLP classifier with a model structure of 9-3-5 was chosen for this analysis. To collect the related data for this analysis, an experiment that simulates the presence of multiple sources of IAP was conducted. A similar environment to the previous experiment of collecting a single source of IAP was maintained, where the sensor module was installed hanging up to the right of the wall with 1.1 m of height above the ground, and the temperature of the room was set to 22 °C. The data was collected for one day: between 9:00 a.m. and 11:30 a.m.
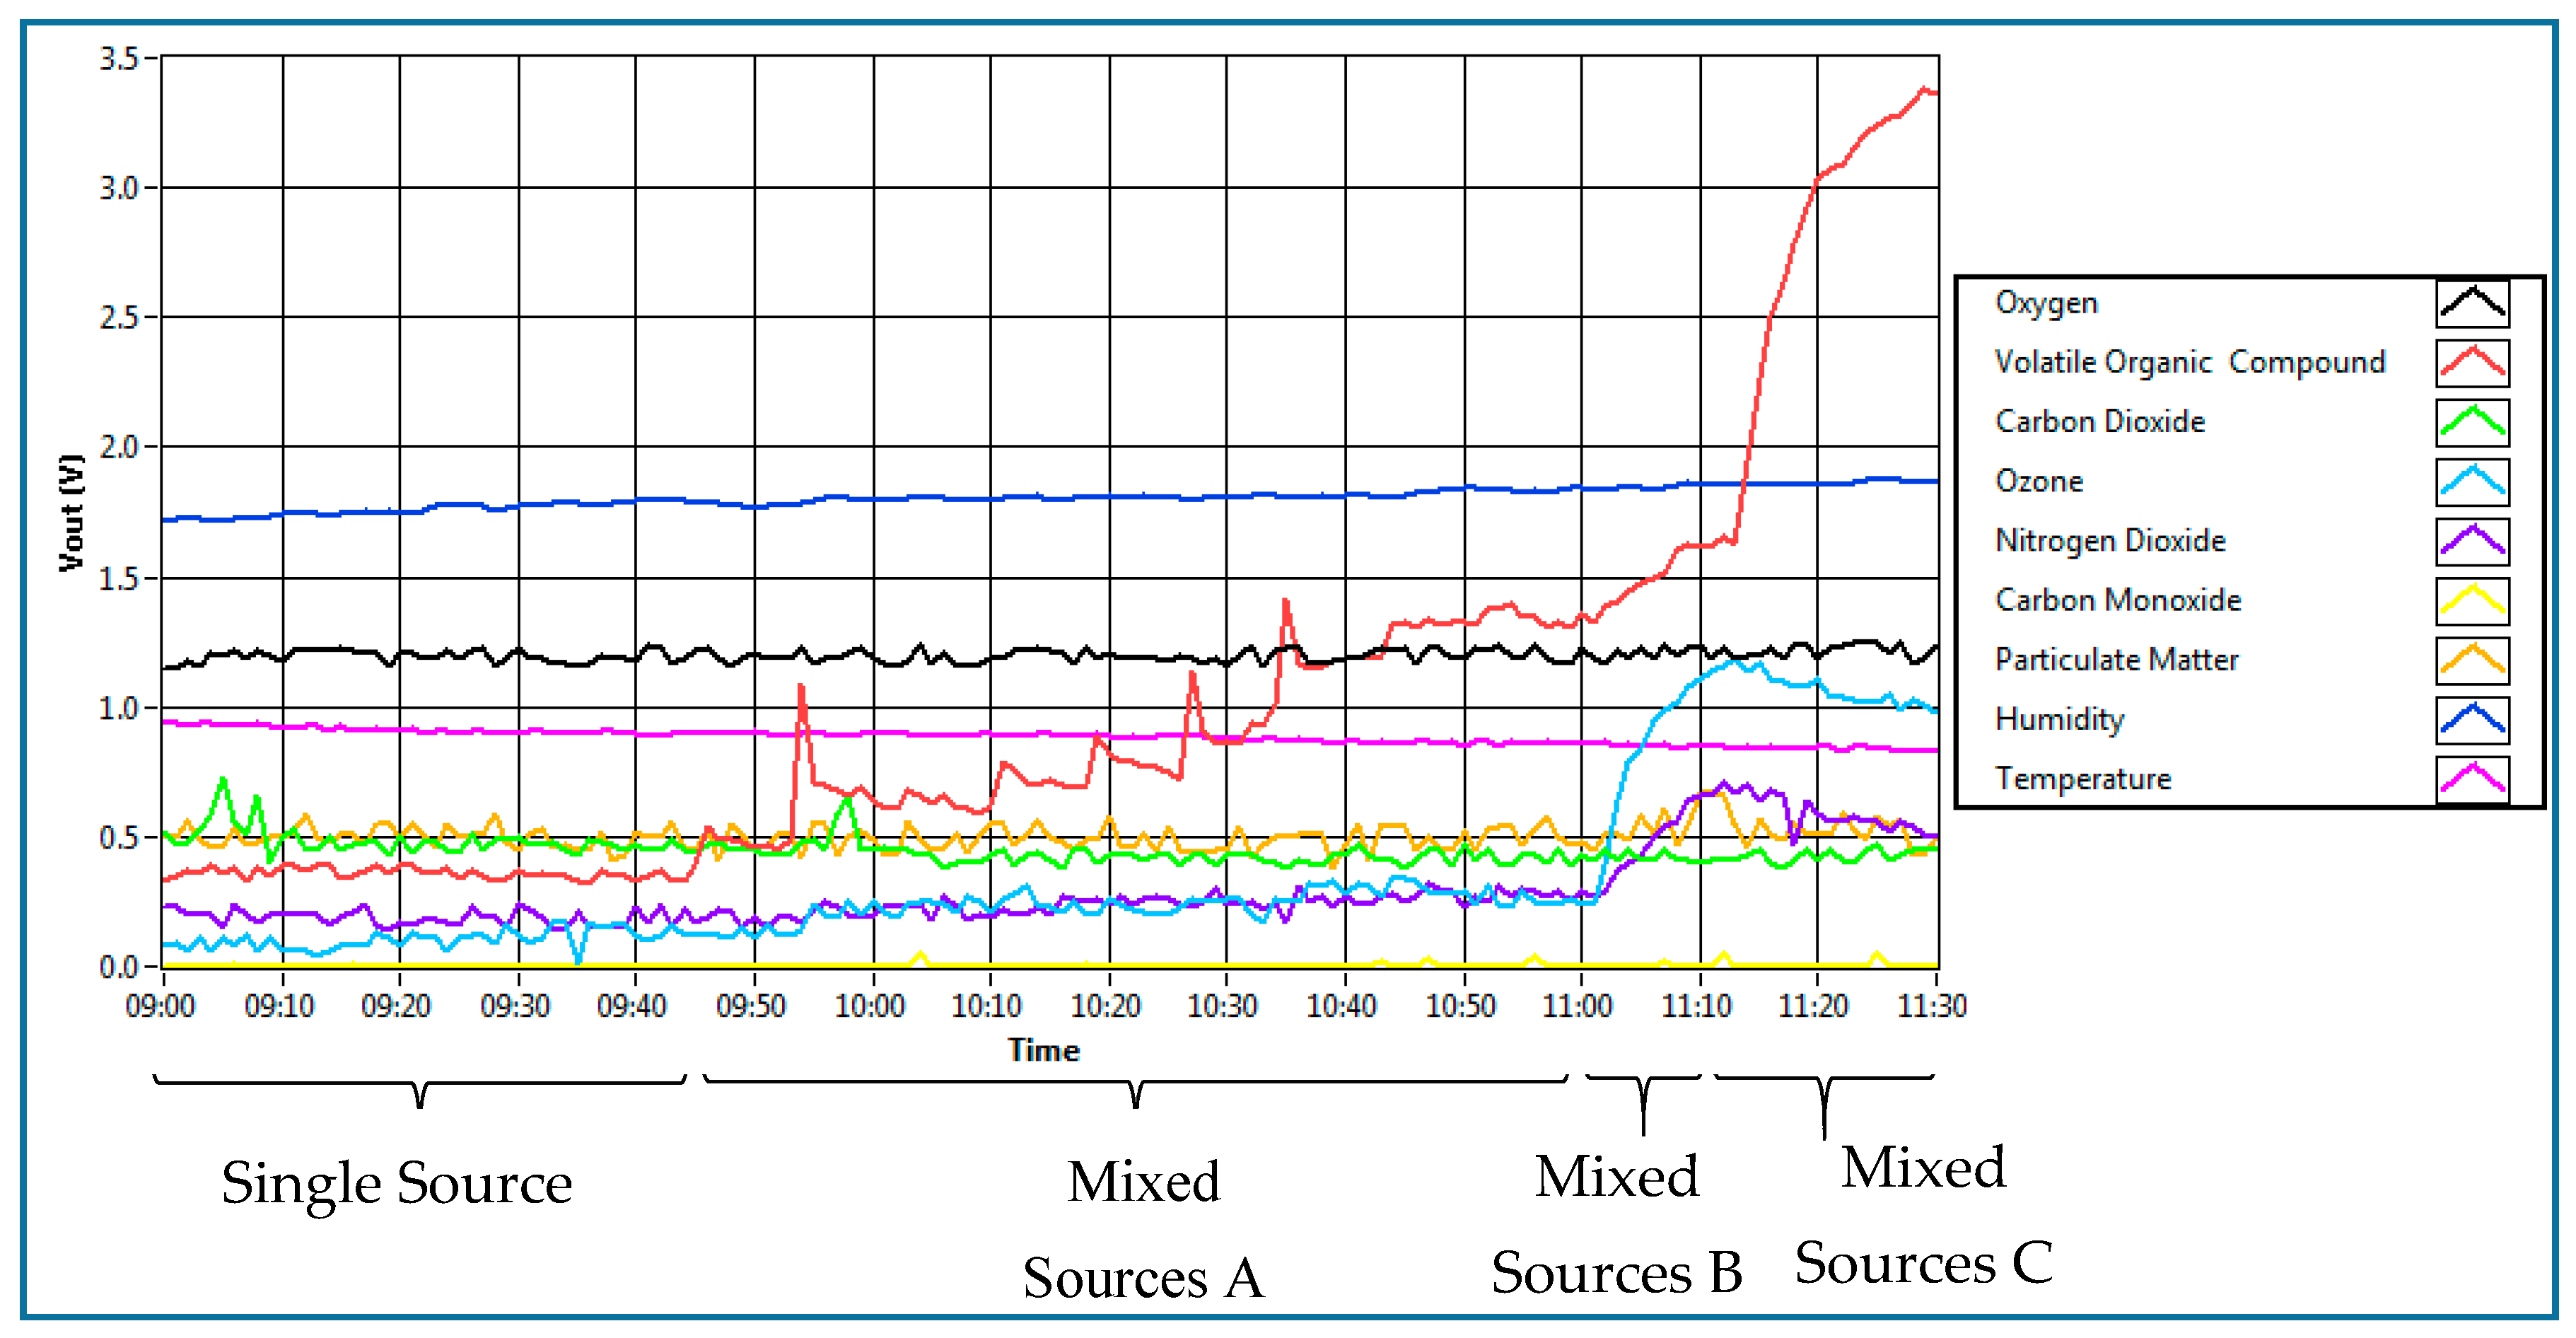
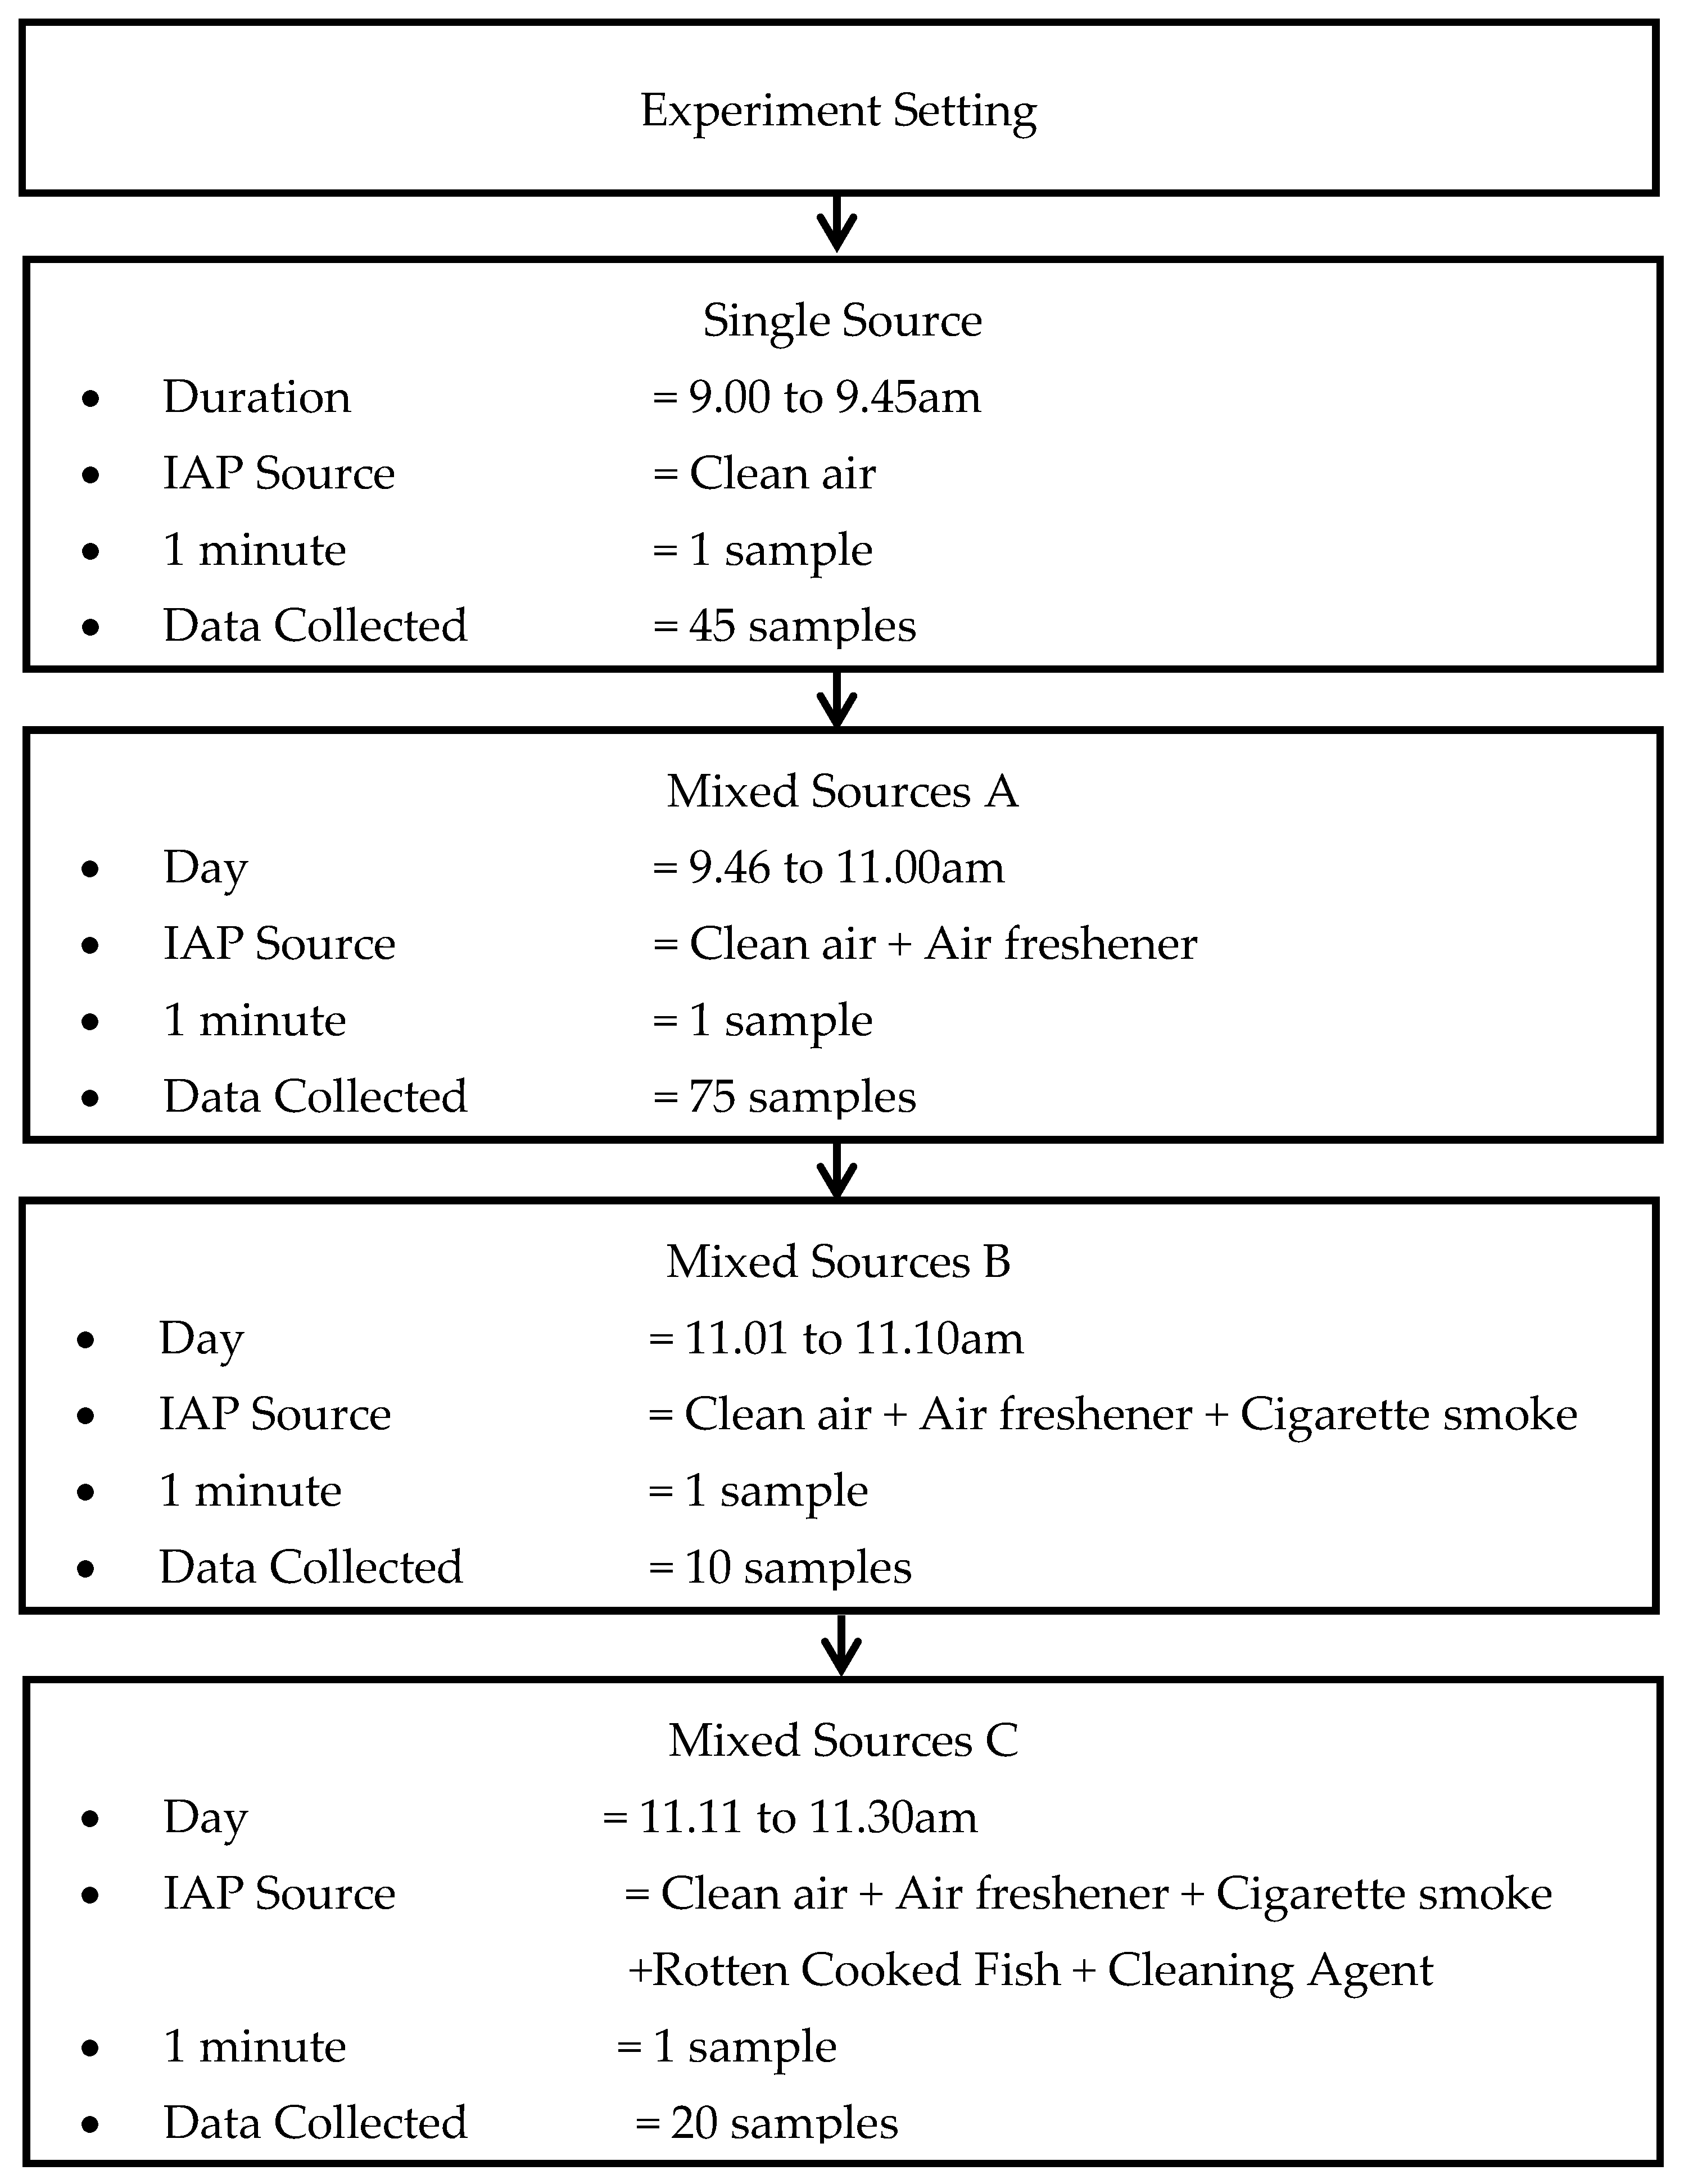
Figure 10 shows the process of data collection for testing the system when all sources present in a room.
The experiment began with the first condition present, which was the ambient air. There were 45 samples collected for ambient air over 45 min duration. This environment was tagged as “single source”. Then, an automatic air freshener which released fragrance every 15 min was placed inside the room. This environment was conducted to simulate the presence of two sources: ambient air and fragrance. The air freshener was hung up on the wall with a height of 2 m from the floor and about 2 m from the sensing node. Total data collected for the air freshener was over 75 min. This environment is tagged as “mixed sources A”. After that, a person was asked to smoke in the room. This environment was conducted to simulate the presence of three sources of IAP: ambient air, fragrance and single cigarette smoke. That person smoked one cigarette at the centre of the room. One cigarette took 10 min, which contribute to a 10 min data sample. This environment was tagged as “mixed sources B”. Lastly, the other two sources of IAQ, which are food and beverages and chemical cleaning product, were added into the environment. These two sources of IAP were placed in the middle of the room for 20 min, which gave 20 samples. This environment was conducted to simulate the presence of all five sources of IAP. Although there was no person smoking in the room at this time, the presence of smoking can still be traced. The presence of smoking can be traced up to 30 min, as shown in
Figure 10. This environment was tagged as “mixed sources C”.
Figure 11 shows the result of the sensor’s response for all situations as described above, from a single source up to five sources of IAP. It can be observed that the sensors react differently when additional sources of IAP are added into the room. The result of the classifier based on all environments is shows in
Table 12. Based on the table, it can be observed that the system can precisely detect a single source (ambient) with 45 correct classifications out of 45 data samples. This means that the MLP classifier can classify an ambient environment at 100% classification rate. Similarly, when the fragrance is present in the condition of “mixed sources A”, the system correctly classifies the two mixed sources of IAQ. The system did not misclassify the sources as unknown sources. This result is as expected because the environment of fragrance mixed with the ambient air is similar to the presence of fragrance alone, and the system has already been trained with such an environment. On the other hand, the system could not classify two samples out of 10 samples as the available sources (ambient air, presence of fragrance and presence cigarette smoke) in the condition of “mixed sources B”. Nonetheless, the MLP classifier correctly classified the other eight samples as fragrance (one) and cigarette smoke (seven). The result is also as expected, because the presence of smoking was overpowering the presence of fragrance due to the high amount of gases produced during smoking as compared to the amount of gases produced by air freshener. Likewise, in the condition of “mixed sources C”, when all of the sources of IAP were mixed together in the room, the MLP classifier could correctly classify 50% of the samples as combustion activity (one), food and beverages (two) and presence of chemical (seven). The other 10 samples have been classified as unknown sources.

 ,
, 


