
Economic Analysis for Collapse Hazard Areas

1
National Disaster Management Research Institute, Ulsan 44538, Korea
2
School of Civil and Environmental Engineering, Yonsei University, 50 Yonsei-ro Seodaemun-gu, Seoul 03722, Korea
*
Author to whom correspondence should be addressed.
Appl. Sci. 2017, 7(7), 693; https://doi.org/10.3390/app7070693
Submission received: 23 May 2017
/
Revised: 26 June 2017
/
Accepted: 2 July 2017
/
Published: 5 July 2017
Abstract
:In order to improve the quality assurance of collapse hazard zone projects, the economic effect of these projects in hazardous areas was analyzed. Ten areas were selected for the analysis to consider historical disaster records, and their effects were analyzed using a benefit/cost (B/C) analysis. The benefit was estimated using the human and material losses in the damage hazard zones and the cost was assumed with the total project cost. Analysis results indicate the B/C ratio is larger than 1 in the difference range, depending on factors such as analysis period and discount rates. According to the analysis results, the average B/C of the ten projects is 3.5. The project implies that a disaster management project in hazardous areas will yield positive investment effects. The results of this study can be applied for improving the ways investment priorities for collapse hazard zones are determined.
1. Introduction
Natural disasters have become more diversified and have increased in both frequency and scale. However, there seems to be an objective limit to what societies can do to prevent them. Unlike social disasters, prevention is essential to avoiding natural disasters and decreasing their consequential damage. As such, both prevention and preparation for natural disasters at the national level emerge as critical issues. Recently, the interest in disaster prevention programs has significantly increased, as has investment in such programs. Since disaster prevention programs should represent a priority, available resources should be utilized to attempt to enhance the efficiency of such programs. Therefore, the evaluation of their economic effects is an essential determinant of investment.
However, the evaluation of the benefits and costs of such programs is affected by the general uncertainty in the economic evaluation of public programs, which no theoretical framework has hitherto successfully addressed. However, benefit/cost analyses that calculate the ratio between benefits and costs have been conducted for the evaluation of public policies, such as disaster prevention programs. On the other hand, the efficiency and benefits of preventive disaster management measures in reducing and avoiding disaster impact have been assessed in a limited number of studies. A decision support tool commonly used for estimating the efficiency of such projects is thus the benefit/cost analysis mentioned previously. However, there is a lack of information on the actual costs, benefits, and profitability of natural disaster risk management projects [1].
The benefit/cost analysis model was introduced by Kim, et al. [2], who classify the types of disasters in terms of casualties (deaths and injuries), value of the damage to the victims, loss in terms of farm products, and loss in other categories (e.g., building, land, and public facilities). The damage to human lives, severity of the injuries suffered by victims, and other damage categories are assessed through analyzing flooded areas, frequency of floods, and size of damage to agricultural products as a function of flood duration.
Table 1 reports the results of case studies in South Korea and other countries, which have analyzed the efficiency of disaster prevention projects using the benefit/cost ratio (B/C). Specifically, Table 1 shows the sources and data assessing potential ex-ante benefits of such projects, as well as those capturing their ex-post benefits.
The ex-ante variables include a preliminary feasibility assessment of reclaimed land systems in response to floods by Mechler [1,3], the disaster mitigation project effects of the Federal Emergency Management Agency (FEMA) [4], and the Four Rivers Restoration Project by Lee [5]. The ex-post variables include post-evaluation of flood control in China for the past 40 years by Benson [6]; of a Red Cross mangrove planting project in Vietnam to protect coastal residents from typhoons and storms by the International Federation of the Red Cross (IFRC) [7]; of a disaster prevention and preparedness program by Venton and Venton [8]; and the effects of investment in Korea’s disaster prevention by the National Emergency Management Agency (NEMA) [9]. Specifically, Mechler and Venton used the internal rate of return (IRR) and net present value (NPV) along with the benefit/cost ratio. In most studies reported in Table 1, direct and indirect economic impacts were considered. The discount rate, for which values ranging between 0% and 20% exist in the literature, is often set to 12% for such projects. In some cases, potential social impacts were also included. In previous studies, it has been shown that the benefit/cost value decreases as the discount rate increase [10].
These studies have conducted a benefit/cost analysis of natural disaster damage; however, their scope was rather limited. In addition, collapse hazard zones have almost never been addressed. The existing benefit/cost analysis model among investment priorities determining measures in disaster prevention programs is inappropriate as a model for natural disaster hazard zones of different types such as collapse hazard zones which are not directly related with the flooded area or flooding frequency. This paper aims at filling this gap in the literature and presents a methodology for the benefit/cost analysis of collapse hazard zones.
2. Current Status of Natural Disaster Hazard Zone Follow-Up Repair Programs
Natural disaster hazard zones are classified into inundation, washout, isolation, collapse, vulnerable facilities, and tsunami hazard zones by disaster causes and damage targets (Table 2). In addition, each zone is categorized using a letter from A to D (Table 3). The NEMA has been implementing a natural disaster hazard zone follow-up repair program since 1998 as natural disaster prevention. This project aims to protect the life and wealth of residents in natural disaster hazard zones and improve their safety. Hitherto, KRW 3.2 trillion has been invested and repair projects have been completed in 938 out of the 1585 areas designated as hazard zones by the NEMA, in which disaster prevention projects were undertaken in 2012 (Table 3).
Flooding hazard zones amounted to 1034 spots (65%), followed by collapse hazard zones (272 spots, 17%), flood-sweeping hazard zones (135 spots, 9%), zones poorly equipped for disaster prevention (100 spots, 2%), isolated hazard zones (27 spots, 2%), and tidal wave hazard zones (17 spots, 1%).
3. Materials and Methods
3.1. Determining Analysis Areas
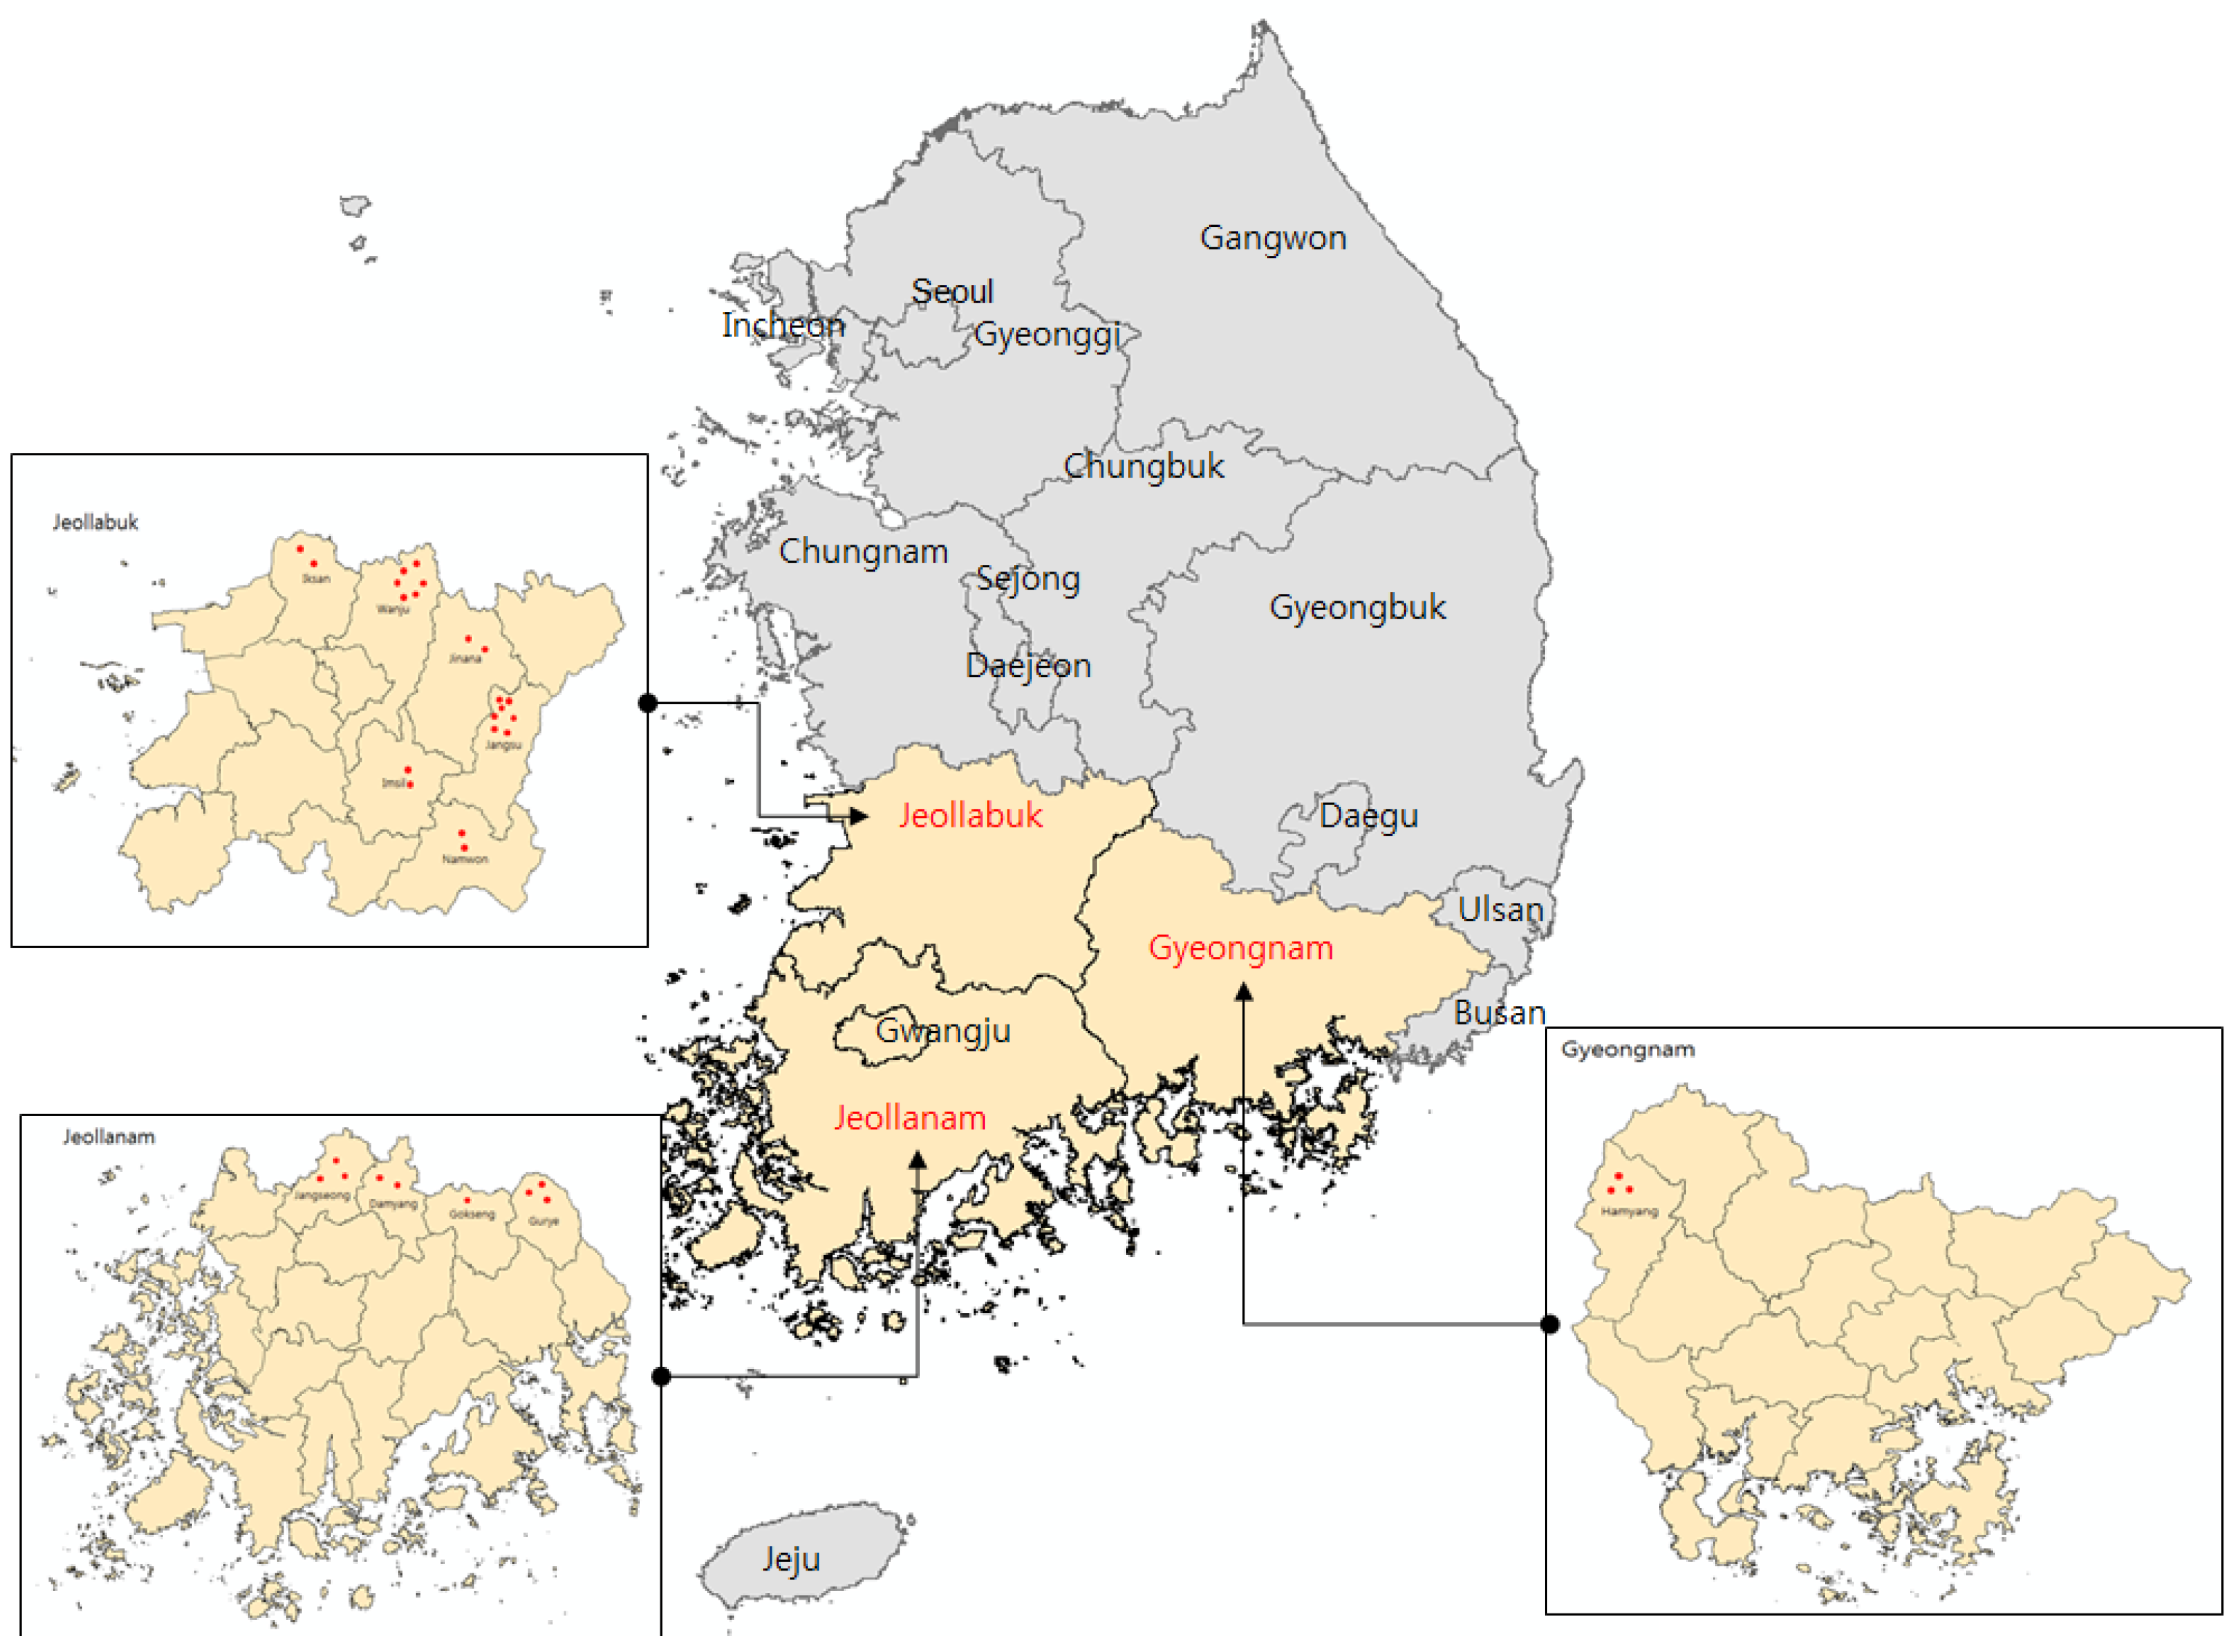
To conduct a benefit/cost analysis on collapse hazard zones, 10 project zones were selected for analysis: (i) collapse hazard zones determined by steep slopes as of 2010, surveyed by the Disaster Relief Measure Consultative Council and under survey when a natural disaster occurred; (ii) zones of mountain landslides of the biggest scale for the past five years (1995–2010); and (iii) zones designated as collapse hazard areas and where disaster prevention projects were underway in 2011 (Figure 1) (Table 4) [10]. In a benefit/cost analysis, information on real projects cost is needed and was available for the 10 project zones selected completed projects on recent damage.
3.2. Analysis Method
This study identified areas expected to face damage due to collapse in collapse hazard zones, such as flooding zones, and quantified assessment benefits. To this end, this study set up damage hazard zones by criteria for steep collapse hazard zones designated by Japan’s Ministry of Land, Infrastructure, Transport and Tourism (quoted from the Criteria for Damage Hazard Zones of Collapse Hazard Zones, National Disaster Prevention Institute).
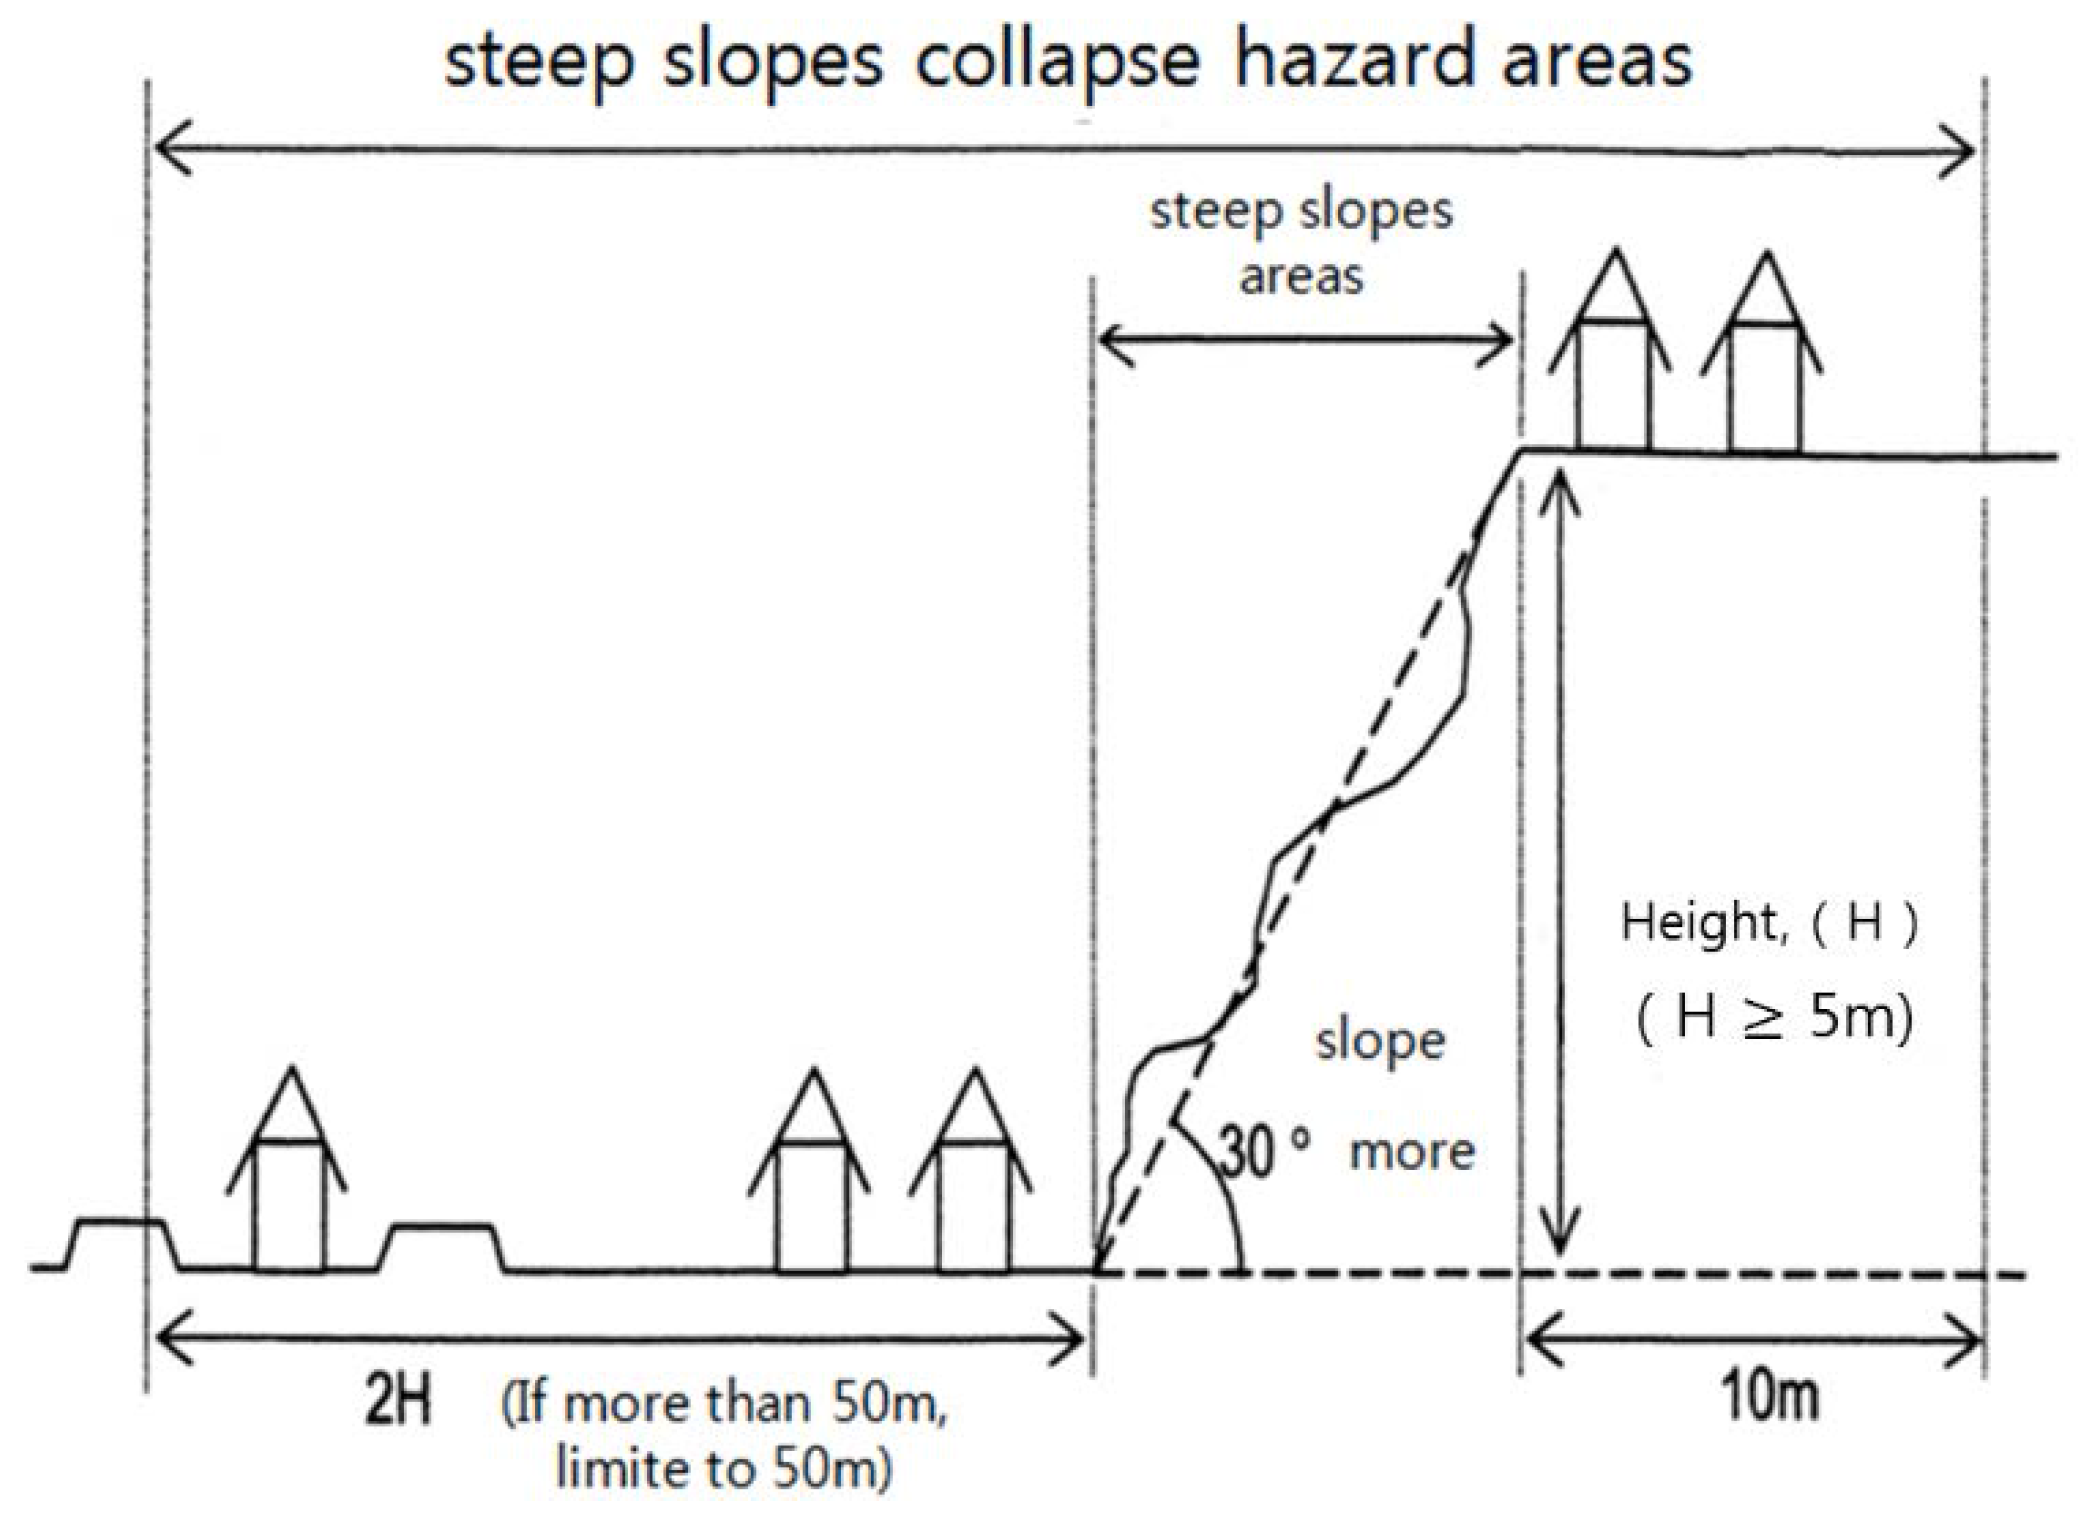
The criteria for steep collapse hazard zones refer to the scope of damage feared towards residential housing and public facilities adjacent to steep sloping sides with gradients above 30° and length above 5 m. This is a method to identify damage hazard zones due to collapse based on the benefit/cost analysis manual for landslide disasters by the Ministry of Land, Infrastructure, Transport and Tourism of Japan. Generally, the gradient of a steep slope is about twice its height (limited to approximately 50 m) from the bottom of the steep slope. When the limit exceeds 50 m, the height is limited to 50 m [10] (Figure 2). These criteria are based on the existing literature, such as the Study on the Applicability of an Early Warning System using Rainfall Data in Korea of the Natural Disaster Management Institute [11]. This study investigated both domestic and foreign criteria for identifying collapse hazard areas, all of which proved suitable for Korea.
Since collapse hazard zones features vary by zone, benefit items could also vary across areas. This study classified collapse hazard zones into the following categories: major (human loss and material loss); middle (private facilities and public facilities); minor (buildings, farming facilities, livestock facilities, other facilities, roads and bridges, national park facilities, farming facilities, school facilities, forestry facilities, railway facilities, military facilities, cultural facilities, and other facilities); and detailed items (houses, pensions, containers, collective rooming facilities, buried factories, farmlands swept away, greenhouses, damaged cattle sheds, damaged vehicles, tunnel collapse, roads swept away, walls and fences damaged, damage to forests, damaged cultural assets, and damaged electric power, gas, and city water).
Benefits should be quantified according to the damage relief effects of a selected program. This study used the natural disaster recovery guidelines (2010) method to quantify each benefit item. Natural disaster recovery guidelines (2010) set the amount of support funds (unit price) to be shouldered by the government and autonomous bodies in case of natural disasters. Support funds are directed to the area affected by a disaster based on these guidelines, which assess the amount of damage as presented in the Disaster Yearbook (Table 5).
Benefit/cost analysis is a method for comprehensively evaluating all the long-term costs and benefits from social and national perspectives. It is widely used for evaluating the economic impact of public programs, such as disaster prevention programs, despite the difficulties in assessing their true costs and benefits. Several indexes have been used for such analyses, such as B/C, NPV, and IRR—all of which can be used as complementary criteria in evaluating investment projects depending on the purpose of the application and traits of the investment project.
This study proposes to analyze the investment effects using the B/C ratio, which is currently used to analyze the economic impact of the natural disaster hazard zone management guidelines introduced by the National Emergency Management Agency [12]. The B/C ratio could be expressed as follows:
where is total benefit, total cost, discount rate, benefits generated years after the investment, incurred costs, period of benefit analysis, n′ period of cost analysis, the year in which t benefits were analyzed, and the year when the project was implemented.
Each element and assessment method for carrying out the benefit/cost analysis can be presented as follows [10].
Cost: The costs of analyzing costs and benefits are not assessed separately since the analysis is conducted for projects that are completed, so the cost refers to the total cost of the project (Table 6). Also there are real project costs in the all of the 10 project zones. Costs are calculated as construction costs and compensation expenses (land, building, business, etc.).
Discount rate: Taking into consideration an optimum level of discount rate is essential in the analysis of the costs and benefits for a project. Views on the optimum level of discount rate vary across countries and the methods for determining it also vary (Table 7). By applying the discount rates of 4%, 3%, and 2% as applied in the overseas cases, shown in Table 7, including the 5% discount rate recommended in the “collapse hazard zone” disaster recovery and reconstruction projects, the benefit-cost analysis has been implemented for this research.
Analysis period: This study considered (i) an analysis period of 50 years, as used in the disaster hazard zone management manual, (ii) an analysis period of 30 years, considering service life (iii) return period of project site considering actual damages (Table 8).
Maintenance costs: This study applied a maintenance cost of 0.5% of the project cost, as used by the disaster hazard zone management manual.
4. Results of Analysis
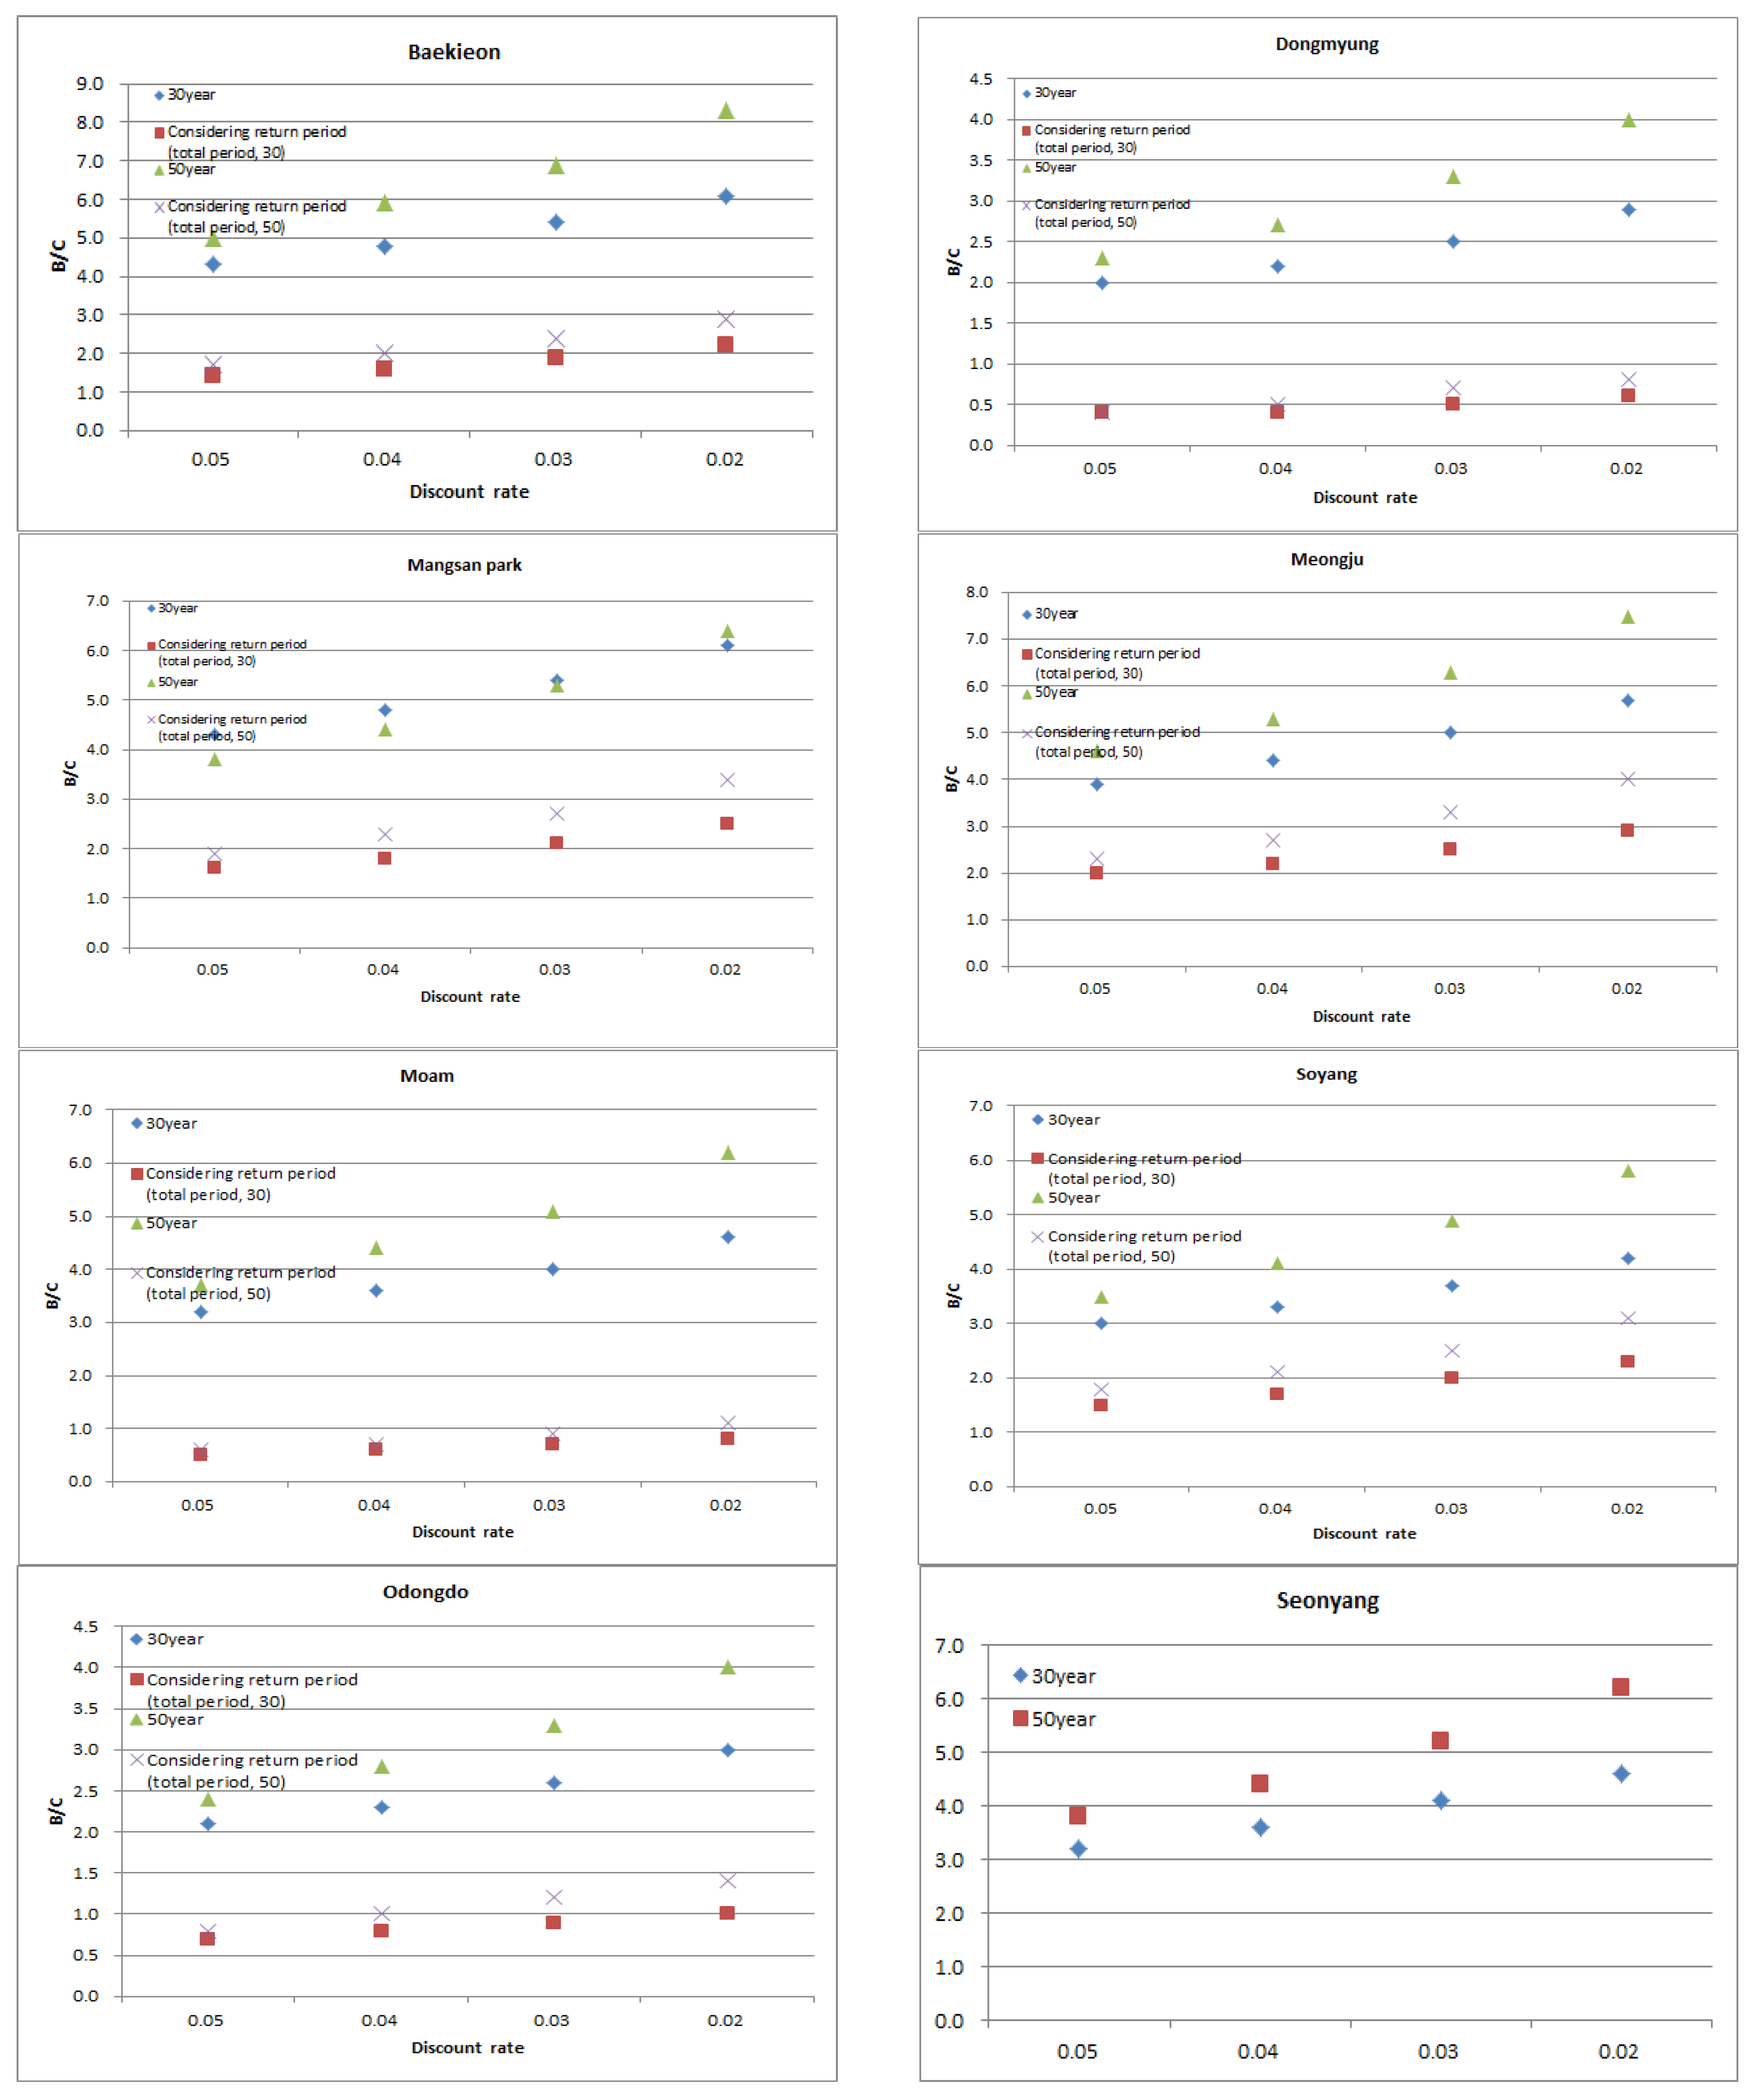
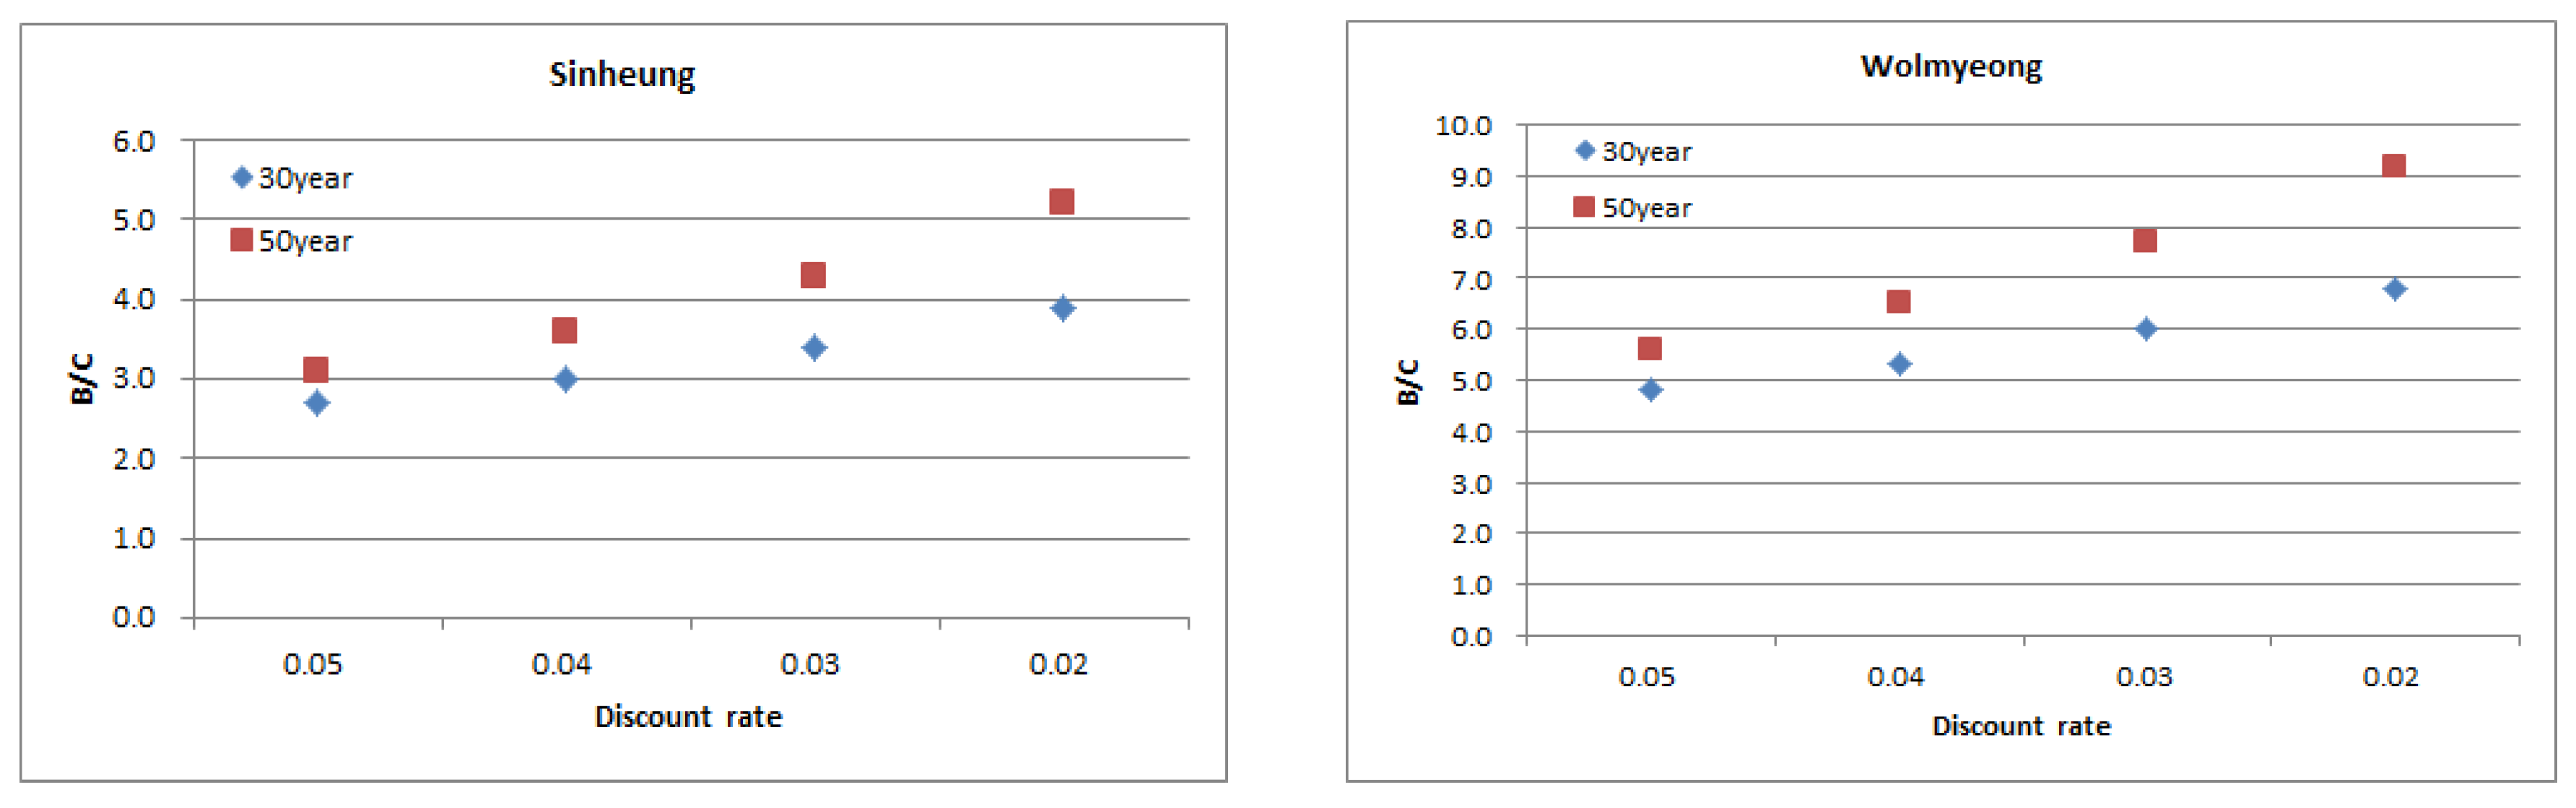
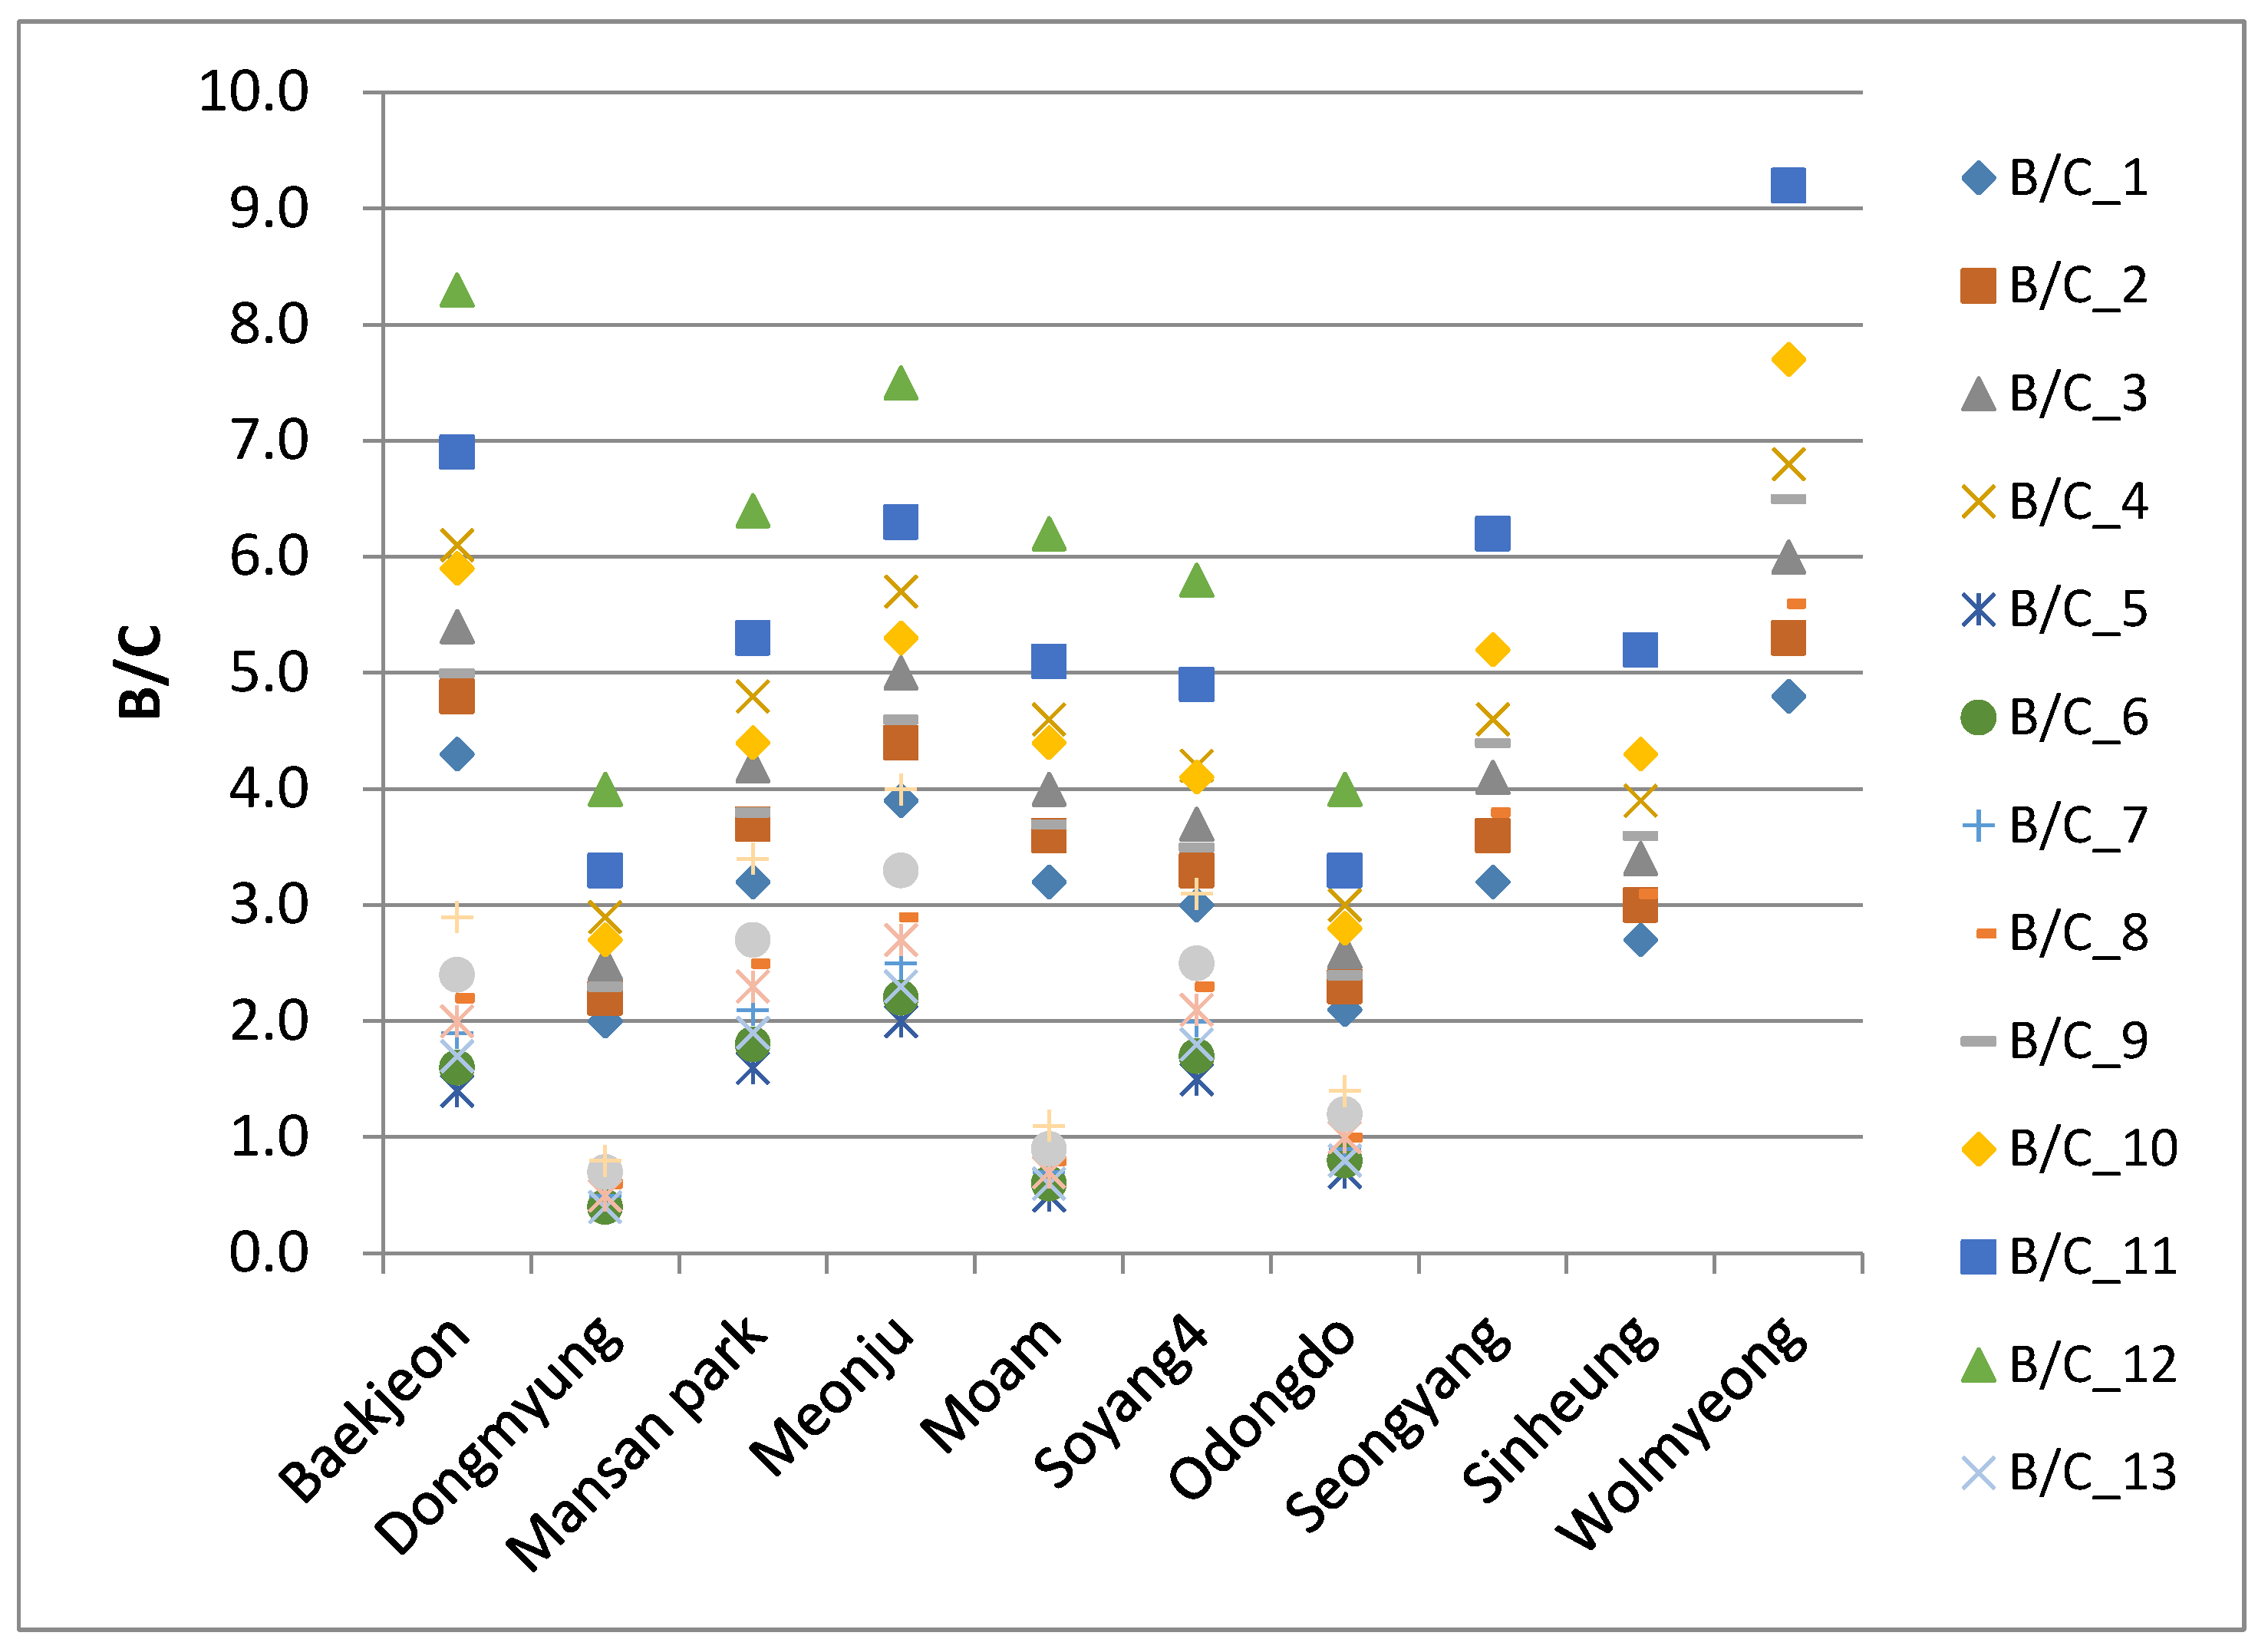
Figure 3 exhibits the computational result of B/C under various conditions (analysis periods and discount rates) of 10 “collapse hazard zones” disaster recovery and reconstruction projects (Table 9). The B/C estimates of this study utilize the damage risk zones and damage estimating methods suggested by “natural disaster hazard zone management guidelines [14]” for its damages estimating method. To calculate the cost, the actual operating expense was applied.
The benefit/cost analysis results of 10 target zones showed that the analysis periods and discount rates affected the analysis. For instance, in the 30- and 50-years analysis periods, without considering the return period (i.e., recurrence interval), all B/Cs were found to be more than one (Figure 3 and Figure 4).
It is seen that as the duration of the analysis periods increases, the cost/benefit ratio also increases. This is because the periods applied to the estimation of benefits have been increased, even though the total operating expense is fixed.
When the cost/benefit ratio of a certain project is one or more, the project could be regarded as economically feasible as the benefit of the project exceeds the cost. In case of Wolmyeong zone, its cost/benefits ratio was estimated to be nine or more. However, the cost/benefit ratio could be easily overestimated if the benefits are set to occur every year.
When the return period was considered, the analysis period was reduced according to the frequency of the damages that occurred in the past; this, in turn, reduced the benefits and consequently, lowered the cost/benefits ratio. However, since the return period is estimated by using the losses from the past ten years in this research, it is difficult to conclude whether this value is representative of the return period of the region. However, it is best to apply an analysis period that takes the return period into account to derive the appropriate estimation of cost/benefits ratio.
Additionally, as shown in Figure 3, the B/C ratio decreased as the discount rates increased. This is because the benefits that occur after the completion of the projects are greatly discounted and the present value is estimated to be small. The total operating expense is also evaluated by dividing it into project execution periods; hence, it is affected by discount rates, but the period is relatively short. On the other hand, when the return period was considered, the B/C values were similar due to the low impact of discount rates. This could be because the benefits that are affected by discount rates are small.
It is difficult to determine the investment effects of the “collapse hazard zone” disaster recovery and reconstruction projects with only 10 target zones analyzed for the cost/benefit analysis in this study. However, when the analysis period of 50 years and 5% discount rates are applied as the criteria for analyzing the investment effects of the zones for the projects, the average B/C for the ten target zones is 2.5 or more, and this is definitely more than 1. These results suggest that the “collapse hazard zone” disaster recovery and reconstruction projects will be more cost-effective.
5. Conclusions
In recent years, effective project policies for disaster relief are becoming increasingly important due to the increase in frequency of large-scale damages caused by natural disasters, resulting in significant human and socioeconomic impacts. Due to limited finances, the efficiency of disaster prevention investment, such as disaster prevention projects, needs to be properly evaluated.
In this research, the cost/benefit analysis was carried out on the “collapse hazard zone” disaster recovery and reconstruction projects. The analysis period of this study is based on the analysis period of 30 years (durable years of civil/structural facilities) and 50 years (the analysis period, recommended by “natural disaster hazard zone management guidelines”) depending on whether the return period is considered. In addition, cost/benefit analyses was carried out by applying each discount rate of 5%, 4%, 3%, and 2% in domestic and overseas analysis cases. As a result of the analyses, except for the cases where the return period was considered, the B/C ratio was 1 or more in most cases, even though they varied depending on the analysis periods and discount rates. The results show that the B/C ratio is greatly affected by analysis periods and discount rates. Thus, in order to evaluate the B/C ratio, the selection of analysis periods and discount rates are considered important.
This research could be used as the basis for explaining the need for a consistent and stable budget for the “collapse hazard zone” disaster recovery and reconstruction projects. It is also expected to be effectively used as policy data to improve and develop the “collapse hazard zone” disaster recovery and reconstruction projects. Meanwhile, the B/C ratio of a natural disaster project depends on the density of population and industrial activities. Maintenance costs should also be added to the costs; setting the scope of indirect benefits is also necessary. Therefore, further analysis is needed to provide an analysis criterion that can be more efficient in evaluating the economic effects of the “collapse hazard zone” disaster recovery and reconstruction projects.
In this research, benefits are reflected only for damages that have been directly estimated, but in future research, it is necessary to carry out studies considering the indirect benefits.
Author Contributions
Bo-Young Heo proposed the topic of this study and wrote the paper, while Won-Ho Heo performed the simulations and analyzed the data.
Conflicts of Interest
The authors declare no conflicts of interest.
References
- Mechler, R. Cost-Benefit Analysis of Natural Disaster Risk Management in Developing and Emerging Countries; Federal Ministry for Economic Cooperation and Development: Bonn, Germany, 2005.
- Kim, G.M.; Kim, T.S.; Park, T.S.; Lee, Y.J.; Song, M.K. Study on the Measures of Improving Analysis of Economic Values of Water Conservation Project; Ministry of Land, Infrastructure, Transport and Tourism: Sejong-si, Korea, 2001.
- Mechler, R. Semarang Case Study. In Interim Report for GTZ; Federal Ministry for Economic Cooperation and Development: Bonn, Germany, 2004. [Google Scholar]
- Federal Emergency Management Agency (FEMA). FY 2006 Pre-Disaster Mitigation Program—Guidance; FEMA: Cleveland, OH, USA, 2006.
- Lee, S.W. Economic Implications of 4 Great Rivers Revitalization Project; Korea Water Resources Association: Seoul, Korea, 2009. [Google Scholar]
- Benson, C. The cost of disasters. In Development at Risk? Natural Disasters and the Third World; Twigg, J., Ed.; Oxford Centre for Disaster Studies: Oxford, UK, 1988. [Google Scholar]
- International Federation of Red Cross and Red Crescent (IFRC). World Disasters Report 2002; IFRC: Geneva, Switzerland, 2002. [Google Scholar]
- Venton, C.; Venton, P. Disaster Preparedness Programmes in India: A Cost Benefit Analysis; Humanitarian Practice Network: London, UK, 2004. [Google Scholar]
- National Emergency Management Agency. National Emergency Management a Study on the Research for the Method to Strengthen the Disaster Mitigation Activities and to Increase the Investments; National Emergency Management: Sejong-si, Korea, 2006.
- Natural Disaster Management Institute. Study on the Improvement in the Determination of the Investment Priority for Collapse Hazard Areas; NDMI: Ulsan, Korea, 2011.
- Natural Disaster Management Institute. Study on the Applicability of an Early Warning System Using Rainfall Data in Korea; NDMI: Ulsan, Korea, 2008.
- Ministry of Land, Infrastructure, Transport and Tourism (MITT). Guideline for Cost-Benefit Analysis of Public Projects; MITT: Tokyo, Japan, 2004.
- National Emergency Management Agency. Annual Disaster Report; National Emergency Management Agency: Sejong-si, Korea, 2001–2010.
- National Emergency Management Agency. Guideline for Management of Area Vulnerable to Natural Disaster; Ministry of Public Safety and Security: Sejong-si, Korea, 2012.
Figure 1.
Location map of analysis areas. Source: Natural Disaster Management Institute. Korea, 2011 (http://www.ndmi.go.kr/research/research/view.jsp).
Figure 1.
Location map of analysis areas. Source: Natural Disaster Management Institute. Korea, 2011 (http://www.ndmi.go.kr/research/research/view.jsp).

Figure 2.
Sectional view of criteria of steep collapse hazard zones [10]. Source: Ministry of Land, Infrastructure and Transport Infrastructure Development Institute, Japan. (http://www.mlit.go.jp/sogoseisaku/inter/keizai/gijyutu/pdf/sediment_e.pdf).
Figure 2.
Sectional view of criteria of steep collapse hazard zones [10]. Source: Ministry of Land, Infrastructure and Transport Infrastructure Development Institute, Japan. (http://www.mlit.go.jp/sogoseisaku/inter/keizai/gijyutu/pdf/sediment_e.pdf).

Figure 3.
Benefit/cost (B/C) results of project sites.


Figure 4.
B/C distribution of project sites.


Table 1.
Benefit/cost analysis of disaster prevention projects.
| Sources and Data Types | Actual or Potential Benefits | Benefit/Cost Results | |
|---|---|---|---|
| Ex-ante | Mechler [1]: Preliminary feasibility assessment of reclaimed land system in response to floods, Piura, Peru | Reduction of socioeconomic and indirect impacts | 3.8 |
| Mechler [3]: Theoretical study of integrated water management and floods protection plan, Semarang, Indonesia | Reduction of direct and indirect economic impact | 2.5 | |
| FEMA [4]: Disaster mitigation project effects | Reduction of direct and indirect economic impact | 4.0 | |
| Lee [5]: Four River Restoration Project | Reduction of direct and indirect economic impact | More than 1.0 | |
| Ex-post | Benson, C [6]: Post-evaluation methods of flood control has been executed in China for the past 40 years of the 20th century | Unclear, direct damage reduction | 4.0 |
| IFRC [7]: Post-evaluation of “Red Cross Mangrove Planting Project” in order to protect coastal residents from typhoons and storms, Philippines | Savings of embankment maintenance cost | 52.0 (1994–2001) | |
| Venton and Venton [8]: Post-evaluation of combined disaster prevention and preparedness program, Bihar and Andhra Pradesh, India | Reduction of direct and indirect economic impact | 3.76 (Bihar) 13.38 (Andhra Pradesh) | |
| NEMA [9]: Investment in the field of disaster prevention, Korea | Reduction of direct and indirect economic impact | 4.5 | |
Table 2.
Designation of areas vulnerable to natural disasters.
| Hazard | Inundation | Washout | Isolation | Collapse | Vulnerable Facilities | Tsunami | Total | |
|---|---|---|---|---|---|---|---|---|
| Status | ||||||||
| Management | 378 | 90 | 14 | 125 | 29 | 11 | 647 | |
| Decommission | 656 | 45 | 13 | 147 | 71 | 6 | 938 | |
| Total | 1034 | 135 | 27 | 272 | 100 | 17 | 1585 | |
Table 3.
Classification standard (National Emergency Management Agency (NEMA), 2012).
| Classification | Standard |
|---|---|
| A | High risk potential for personal injury due to disasters |
| B | Risk potential for damage to buildings (house, shopping center, public building) due to disaster |
| C | Risk potential for damage to infrastructure (industrial complex, railroad, road) due to disaster Agricultural land in flood hazard areas |
| D | Low possibilities of collapse and inundation, but continuous management needed because of climate change |
Table 4.
Project sites for benefit/cost analysis (NEMA, 2012).
| Si-Do | Si-Gu | Project Site | Site Area (ha) | Project Period |
|---|---|---|---|---|
| Jeonnam | Yeosu | Odongdo | 2.5 | 2011~2013 |
| Gyeongsangbuk | Sacheon | Mangsan park | 2.47 | 2008~2011 |
| Gyeongsangbuk | Gimcheon | Moam | 2.35 | 2012~2013 |
| Jeonbuk | Gunsan | Wolmyeong | 2.0 | 2010~2011 |
| Jeonbuk | Gunsan | Sinheung | 0.8 | 2010~2013 |
| Jeonbuk | Gunsan | Seonyang | 0.7 | 2010~2011 |
| Gangwon | Sokcho | Dongmyumg | 0.7 | 2007~2011 |
| Gangwon | Chuncheon | Soyang | 0.6 | 2010~2011 |
| Jeonnam | Gwangyang | Myeongiu | 0.3 | 2011~2012 |
| Gyeongsangbuk | Yecheon | Beakieon | 0.05 | 2010~2011 |
Table 5.
Application contents of natural disaster recovery guideline.
| Contents | Unit | Unit Cost (KRW) | ||
|---|---|---|---|---|
| A. Death, missing, injury | Relief fund | Death, Missing (Householder) | Person | 10,000,000 |
| Death, Missing (Family member) | Person | 5,000,000 | ||
| Injury (Householder) | Person | 5,000,000 | ||
| Injury (Family member) | Person | 2,500,000 | ||
| B. Relief of victims | Relief of victims | Relief money | Person/day | 6000 |
| C. Housing recovery | Housing damage | Whole damage/Loss | House | 30,000,000 |
| Half damage | House | 15,000,000 | ||
| D. Agricultural land recovery | Agricultural land Missing or burying | Agricultural land missing | m2 | 2087 |
| Agricultural land buried | m2 | 840 | ||
| E. Road and bridge | Road | Pavement | m | 4,452,000 |
| Establishment | m | 4,828,950 | ||
| Urban road, farming and fishing village road | Urban road | m | 1,340,000 | |
| Farming and fishing village road | m | 790,000 | ||
| F. National park facilities | - | National park facilities route (B = 1.5 m) | km | 351,037,000 |
| G. School facilities | Fence | Brick fence | m2 | 149,000 |
| Block fence | m2 | 104,000 | ||
| Wire fence | m2 | 70,000 | ||
| H. Forest facilities | - | Landslide | ha | 95,940,000 |
| Debris barrier (B = 50 m, H = 8.3 m) | Quantity | 287,539,000 | ||
| Forest road | km | 188,000,000 | ||
| Toilet | - | 1,026,000 | ||
| Arboretum—Forest seedbed | - | 5000 | ||
| Greenhouse | - | 80,000 | ||
| Ecology observation route | km | 125,499,000 | ||
| Lounge | - | 1,512,000 | ||
| Street trees | - | 121,000 | ||
Table 6.
Cost of project sites.
| Project Site | Cost (USD Million) | Project Site | Cost (USD Million) |
|---|---|---|---|
| Odongdo | 16.0 | Seonyang | 6.5 |
| Mangsan Park | 3.7 | Dongmyumg | 5.0 |
| Moam | 8.0 | Soyang | 3.3 |
| Wolmyeong | 5.0 | Myeongiu | 1.2 |
| Sinheung | 15.0 | Beakieon | 2.6 |
Source: Natural Disaster Management Institute. Korea, 2011 (http://www.ndmi.go.kr/research/research/view.jsp).
Table 7.
Discount rates used in benefit/cost analyses of public projects (MLTT, 2004) [12].
Table 7.
Discount rates used in benefit/cost analyses of public projects (MLTT, 2004) [12].
| Country | Discount Rate | Source |
|---|---|---|
| Britain | 3.5% | The Green Book: Appraisal and Evaluation in Central Government, 2003.1 H.M. Treasury Guidance, 2003 |
| India | 3% | Macro-Economic Evaluation of Transport Infrastructure Investments, Evaluation Guidelines for the Federal Transport Investment Plan, The Federal Minister of Transport, 1992 |
| Belgium | 4% | Assessing the Benefits of Transport, ECMT, 2001 |
| France | 8% | Assessing the Benefits of Transport, ECMT, 2001 |
| Sweden | 4% | Assessing the Benefits of Transport ECMT, 2001 |
| New Zealand | 10% | Evaluation Procedures for Alternatives to Roading, Transfund New Zealand |
| Asian Development Bank | 10–12% | Guidelines for the Economic Analysis of Projects, 1997 |
Table 8.
Return period of project site [13].
Table 8.
Return period of project site [13].
| Damage (Unit Cost (KRW)) | |||||||||||
|---|---|---|---|---|---|---|---|---|---|---|---|
| Project Site | 2001 | 2002 | 2003 | 2004 | 2005 | 2006 | 2007 | 2008 | 2009 | 2010 | Return Period (year) |
| Baekieon | 73,160,000 | 52,747,000 | 319,698,000 | 0 | 0 | 0 | 0 | 0 | 0 | 0 | 3.33 |
| Moam | 0 | 10,111,134,000 | 6,670,015,000 | 0 | 0 | 0 | 0 | 0 | 0 | 0 | 5.00 |
| Odongdo | 0 | 864,710,000 | 1,561,473,000 | 0 | 0 | 492,308,000 | 0 | 0 | 0 | 0 | 3.33 |
| Dongmyung | 0 | 1,130,057,000 | 148,094,000 | 0 | 0 | 0 | 0 | 0 | 0 | 0 | 5.00 |
| Soyang | 779,293,000 | 1,140,178,000 | 87,249,000 | 0 | 0 | 3,704,123,000 | 0 | 0 | 1,670,263,000 | 0 | 2.00 |
| Mangsan Park | 645,444,000 | 591,657,000 | 3,782,842,000 | 0 | 91,407,000 | 1,067,638,000 | 0 | 0 | 0 | 0 | 2.00 |
| Myeongiu | 0 | 2,649,450,000 | 1,109,929,000 | 0 | 0 | 698,702,000 | 131,625,000 | 0 | 4,265,765,000 | 0 | 2.00 |
| Seonyang | 0 | 0 | 0 | 0 | 0 | 0 | 0 | 0 | 0 | 0 | - |
| Sinheung | 0 | 0 | 0 | 0 | 0 | 0 | 0 | 0 | 0 | 0 | - |
| Wolmyeong | 0 | 0 | 0 | 0 | 0 | 0 | 0 | 0 | 0 | 0 | - |
Table 9.
Evaluation condition.
| Classification | Analysis Period | Discount Rate | Classification | Analysis Period | Discount Rate |
|---|---|---|---|---|---|
| B/C_1 | 30 years | 5% | B/C_9 | 50 years | 5% |
| B/C_2 | 4% | B/C_10 | 4% | ||
| B/C_3 | 3% | B/C_11 | 3% | ||
| B/C_4 | 2% | B/C_12 | 2% | ||
| B/C_5 | Considering return period (total period, 30) | 5% | B/C_13 | Considering return period (total period, 50) | 5% |
| B/C_6 | 4% | B/C_14 | 4% | ||
| B/C_7 | 3% | B/C_15 | 3% | ||
| B/C_8 | 2% | B/C_16 | 2% |
© 2017 by the authors. Licensee MDPI, Basel, Switzerland. This article is an open access article distributed under the terms and conditions of the Creative Commons Attribution (CC BY) license (http://creativecommons.org/licenses/by/4.0/).
Share and Cite
MDPI and ACS Style
Heo, B.-Y.; Heo, W.-H. Economic Analysis for Collapse Hazard Areas. Appl. Sci. 2017, 7, 693. https://doi.org/10.3390/app7070693
AMA Style
Heo B-Y, Heo W-H. Economic Analysis for Collapse Hazard Areas. Applied Sciences. 2017; 7(7):693. https://doi.org/10.3390/app7070693
Chicago/Turabian StyleHeo, Bo-Young, and Won-Ho Heo. 2017. "Economic Analysis for Collapse Hazard Areas" Applied Sciences 7, no. 7: 693. https://doi.org/10.3390/app7070693
Note that from the first issue of 2016, this journal uses article numbers instead of page numbers. See further details here.