1. Introduction
Masonry shear walls are commonly designed to resist the effect of gravity load and lateral load resulting from an earthquake excitation or wind loading. The design criteria depends on many factors, including the magnitude of axial loading, the amount of flexural and shear reinforcement, the wall aspect ratio (height to length) and the mechanical properties of masonry [
1,
2].
Generally, there are two types of failure mode which can be occur in masonry shear walls subjected to horizontal loading. The first type is a flexural failure, which is defined by the presence of crushing the masonry in the plastic hinge region or the tensile yielding of the vertical reinforcement [
3,
4,
5,
6,
7,
8]. This type of failure is preferred due to its efficiency in energy dissipating and providing more ductility through yielding of flexural reinforcement and inelastic deformation of the masonry. The second type is a shear failure, which is defined by the presence of diagonal tensile cracking or sliding shear along the mortar bed joints. This type of failure should be avoided due to its relative brittleness and rapid strength degradation after it reaches its maximum strength [
9,
10,
11,
12,
13,
14].
Nowadays, many developed countries have applied the energy conservation concept in building technology to create alternative building materials which have positive impacts on the environment. Therefore, a newly-developed type of concrete masonry unit with self-insulating features has been used for residential buildings with low to medium heights in seismic area zones with severe ambient conditions [
15].
A new type of clay masonry system was recently developed in Europe to be used in the construction of single story houses. The developed system has a good thermal resistance, with capability to be used in earthquake zones. Also, this system contributes significantly in the design and construction of cost-effective buildings in seismic regions [
16]. In this study, a new type of self-insulating concrete masonry shear wall has been proposed which can be used for both low and medium height residential buildings in seismic area zones. There are two advantages of this new system, firstly, it provides stronger bonds than the ordinary concrete masonry units by facilitating the grout between the units, both vertically and horizontally, and secondly, it reduces the thermal bridges by using continuous insulation materials [
15]. Accordingly, there is a vital need for a comprehensive study to evaluate the parameters that affect the behavior of the new type of the self-insulating concrete masonry shear wall (SCMSW) under earthquake excitation.
In this research, the behavior of six fully-grouted masonry shear walls which were built from a new type of self-insulating concrete masonry unit under in-plane loading have been evaluated and reported. Moreover, the relationship between the key design parameters such as the amount of axial loading, aspect ratio and the amount of reinforcement of self-insulating concrete masonry shear walls (SCMSWs) were defined to facilitate better understanding of the inelastic behavior under seismic loading.
2. Materials and Methods
The experimental program was designed to investigate the amount of the flexural reinforcement, the level of axial compressive stress and the aspect ratio on the flexural behavior of a new type of self-insulating concrete masonry shear wall (SCMSW). All SCMSW specimens were subjected to in-plane lateral cyclic displacement loading.
2.1. Test Specimens
Six fully-grouted self-insulating concrete masonry shear walls (SCMSWs) (denoted SW1–SW6) were constructed and tested under in-plane cyclic loading (
Table 1). All SCMSWs had a nominal thickness of 240 mm, while the length and height were varied to provide aspect ratios of 1.0, 2.0, 2.6, and 3.6.
Table 1 illustrates the wall details. The bar size of the vertical reinforcement varied among the SCMSWs. SW1 through SW5 had evenly distributed vertical reinforcement, while SW6 had evenly distributed vertical reinforcement in addition to vertical reinforcement from two columns at the wall ends (boundary elements). A similar horizontal reinforcement amount was distributed over all SCMSWs. This reinforcement was made to ensure that the nominal shear strength was greater than the nominal flexural strength, predicted by using moment-curvature analysis. The horizontal reinforcement consisted of one bar of 8-mm diameter in every course for all SCMSWs. The horizontal reinforcement was anchored around the outermost vertical reinforcement bars with 180-degree hooks. Walls SW4 through SW6 had an intermediate beam at their mid height to simulate the effect of intersection floors. SW1 had no lab splices, while the other SCMSW specimens had lab splices at a distance 1.5 m from the top surface of the foundation beam. The lab splices length in these SCMSWs met the provisions specified by the Chinese Masonry Code (GB50003-2011) [
17]. The walls’ configuration is shown in
Figure 1.
It should be noted that all SCMSW walls were constructed by professional masons using a running bond pattern of standard production with face shell mortar bedding and 10-mm mortar joints. A summary of the vertical and horizontal reinforcement distribution and level of axial compressive stress for the tested walls is given in
Table 1.
2.2. Materials Properties
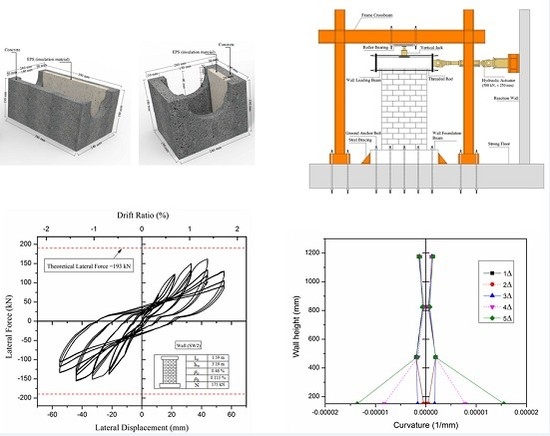
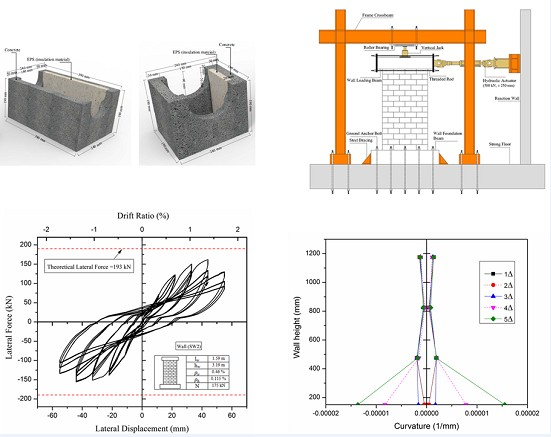
There are two types of the developed self-insulating concrete masonry unit (SCMU) used in the construction of the SCMSW walls as shown in
Figure 2. All SCMSW specimens were constructed with the same SCMUs, mortar and grout properties.
Table 2 shows the average value of the compressive strength for the masonry materials used in SCMSW specimens while
Table 3 presents the properties of the insulation material (expanded polystyrene (EPS) foam) which was inserted in the units. Additional details and description of the materials and methods of testing are reported in the published study [
15].
For the steel reinforcement properties, samples were taken from the same steel reinforcement used to construct the masonry shear walls. The samples were subjected to tensile testing according to the standard procedure specified by Chinese standard (GB/T 228-2002) [
18]. The average yield strengths for the Ø 8-, Ø 16- and Ø 20-mm reinforcing steel were 358, 442.5 and 445 N/mm
2, respectively.
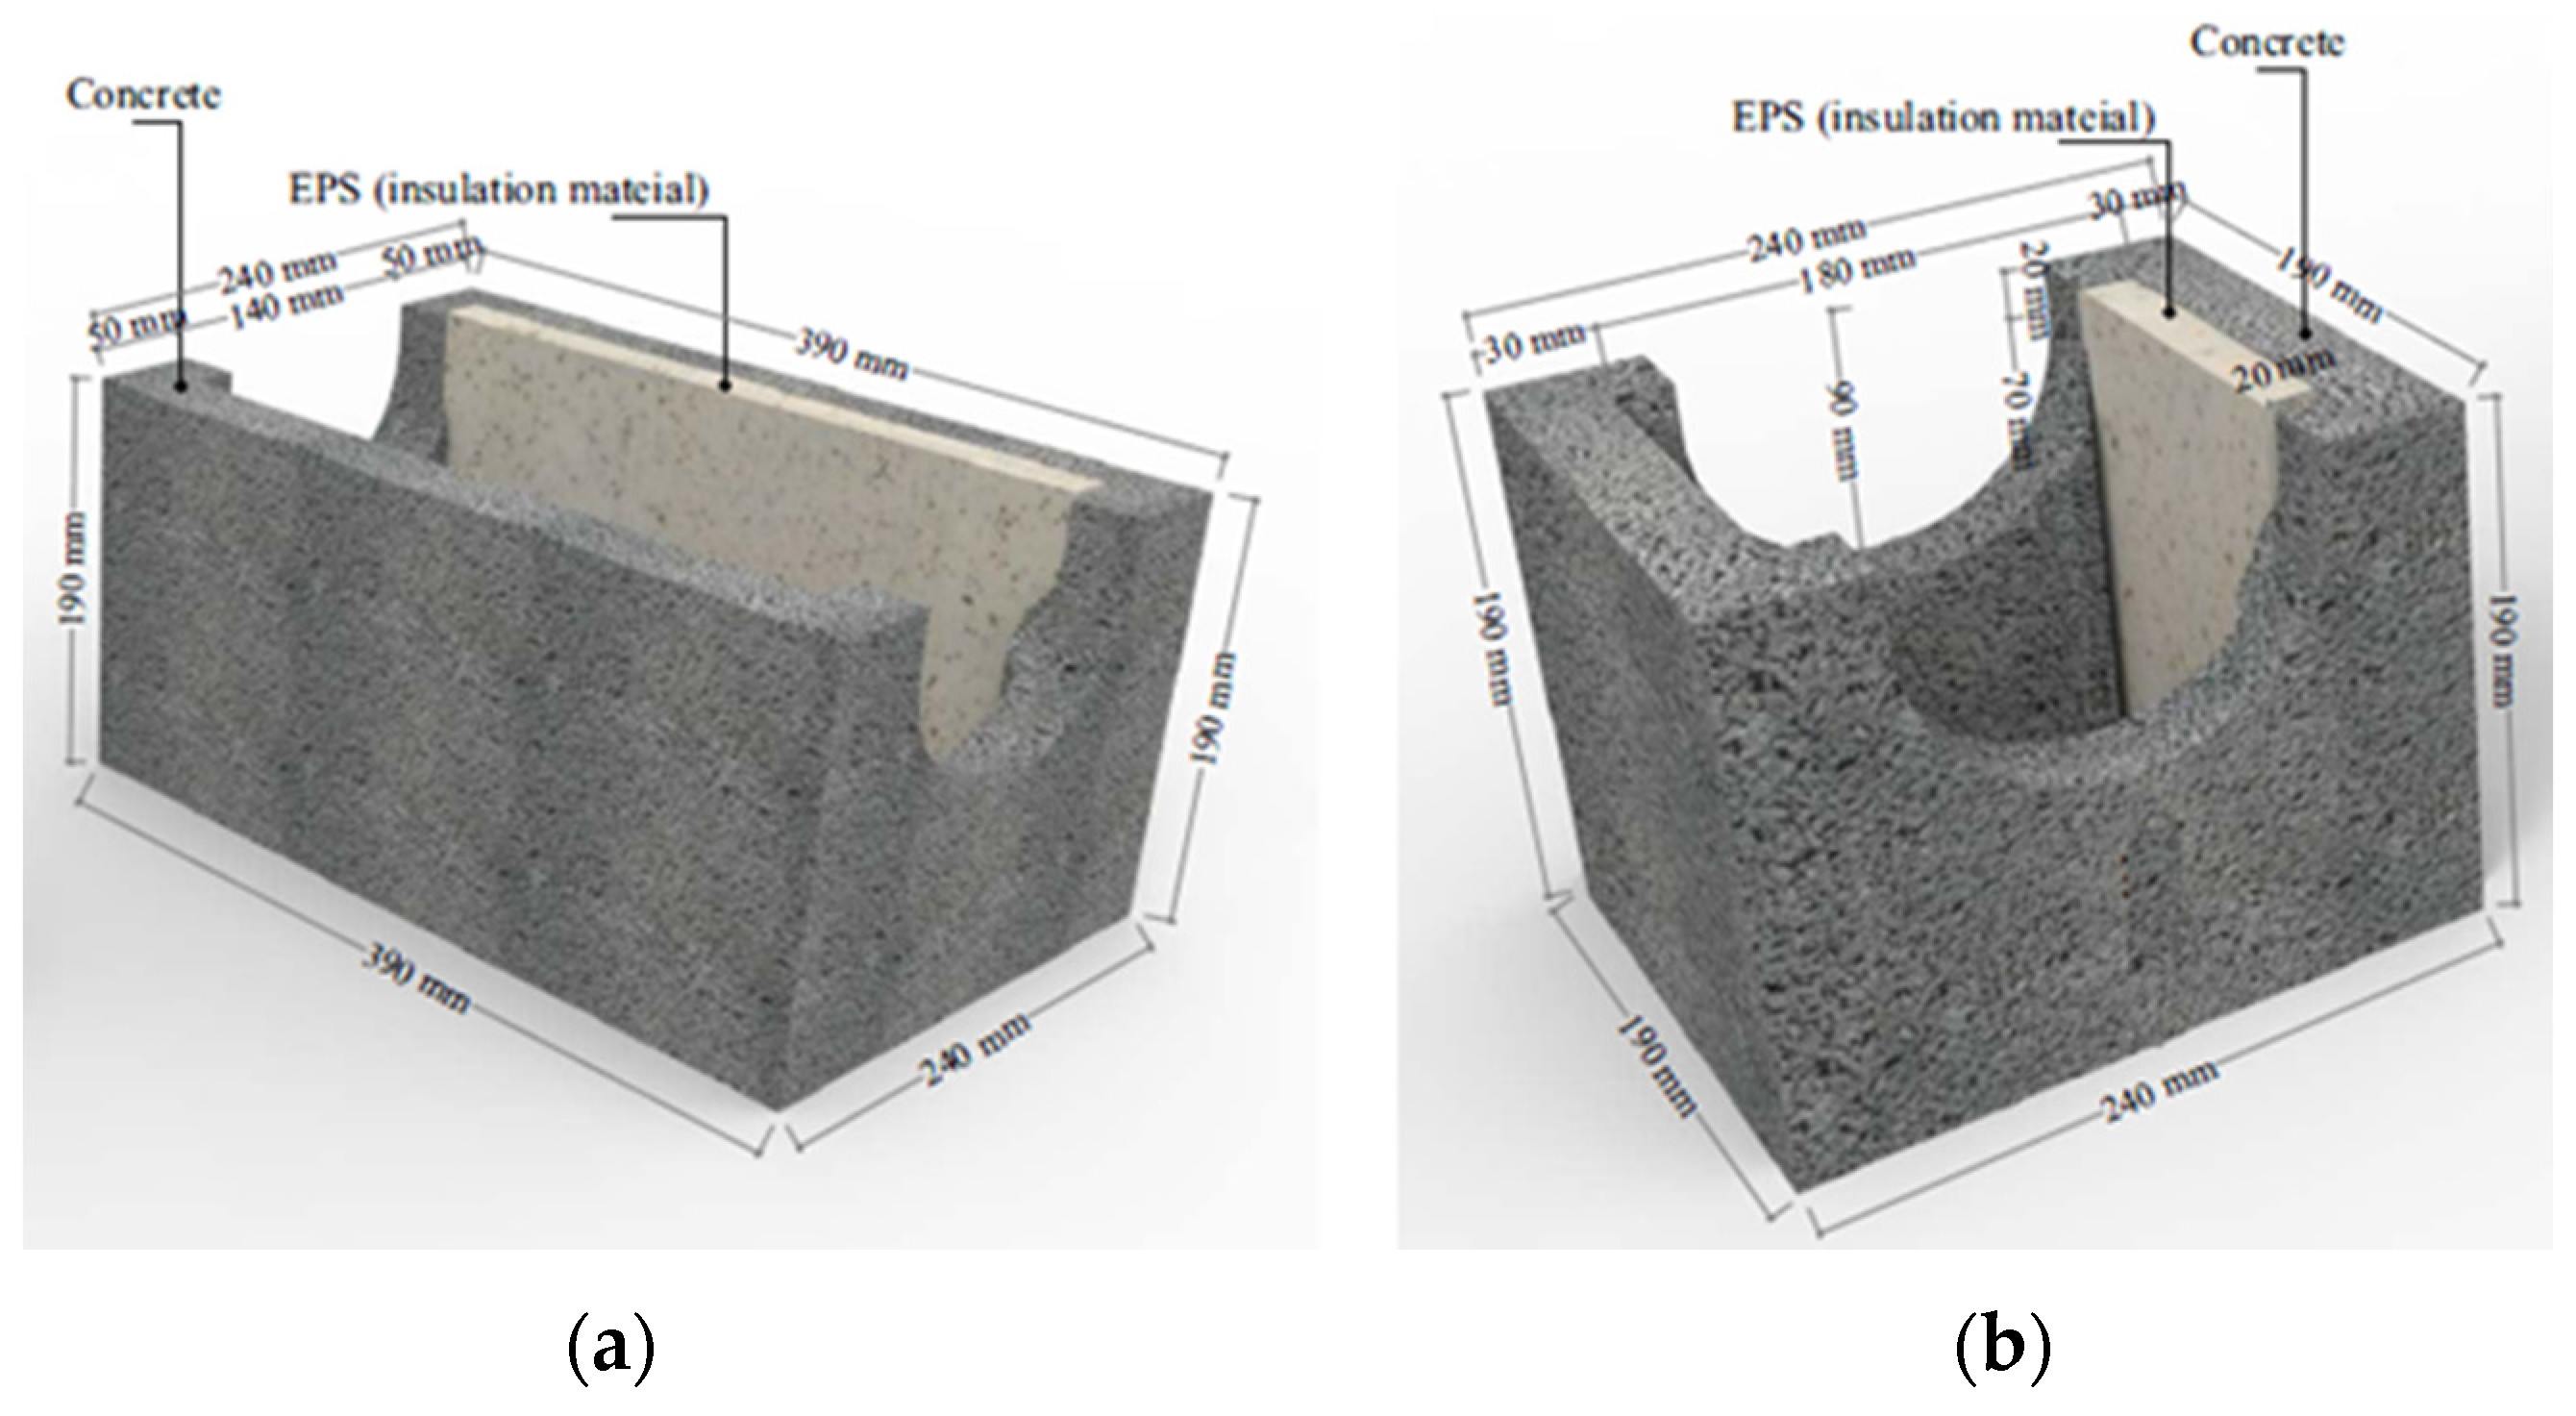
2.3. Test Setup and Instrumentation
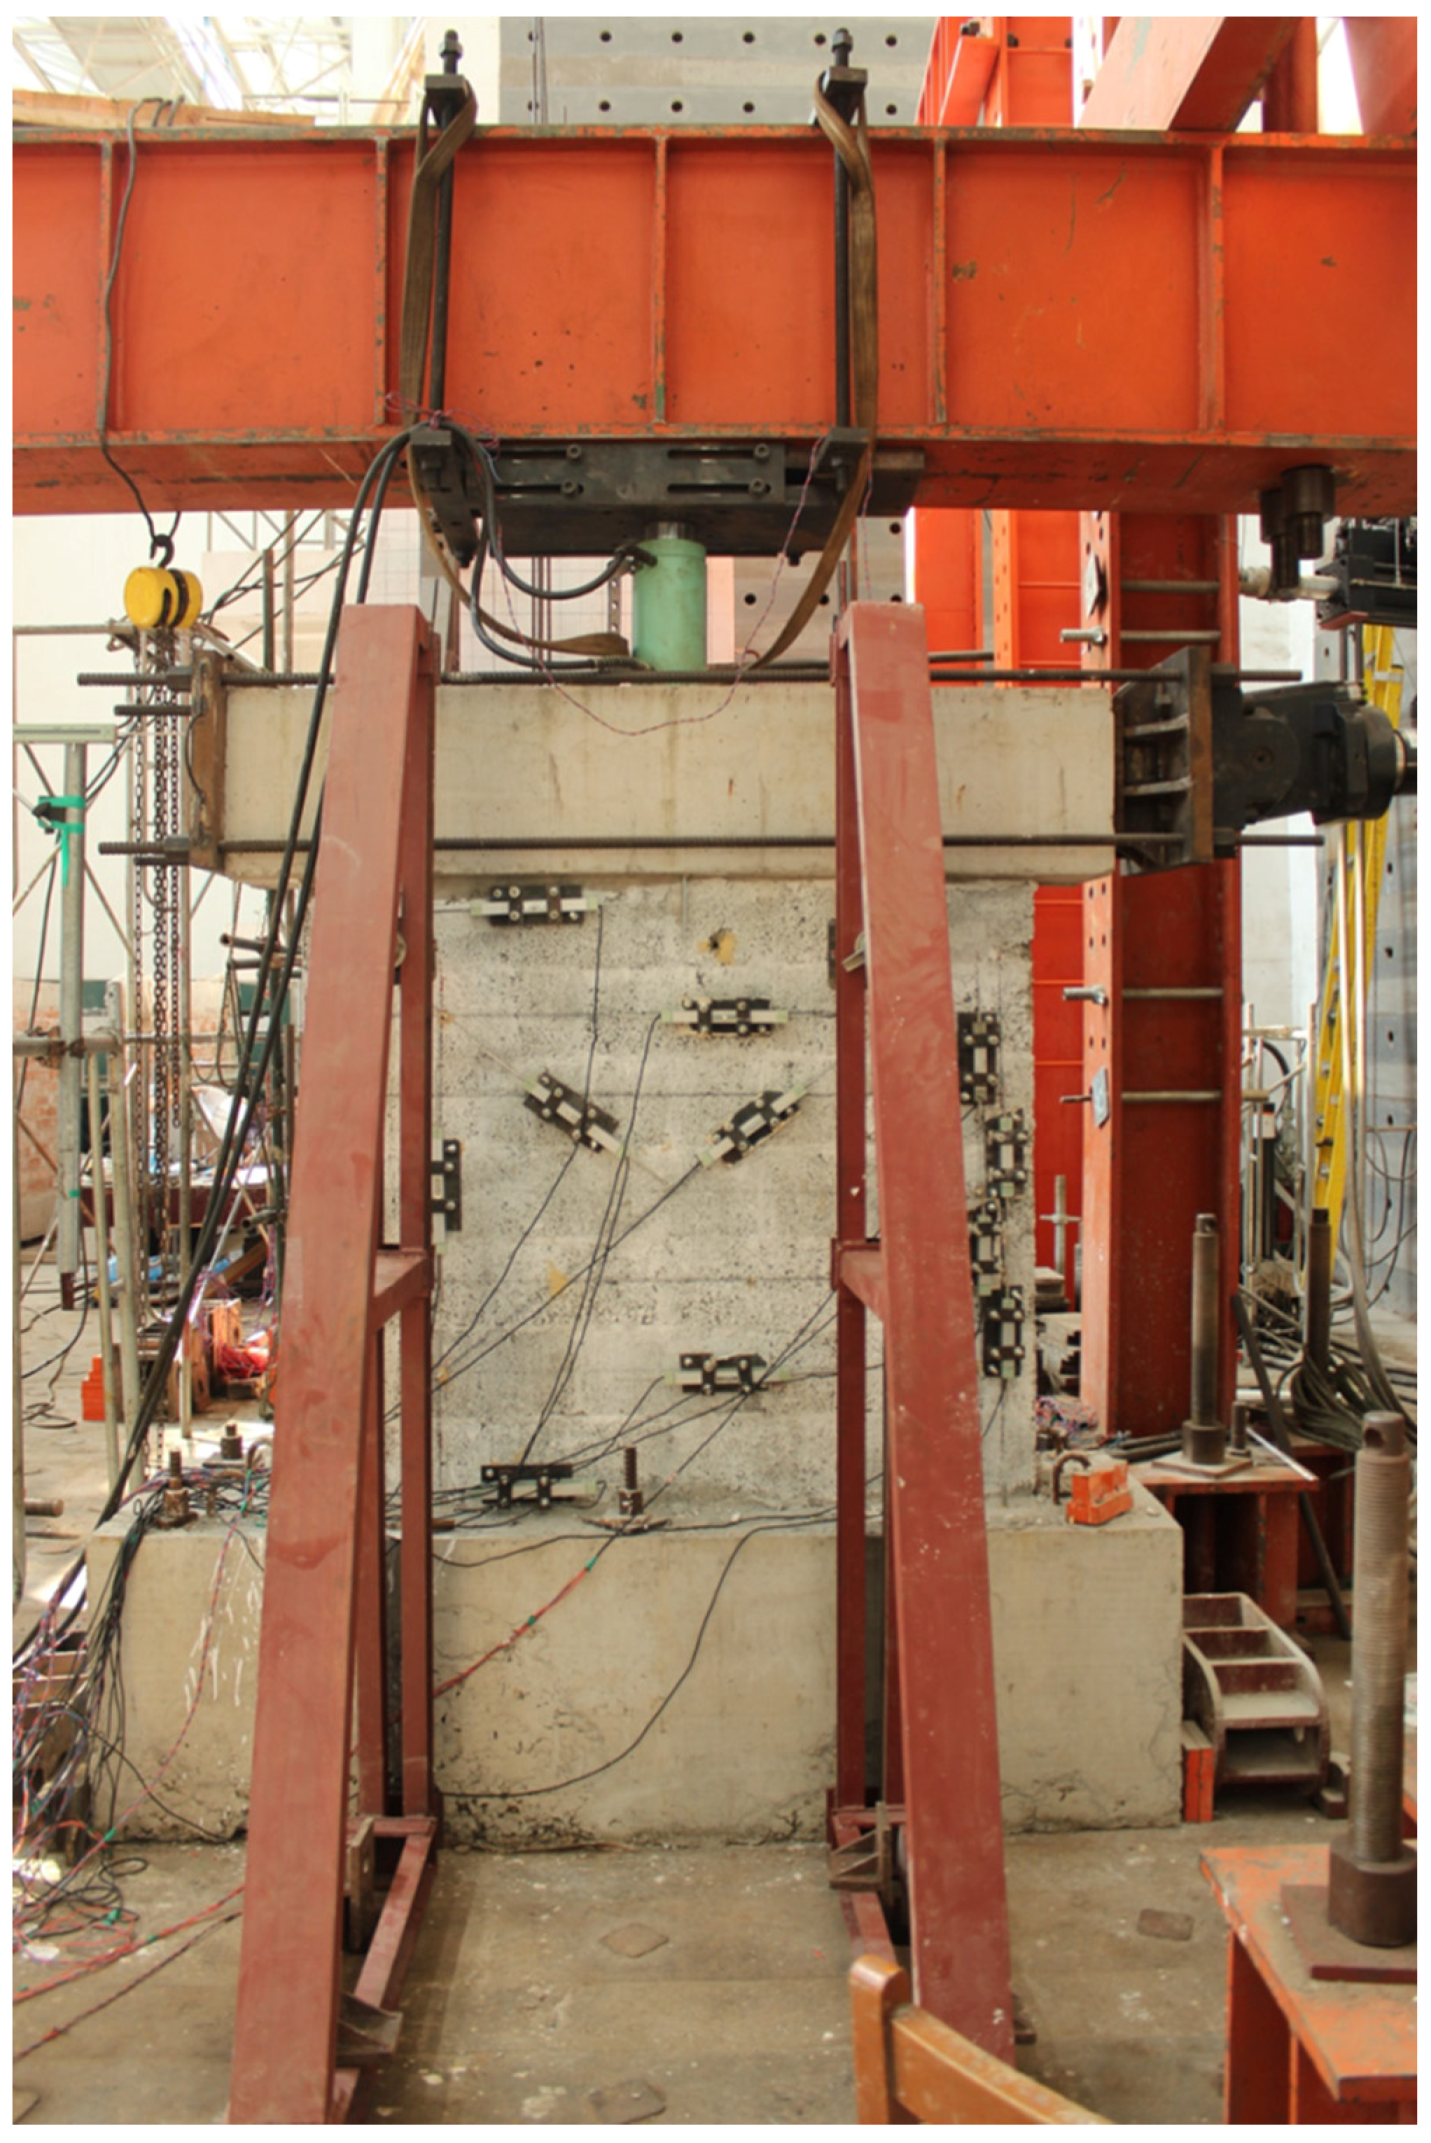
Figure 3a shows the test setup with the wall foundation beam which was anchored to the floor using 30-mm diameter threaded rods and a horizontally mounted hydraulic actuator providing a horizontal shear force connected to a steel plate fixed at a concrete loading beam. Lateral stability was provided at loading beam for all walls and also at the midbeam when available, without preventing the free movement in the plane of walls. Stability was provided by transverse rollers, two on each side of the wall at the loading beam and midbeam, which were connected to separate steel frames anchored to the strong floor. The transverse rollers were adjusted until they were just free from contact with the loading beam and midbeam, thus providing lateral stability.
Strain gages, displacement potentiometers, a load cell and a dial gauge were used to monitor and acquire data while the walls were under testing. The locations of the displacement potentiometers, labeled from 1 to 18, are shown in
Figure 3b. The locations of some of the displacement potentiometers varied when the aspect ratio of the walls changed. The displacement potentiometers were used to measure the vertical displacements, sliding and shear displacements at several locations on each wall specimen. The locations of the strain gages at the critical locations of masonry wall are shown in
Figure 3c.
2.4. Testing Procedure
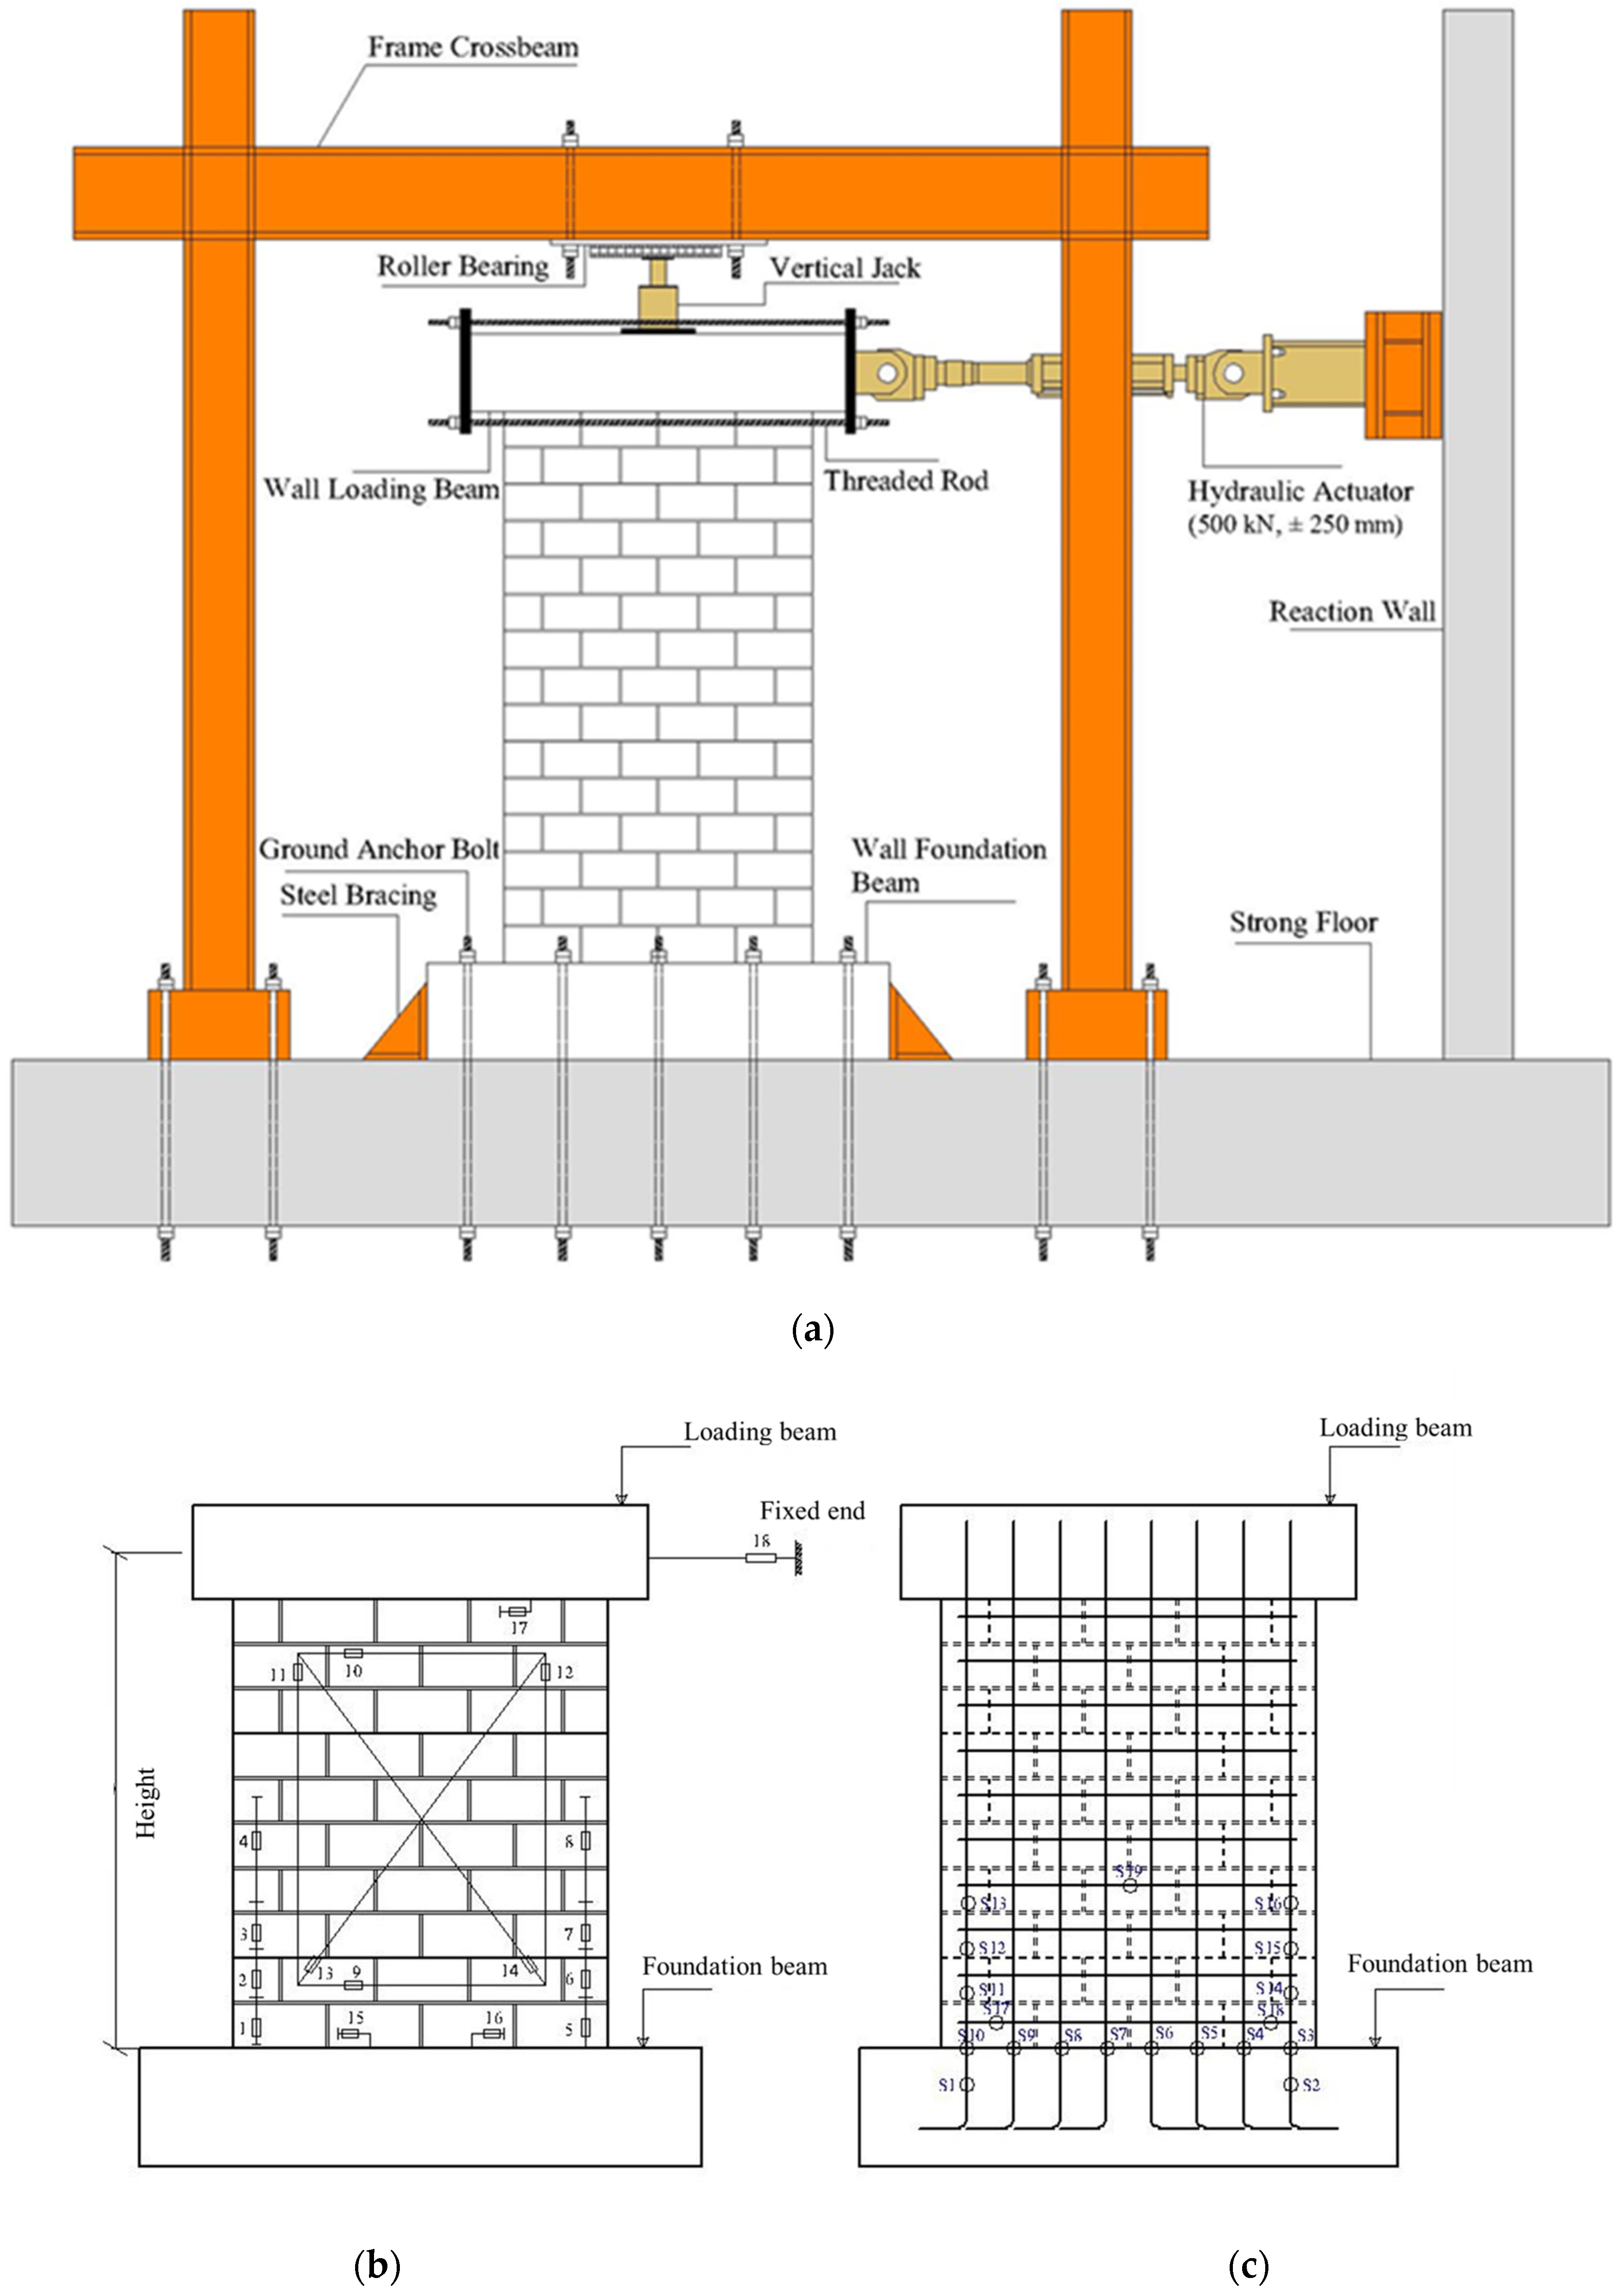
All masonry walls were loaded following the same procedure (three-stage). First, the axial load was applied till reached the specified value and then kept constant until the end of the test. Second, the test was run under force control until the yielding of flexural reinforcement. Third, after yielding of flexural reinforcement, the test was run under displacement control through three reversed cycles for each displacement level. The test was stopped when the peak capacity dropped to 70% or less of the experimentally observed maximum capacity.
Figure 4 shows a typical testing protocol while
Figure 5 illustrates specimen SW1 ready for testing.
3. Experimental Results
3.1. Failure Models and Load-Displacement Hysteresis Diagrams
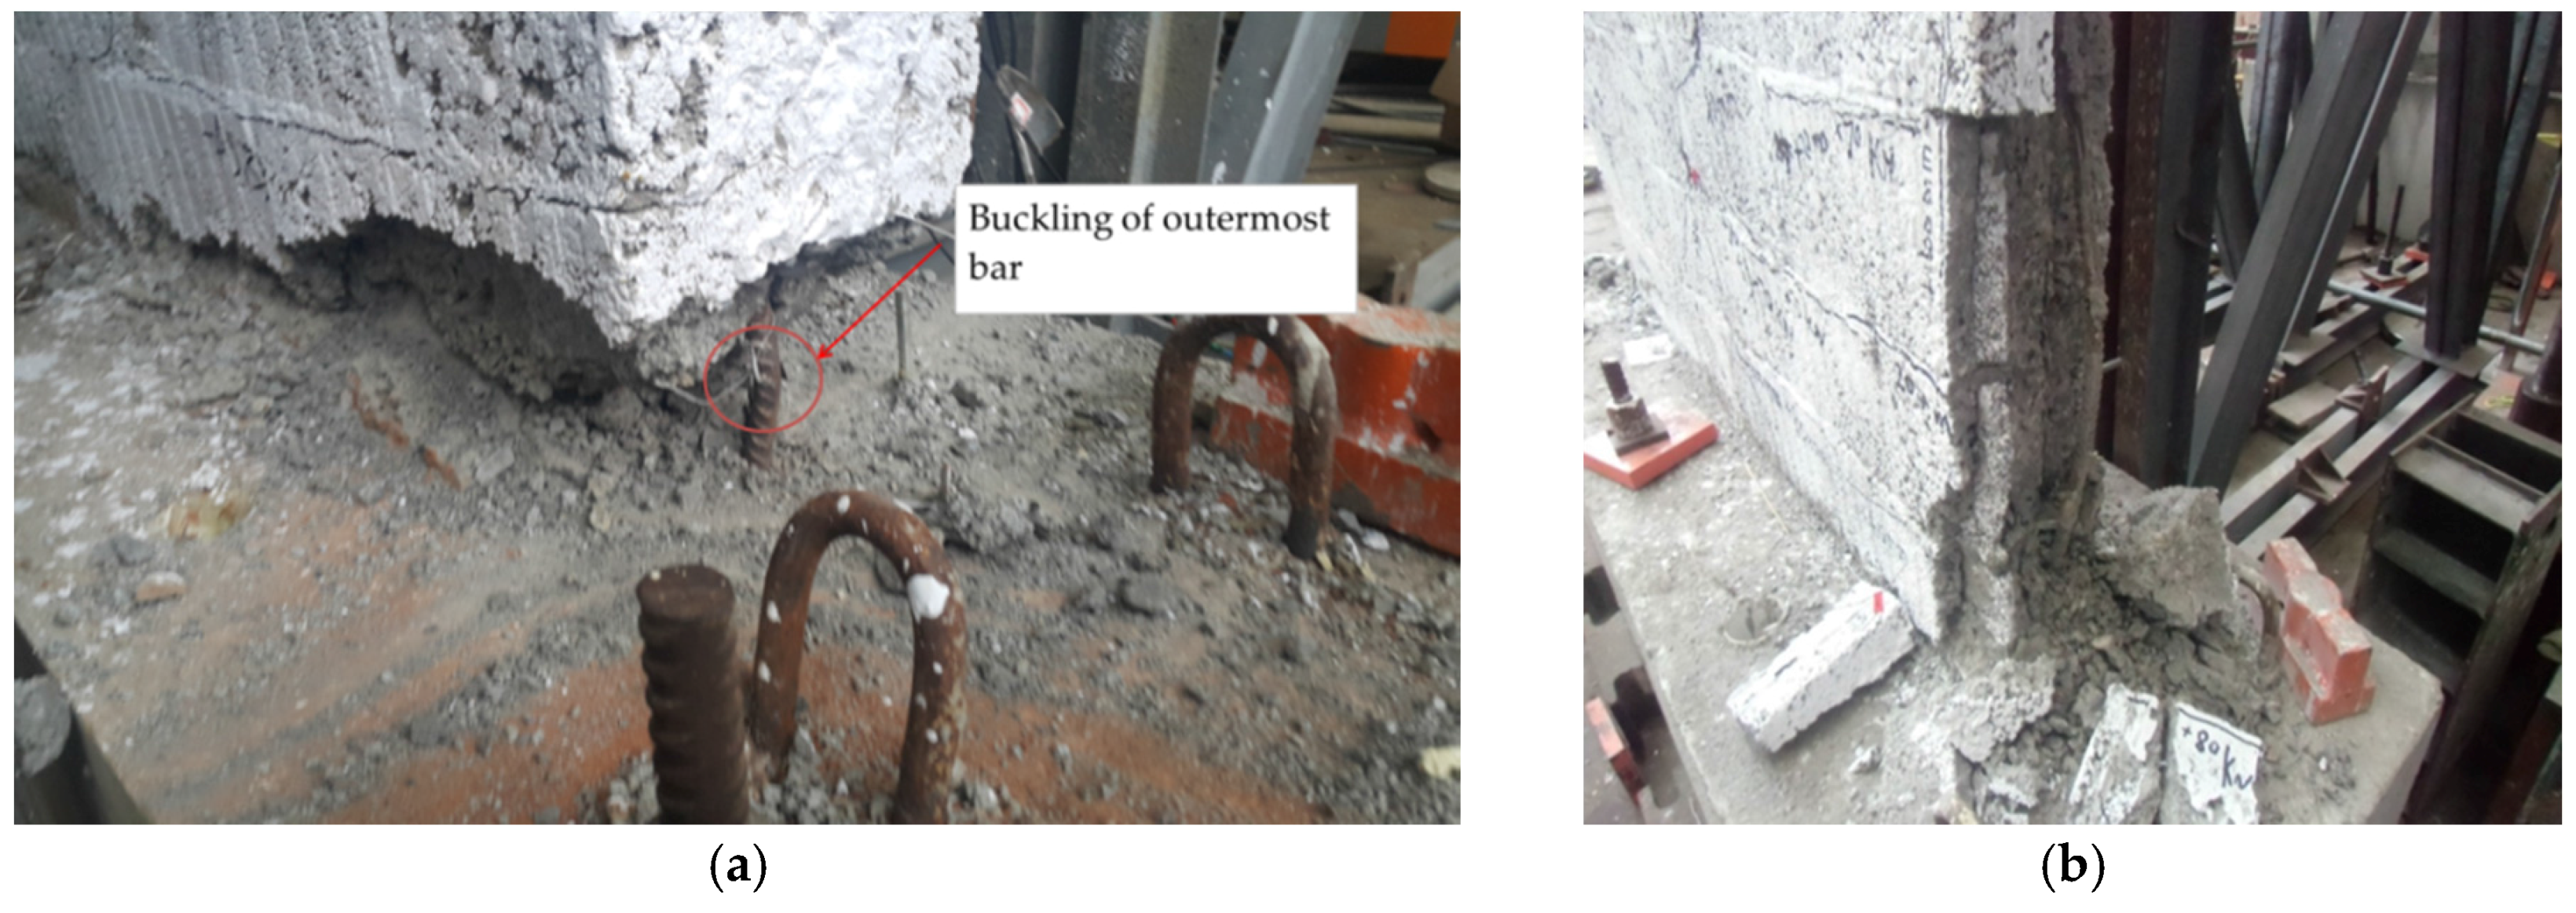
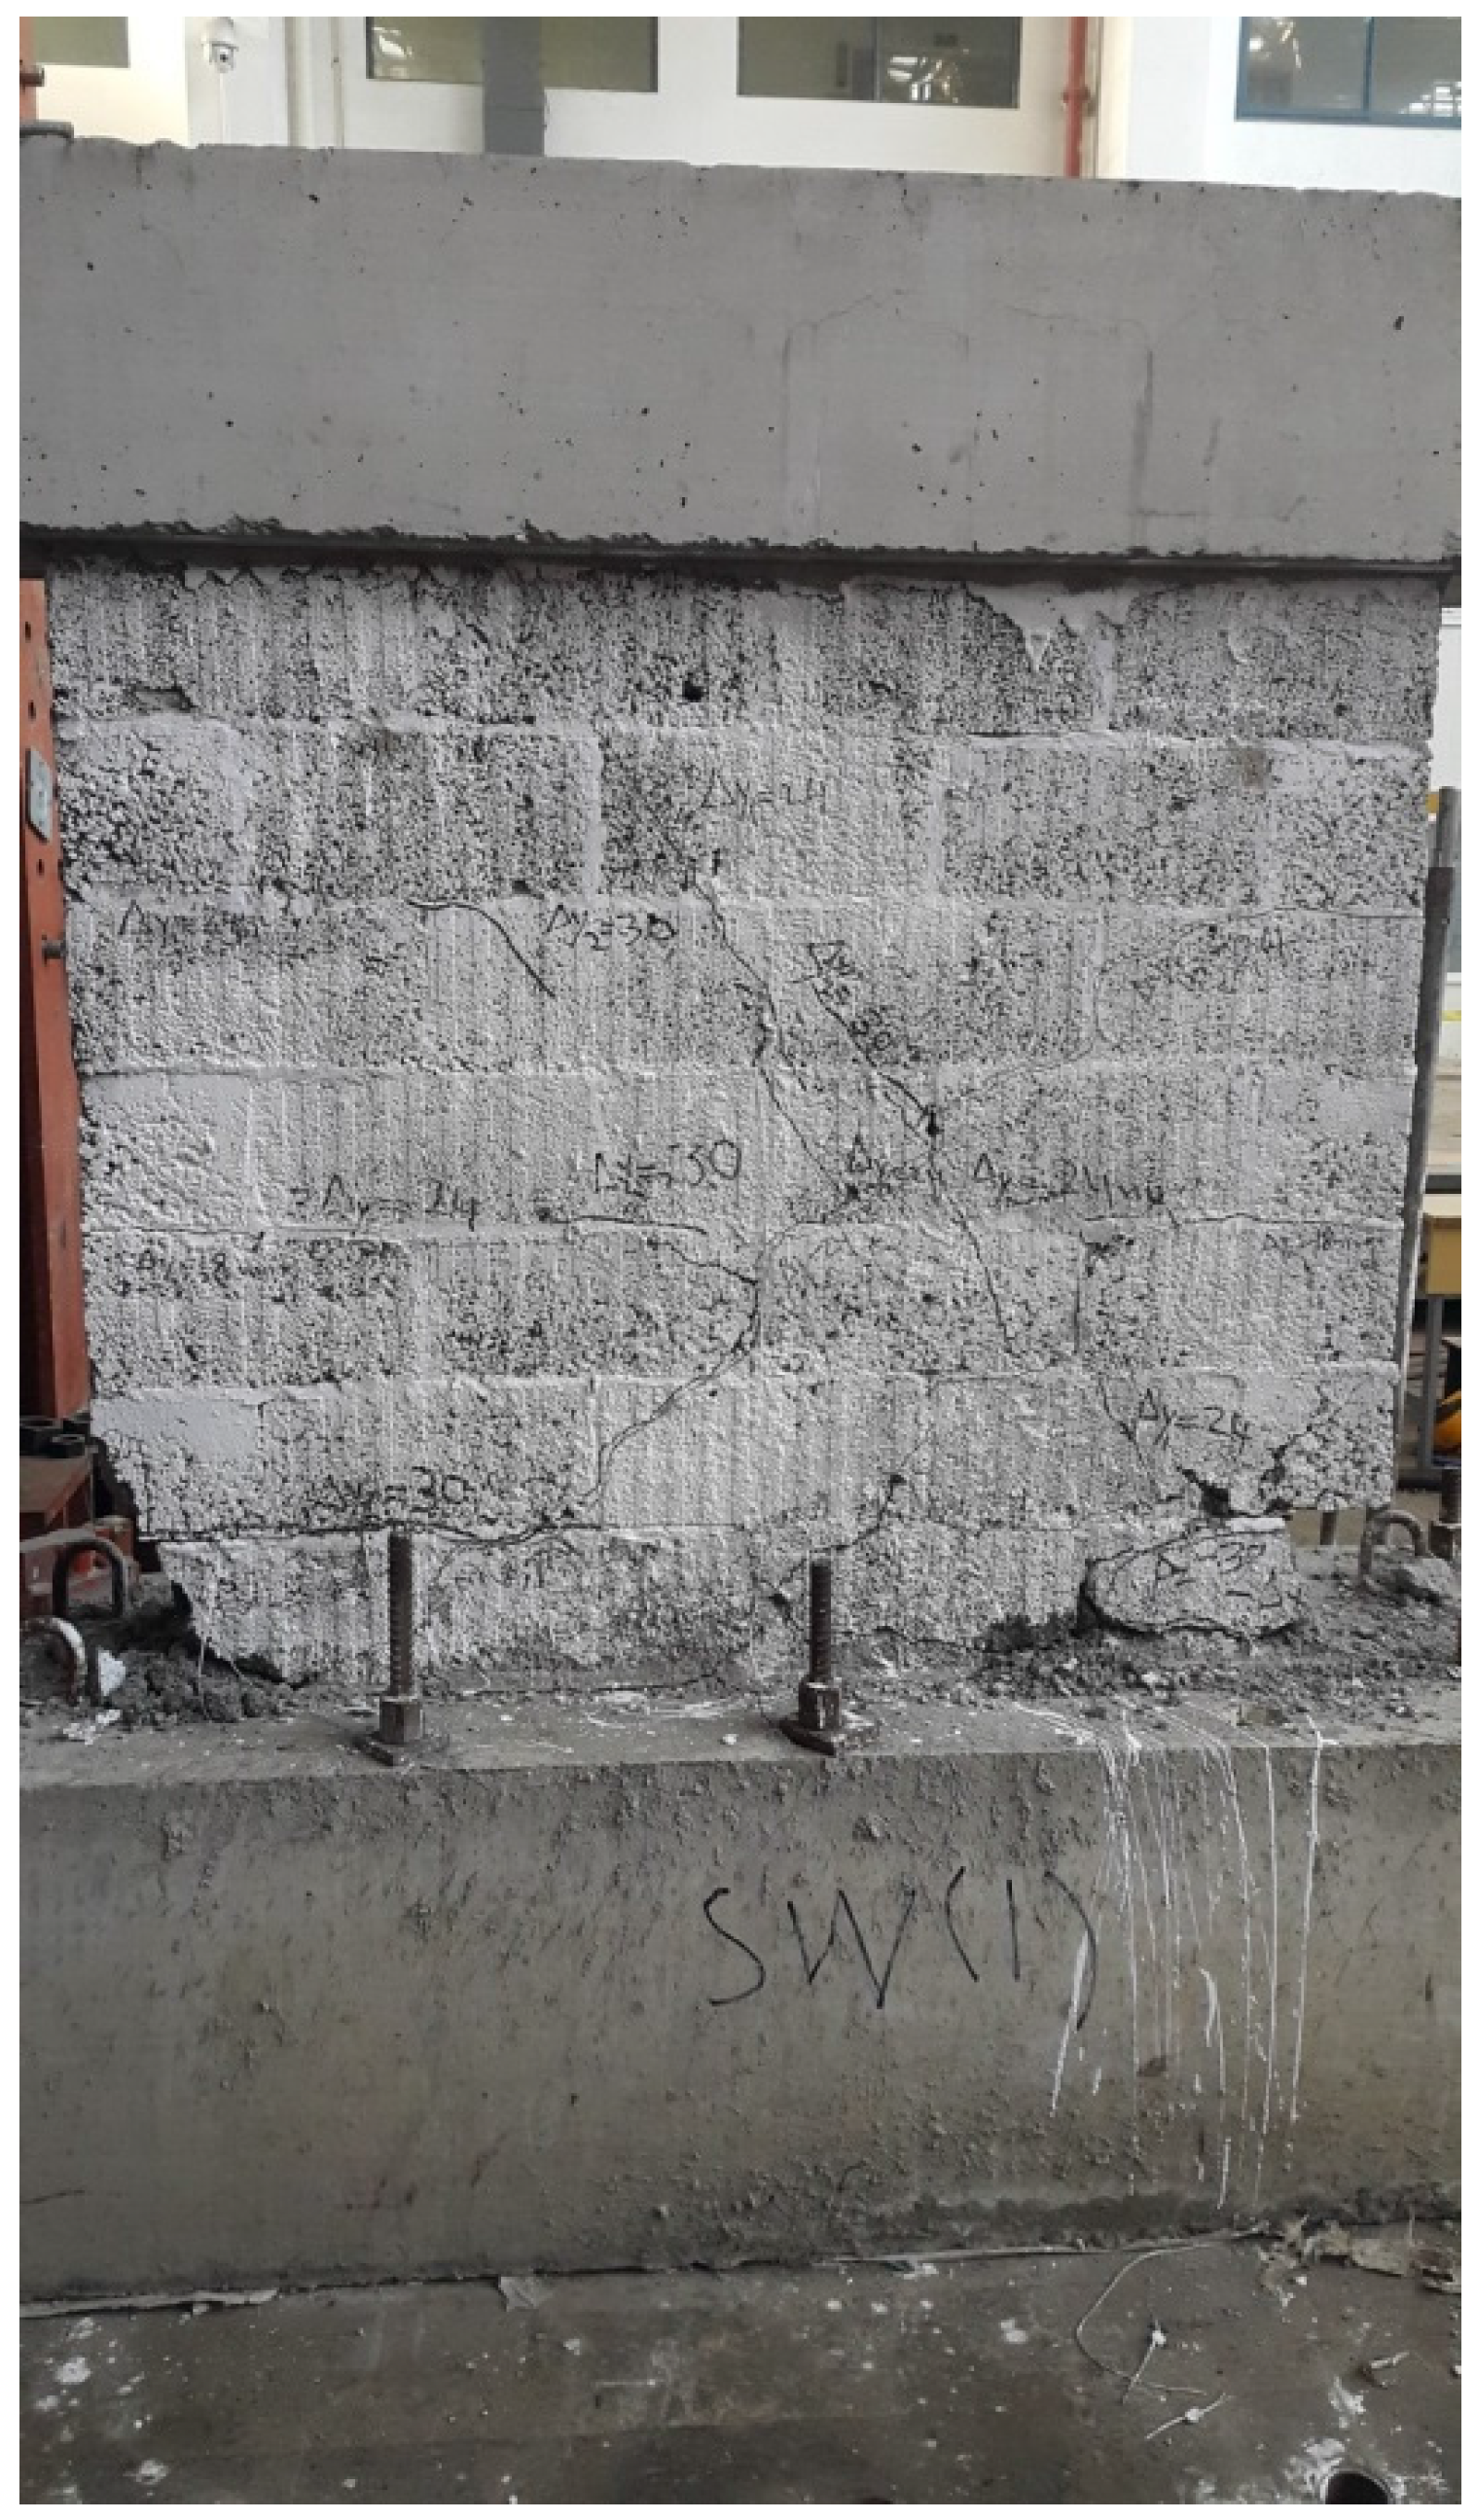
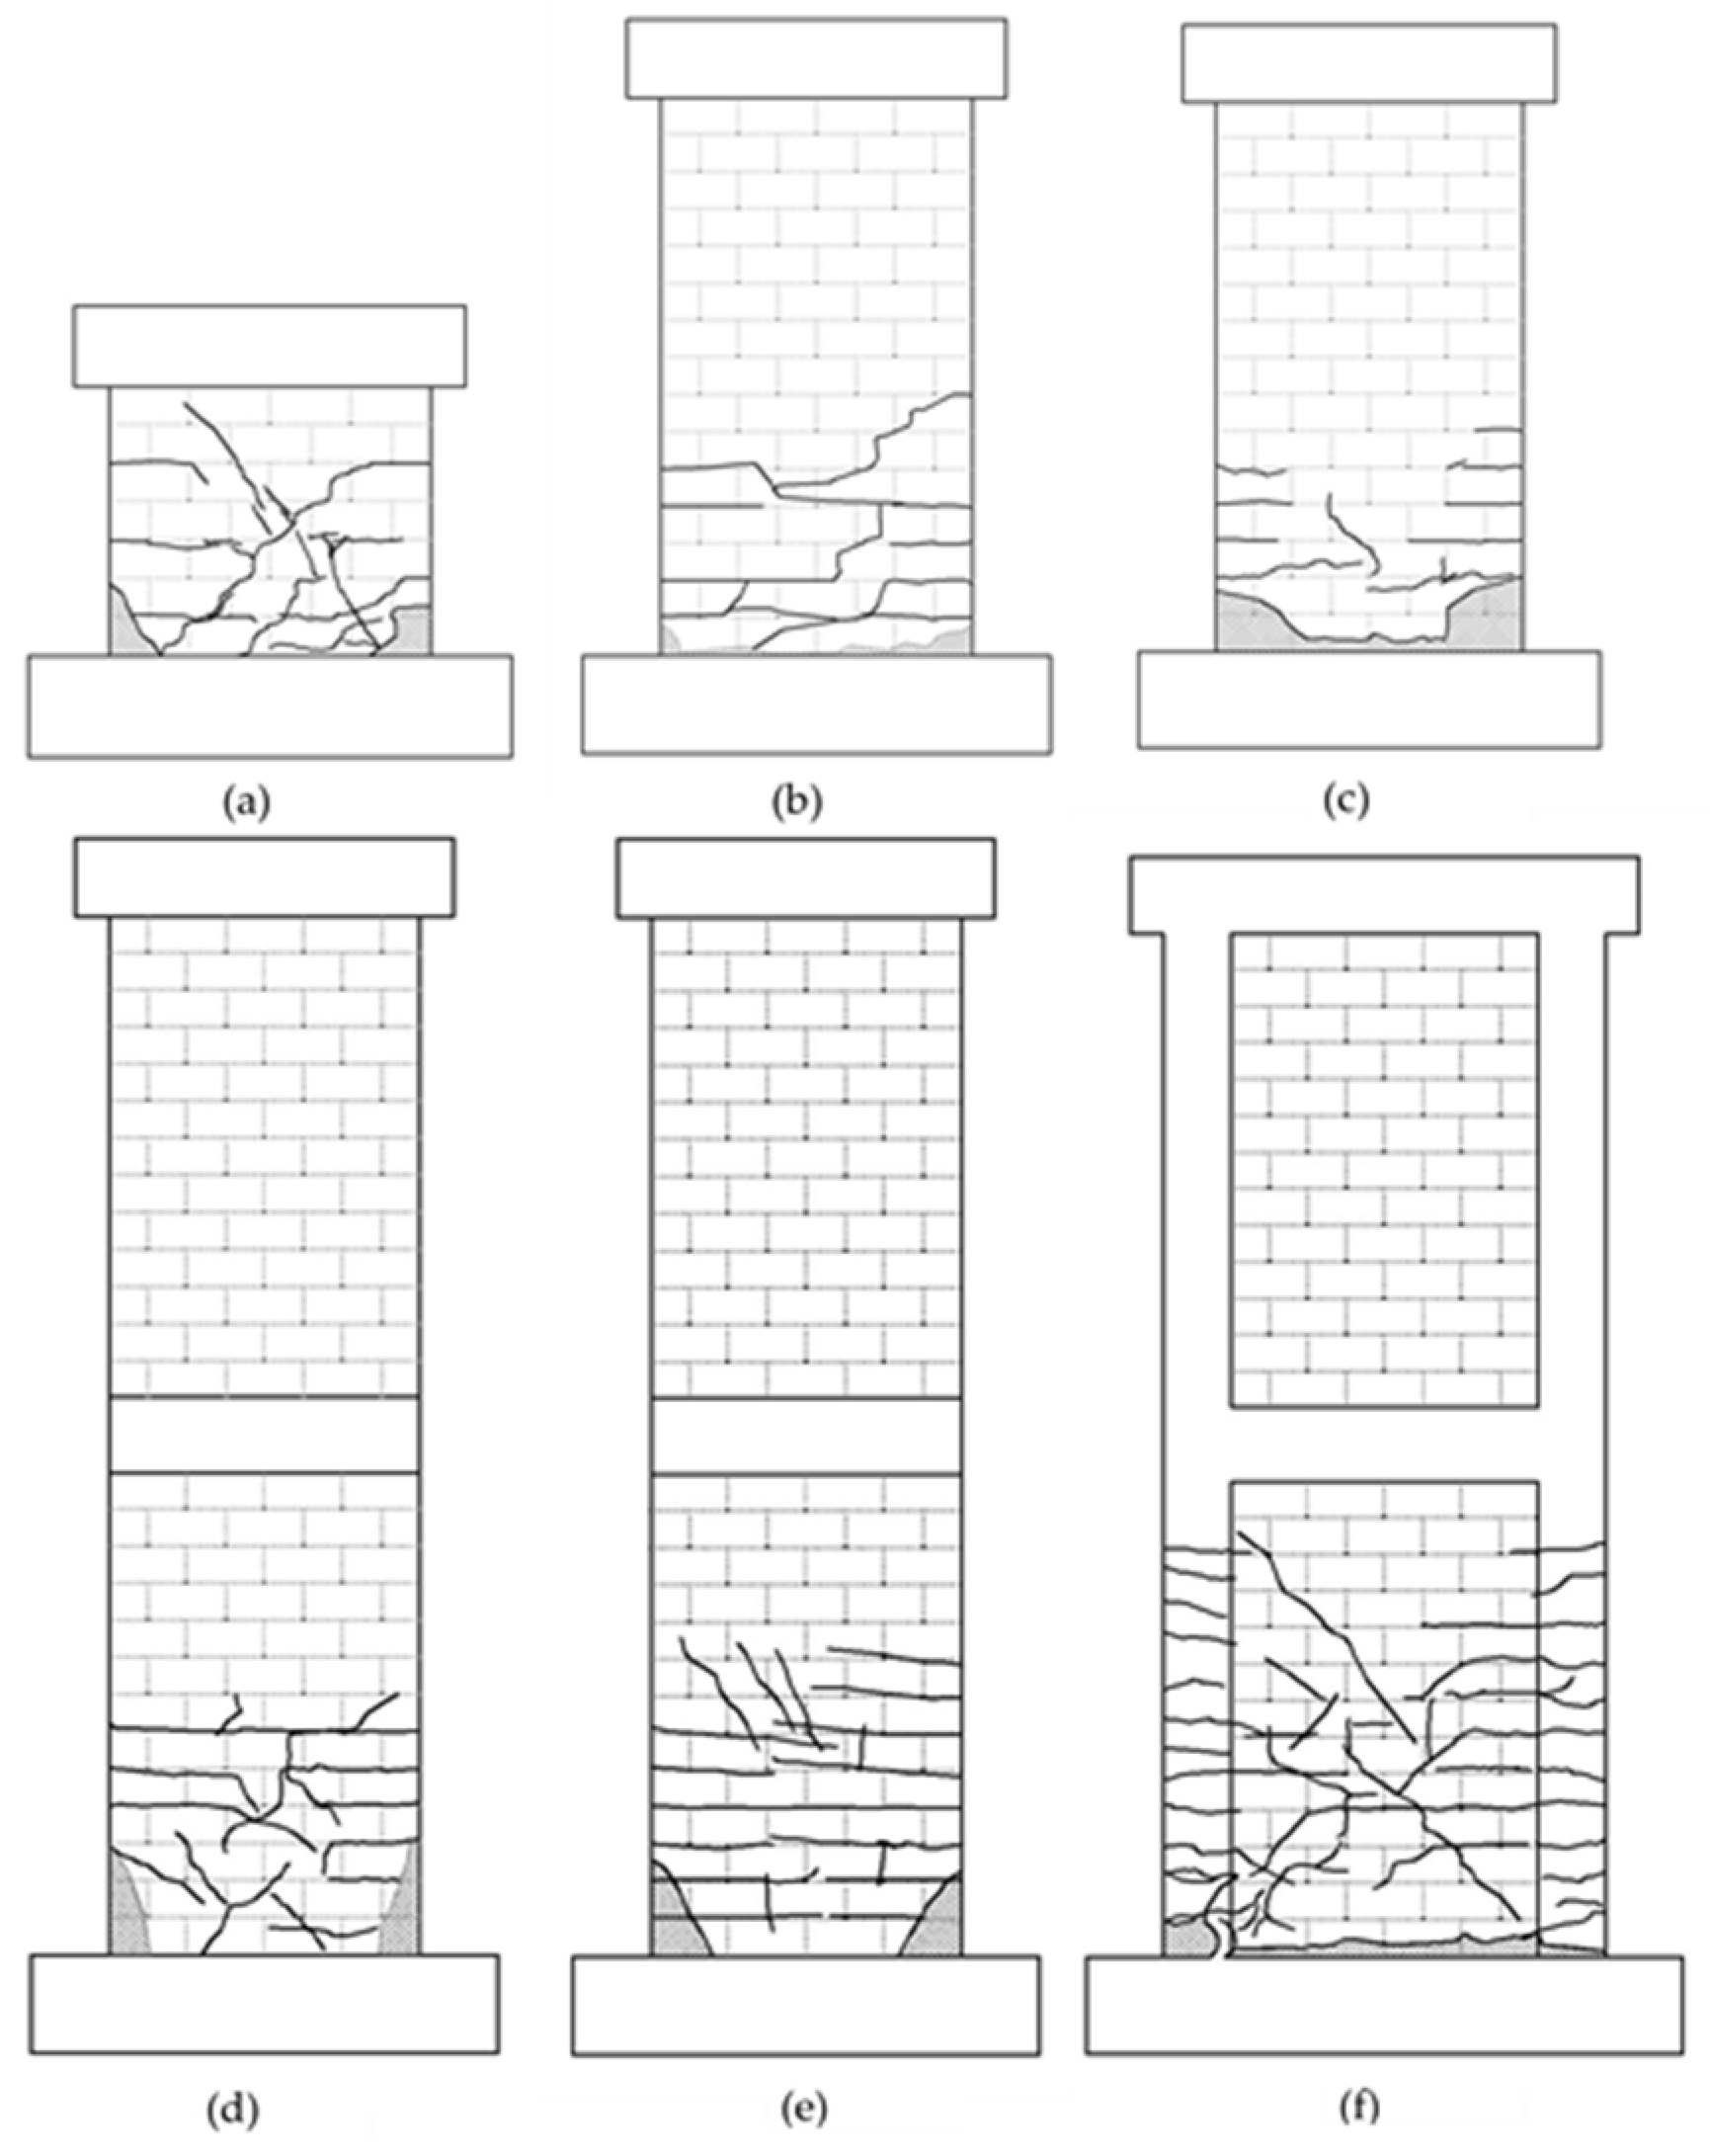
Figure 6 illustrates SCMSW specimens cracking pattern at the end of testing for all walls. In general, all SCMSW specimens, except WS1, showed predominantly flexural behavior as expected. The flexural mode of failure is defined by the presence of horizontal cracks at the bottom layers of the wall due to the tensile bond strength between the unit and mortar. The strain gauges located in first and fifth course of SCMSW specimens recorded no significant strain, meaning that only negligible strains developed in these bars. On the other hand, the outermost vertical steel bars of the walls yielded due to the relatively insufficient amount of the flexural reinforcement. The load degradation can be attributed to the buckling of the vertical steel bars in the toe regions of the walls as shown in
Figure 7, which is very significant in the final stage of the test. The ultimate strength of the walls is governed by the flexural yielding of the vertical reinforcement and the compressive crushing of the toe regions in the masonry wall.
Although SW1 was expected to fail in shear, it did not show sudden strength degradation after the maximum wall strength was reached. Also, the strain gauges connected to the outermost vertical steel bars measured significant strains, meaning that yielding in those bars had occurred. Consequently, it showed a flexural/shear failure. This type of failure usually takes place when using a small amount of axial loading and the horizontal reinforcement distributed closely with bars of small diameters; similar observations for this behavior were reported by Voon and Ingham [
11]. The initial diagonal cracks did not widen significantly as the lateral load was increased. However, new sets of diagonal carks appeared gradually over the wall diagonals as shown in
Figure 6a, thus leading to high energy dissipation and ductile behavior. The shaded areas illustrated in
Figure 6 show the crushing in the masonry walls.
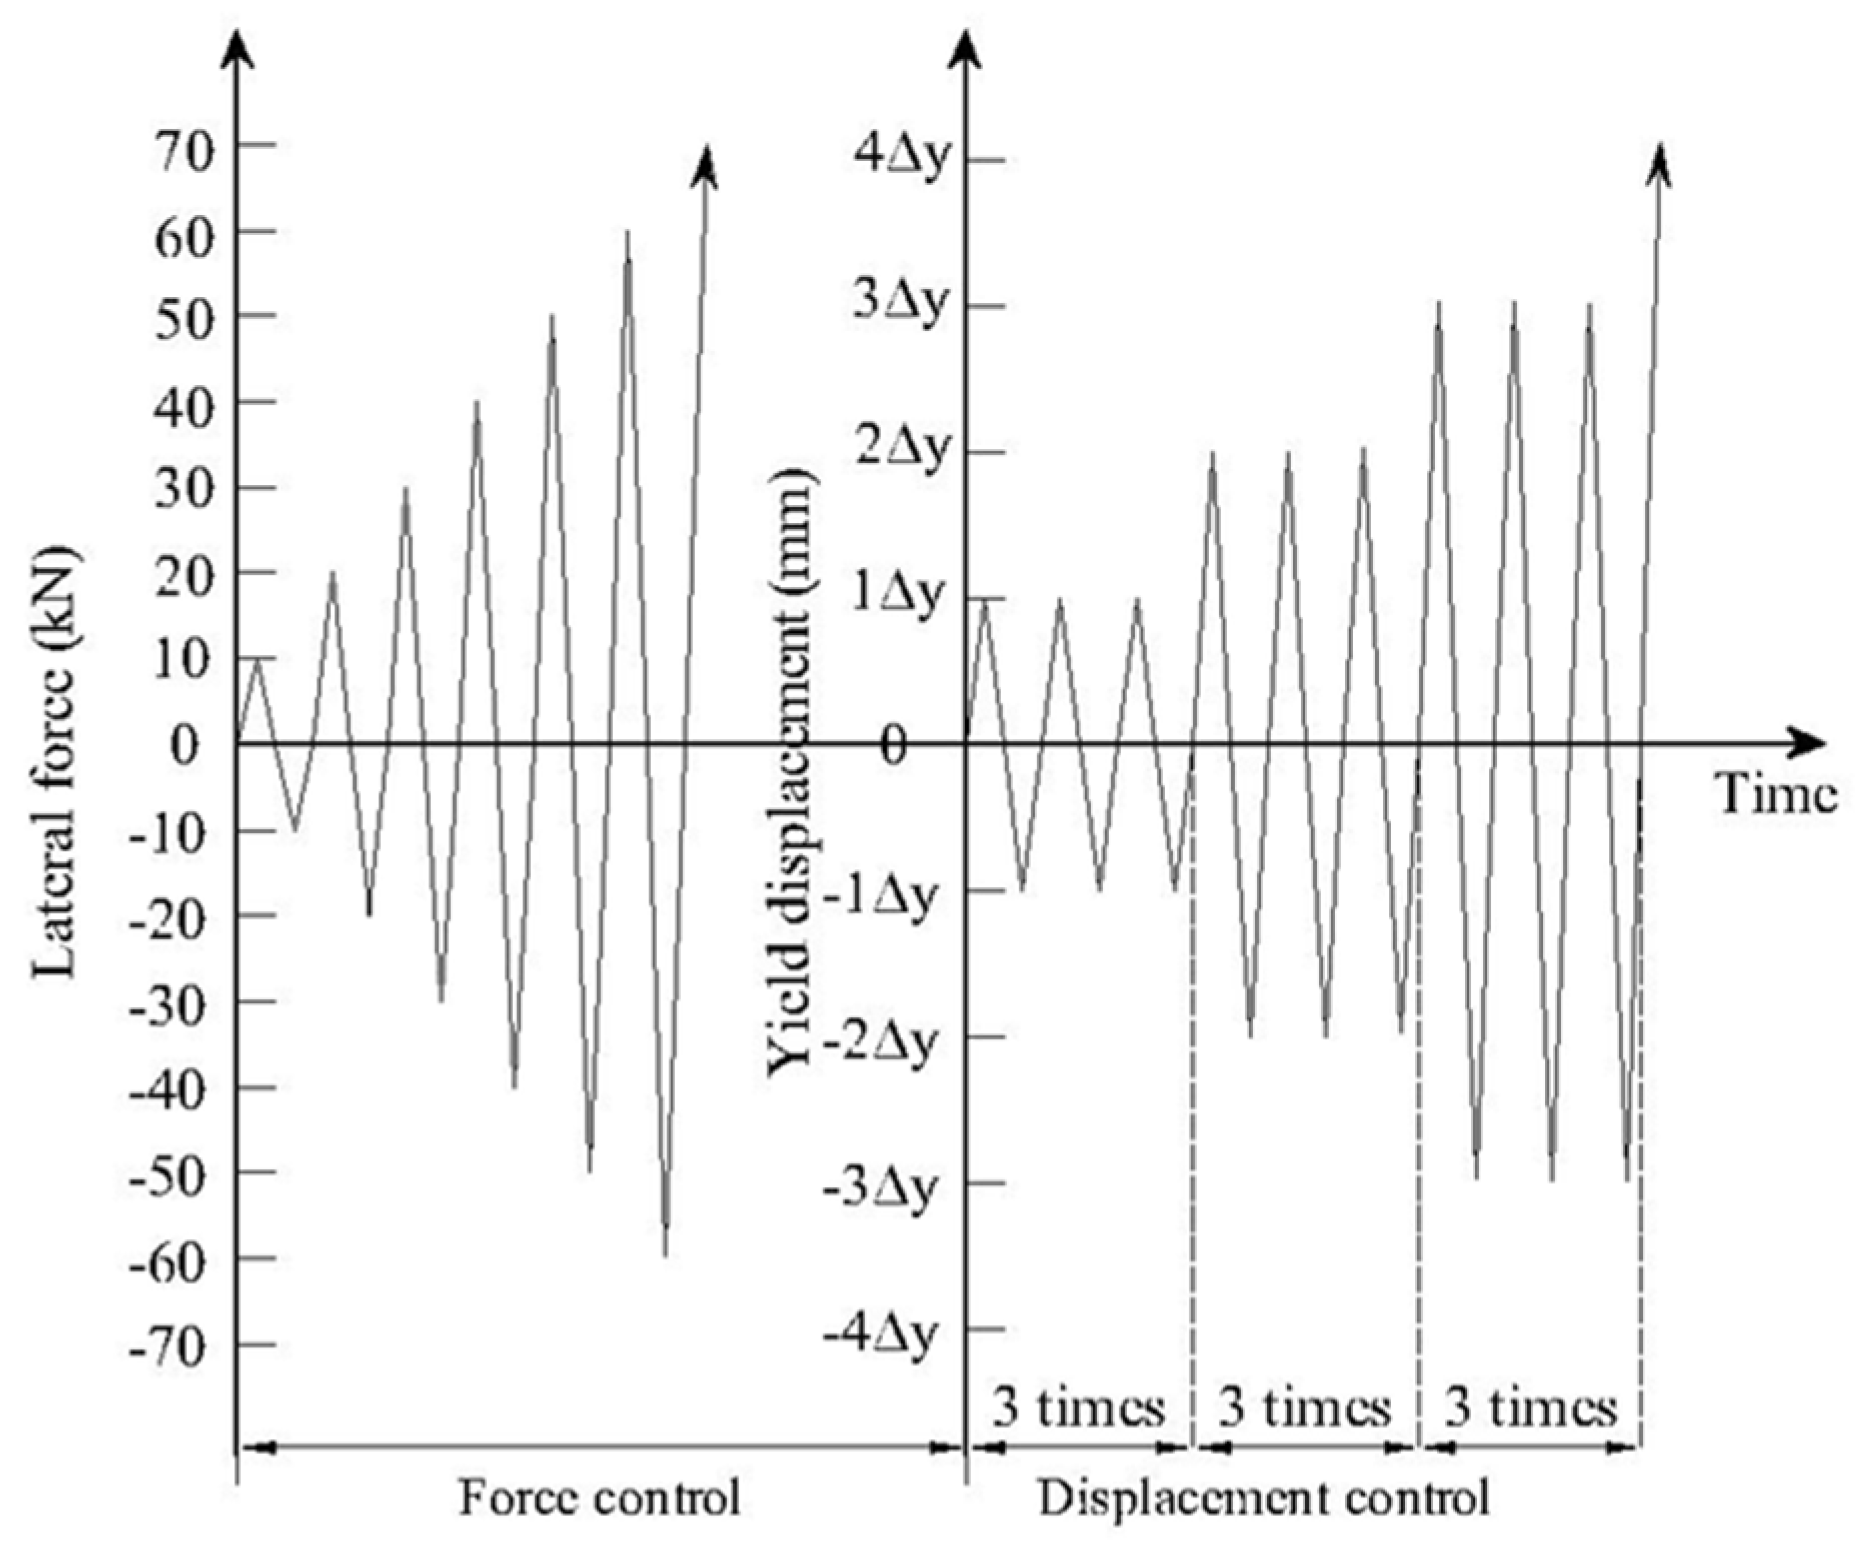
General wall behavior is summarized in
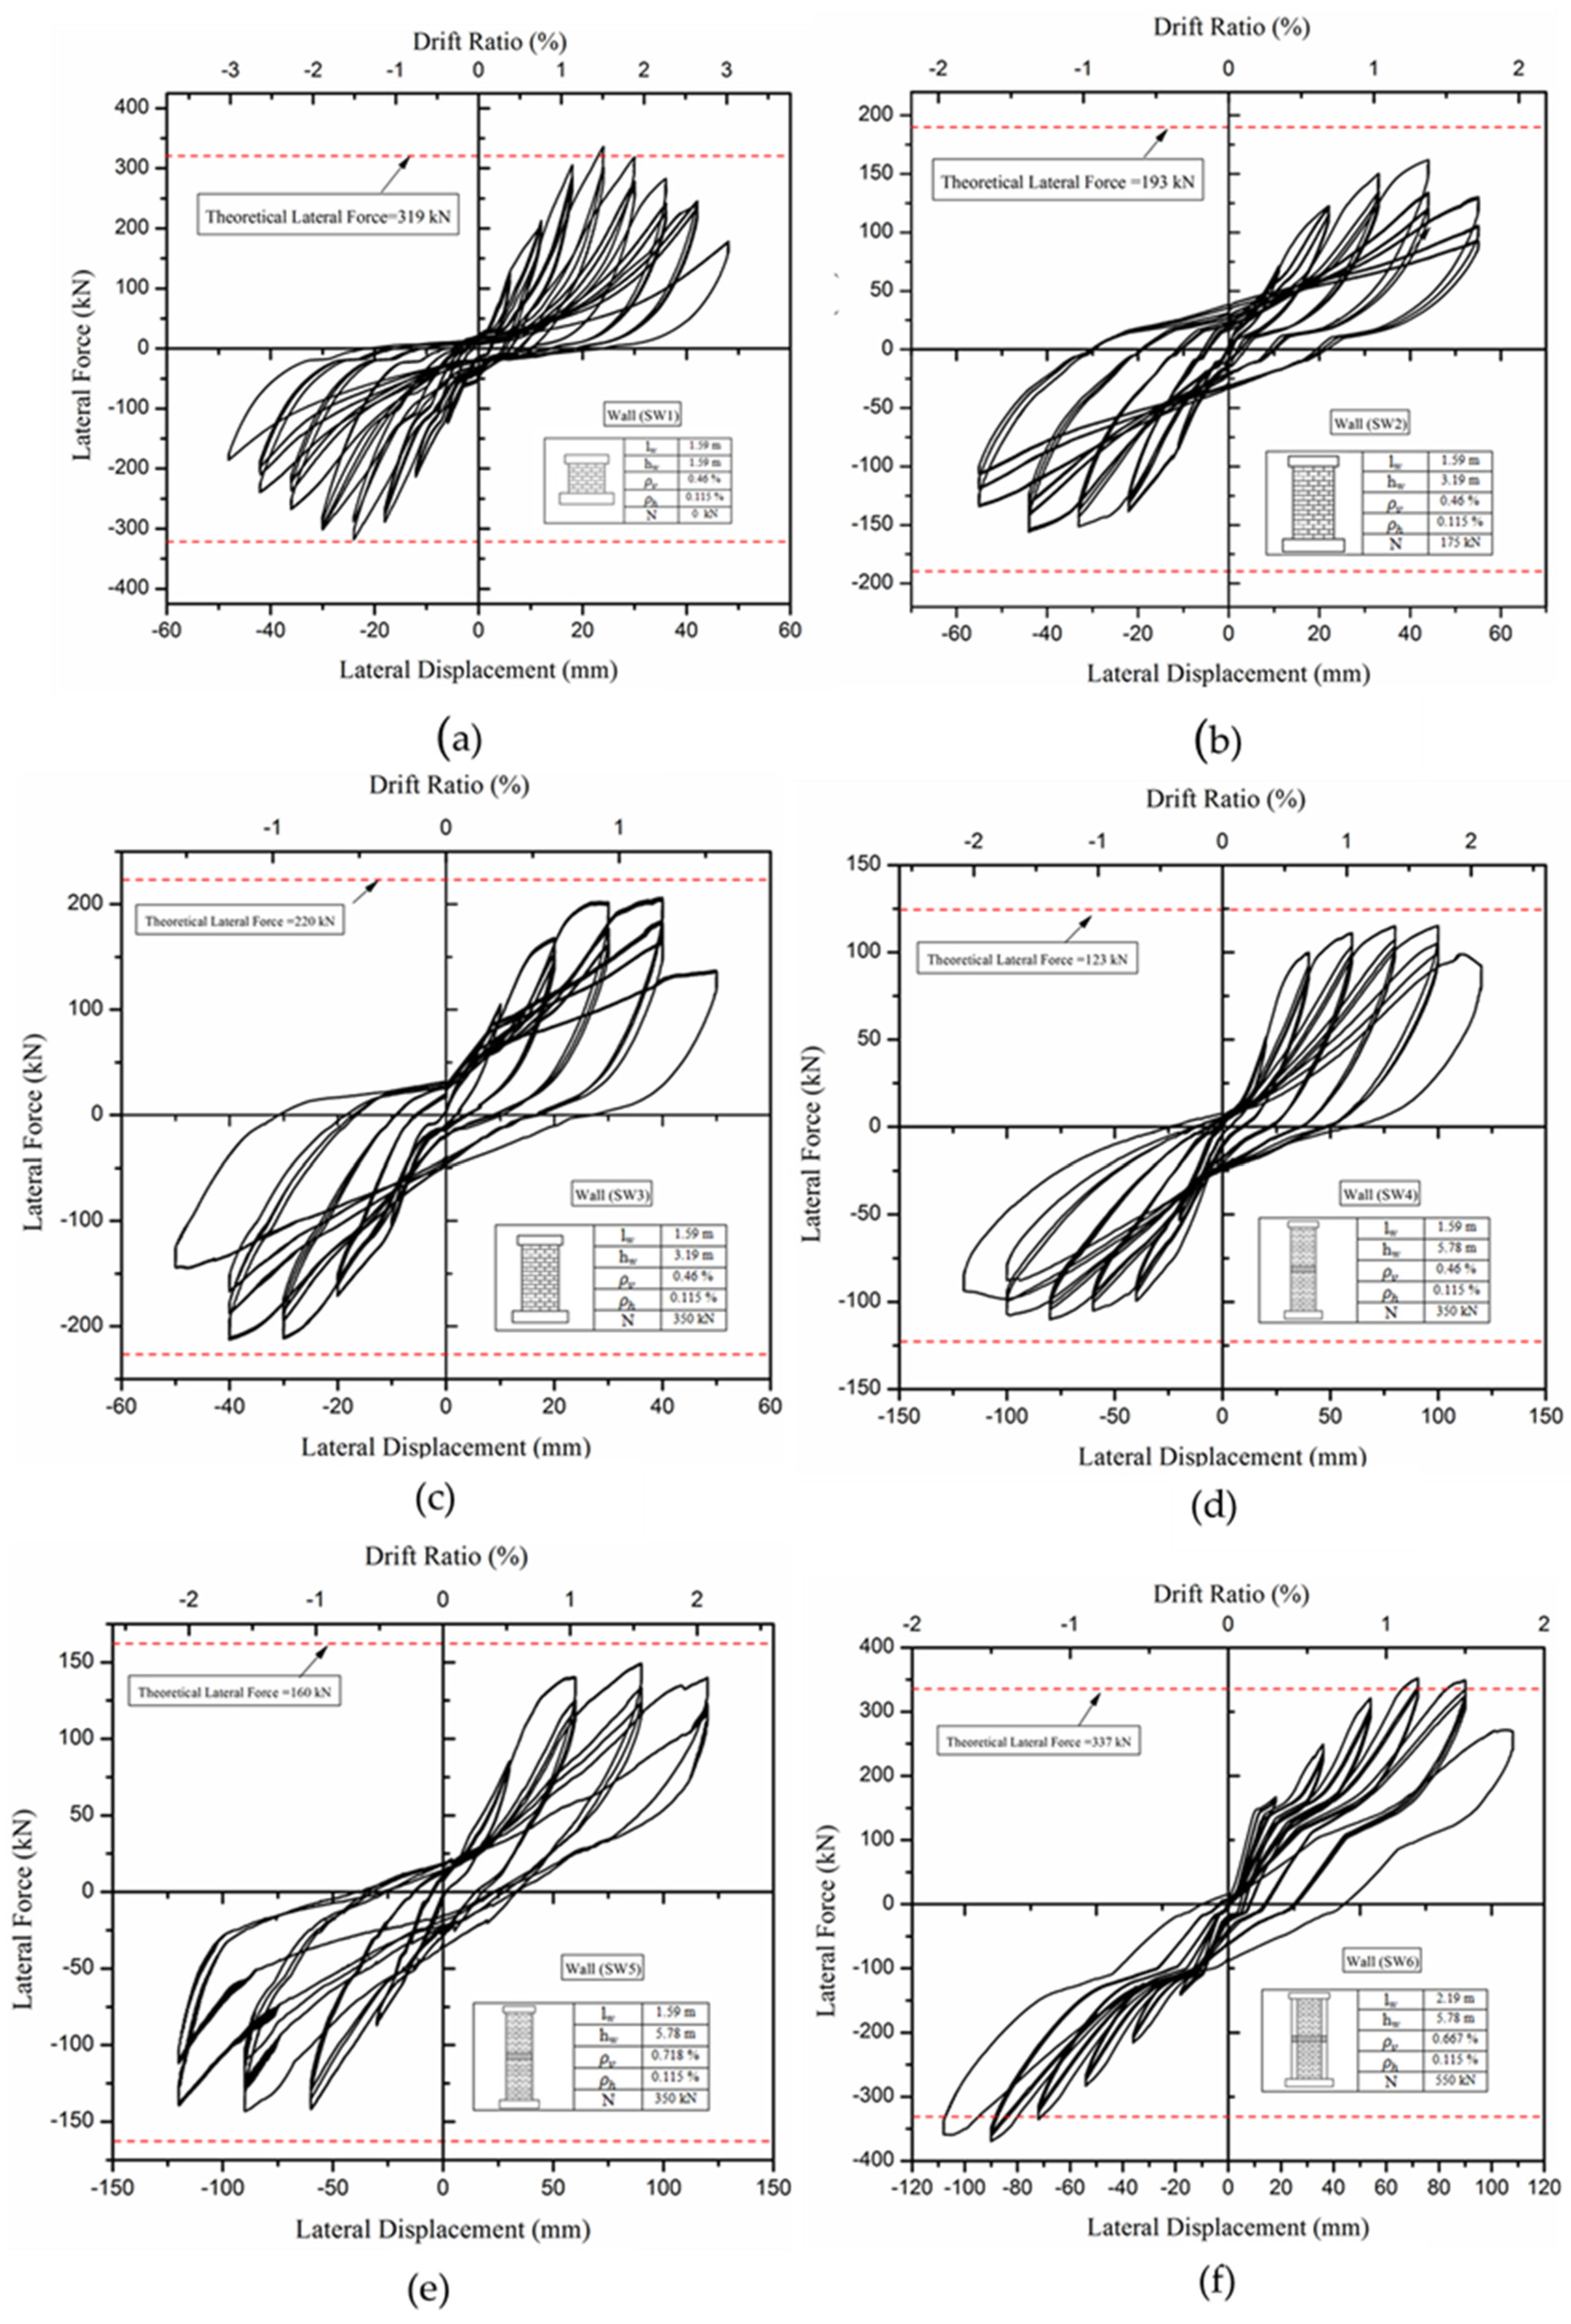
Table 4. The load-displacement hysteresis diagram for each SCMSW specimen is presented in
Figure 8, concerning the lateral displacement and the lateral load along with theoretical flexural capacities, which were determined from moment curvature analysis. The theoretical flexural capacity was based on the rectangular masonry compression stress block using the measured material strength. The effective thickness of the compression stress block was 220 mm after deducting the area covered by the insulation material. On average, the observed capacities decreased from the theoretical capacities by a factor of 0.94, which confirms the use of moment curvature analysis to predict the flexural strength for the newly-developed type of self-insulating concrete masonry shear walls. The predicted capacity for SW2, which was subjected to an axial stress of 0.5 N/mm
2 and had an aspect ratio of 2.0, was overestimated by 18%. This could be due to the fact that the cyclic loading test created residual stresses in the reinforcement and resulted in increased damage to the masonry [
4].
3.2. Lateral Drifts
The average total drift for each SCMSW specimen is presented in
Table 4 at the maximum observed lateral load and at failure, which is defined in this study as 80% from the maximum observed lateral load. At maximum load, walls with an aspect ratio of 1.0, 2.0, 2.6 and 3.6 had an average drift of 1.51%, 1.32%, 1.56% and 1.65%, respectively. Results showed that drift capacity for SCMSW specimens increased as aspect ratio increased, except SW1, which experienced a higher drift capacity. This can be referred to the contribution of sliding in the lateral displacement and slip in lab splices at the base [
19,
20]. The average total drift at failure ranged from 1.56% to 2.27%. The results revealed that the drift capacity was not significantly affected by the amount of the axial load in the constant of the aspect ratio and the flexural reinforcement.
3.3. Displacement Ductility
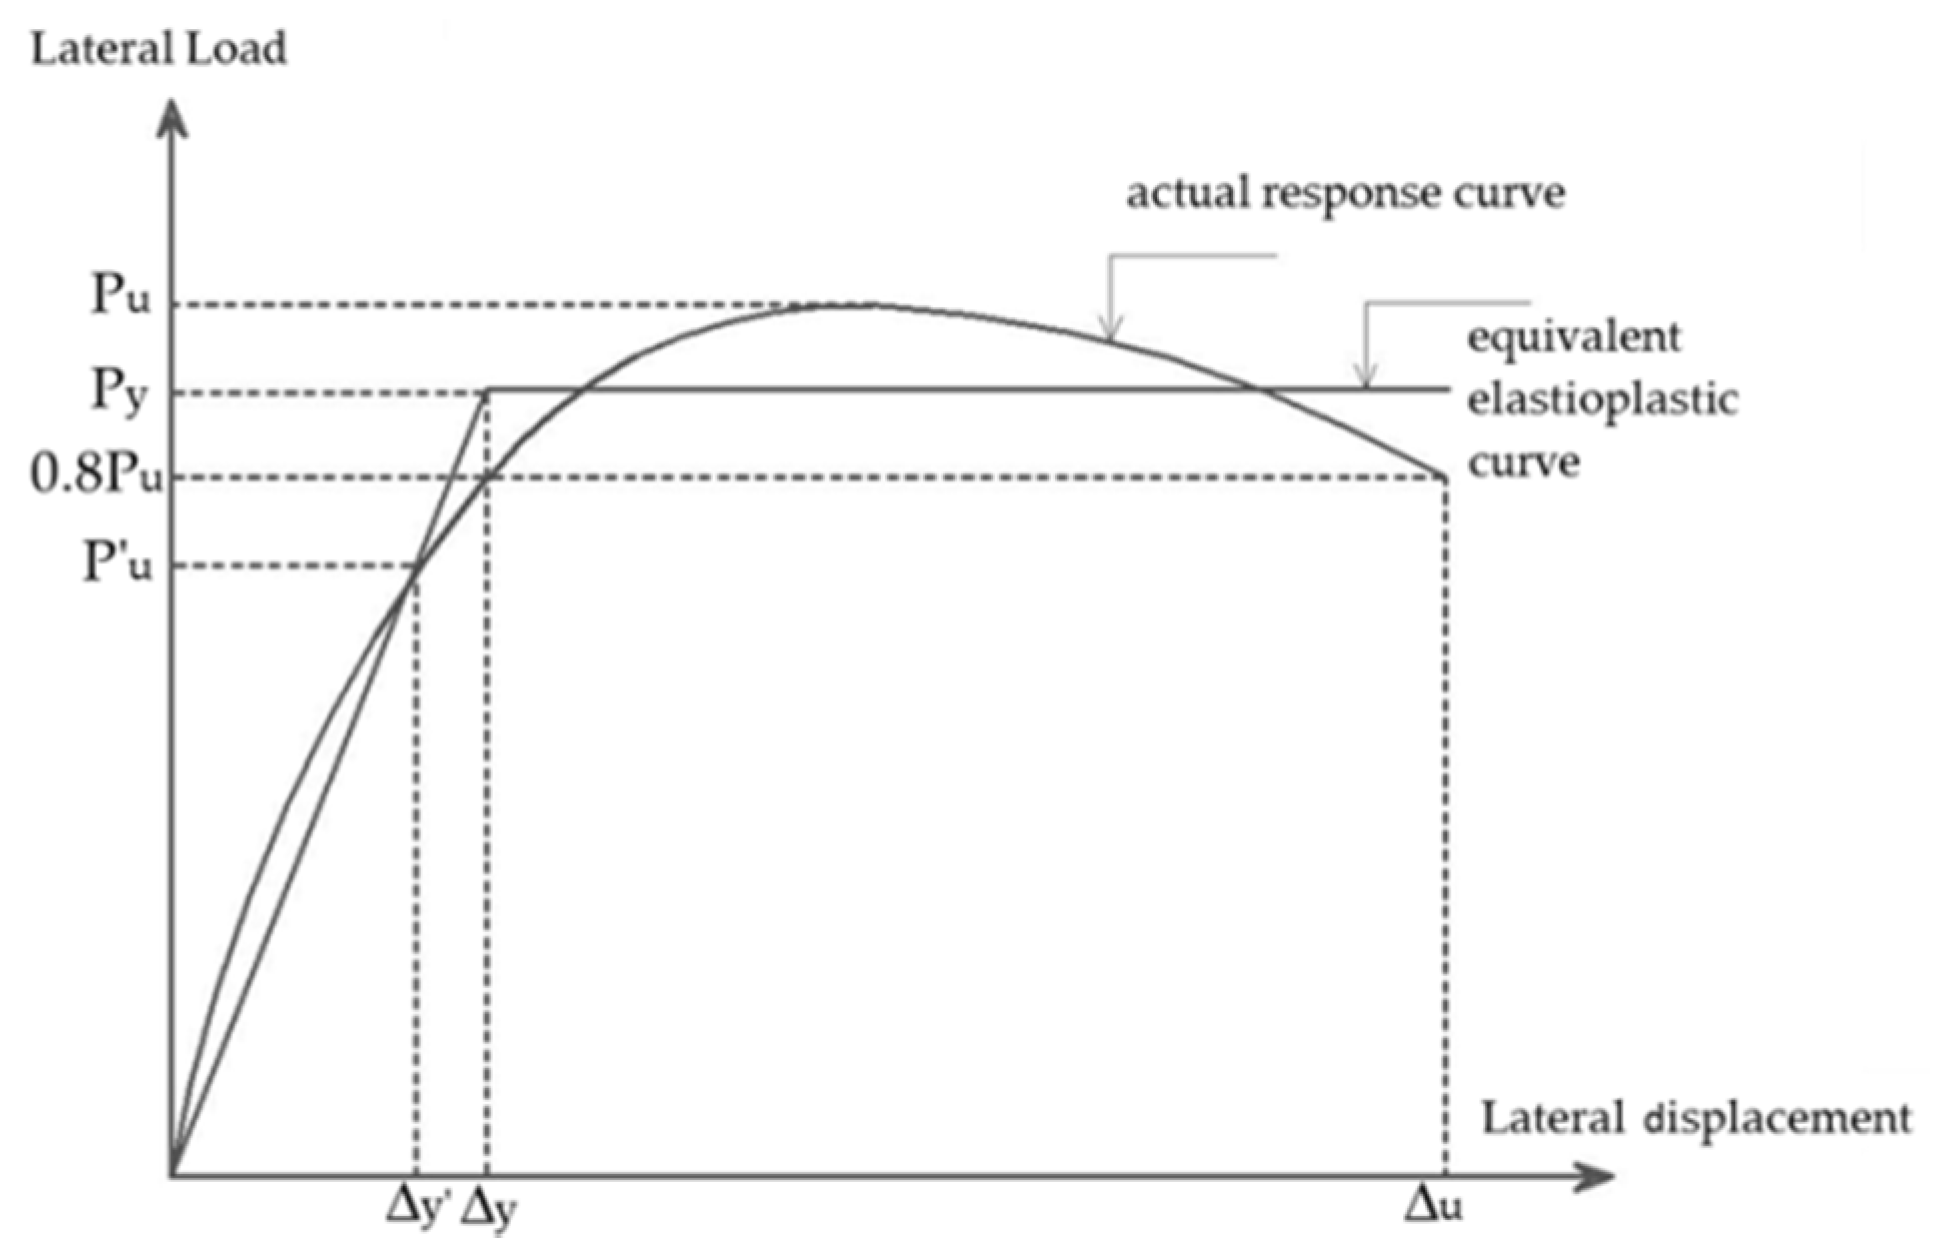
The average displacement ductility for each SCMSW specimen is shown in
Table 4. These values were calculated according to the elasto-plastic idealization (see
Figure 9) based on the area under the load-displacement envelope determined using the trapezoidal rule [
21]. The load-displacement envelope was composed of the pick lateral load at the first cycle for each displacement level until failure. The yield displacement was defined as the intersection of the secant stiffness through the first yield of the outermost vertical steel bar to the yield force of the elasto-plastic idealization. Furthermore, the displacement ductility was calculated for each load direction and then averaged as presented in
Table 4 for each SCMSW specimen. The lowest value of the displacement ductility was found in SW5, which had relatively higher flexural reinforcement ratio. Meanwhile, the highest value of the displacement ductility was found in SW6. This was due to the existence of the boundary elements at wall ends. The results revealed that the effect of axial load ratio and aspect ratio in the constant of flexural reinforcement ratio on the displacement ductility was not significant.
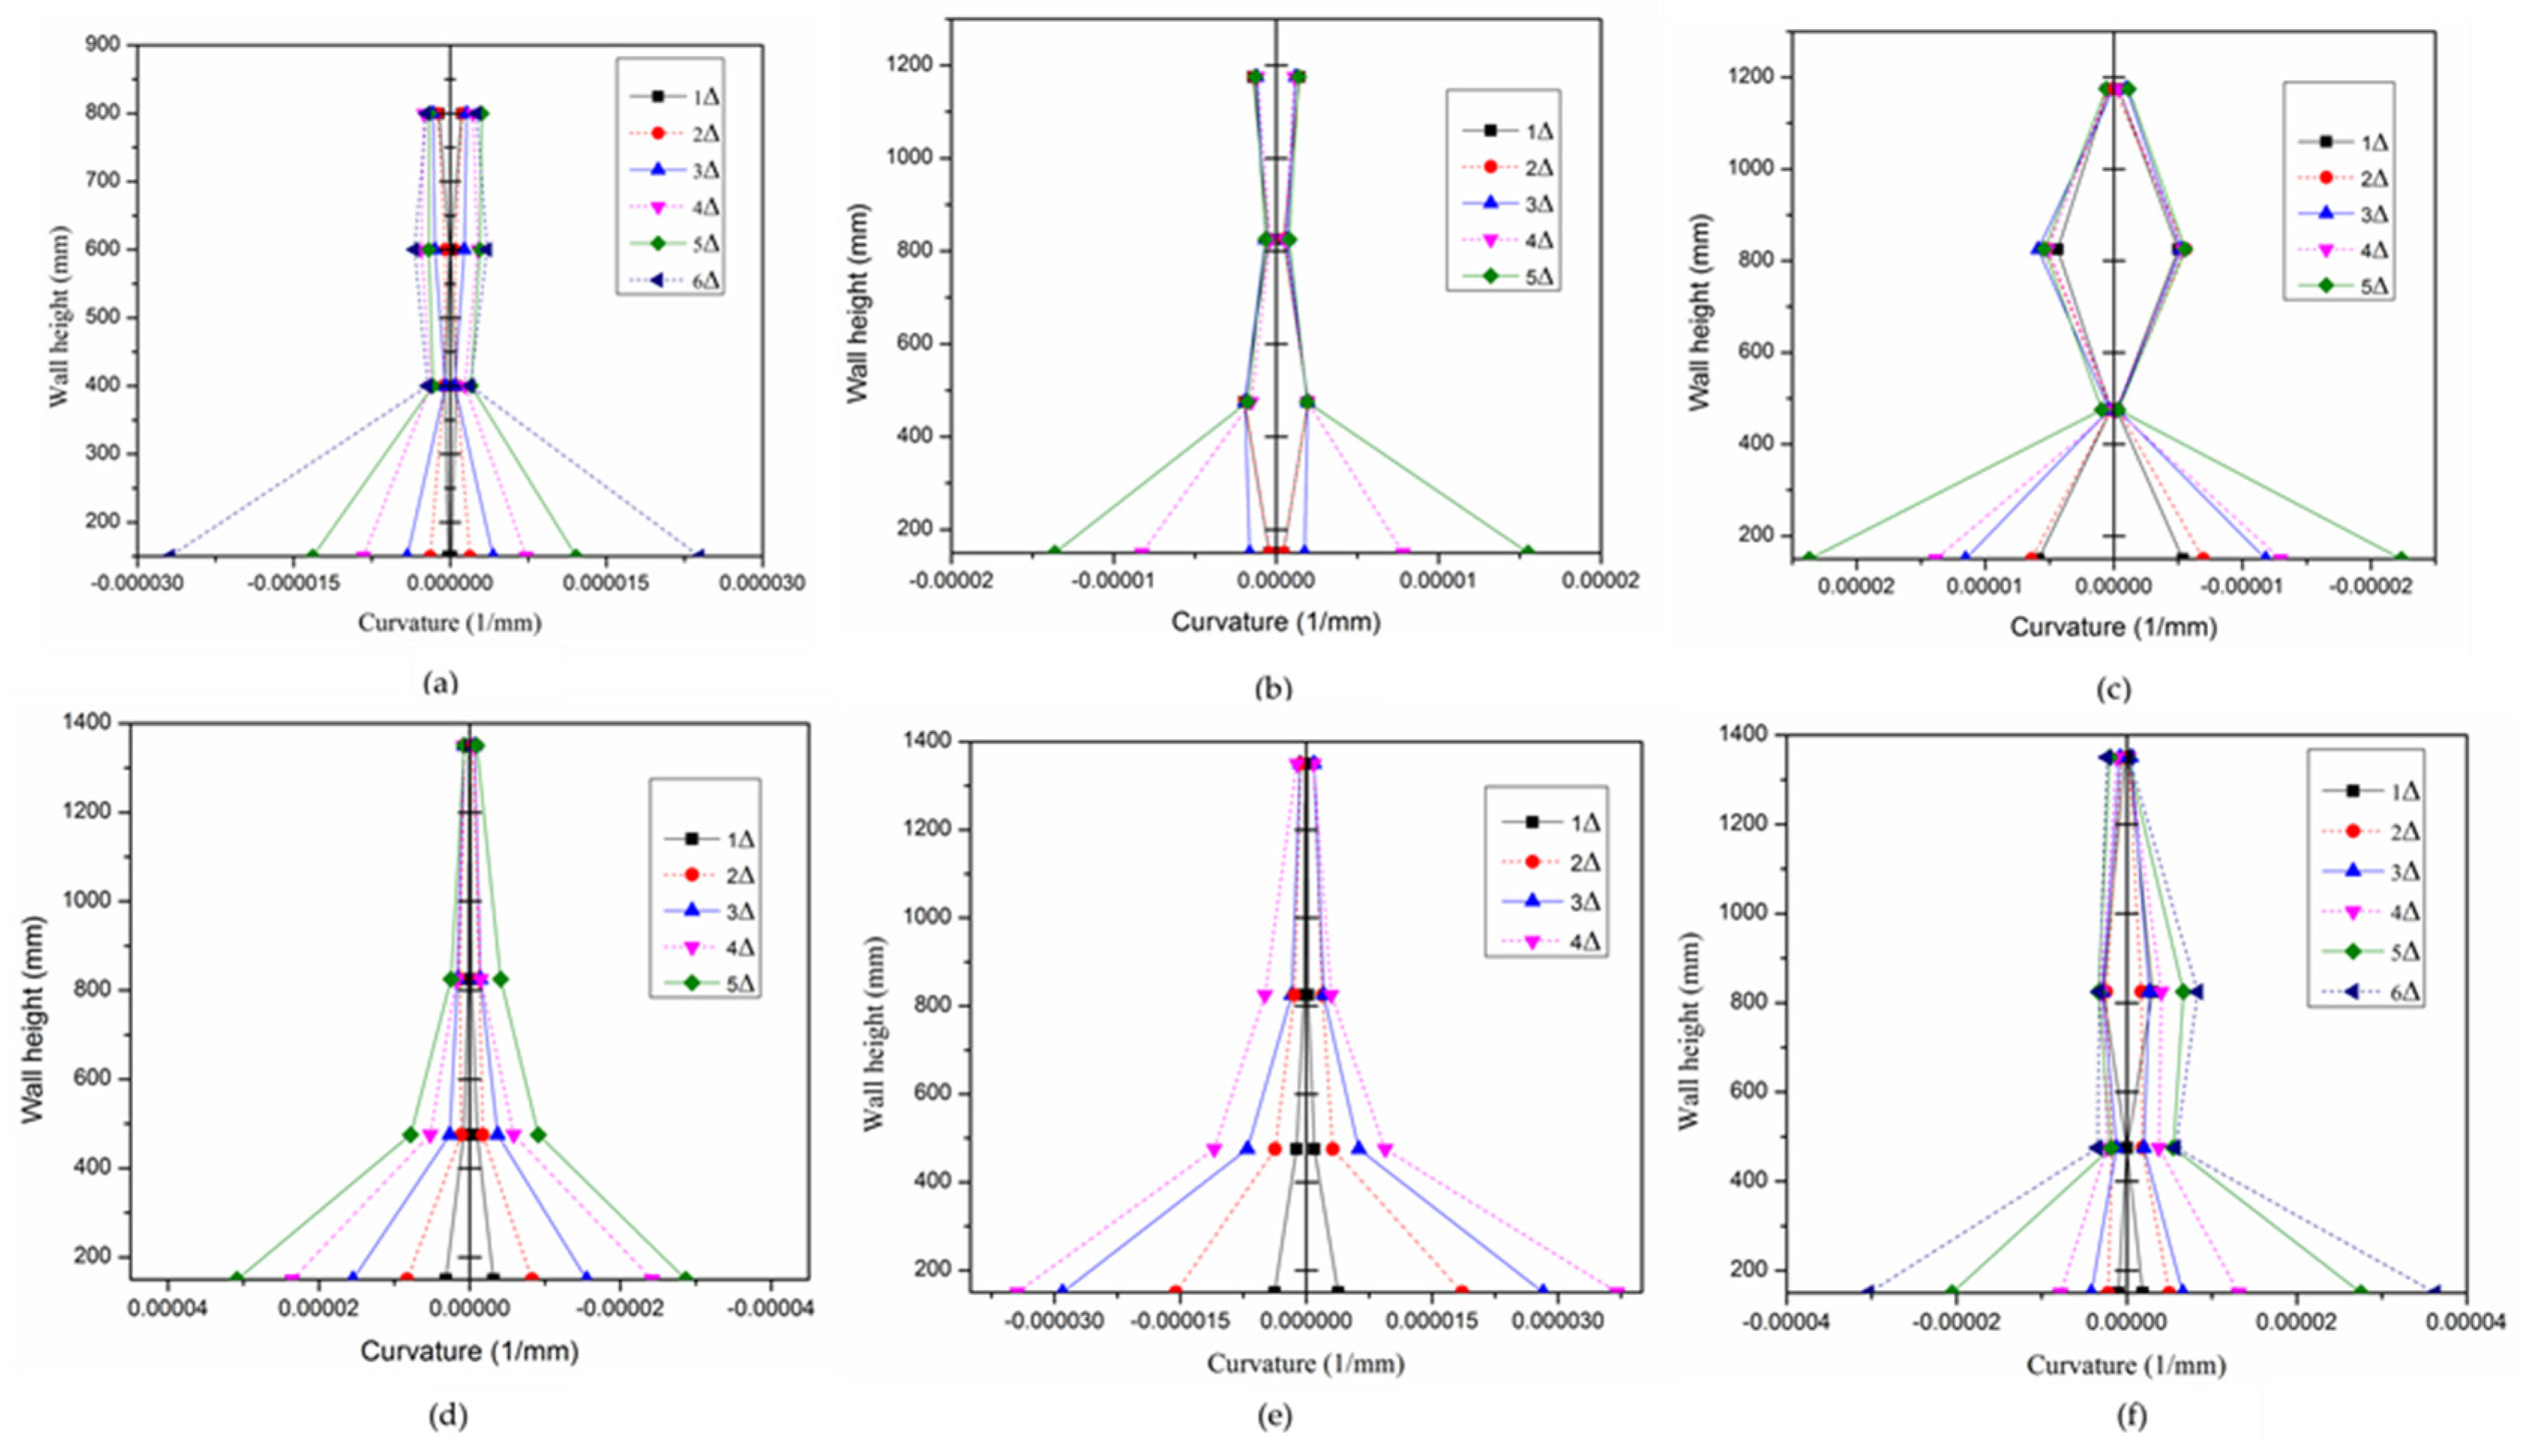
3.4. Curvatures
The curvature values were calculated from the measured strains at the wall ends from the recorded displacement of the vertical potentiometers located at both ends of the walls as shown in
Figure 3b. Furthermore, the average curvature (
i) over the strain gauge length (
Lgugae(i)) along the wall height was calculated based on the following equation:
where (
= the average curvature over a given segment height (
Lgugae(i)) along the wall height (mm
−1);
= average tensile, compression strain over a given segment height (
Lgugae(i)); (
= measured tensile, compression displacement over a given segment height (
Lgugae(i)) along the wall height (mm); and (
) = in-plane distance between the gauges (mm).
Moreover, large curvature values were recorded at the base of SCMSW specimens as shown in
Figure 10, where the moments were large and induced extensive nonlinear deformation. In addition, the curvature was concentrated at the plastic hinge zone, where visible damage occurred, such as bar buckling, concrete cracks and cover spalling, as shown in
Figure 11.
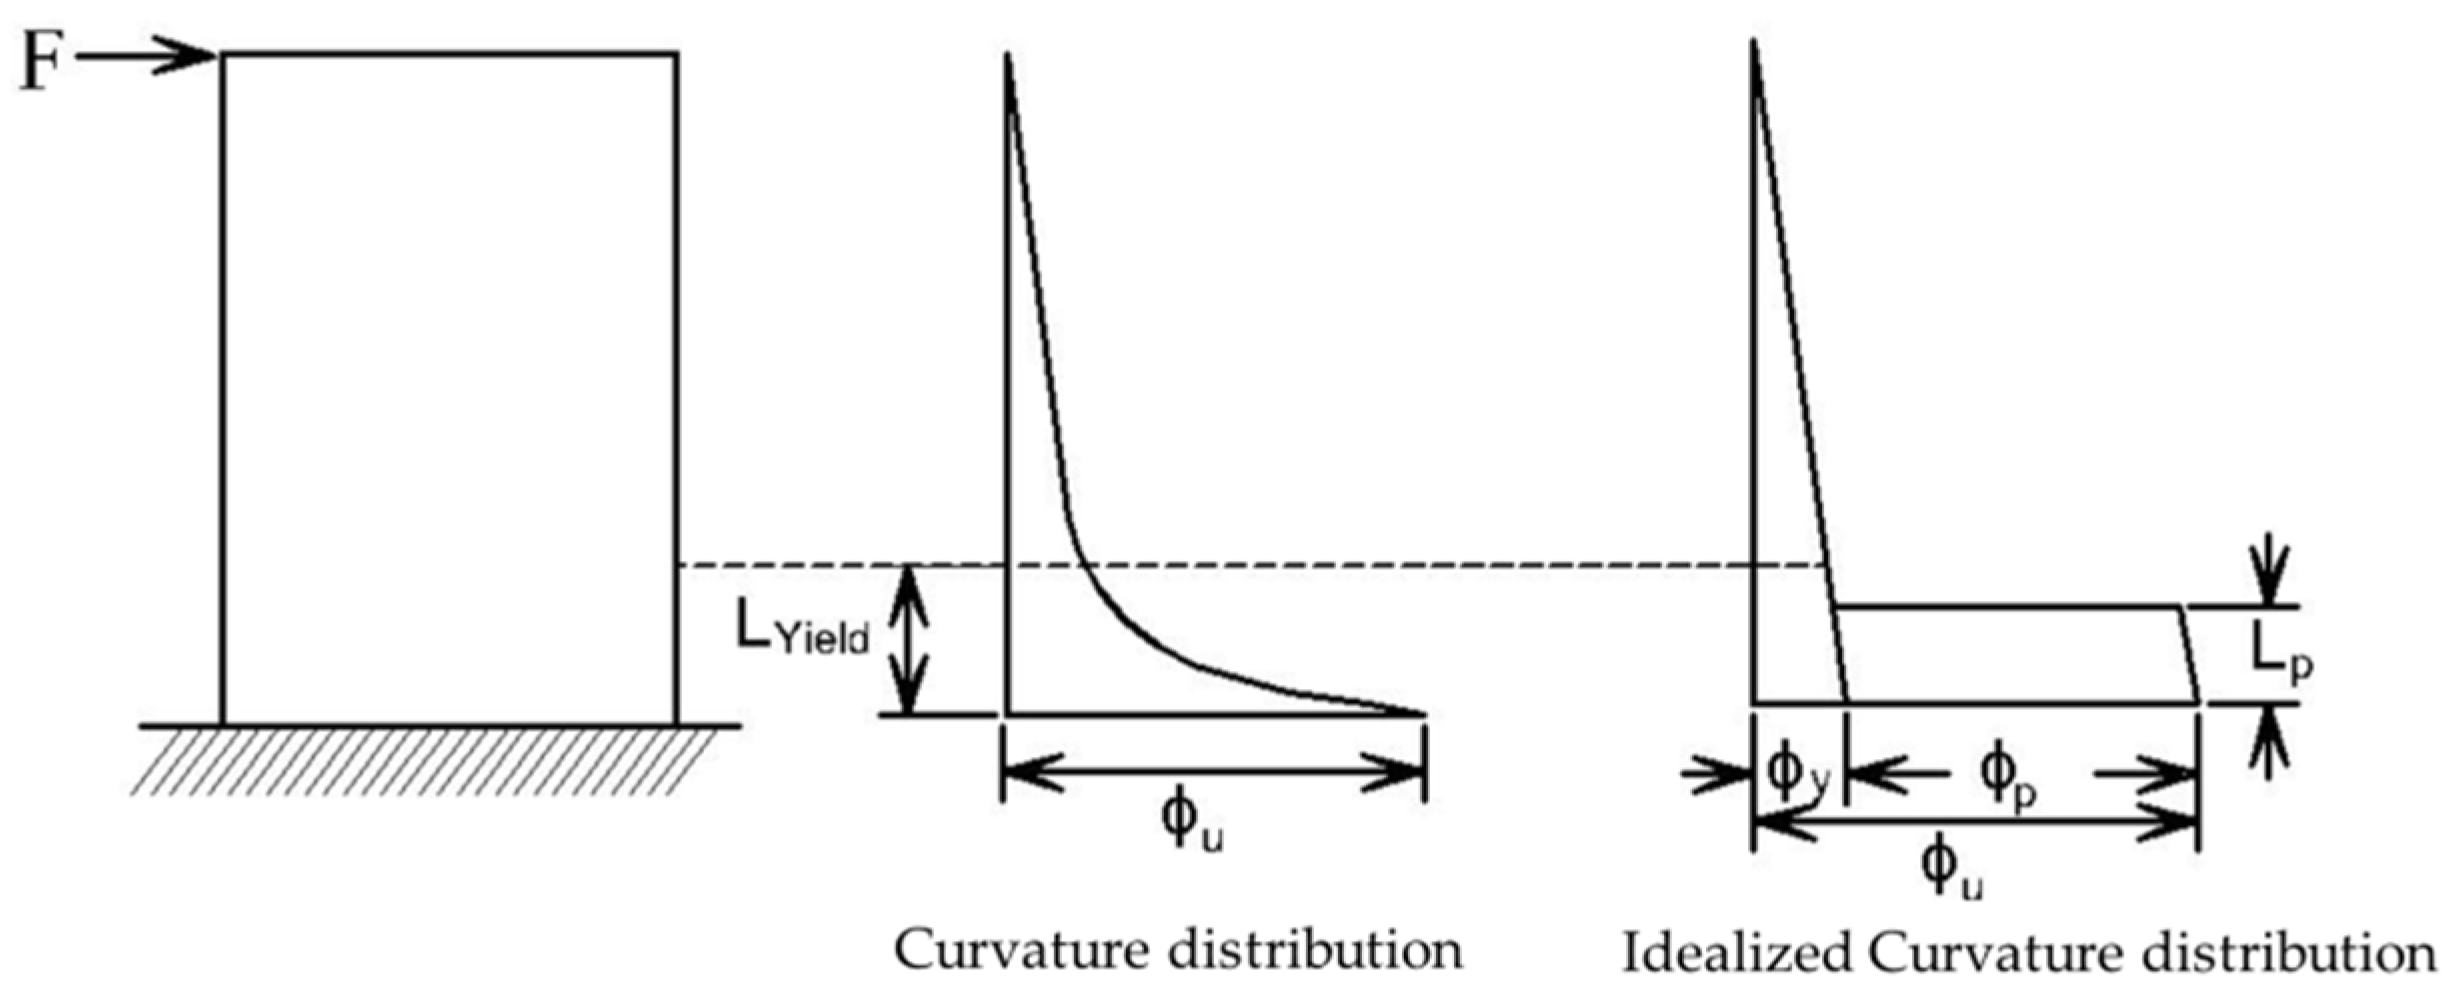
3.5. Plastic Hinge Length
The plastic hinge length for each SCMSW specimen is presented in
Table 4. The plastic hinge lengths were calculated based on the recommendation of Shdied et al. [
21] and Bohl and Adebar [
22]. According to these recommendations, the yielded length (
Lyield) is taken equal to the height above the foundation at which the curvature is equal to the yield curvature, as shown in
Figure 12. Then, the plastic hinge length (
Lp) is assumed equal 0.5
Lyield. The resulting plastic hinge lengths are shown in
Table 4 for each SCMSW specimen. Average values of the plastic hinge lengths fall between values from 12.65% to 28.85% of the wall length. Shdid et al. [
21] and Farhad et al. [
20] found ratios of plastic hinge length to wall plan length falling between values from 17% to 37% and 10% to 41%, respectively. The plastic hinge lengths were not significantly affected by the amount of the flexural reinforcement and the amount of the axial load in SCMSW specimens. On the other hand, when the aspect ratio (height to length) increased, the plastic hinge length increased.
4. Effect of Design Parameters on Seismic Performance of SCMSW Specimens
The proceeding sections assess the relationship between key design parameters (wall aspect ratio, amount of flexural reinforcement and magnitude of axial compression load) on the hysteretic curve of SCMSW specimens.
4.1. Effect of Aspect Ratio on Hysteretic Response of SCMSW Specimens
Four different aspect ratios were chosen to evaluate their effect on the hysteretic curve.
Figure 13 shows the normalized load-displacement curve envelopes for comparable SCMSW specimens, which are plotted in terms of the observed lateral load and the lateral displacement. It is clearly visible that, when the aspect ratio of the SCMSW specimens decreased, the initial lateral stiffness increased. The lateral displacement increased as the aspect ratio increased. SW6 shows relatively high initial lateral stiffness and larger amount of lateral displacement. This is due to the existence of the boundary elements. SW3 and SW4 had the same amount of flexural reinforcement ratio and load ratio with different aspect ratios. Results indicated that there was a decrease in the maximum observed lateral load from 213 kN for SW3 to 115 kN for SW4, resulting in a strength decrease of 54% when the aspect ratio increased from 2 to 3.6.
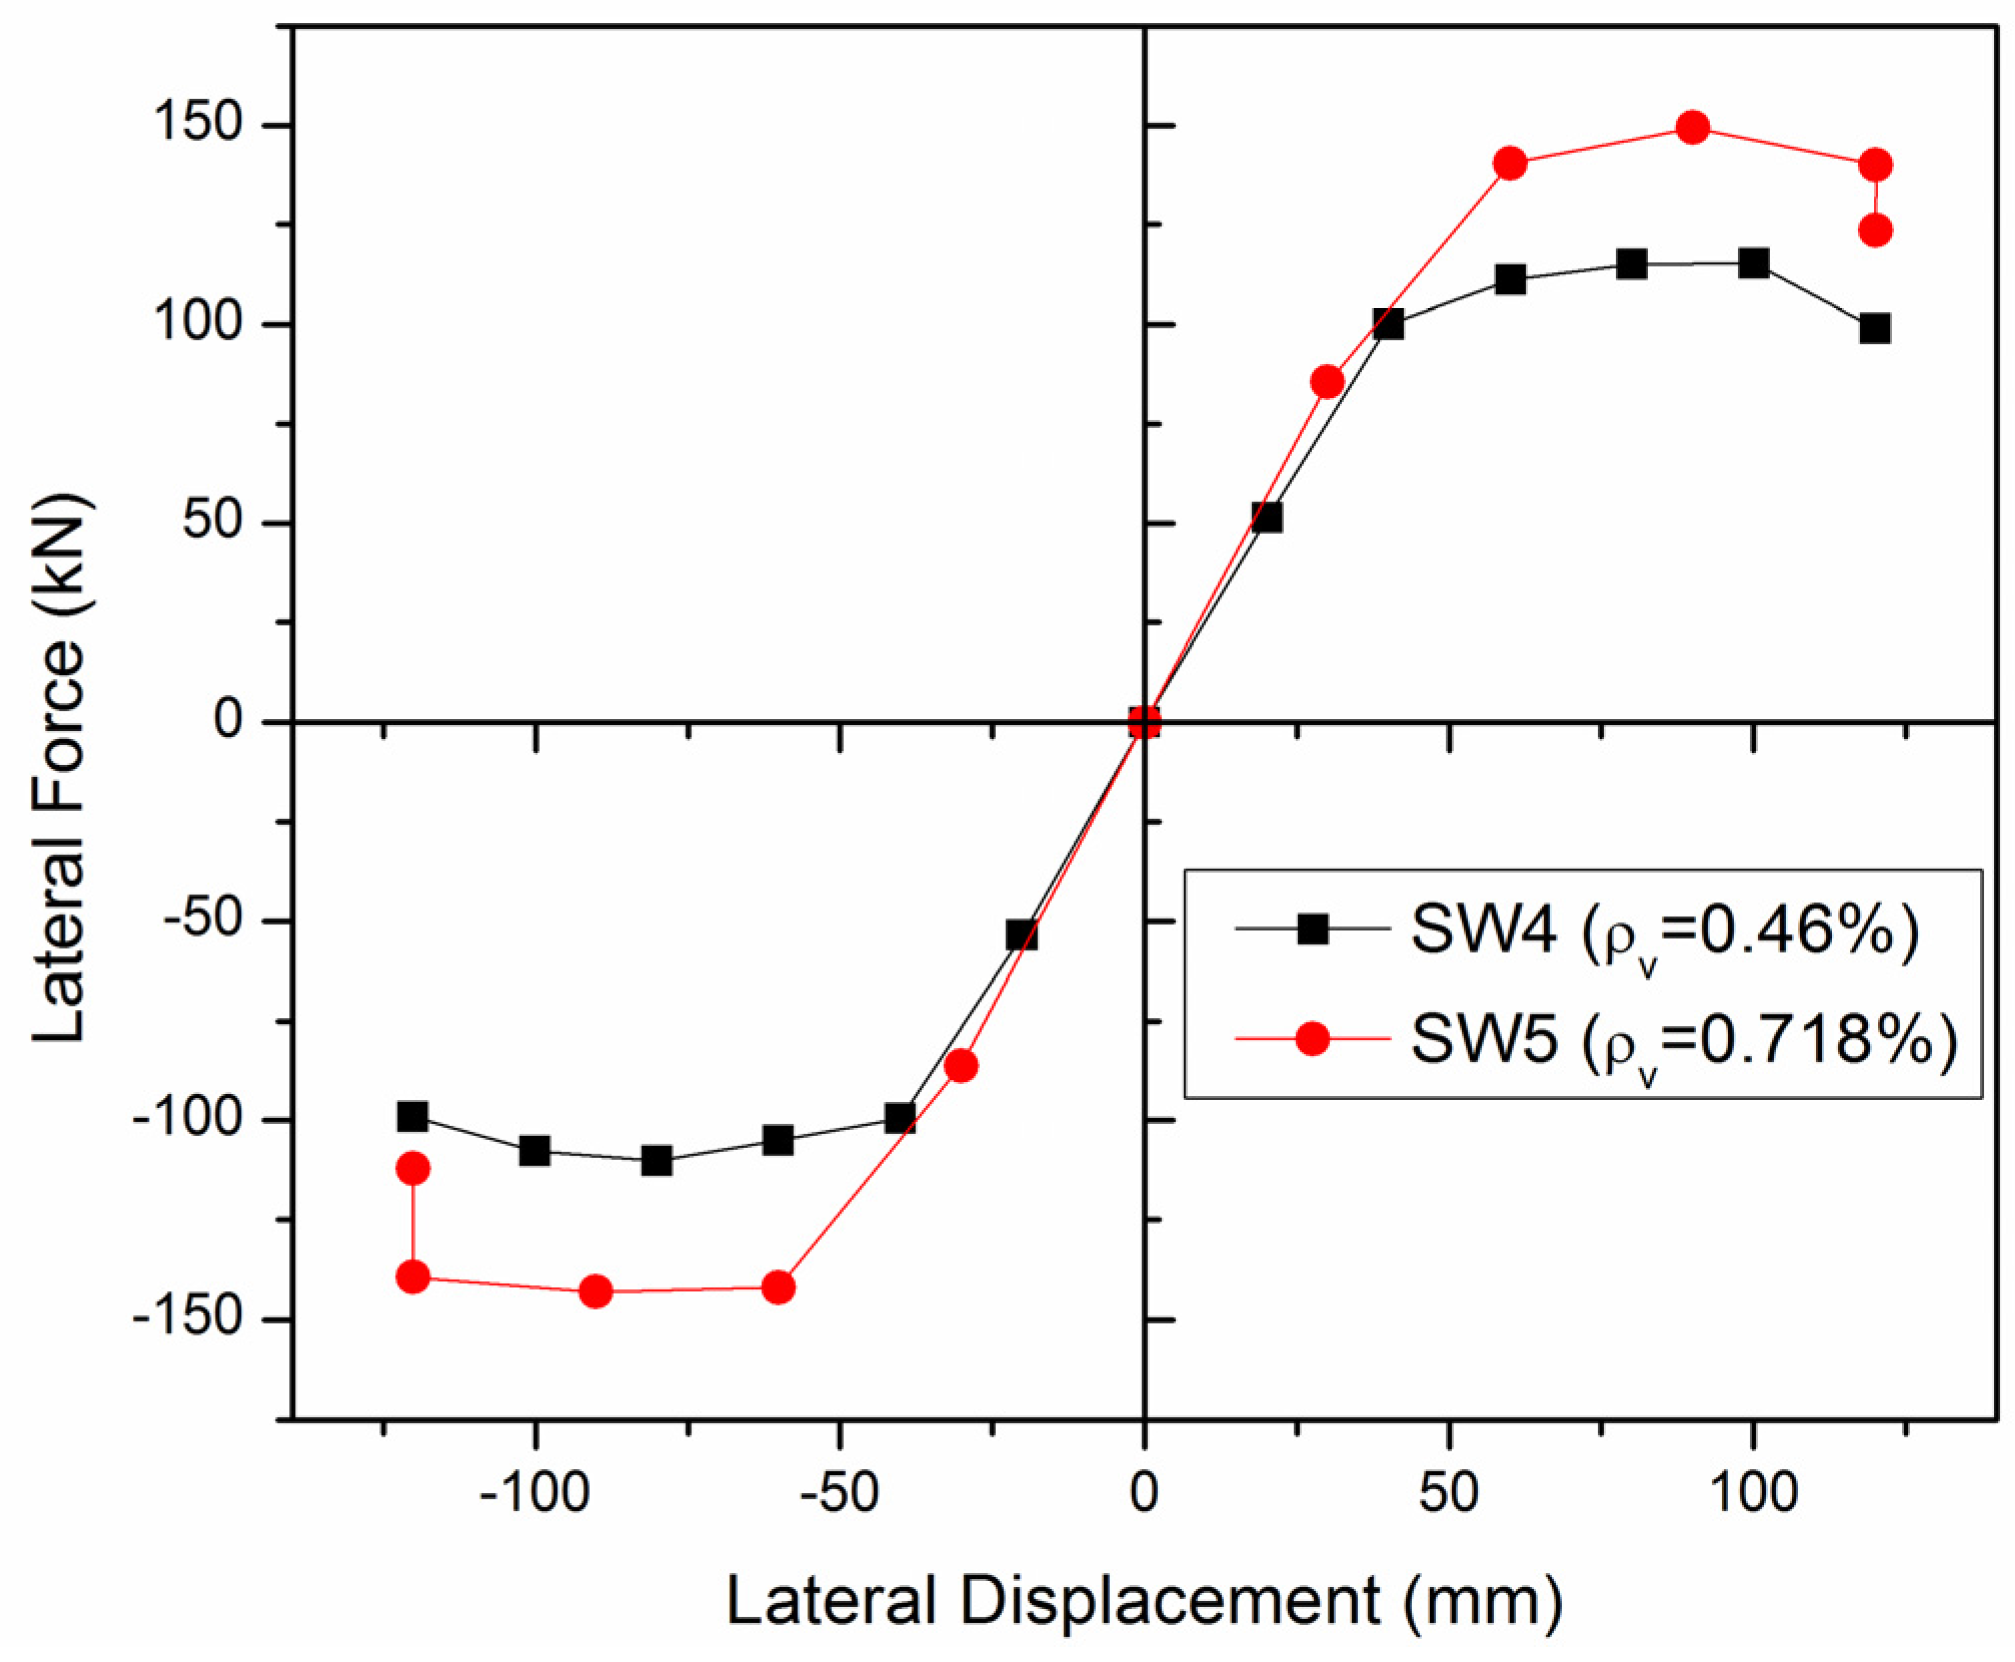
4.2. Effect of Vertical Reinforcement Ratio on Hysteretic Response of SCMSW Specimens
Figure 14 illustrates the effect of the amount of flexural reinforcement on the wall behavior which is evaluated based on the results of two SCMSW specimens which had an identical aspect ratio and same magnitude of axial loading. The maximum observed lateral load increased from 115 kN for SW4 to 149 kN for SW5, resulting in a strength increase of 30% when the vertical reinforcement ratio increased from 0.46% to 0.718%.
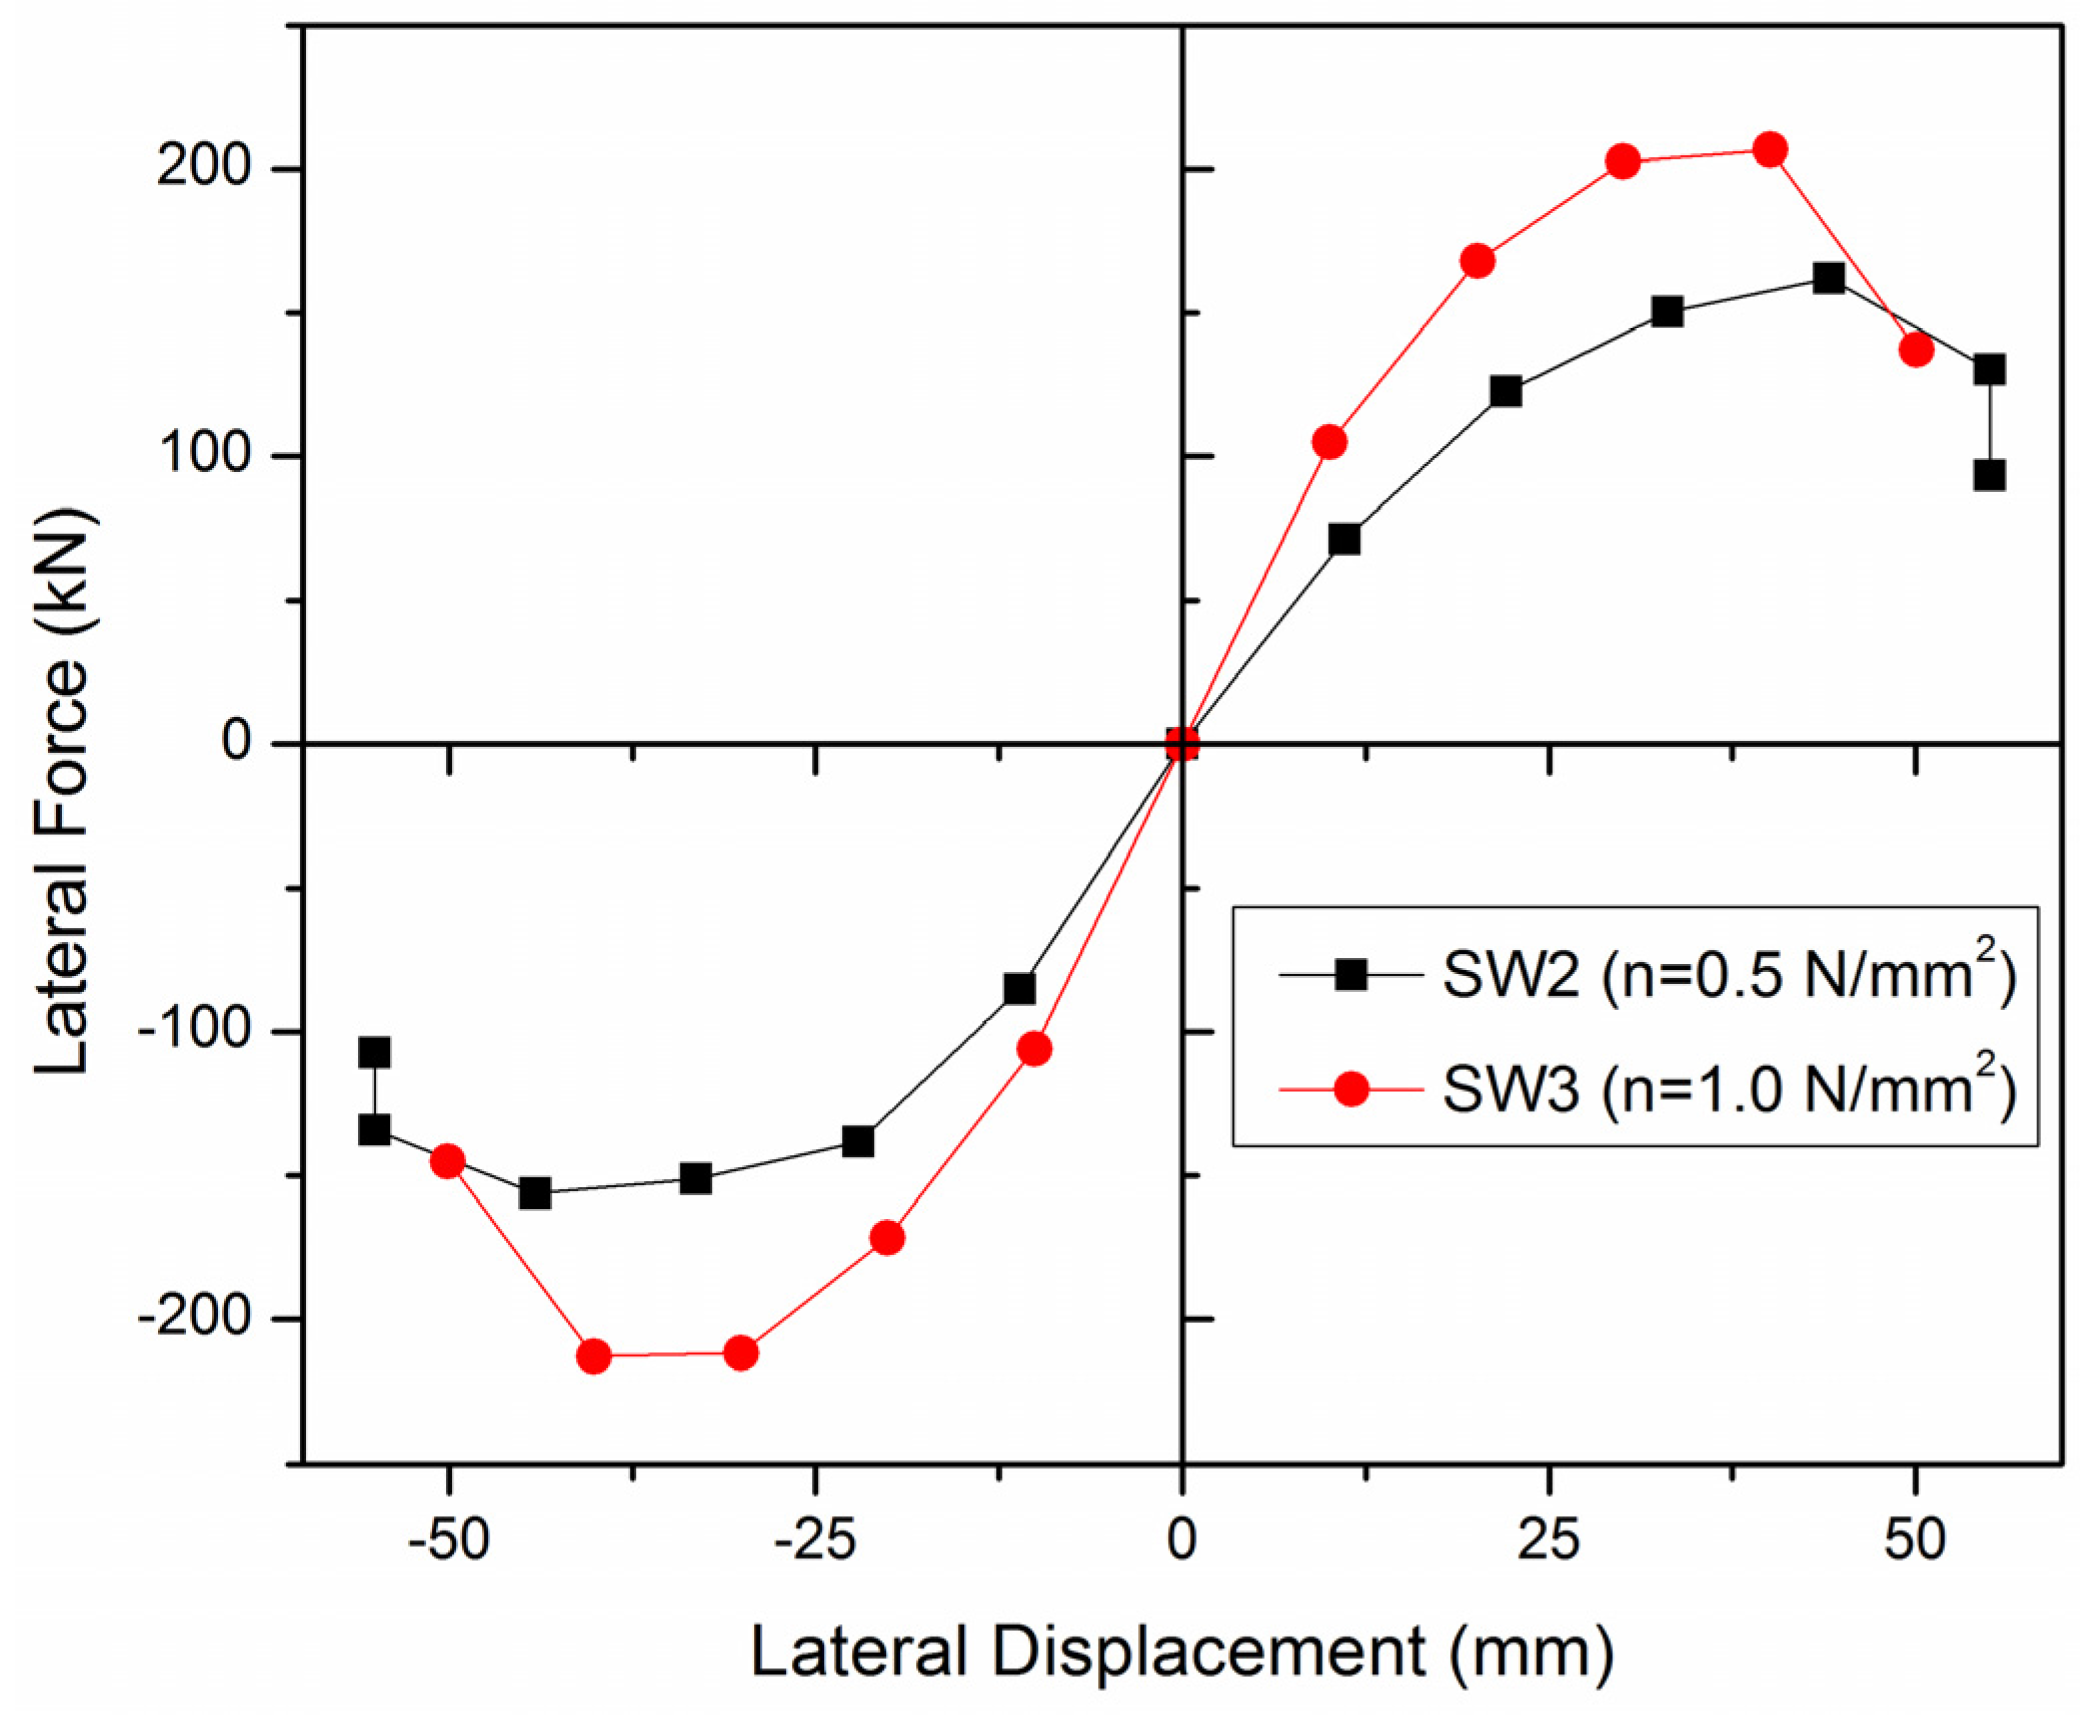
4.3. Effect of Axial Load Ratio on Hysteretic Response of SCMSW Specimens
In this section, the effect of axial load on load-displacement behavior is evaluated based on the results of two SCMSW specimens which had identical aspect ratio and the same amount of flexural reinforcement. The normalized load displacement envelopes for these comparable specimens are given in
Figure 15. Results revealed that the maximum observed lateral load increased from 162 kN for SW2 to 213 kN for SW3, resulting in a strength increase of 31% when the axial load ratio increased from 0.5 to 1.0 N/mm
2. Moreover, the lateral displacement capacity decreased inversely in relation to an increase of the axial load ratio.
5. Conclusions
This paper presents an experimental study for masonry shear walls which were built from a new type of self-insulating concrete masonry units, and subjected to in-plane cyclic loading. Based on the results of the experimental work and analysis, the following conclusions can be made:
1. The use of the moment curvature analysis to predict the flexural capacity of SCMSW specimens is a valid assumption, with an average accuracy of 94% for all SCMSW specimens.
2. Using small size of bars with closely-spaced shear reinforcement enabled the distribution of the stresses throughout the wall diagonals and improves the post-cracking behavior, thus leading to higher energy dissipation and more ductile behavior.
3. The plastic hinge lengths of SCMSW specimens ranged from 12.65% to 28.85% of the plan length of the wall.
4. The displacement ductility decreased when the flexural reinforcement ratio increased. In addition, the amount of the vertical load and aspect ratio had no significant effect on the displacement ductility of the SCMSW specimens.
5. The existence of the boundary elements at the SCMSW specimen ends increased the ductility and the lateral load capacity.
6. Specimens with an identical amount of axial load and aspect ratio with different amounts of the flexural reinforcement showed an increase of the lateral capacity load by 30% when the flexural reinforcement ratio increased from 0.46% to 0.72%. On the other hand, approximately the same percentage was obtained when specimens had identical amounts of flexural reinforcement and aspect ratio with varying amounts of the axial applied load from 0.5 to 1.0 N/mm2.


