Article

Design Point Performance and Optimization of Humid Air Turbine Power Plants

Propulsion Engineering Centre, School of Aerospace, Transport and Manufacturing, Cranfield University, Cranfield, Bedfordshire MK43 0AL, UK
*
Author to whom correspondence should be addressed.
Appl. Sci. 2017, 7(4), 413; https://doi.org/10.3390/app7040413
Submission received: 30 January 2017 / Revised: 11 April 2017 / Accepted: 13 April 2017 / Published: 20 April 2017
(This article belongs to the Special Issue Gas Turbines Propulsion and Power)

Abstract

:
With the recent drive towards higher thermal efficiencies and lower emission levels in the power generation market, advanced cycle power plants have become an increasingly appealing option. Among these systems, humid air turbines have been previously identified as promising candidates to deliver high efficiency and power output with notably low overall system volume, weight and emissions footprint. This paper investigates the performance of an advanced humid air turbine power cycle and aims to identify the dependencies between key cycle design variables, thermal performance, weight and cost by means of a parametric design optimization approach. Designs of the main heat exchangers are generated, aiming to ascertain the relationship between their technology level and the total weight and acquisition cost of them. The research outcomes show that the recuperator and the intercooler are the two components with the largest influence on the thermal efficiency and the total cost. The total weight of the power system is driven by the technology level of the recuperator and the economizer. Finally, the effectiveness of the aftercooler seems to have the greatest impact in reducing the total acquisition cost of the system with minimum penalty on its thermal efficiency.

1. Introduction

Clean and cost effective power generation is a key factor to respond to the challenges arising nowadays in the power generation market. Thermal efficiency enhancements by advanced cycle power plants significantly impacts pollutant emissions and consequently cost of electricity. Therefore, it can be argued that advanced cycle plants with low environmental footprint increase their competiveness in a market dominated by increasingly stringent emission regulations. Techno-economic assessments of such technologies should be, therefore, undertaken to identify the economic viability of such systems.
Humid Air Turbine (HAT) or Evaporative Gas Turbine (EvGT) cycles were previously found to offer lower specific investment costs than combined-cycle gas turbines (CCGTs) and notably higher thermal efficiencies, especially in the range of small to medium-sized power plants [1,2]. Moreover, HAT cycles can also offer greater specific power (higher even than the specific power of the ‘dry’ gas turbines), faster start-up times (comparable to the typical start-up times of ‘dry’ gas turbine packages), potential to reduce even further the NOx emissions due to the presence of high levels of humidity within the combustion chamber of the gas turbine, better part-load performances, and low susceptibility to ambient conditions compared to the CCGTs [3].
Since the introduction of HAT cycles in the late 80s [4], the potential of these systems has been studied extensively. Chiesa et al. [5] performed a comparison of three humid cycles showing that the HAT cycle achieved the highest thermodynamic performance, enhancing the thermal efficiency more than 10 percentage points (pp) compared to a simple cycle. The enhancement was mainly attributed to the reduction in the discharge losses and the recuperation of the heat rejected in the intercooler within the saturator. The authors also pointed that the thermal efficiency could be further increased if a reheater was placed. Lazzaretto and Segato [6,7] performed a thermodynamic optimization of a HAT cycle where they considered the heat exchanger network as a “black box” to be later optimized. The study established that the intercooling temperature for optimum thermal efficiency was the one minimizing the compression work, and that the pressure ratio does not affect the thermal efficiency but only the specific power. When optimizing the heat exchanger network independently, they discover that the best configuration only included one intercooler, one aftercooler, and one economizer. Ågren and Westermark analysed the potential of part-flow humidification whereby a percentage of the air flow bypasses the humidifier, showing that, in some cases, it can imply a lower initial investment and even higher cycle thermal efficiencies [8,9]. Moreover, Jonsson and Yan [1] presented a detailed economic analysis proving the advantages of part-flow humidification, as lower specific investment cost for a similar cost of electricity compared to the combined cycle or the fully humidifed version. They also proved, that for larger overall pressure ratios, the benefits of the humidification process increase. In addition, Thern et al. [10] tested the idea of including an aftercooler downstream the compressor, proving that the addition of this component boosts the performance of the whole plant by enhancing the amount of heat recovered in the humidifier. Further studies have been carried out on the part load performance of HAT cycles. Wang et al. [11] and Kim et al. [12] concluded that HAT systems are less susceptible to ambient conditions than simple cycle gas turbines. Takahashi et al. [13] showed that humid turbines may demonstrate a better part-load performance than combined cycles. Additionally, optimizations performed by Kavanagh et al. [14] and Moller et al. [15] showed that the variables that drive the cycle’s thermal efficiency are the overall pressure ratio (OPR), the relative pressure ratio, and the recuperator effectiveness. Additionally, Nyberg and Thern [16] studied the influence of each of the heat exchangers in thermal efficiency and specific power of the cycle, proving that the intercooler and the recuperator are the components with the largest impact on the effieicny, and the economizer is the one that drives the most signcant increment in the specific work.
Although no HAT power plants are yet in commercial service, a few experimental facilities have been built [17,18,19,20] to demonstrate this concept in reduced-scale or even micro gas turbines and identify experimentally the potential of such systems in terms of performance, part-load operation and emissions. Only one full-scale 40 MW power plant has been built aiming to investigate potential commercialisation of such systems on the power generation field [21].
Although simple humid air turbine systems have been thorougly researched previously, no emhpasis was given on the identification of the maximum thermal efficiency potential of such system as highlighted by Chiesa et al. in [5] by means of a reheated humid cycle. As pointed out by Chiesa et al. [5], such a cycle may feature notably better performance relatively to a single burner system that may promote the exploitation of humid cycle power plants in applications where high thermal efficiency and high power-to-plant size rations are of importance. This paper presents the design and optimization of an advanced humid air turbine reheated power plant and a parametric analysis across a range of key design parameters. The relationship among the key design parameters of the main heat exchangers of the system and its thermal efficiency is established. Finally, design specifications of the key heat exchangers are produced enabling correlations between cycle efficiency and heat exchanger weight and acquisition cost.

2. Methodology

Figure 1 shows the layout of the HAT system studied herein. It comprises a dual-shaft gas generator with a free power turbine. Water absorption into the compressed air takes place in the saturator. The dry air entering the saturator is previously cooled down in the aftercooler, which increases the performance of the saturator tower as it permits to recover larger amounts of low-quality—i.e., low temperature—heat [10]. Once inside the tower, both heat and mass are transferred from the stream of hot water circulating counter-currently into the air, increasing its temperature and mass flow. Due to the relatively low temperatures of the humid air exiting the saturator, the HAT cycle benefits from a recuperator that recovers the high-quality—i.e., high-temperature waste heat from the exhaust gases before streaming the humid air into the combustion chamber. An additional bypass is also present between the high-pressure compressor exit and the inlet of the recuperator, as suggested by Ågren and Westermark [8,9], so that a certain fraction of dry air can bypass the humidification process and is mixed with the rest of the humid air between the saturator and the recuperator inlet. The amount of air that bypasses the humidifier is represented by the parameter β , which represents the ratio of air flowing through the aftercooler and saturator to the inlet mass flow. Therefore, β = 1 when all the air goes through the aftercooler and saturator, whereas, for β = 0 , all of the air bypasses them.
In this study, an open loop is used to feed water in the heat exchangers, on the assumption that a water source is available. The evaporation process in the saturator and an efficient droplet eliminator at the gas outlet of the saturator acts as a water-treatment device per se, allowing the use of non-demineralized water without undermining the life of the components.
The thermal performance of the system is resolved using Turbomatch© [22,23], an in-house 0D performance software developed at Cranfield University, with external modules for the heat exchangers and saturator performance, and blade cooling mass flow requirements calculations. For the design point performance prediction, the power output is set constant at 40 MW with no mechanical losses considered. In terms of fuel, Marine Diesel chemical properties were used for combustion calculations [24]. With regards to turbomachinery performance, a 90% polytropic efficiency is assumed for the compressors and the core turbines, whereas 92% is assumed for the power turbine, to reflect the current technology levels of these components. The turbine inlet temperature (TIT) at the outlet of the main combustion chamber as well as at the outlet of the reheater was set constant at 1600 K. Turbine cooling flows are calculated using the methodology proposed by Young and Wilcock [25]. This method accounts for the cooling requirement of the disks, and the stationary and rotating blades when cooled with internal convection and film cooling technology. Typical values for maximum metal temperature ( T m , m a x = 1300 K), film cooling effectiveness ( ε f = 40%) and internal flow cooling efficiency ( η c = 70%) are used as discussed by Horlock et al. in [26]. Turbine cooling flows are extracted downstream of the high pressure compressor and upstream of the aftercooler.
The outlet conditions from all gas-water heat exchangers, namely the intercooler, the aftercooler and economizer, are resolved by imposing the effectiveness, which is viewed as the heat exchanger’s technology level, ( ε =   Q / Q m a x ) and the heat capacity ratio ( C * = C m i n / C m a x ) between the two streams, assuming that C w = C m a x .
Water condensation in the air stream is possible within the intercooler and aftercooler due to the high pressure and low temperature of the gas at the outlet of the heat exchangers ( T g ,   o u t < T g ,   d e w ). In the economizer, condensation may also occur due to high humidity levels in the exhaust gas of the recuperator and the low temperature required at the economizer’s exit. The latent heat of condensation of the water in the humid air varies the heat capacity of the gas C g during condensation and generates a pinch point between the two streams within the heat exchanger (Figure 2). Therefore, this process is considered when simulating the performance of the heat exchangers.
Liquid water is injected into the saturator to facilitate the humidification process. The temperature of the water at the outlet of the heat exchangers is, therefore, limited by the water saturation temperature. A safety coefficient of 0.9 is introduced into the performance calculations to avoid any steaming in the saturator as follows:
T w , o u t T w , m a x = T s a t ( 0 . 9 × p S A T ) ,
where T w , o u t is the water temperature at the outlet of the heat exchangers, T s a t is the saturation temperature and p S A T is the pressure in the saturator. When the water temperature at the outlet of the heat exchangers exceeds the limit temperature T w , m a x , a new value of C * is calculated, overwriting the imposed value. In the recuperator, the inlet properties of both streams are defined; therefore, the outlet conditions of the two streams are calculated from the prescribed recuperator effectiveness. Total pressure losses of the heat exchanger are fixed at a target value of 5% in both sides of all heat exchangers as recommended previously by Kavanagh et al. [14] and Nyberg et al. [16].
The conditions at the outlet of the saturator are calculated by imposing the pinch point temperature difference between the operating line of the water and the saturation line. The saturator is modelled according to the approach discussed by Sanchez de Leon [27] and originally developed by Aramayo-Prudencio [28]. The detailed description of the thermodynamic model of the saturator and its validation against experimental data is provided in Appendix A.
The impact of the key heat exchanger design parameters on the cycle thermal efficiency, plant weight and cost is assessed via a parametric study. The heat exchanger technology level is represented by their effectiveness. In terms of saturator design, the pinch temperature difference between the operating and the saturated air enthalpy lines [28] is used as a design parameter, as it represents the driver for the heat and mass transfer process within the saturator.
Cycle analysis has shown that the overall pressure ratio (OPR) that maximizes the thermal efficiency for the imposed TIT of 1600 K is beyond the technology today available for stationary or aero gas turbines (OPR > 50). Therefore, two values of OPR are investigated, namely 30 and 40, as representatives of a standard and an advanced compression system technologies currently available in the market.
The design envelopes of the above-mentioned variables are summarized in Table 1 and represent the range across which the parametric campaign was conducted for a total of 486 cycle designs.
For each of the 486 cycles calculated, the rest of the design variables (heat capacity ratio of the water-air heat exchangers, relative pressure ratio, and saturator bypass) are optimized to maximize the thermal efficiency. This optimization is performed by means of the single objective genetic algorithm in MATLAB® (R2016a, MathWorks, Natick, MA, USA) [29]. The upper and lower bounds of these variables are reflected in Table 2. Therefore, the thermodynamic “design vector” comprises the effectiveness of the heat exchangers, the OPR and the humidifier pinch point as the free design variables, and the heat capacity ratios of the water-air heat exchangers, the relative pressure ratio and the saturator bypass as the optimized design variables.
Detailed designs of the heat exchangers and the saturator tower are produced to estimate the weight and acquisition of these components. The geometries selected for the heat exchangers are: counter-current plate-fin for the intercooler and the aftercooler, multi-pass cross-flow plate-fin for the recuperator, and finned-tube for the economizer. Lastly, for the saturator, a structured packing-bed tower is selected. The models employed for the detailed design and optimization of these components and the correlations used to estimate the acquisition are summarized in Appendix B.

3. Results and Discussion

A number of cycles have been selected to describe the effect of the “design vector” on the performance, cost and size of the power plant. The heat exchanger “design vectors” of the selected cycles ( A G ) are shown in Table 3 and Figure 3. When referring to the cycles in the text, the overall pressure ratio is defined by the superscript L O P R and the pinch temperature difference in the saturator by the subscript L T p s .
The outcomes of the parametric cycle performance studies are analyzed using cycle A 5 40 as a reference, which represents the system with maximum thermal efficiency, maximum effectiveness of all heat exchangers, maximum OPR and minimum pinch temperature difference in the humidifier. The design vector of the baseline cycle as well as its performance metrics are shown in Table 4. All values in subsequent plots are normalized against the cycle with maximum thermal efficiency A 5 40 .

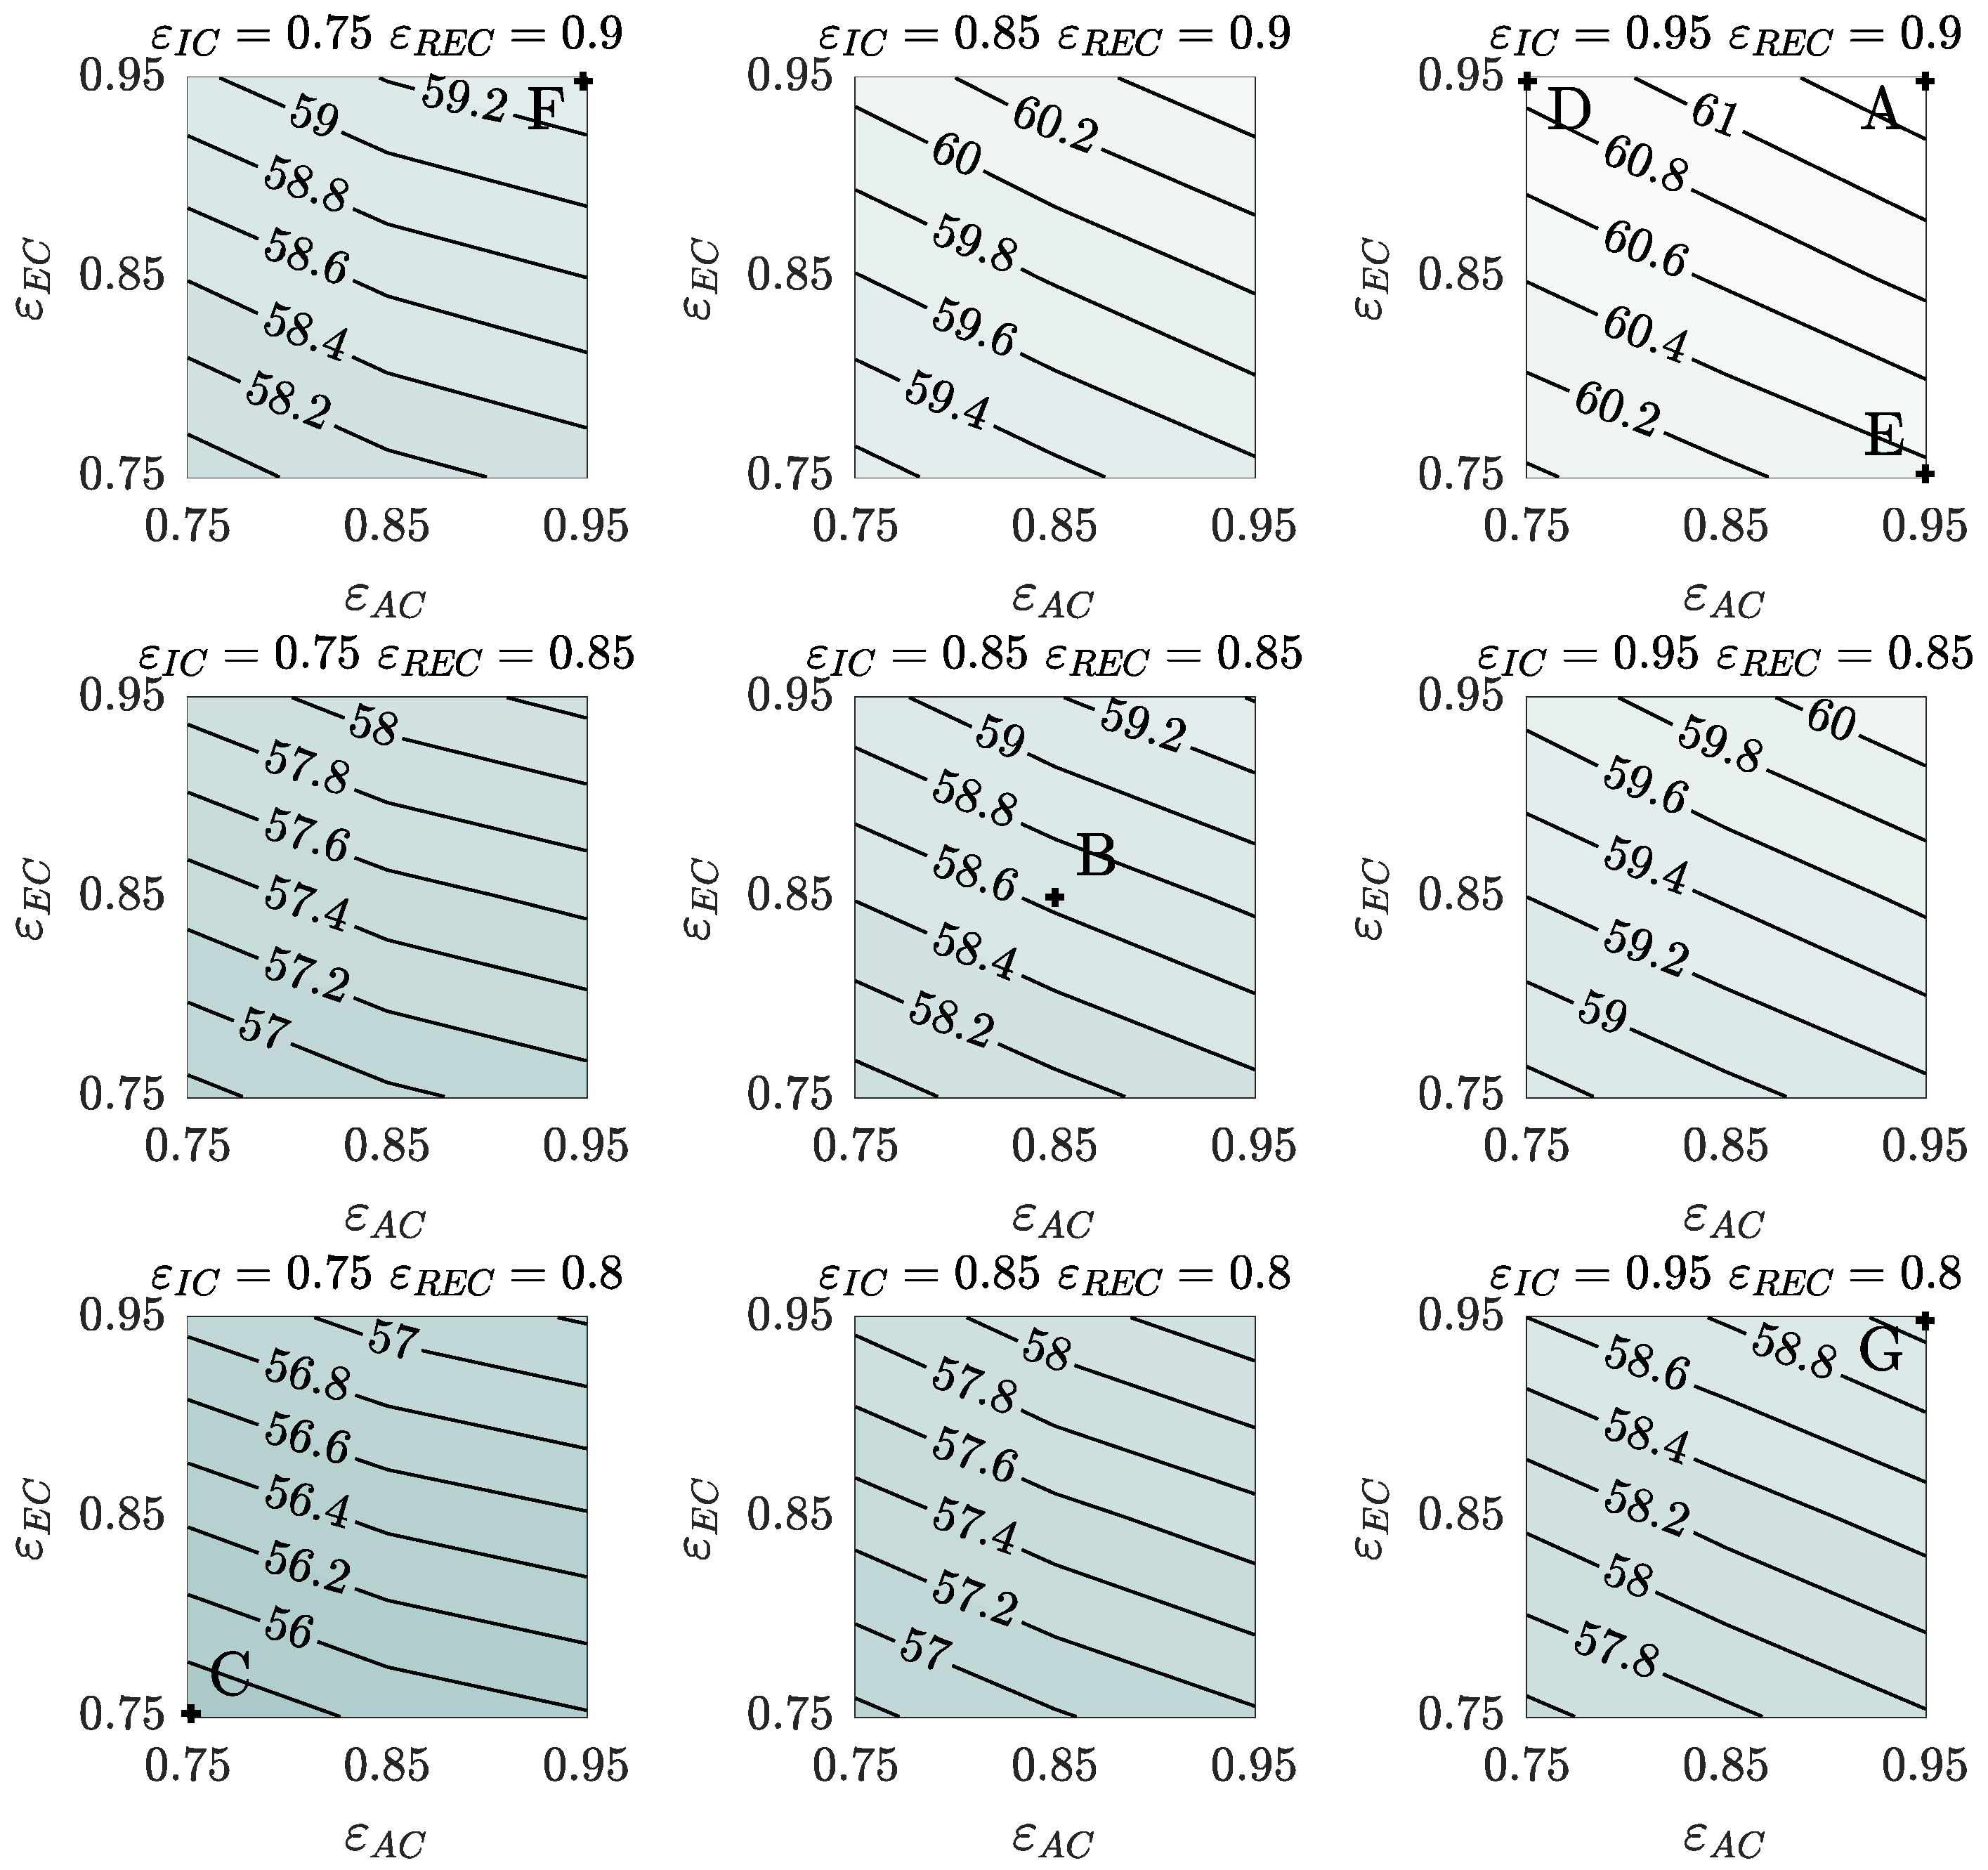
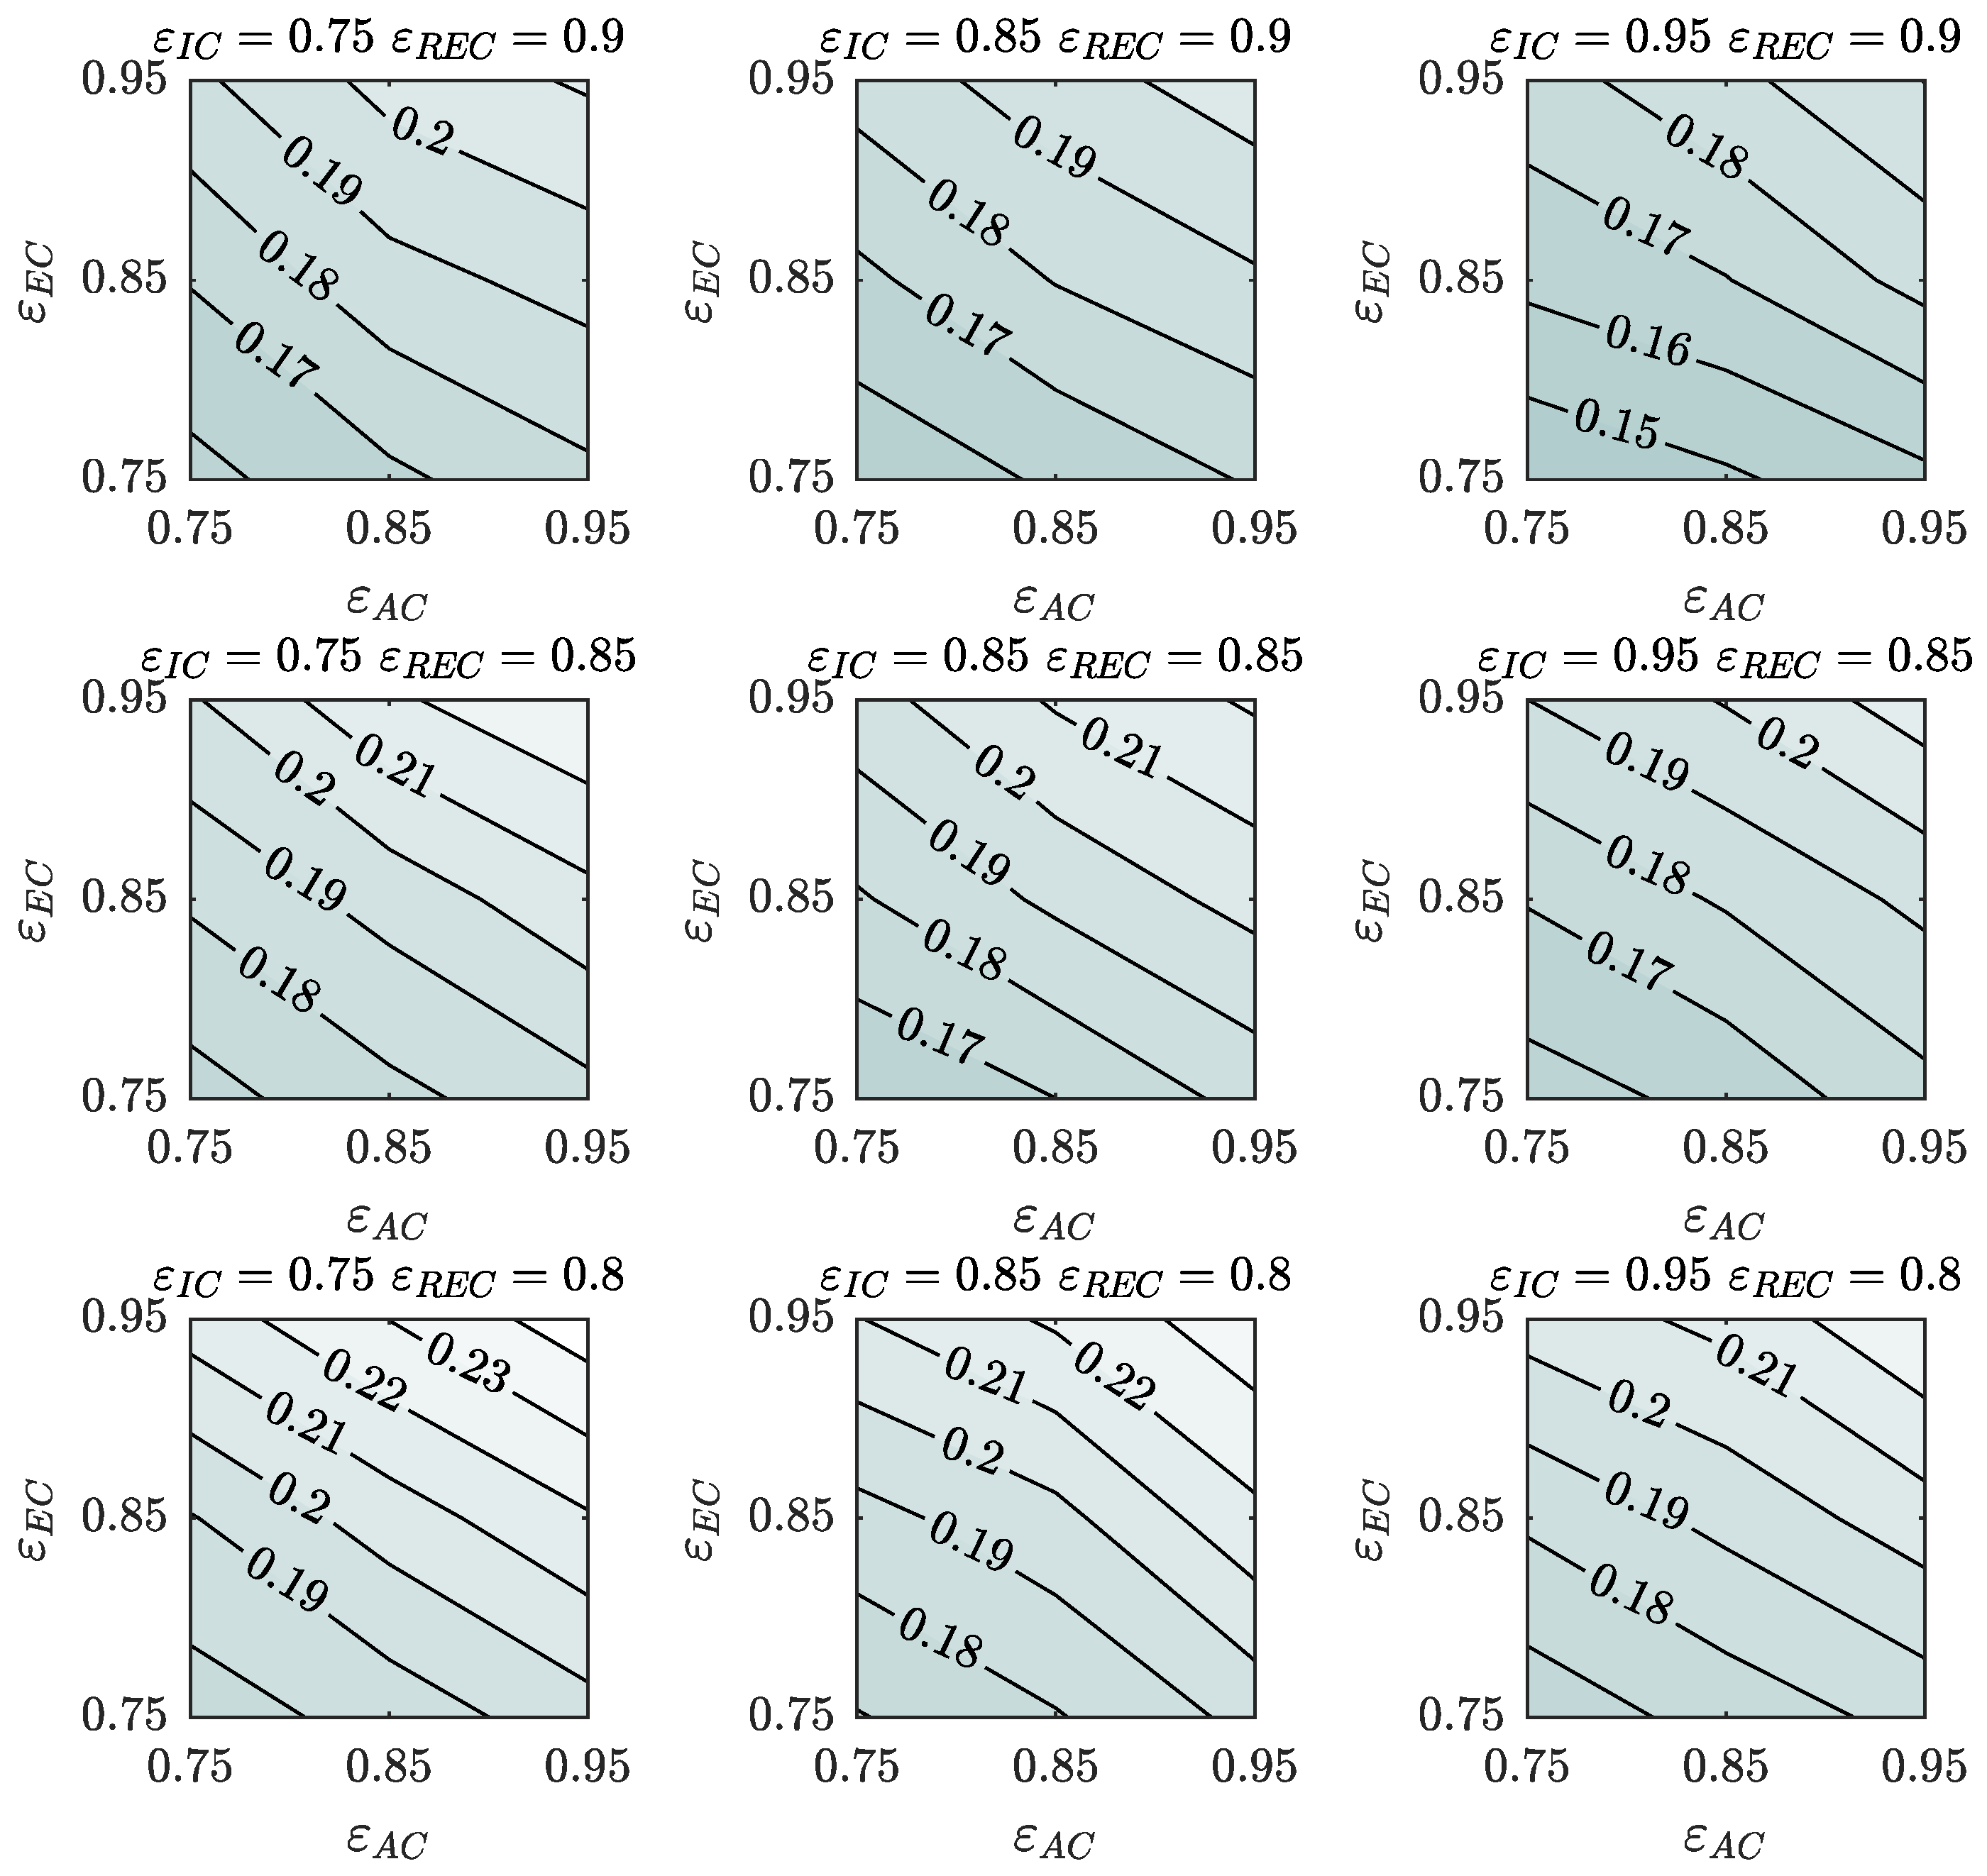
3.1. Impact of Heat Exchanger Effectiveness on Cycle Performance

The impact of heat exchanger effectiveness on the cycle thermal efficiency is shown in Figure 3, for constant OPR of 40 and pinch temperature difference in the saturator of 5 K. The x-axis and y-axis of the contour plots are, respectively, the aftercooler and economizer effectiveness, and the contour lines show the estimated cycle thermal efficiency. Moving vertically and horizontally through the contour plots, the effectiveness of the recuperator and intercooler vary respectively. Therefore, the top-right point of the top-right contour corresponds to the cycle A 5 40 shown in Table 4.
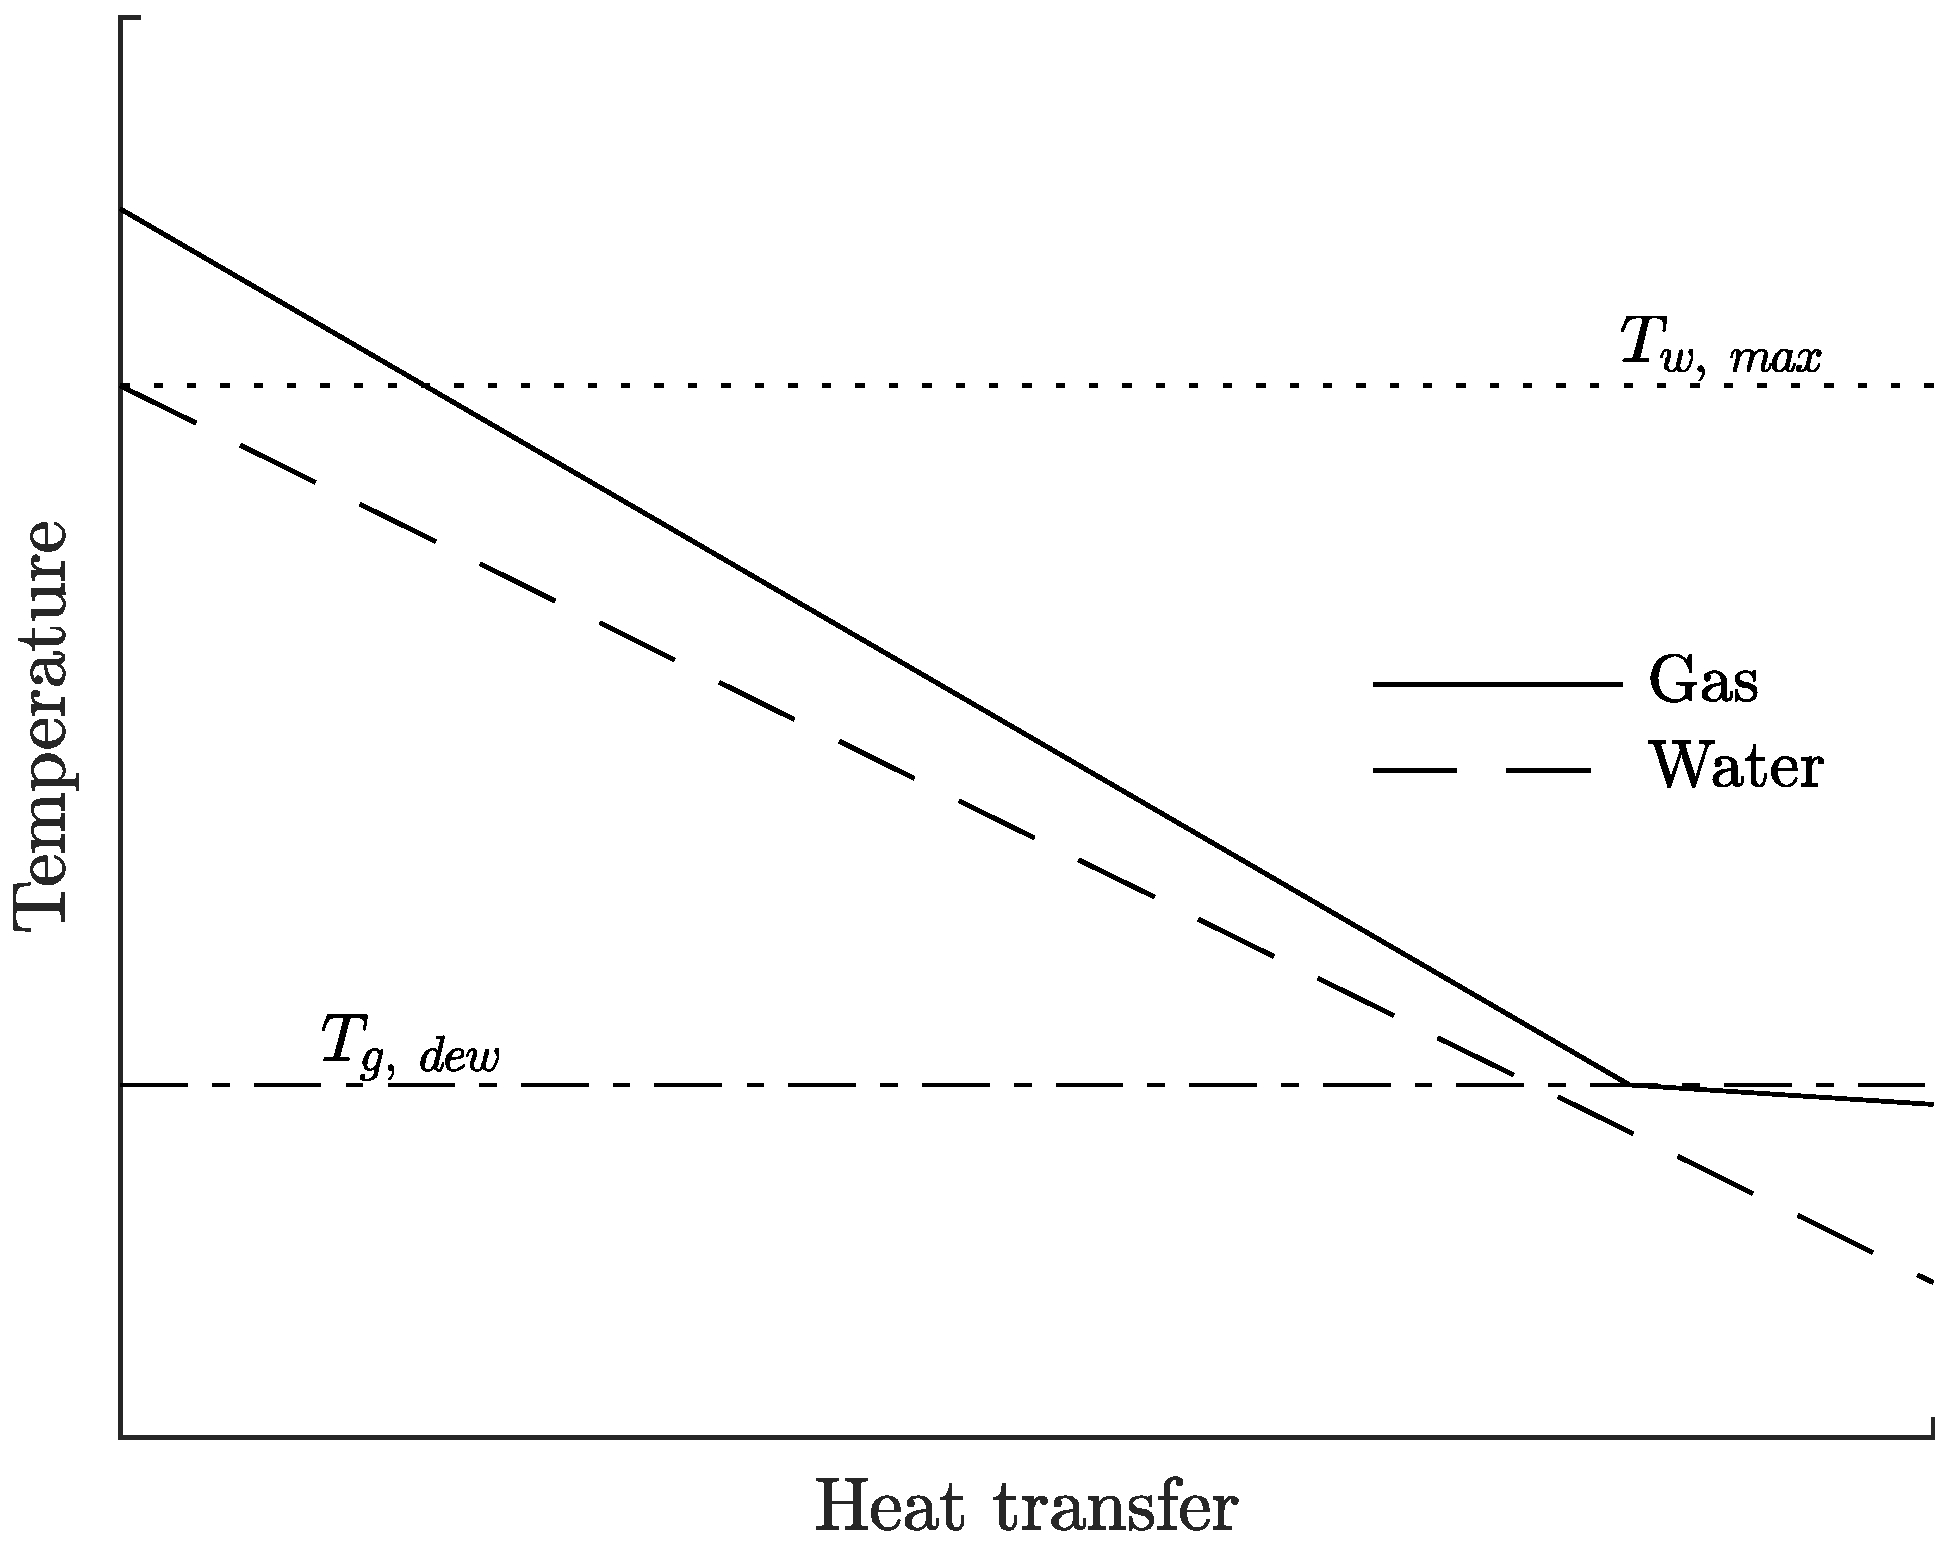
In all contours with intercooler effectiveness of 0.75 (left column of contours in Figure 3), there is a change in in the variation rate of the thermal efficiency when the ε A C falls below 0.85. This is due to the notably high value of aftercooler heat capacity ratio C A C * = 0.95 for aftercooler effectiveness of 0.95 and 0.85, which it decreases to C A C * = 0.64 when the effectiveness of the aftercooler is 0.75, in order for the outlet water temperature to remain within the limits imposed to avoid steaming in the saturator ( T w , o u t = T s a t ( 0 . 9 × p S A T ) ).
The dependency between the thermal efficiency and the heat exchanger effectiveness remains linear when changing the effectiveness of all heat exchangers together. The comparison between cycles A 5 40 and G 5 40 highlights the impact of the recuperator effectiveness and results in a reduction of 2.28 pp in cycle thermal efficiency when recuperator effectiveness becomes 0.8 from 0.9. The impact of intercooler effectiveness is shown by comparing cycle A 5 40 against F 5 40 . A reduction in ε I C from 0.95 to 0.75 causes a reduction of 2 pp in the cycle thermal efficiency. The impact of the aftercooler and economizer is shown by the comparison of the cycle A 5 40 with the cycle D 5 40 , and of A 5 40 with the cycle E 5 40 , with, respectively, a reduction of 0.48 pp and 1 pp on the thermal efficiency. The combined effect of the reduction in effectiveness of all the heat exchangers is shown by the comparison of the cycle A 5 40 with the cycle B 5 40 and C 5 40 with, respectively, a drop of 2.7 pp and 5.5 pp in thermal efficiency.
Figure 4 shows the effect of the heat exchanger effectiveness on the absolute humidity at the inlet of the combustion chamber for constant values of OPR (40) and saturator pinch temperature difference (5 K). The maximum absolute humidity in the design space is 24.6%, which ensures stable combustion in a modern combustion chamber as discussed by Göke in [30].
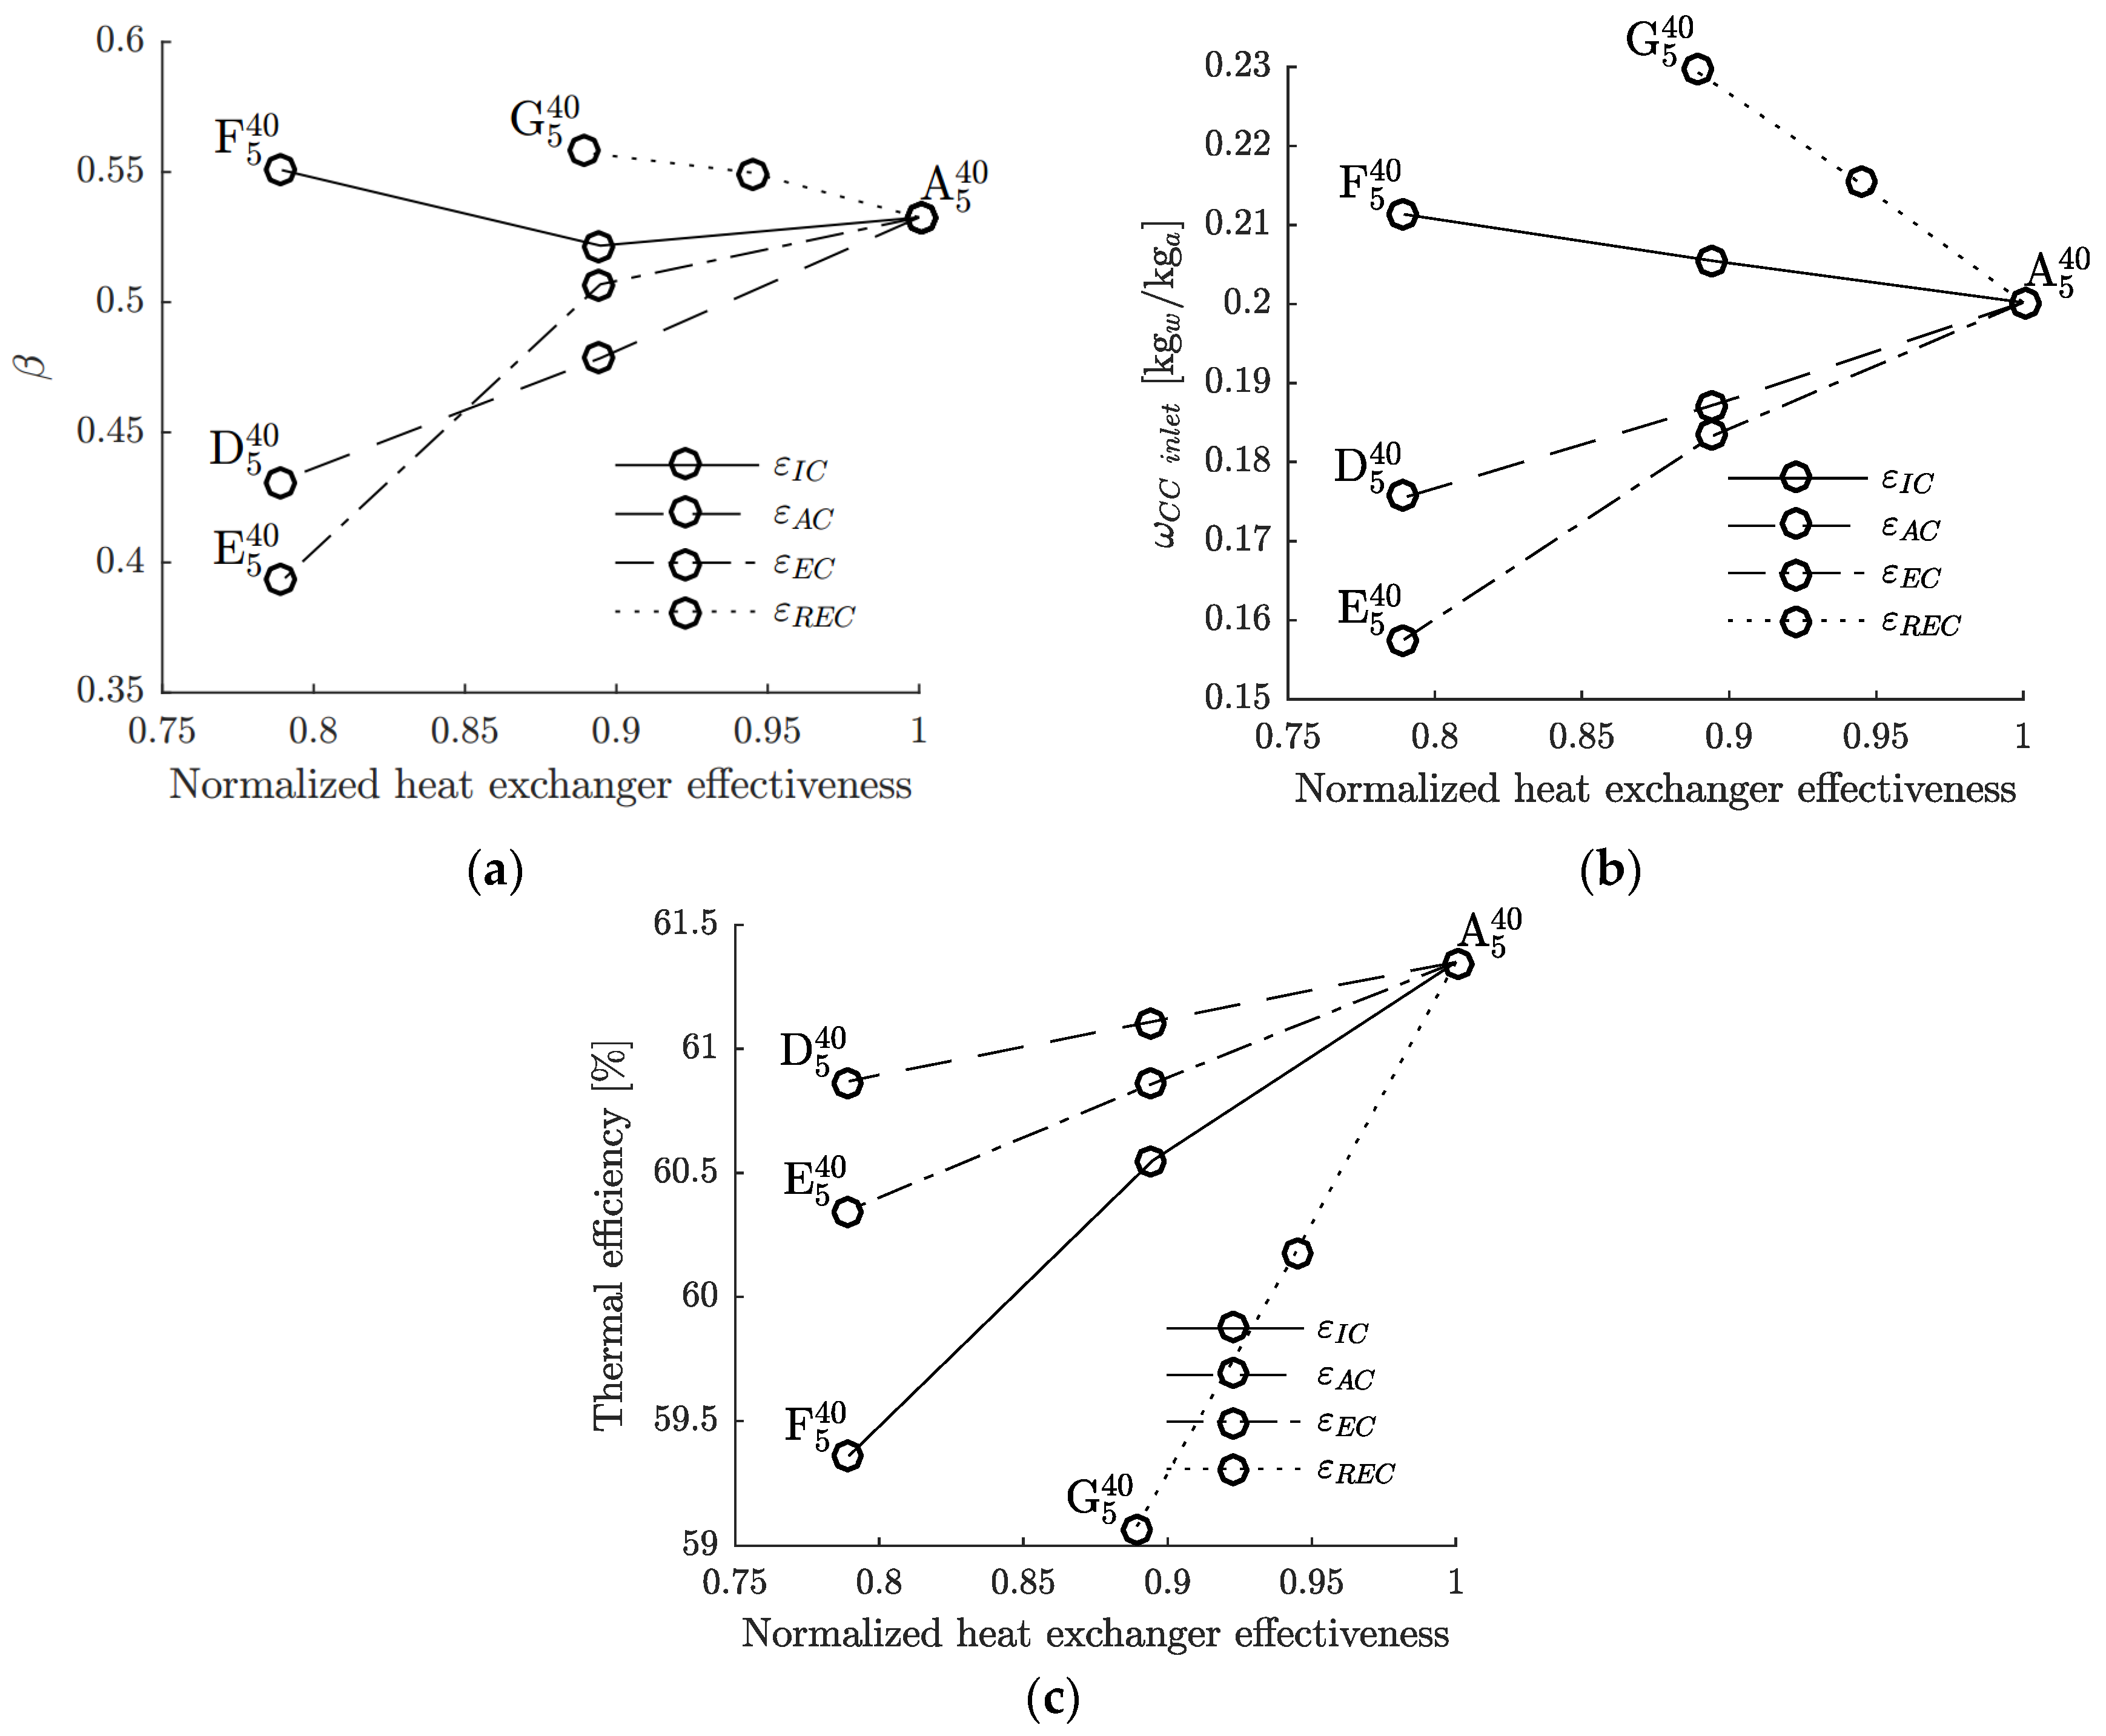
The impact of heat exchanger effectiveness on the optimized saturator bypass ratio, on the consequent absolute humidity (ω) at the inlet of the combustion chamber and on cycle thermal efficiency is illustrated in Figure 5 for constant OPR = 40 and T p s = 5 K.
The reduction in effectiveness of the aftercooler and economizer has an impact on the amount of heat and mass transfer that occurs in the saturator and, therefore, on the thermal efficiency of the cycle. For an aftercooler effectiveness of 0.75 ( A 5 40 D 5 40 —see Figure 5), the water mass flow in the saturator is reduced by 0.5% while a 1.2% reduction is observed in its temperature ( C A C * = 0 . 95 across the range). The temperature of the gas at the inlet of the saturator increases by 13.8%, reducing the temperature leap in the saturator and, therefore, the heat and mass transfer that occurs within the device. Hence, the fraction of gas that bypasses the saturator ( β ) decreases by 19% (Figure 5a) and the humidity at the inlet of the combustion chamber also decreases from 20% to 18% (Figure 5b). The reduction in heat recuperated at low temperature in the cycle, due to the aftercooler, affects the thermal efficiency of the cycle, with a 0.48 pp reduction between cycles A 5 40 and D 5 40 (Figure 5c).
When the economizer effectiveness reduces from 0.95 to 0.75 ( A 5 40 E 5 40 —see Figure 5), the mass flow of the water heated in the heat exchanger falls by 22%, whereas the water outlet temperature falls only by 0.3%—i.e., C E C * increases. As for the aftercooler, the saturator bypass β decreases by 26% as shown in (Figure 5a) and the humidity at the inlet of the combustion chamber decreases from 20% to 15.7% (Figure 5b). This reduction in heat recuperated in the cycle at low temperature, as for the aftercooler, entails a decrease in thermal efficiency of 1 pp between cycles A 5 40 and E 5 40 (Figure 5c).
The effectiveness of the intercooler affects the amount of waste heat that is recuperated both at high and low temperatures within the cycle. When ε I C becomes 0.75 from 0.95 ( A 5 40 F 5 40 —see Figure 5), the total amount of water injected in the saturator increases by 10% due to the increase of heat available in the gas at the inlet of the economizer—i.e., the temperature at the outlet of the recuperator on the hot side increases due to the increase in temperature of the gas at the inlet of the cold side. Therefore, the mass flow ratio of gas that bypasses the saturator decreases by 2% (Figure 5a) and the humidity at the inlet of the combustion chamber increases by 5% (Figure 5b). This highlights the importance of the intercooling process, since it not only reduces the compression work required but also the heat extracted from the gas between the two compressors is partly recovered in the saturator and not rejected entirely as in most common intercooled gas turbines. Thus, the reduction of the effectiveness of the intercooler from 0.95 to 0.75 entails a reduction of 2 pp in the cycle thermal efficiency ( A 5 40 F 5 40 —see Figure 5c).
The recuperator is the heat exchanger whose effectiveness change has the most severe effects on the thermal efficiency of the cycle, with a reduction of 2.28 pp in thermal efficiency when it is reduced to 0.8 from 0.9 ( A 5 40 G 5 40 —see Figure 5), due to the reduction of high quality heat recovery—i.e., heat recovery at high temperature—within the cycle. Nevertheless, this reduction in recuperator effectiveness results in higher enthalpy gas at the inlet of the economizer and entails 22% higher amount of heat transfer in the latter heat exchanger. Therefore, the water mass flow injected into the saturator increases by 10%, the mass flow ratio of gas that bypasses the saturator decreases—i.e., β   increases by 4.7% as shown in Figure 5a—and the humidity at the inlet of the combustion chamber increases from 20% to 23% (Figure 5b).
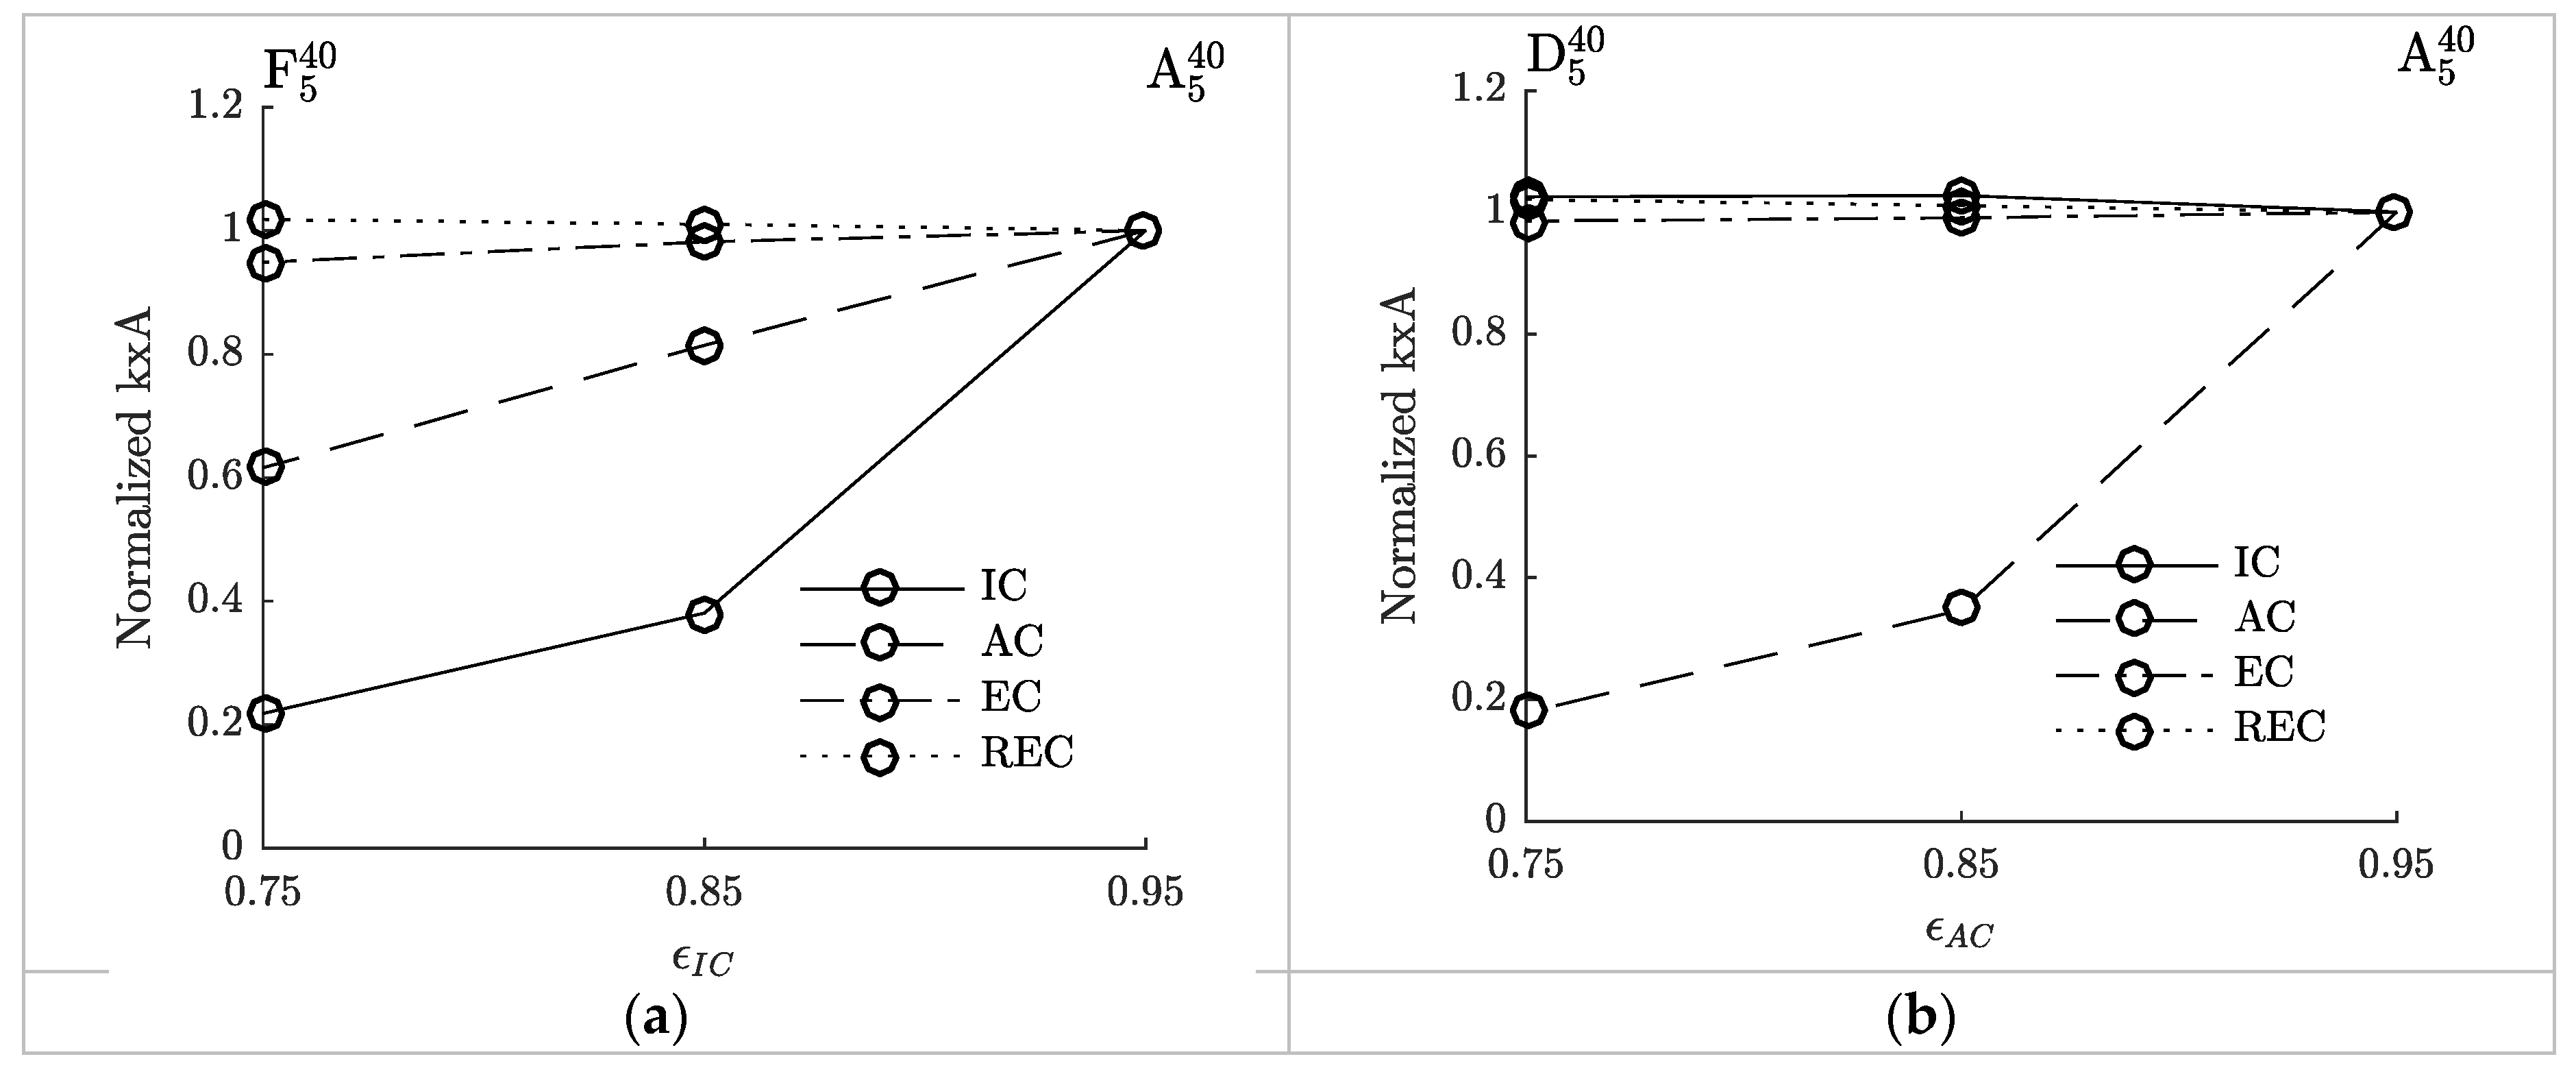
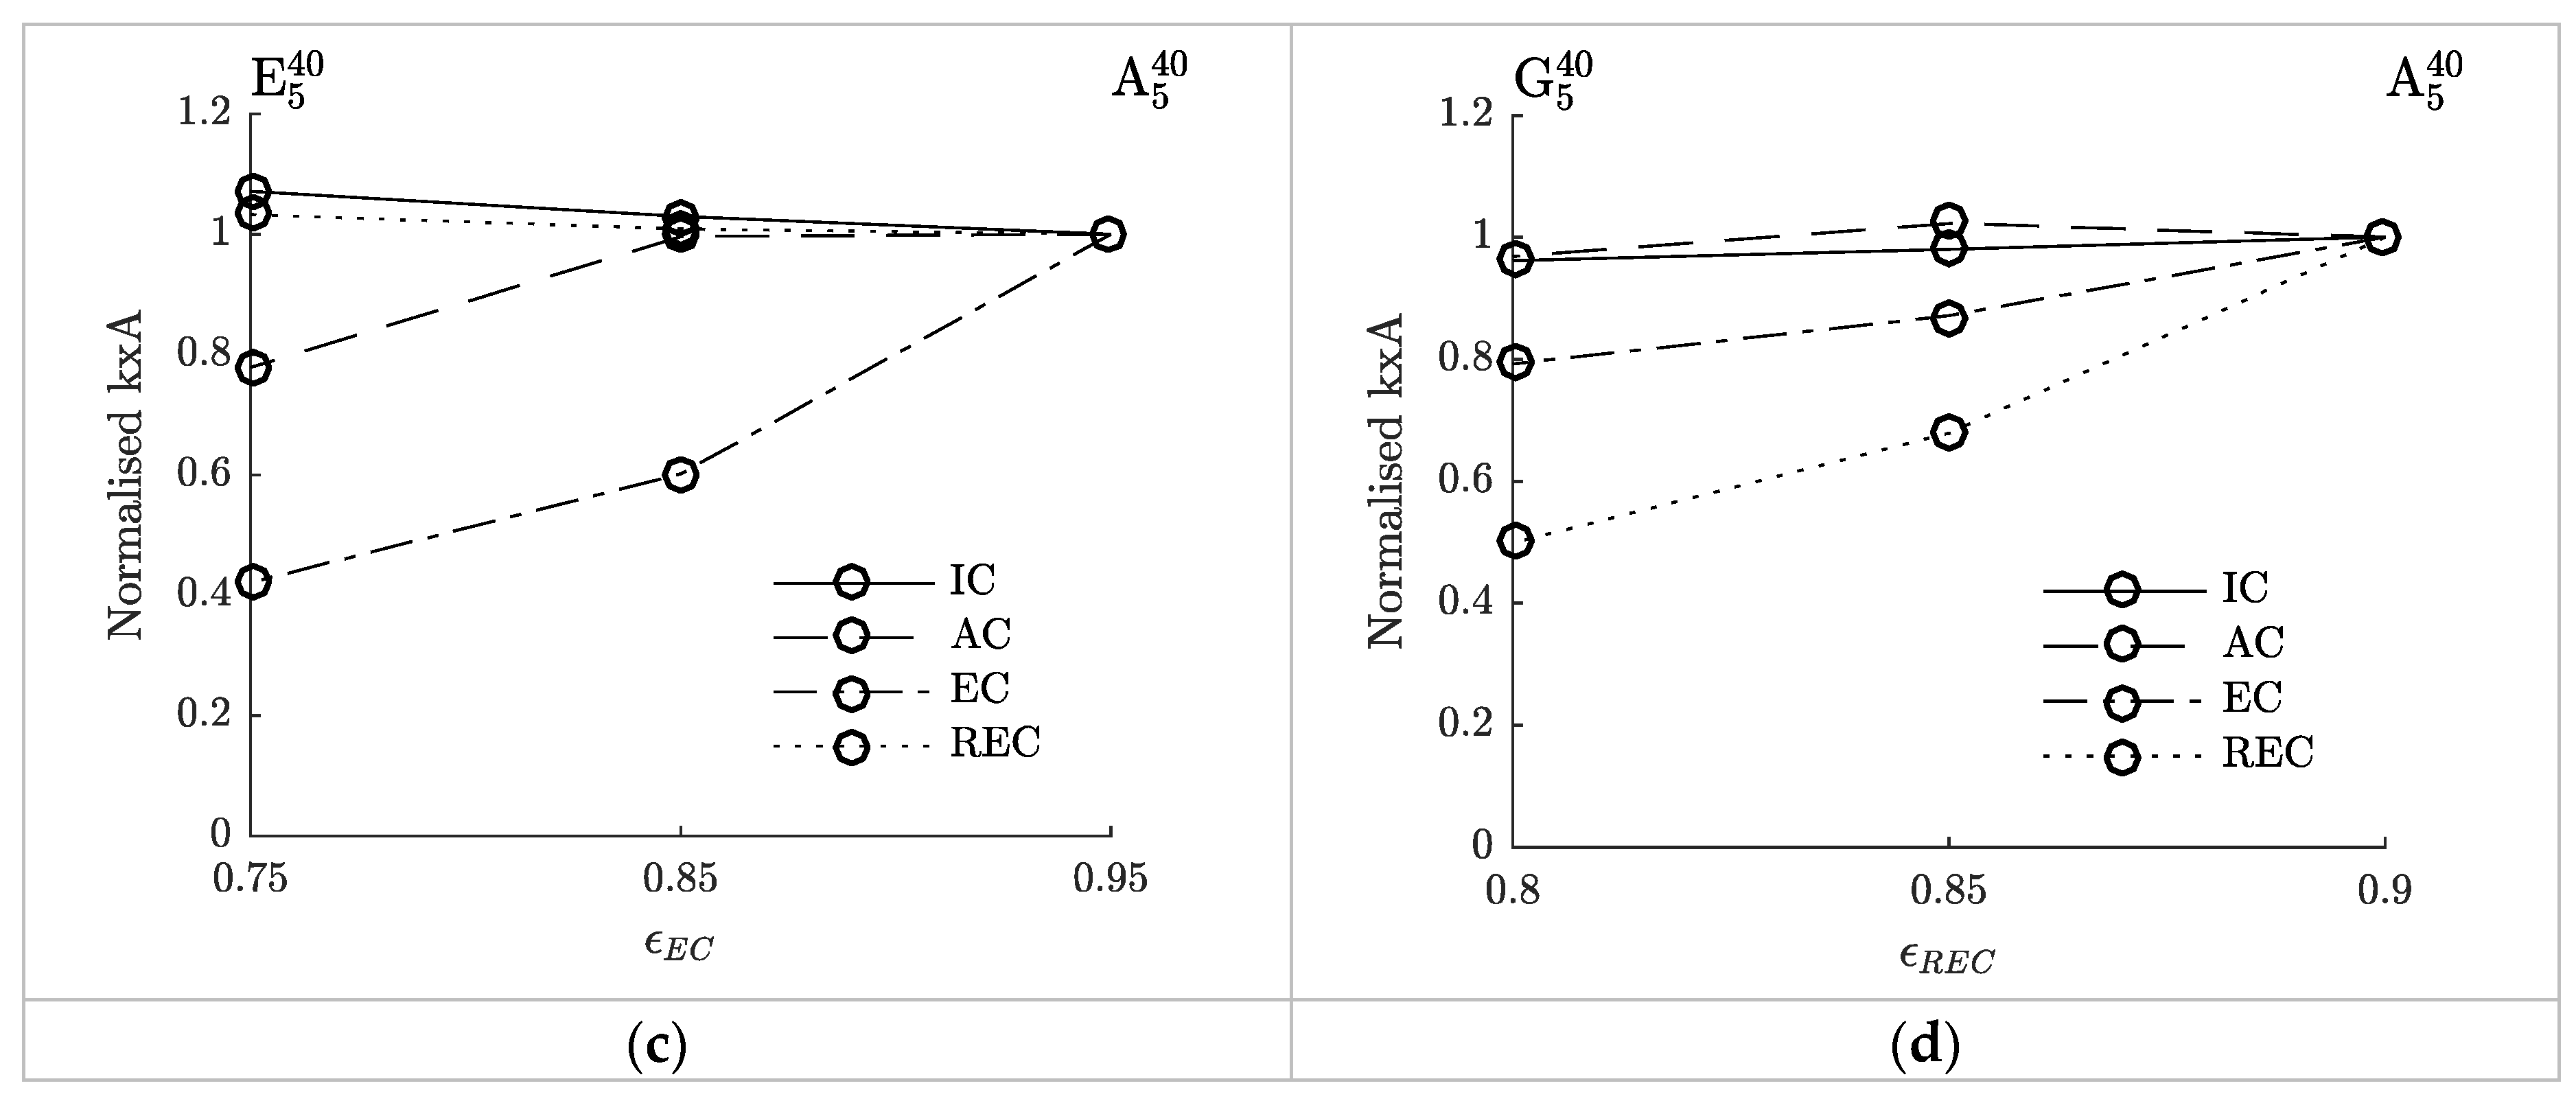
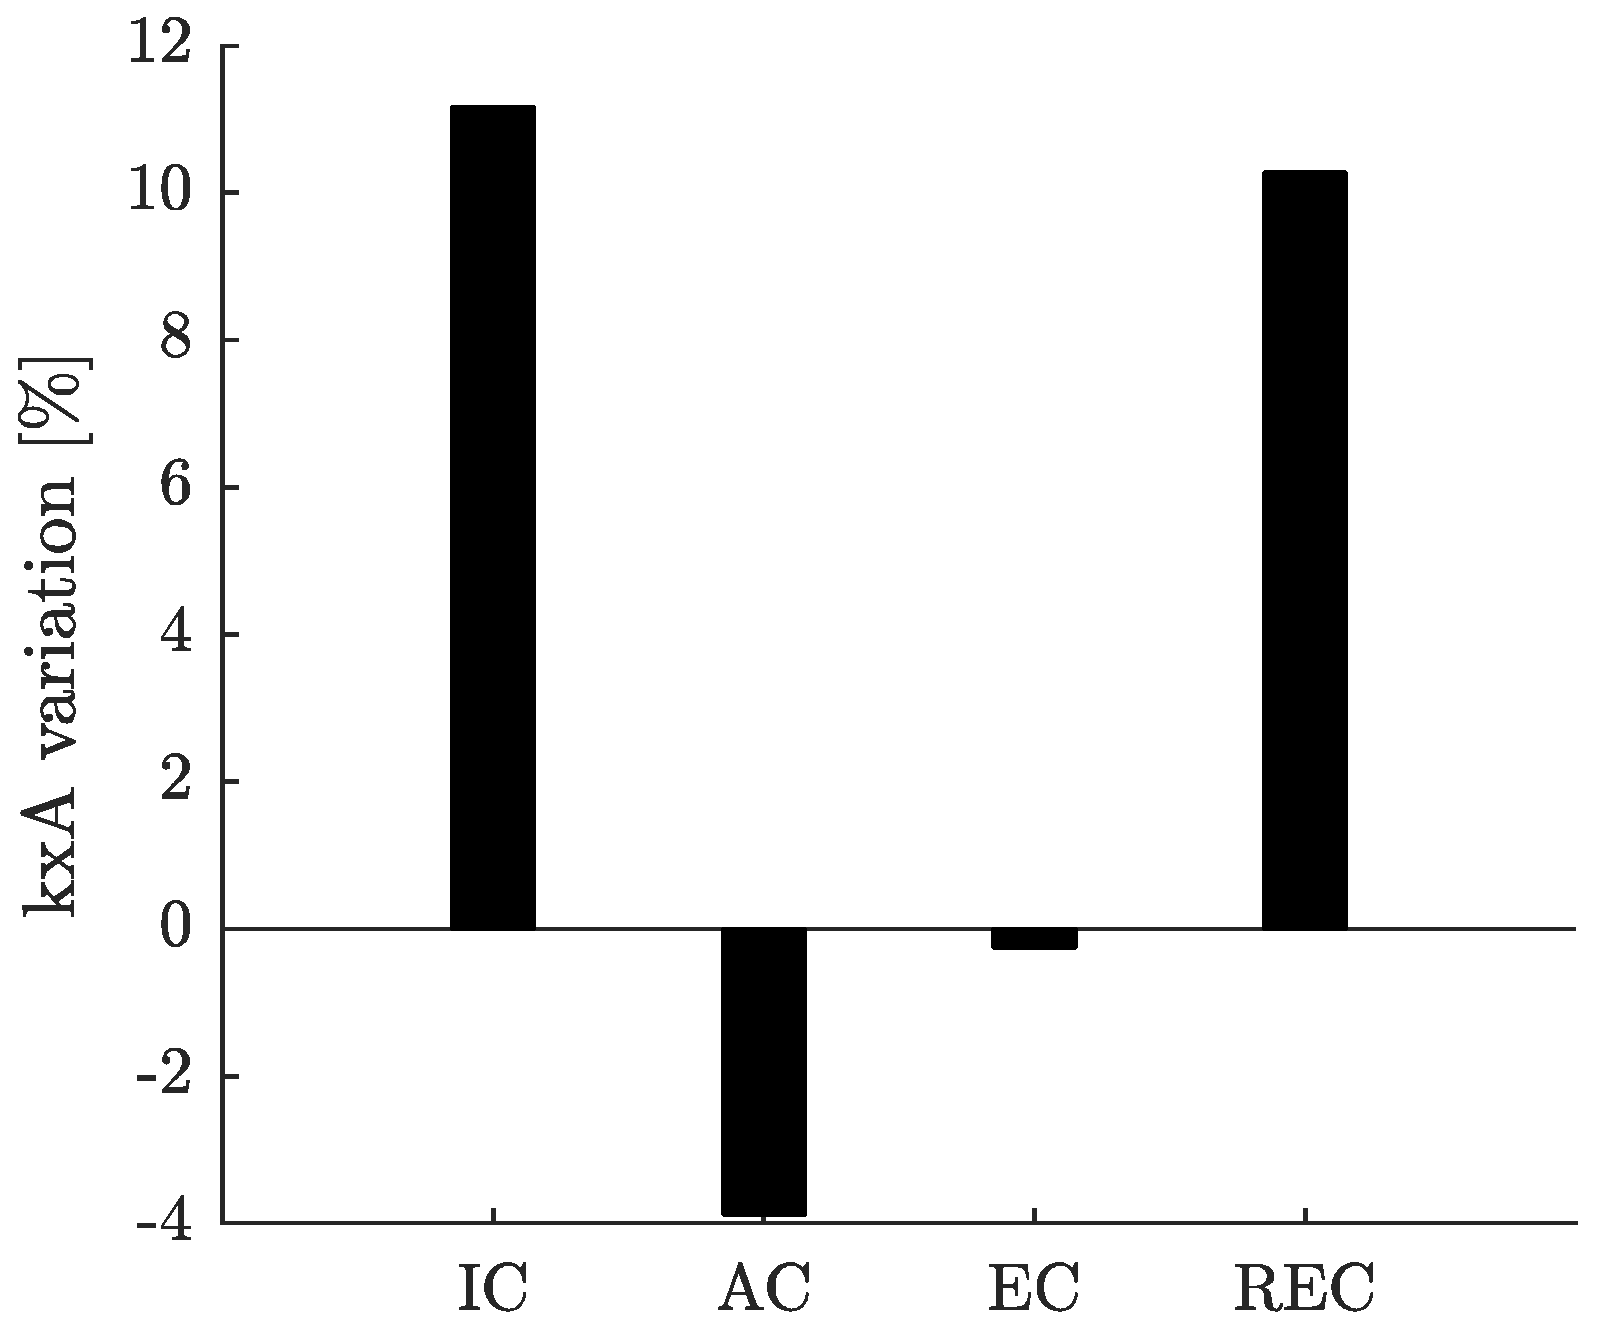
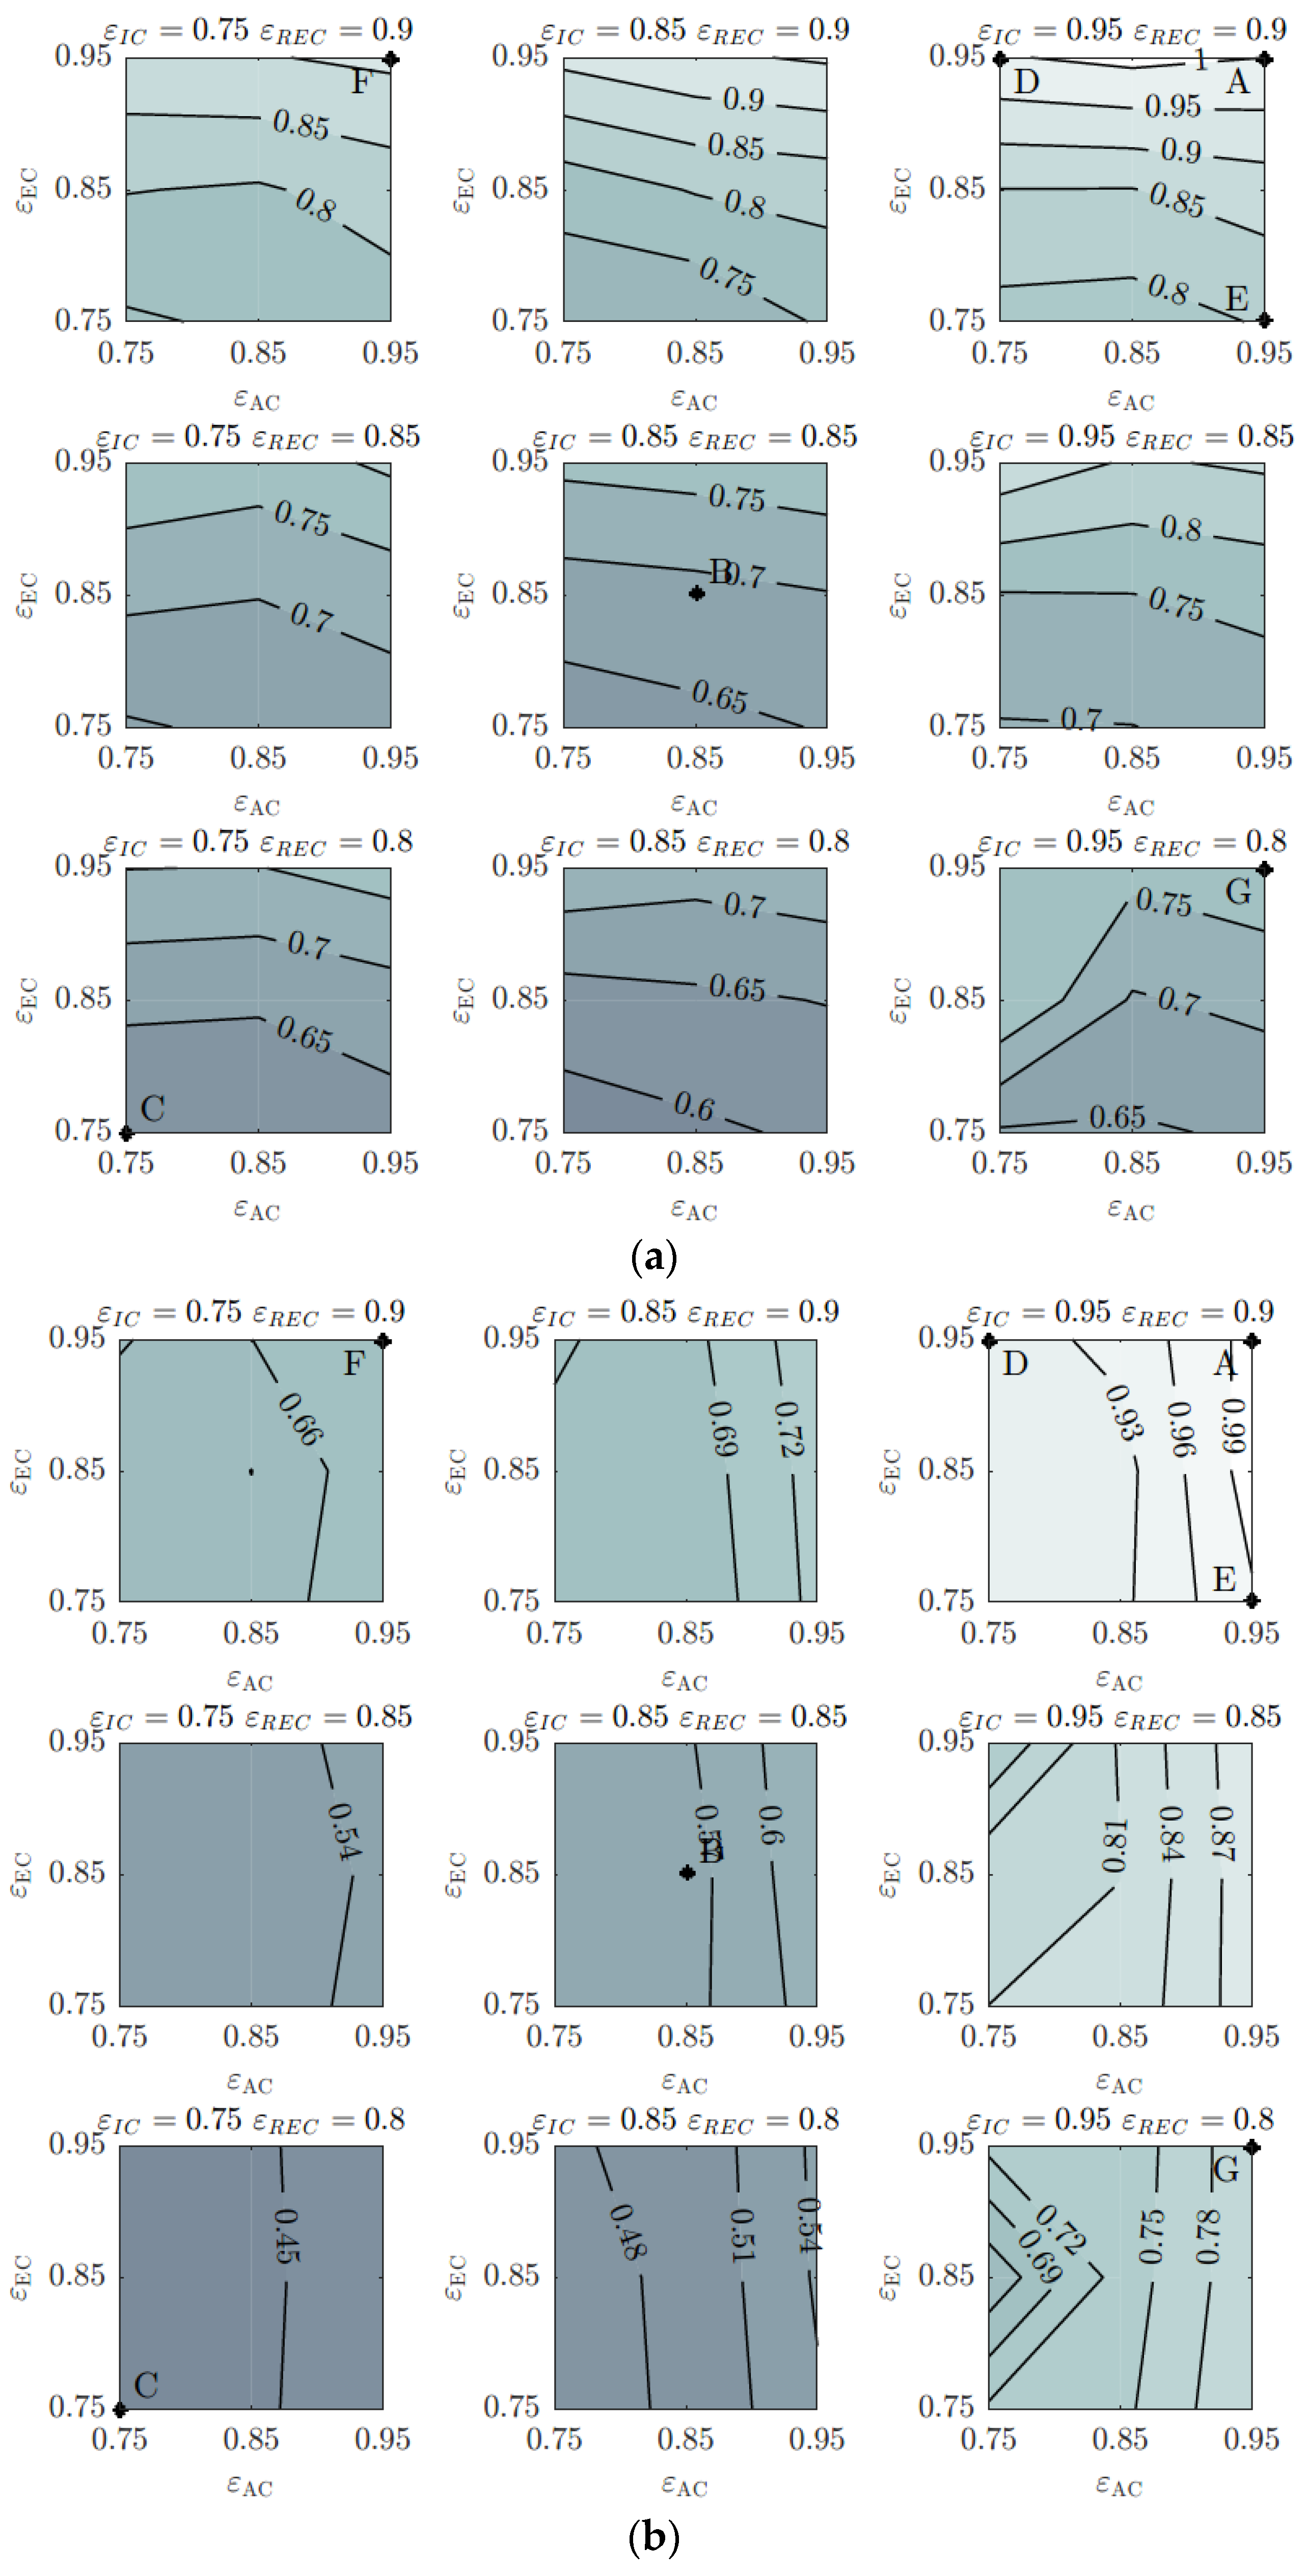
Figure 6 shows the impact of the heat exchanger effectiveness on the heat transfer coefficient times the heat transfer area (k × A) of each heat exchanger for constant OPR (40) and saturator pinch temperature difference (5 K). For similar inlet conditions, the variation in k × A of a heat exchanger is a useful parameter to evaluate the impact of the of the cycle “design vector” on the variation in size independently from the design choices in sizing the heat exchanger. Nonetheless, k × A should not be used to evaluate the differences in size between intercooler, aftercooler, economizer and recuperator due to the different inlet conditions of the two flows—i.e., different heat transfer coefficients. The values of k × A for each heat exchanger are normalized using the values of the reference cycle A 5 40 which is reported in Table 5.
The heat exchangers that are mostly affected by the reduction in effectiveness are the intercooler and aftercooler, with a reduction of k × A respectively of 79% ( A 5 40 F 5 40 —see Figure 6a) and of 82% ( A 5 40 E 5 40 —see Figure 6b) in relative terms when reducing the effectiveness of the latter from 0.95 to 0.75.
The variation of effectiveness of a heat exchanger, however, has a knock-on effect on the k × A of the remaining heat exchangers. The aftercooler k × A is strongly affected by the variation of the intercooler and economizer effectiveness with a 38.5% and 22% reduction when reducing ε I C and ε E C become 0.75 from 0.95 ( A 5 40 F 5 40 in Figure 6a and A 5 40 D 5 40 Figure 6c). In addition, the k × A of the economizer is strongly affected by the variation of the effectiveness of the recuperator ( A 5 40 G 5 40 ) with a reduction of 21%. No knock-on effect on the recuperator and intercooler k × A was found by effectiveness changes of the rest of the heat exchangers.
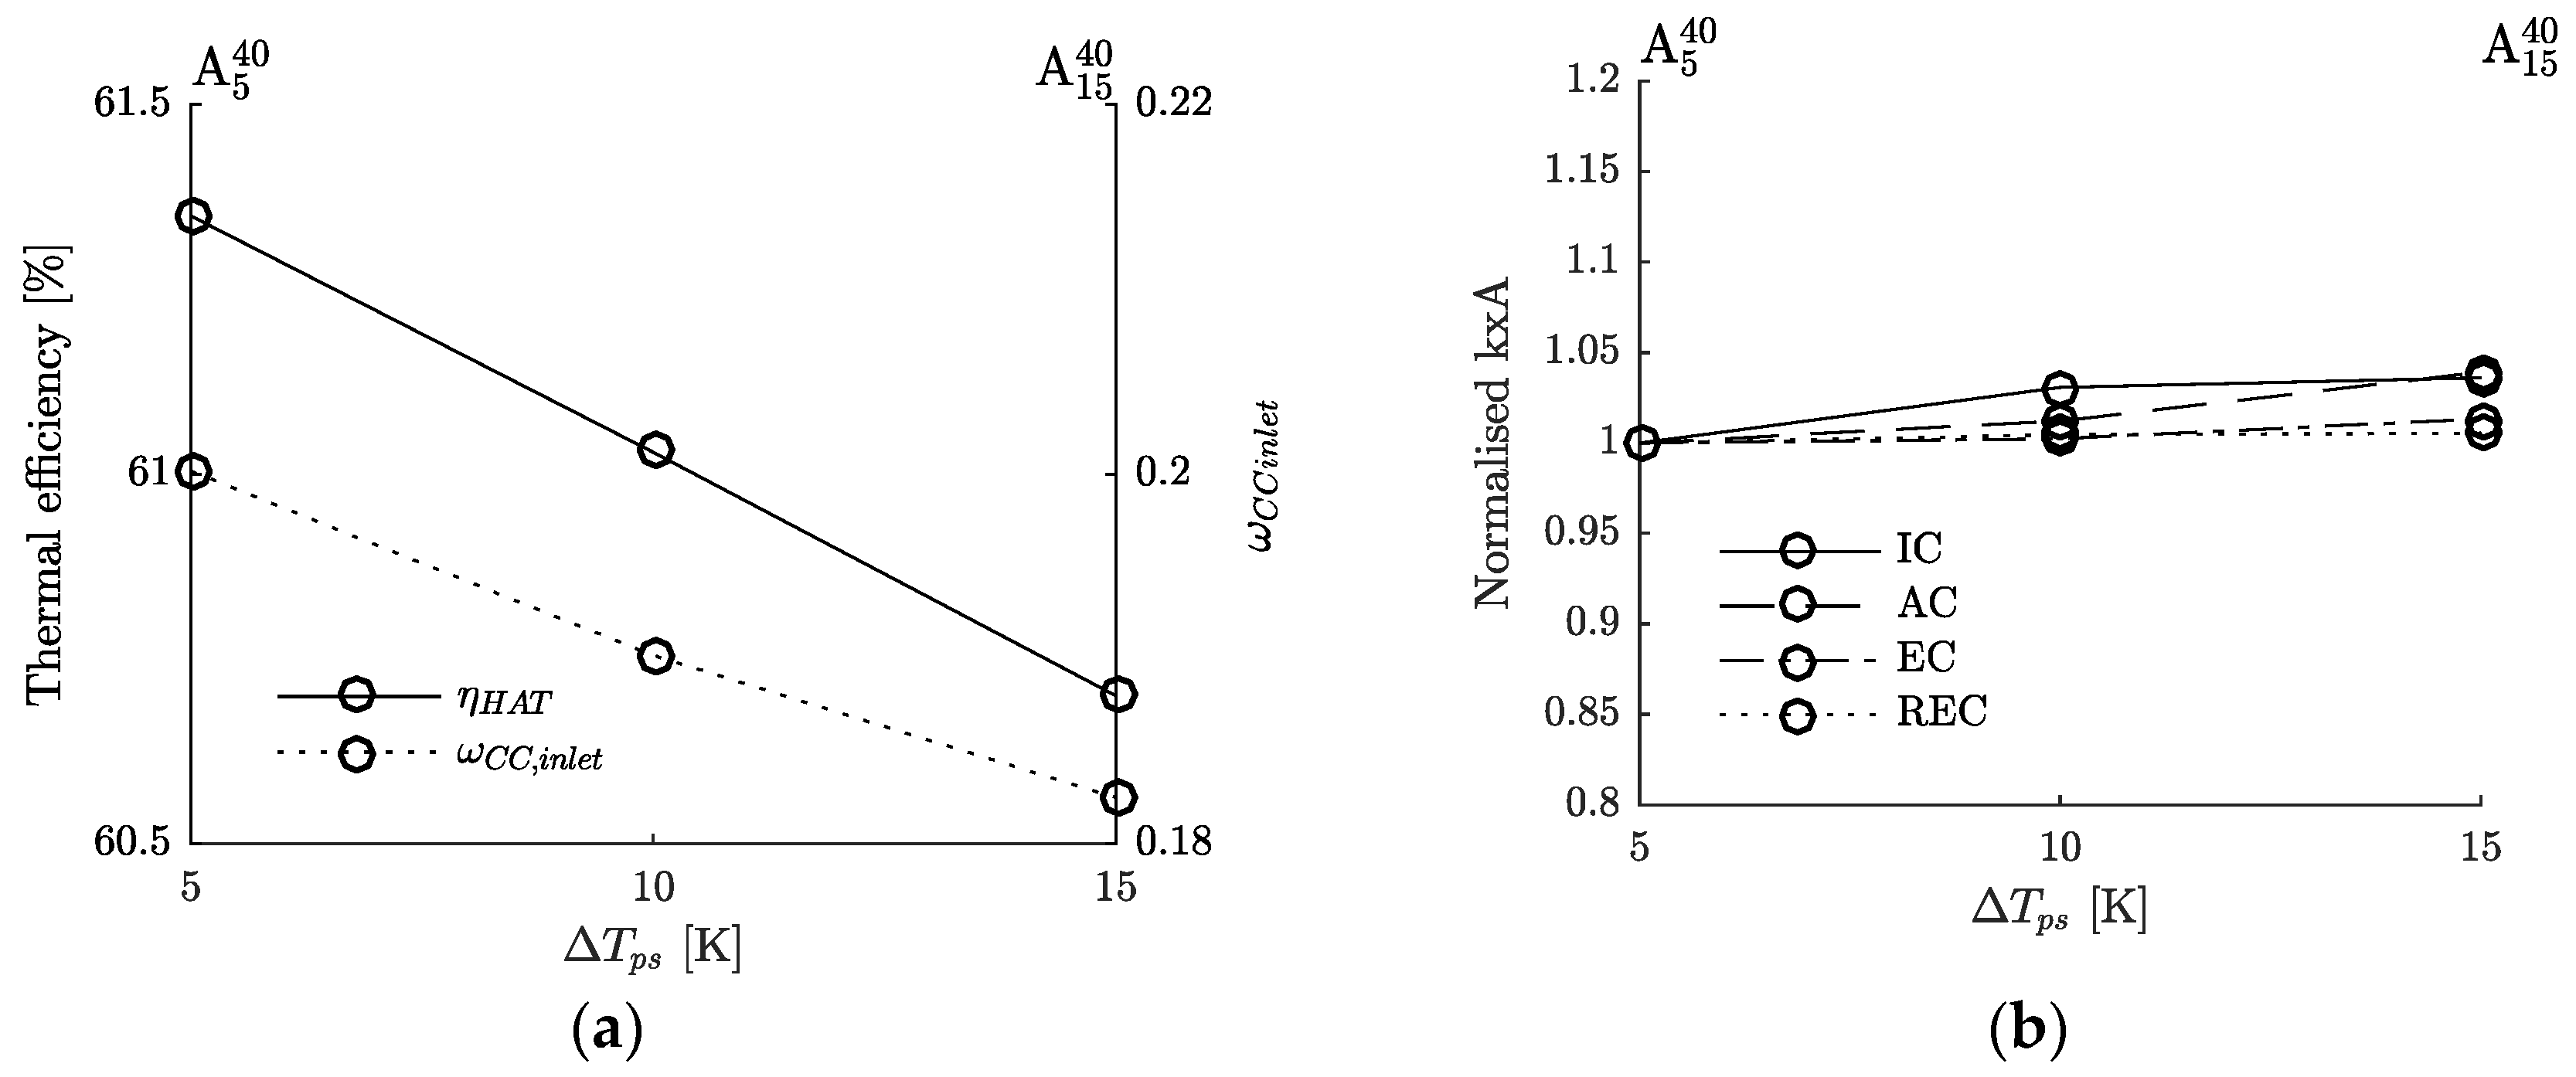
The increase of the saturator pinch temperature difference T p s from 5 K to 15 K ( A 5 40 A 15 40 ) has a linear effect on the thermal efficiency and on the absolute humidity of the air at the inlet of the combustion chamber (Figure 7a), with a reduction in thermal efficiency of 0.64 pp from the baseline cycle. The k × A of all heat exchangers are not significantly affected by the pinch temperature difference in the saturator (Figure 7b) with a maximum increase of 4% in intercooler k × A for T p s = 15 K. The increases in k × A (cycle A 5 40 A 15 40 ) are attributed to the 3.2% higher gas mass flow requirement to produce the prescribed power output of 40 MW triggered by the lower water content in the hot section of the power plant.

3.2. Impact of Overall Pressure Ratio

The parametric design point performance analysis was conducted at an OPR of 30 that represents a typical technology level for current power generation applications. An optimum cycle configuration with thermal efficiency of 60.7% is achieved when reducing the overall pressure ratio from 40 to 30 ( A 5 40 A 5 30 )—i.e., a reduction of 0.7 pp with regards to the baseline cycle with OPR = 40. The inlet gas mass flow to deliver the prescribed power output of 40 MW increases by 9.8%. This is achieved with the maximum specified effectiveness of all heat exchanger and minimum pinch temperature difference in the humidifier as shown in Table 6. The humidity levels at the inlet of the main burner is reduced by 10.2% while saturator bypass β increases by 4 pp when reducing the overall pressure ratio from 40 to 30. This is attributed to the lower water temperature at the outlet of the intercooler, aftercooler, economizer and the reduction in temperature of the gas at the outlet of the high pressure compressor.
Although the reduction in overall pressure ratio implies cheaper and more compact turbomachinery, the decrease in specific power results in a 11.2% and 10.3% increase in k × A (Figure 8) of the intercooler and recuperator, respectively, whereas the aftercooler and economizer k × A decrease by approximately 4%. This yields more expensive designs of the intercooler and recuperator with an increase in acquisition cost index of, respectively, 25.6% and 7% (Figure 9).

3.3. Heat Exchanger Size and Cost Analysis

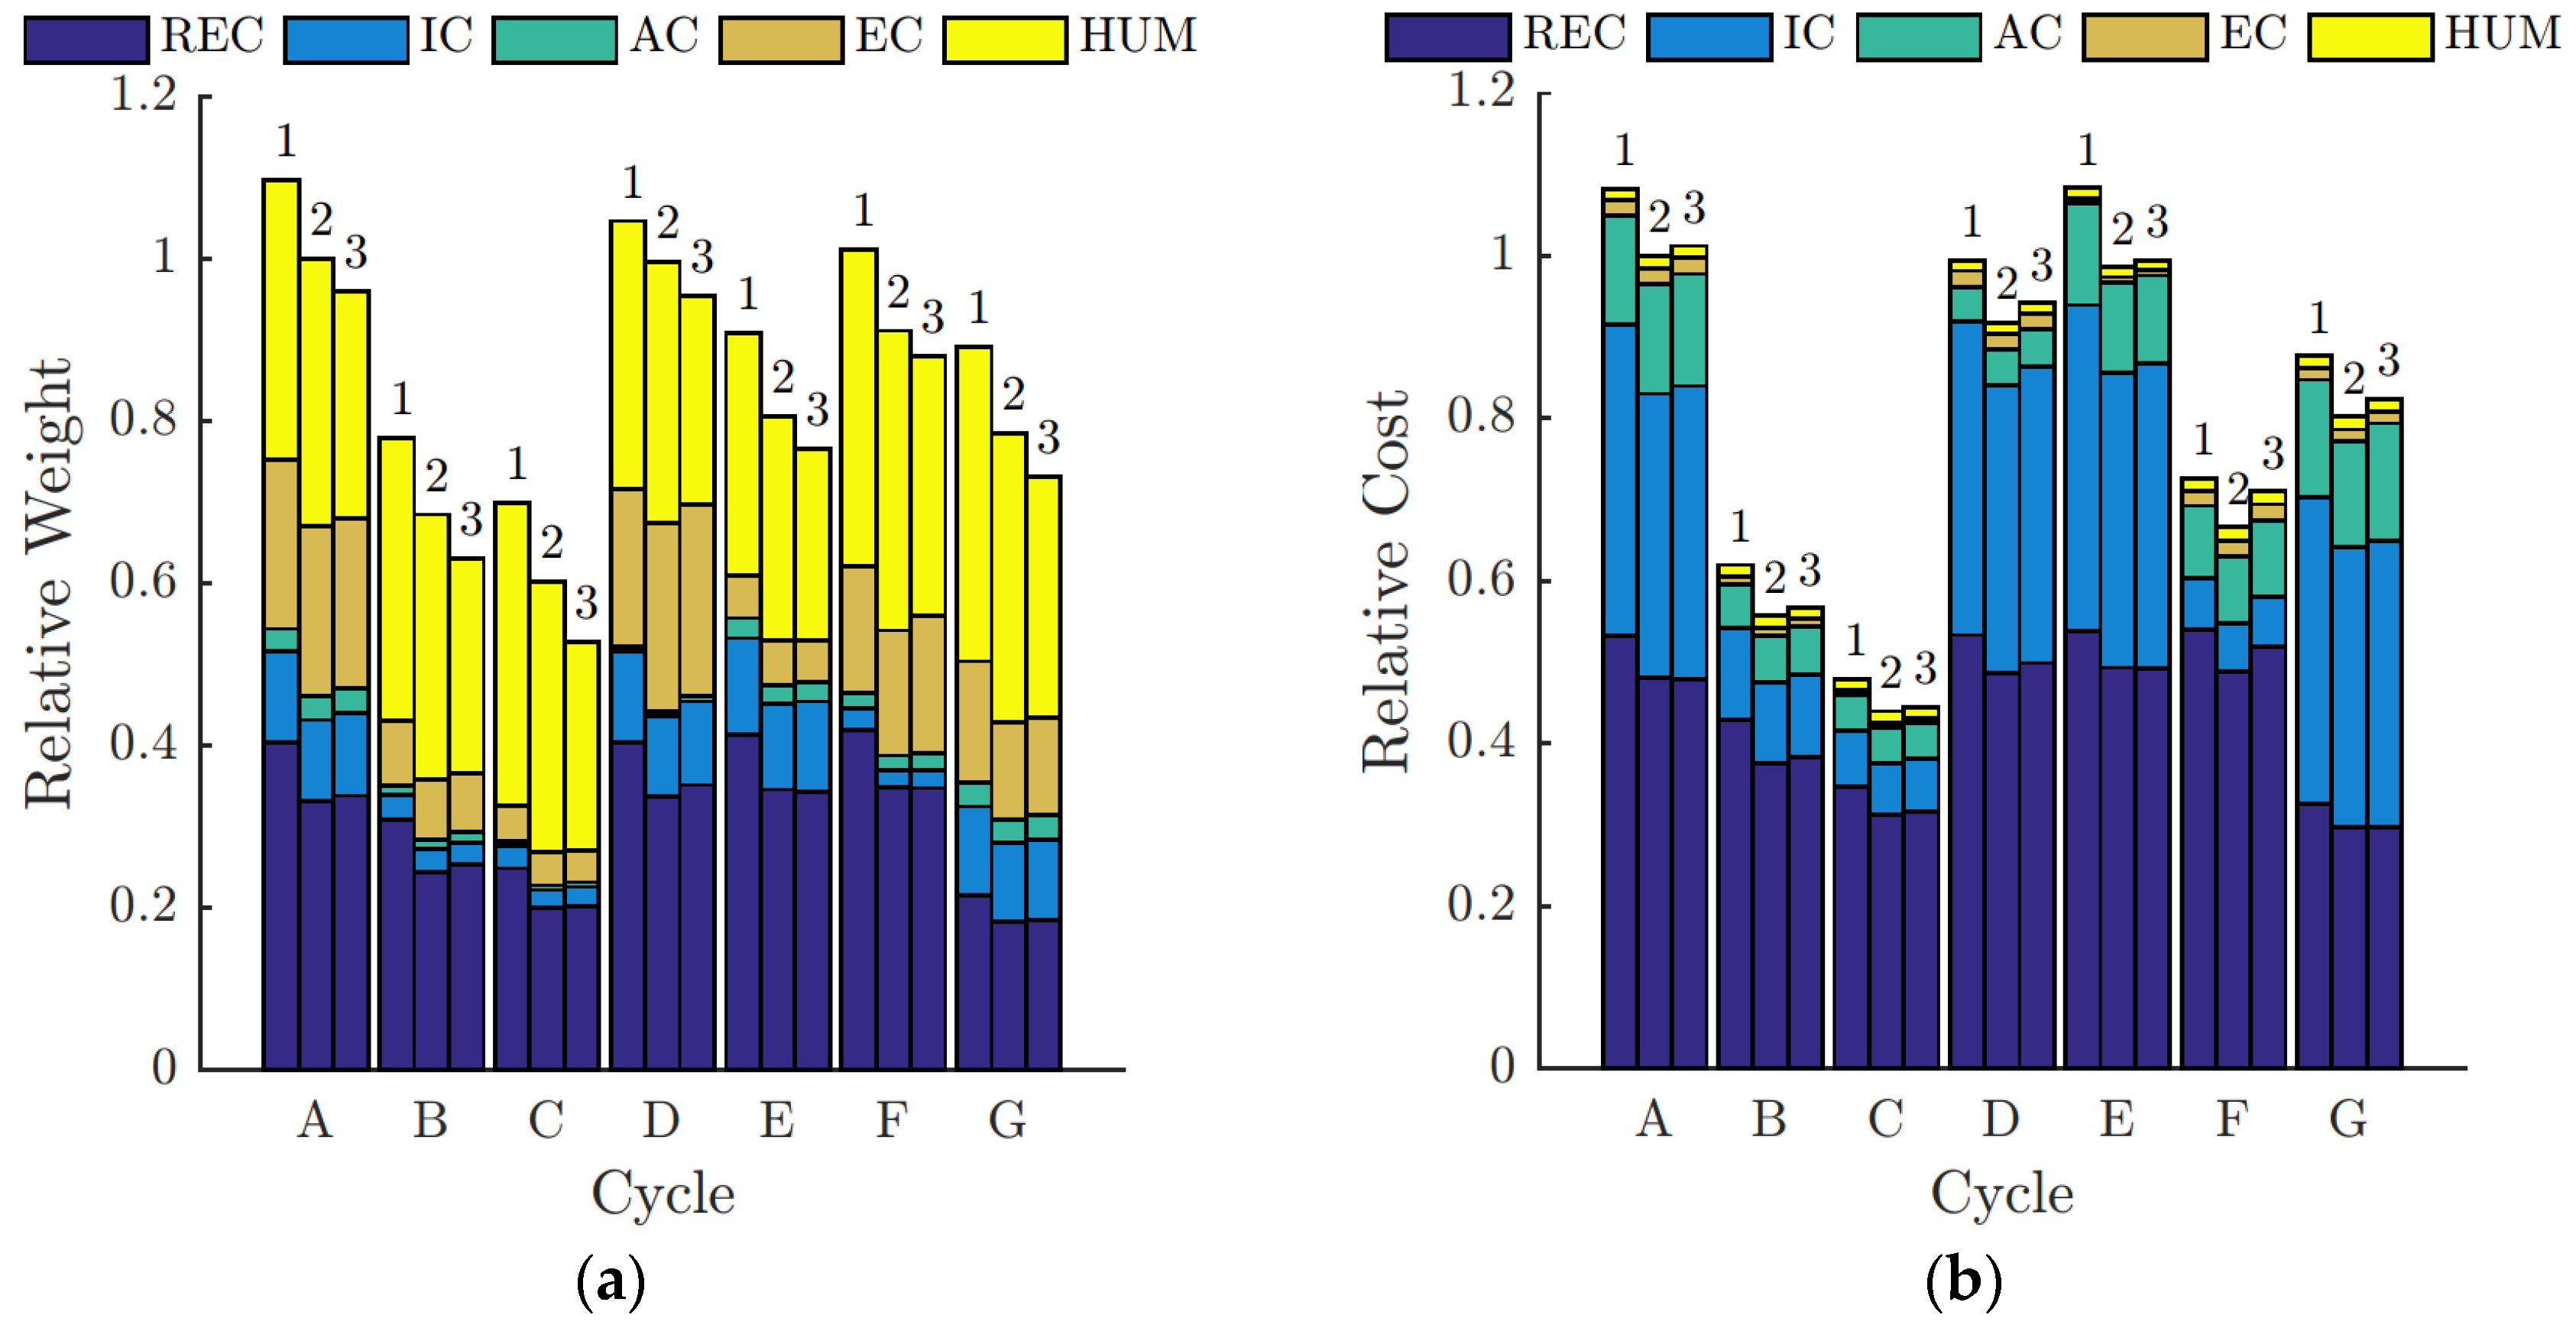
The breakdown of the total weight and cost for the heat exchanger configurations are highlighted in Figure 9. Cycles A , B , and C (see Table 3) show the variation when the effectiveness of all heat exchangers vary together. On the other hand, cycles D , E , F , and G show the effect of reducing the technology level of one heat exchanger at a time. The reference cycle ( A 5 40 ) has been used to normalize the weight and cost of the components. The total reference weight of all heat exchangers is estimated up to 47.76 tones, whereas the reference cost estimate is 4.2 m USD. These estimates are broadly in accordance with the cost estimates previously presented by Jonsson and Yan [1] for a power plant of 55.1 MW (3.8 m USD updated to 2015). It is important to highlight that the thermal efficiency achieved by the reference cycle (61.4%) is 11.9 pp higher than the one reported by Jonsson and Yan in [1], which partially justifies the discrepancy in the heat exchanger acquisition cost estimate.
For cycle A 5 40 , the recuperator is the heaviest component—33.12% of the total weight—followed by the humidifier, the economizer, the intercooler, and finally the aftercooler—with relative contributions to the overall power plant weight of 33.01%, 20.96%, 9.98%, 2.94%, respectively. Although the economizer and the humidifier are among the heaviest components, their contribution to the overall cost of the system was found to be approximately 3% (Figure 9). In terms of heat exchanger cost, the recuperator is the most expensive heat exchanger—48.11% of the total cost, followed by the intercooler, the aftercooler, the economizer, and finally the saturator—with relative contributions to the overall cycle cost of 34.95%, 13.43%, 1.99%, and 1.52%, respectively.
Reducing the OPR from 40 to 30 increases the total weight across a range between 5% and 10% depending upon the cycle technology level (Figure 9a), and the total cost by 8% in all cases (Figure 9b). The observed increment in heat exchanger weight is primarily driven by the recuperator and the economizer due to the excess of available heat downstream the power turbine that needs to be managed by these two components whose size is further increased by the higher flow rate requirement of this low OPR cycle. As a result, the size increase of the recuperator primarily drives the increase in the estimated acquisition cost of the system. It is worth noting that when the OPR becomes 30 from 40, the humidifier is 7% less expensive, driven by the need for thinner shell walls. However, an increase in weight is observed as the required material for packing increases by 12% compared to the baseline case to facilitate the larger enthalpy flux. Finally, although the reduction of the OPR to 30 increases the weight and the cost of the components, it is associated with a reduction in the overall thermal efficiency of the system by 0.7 pp.
When the T p s becomes 15 K from 5 K, the size, and, consequently, the weight and cost of all the heat exchangers increases due to the demand of a higher mass flow to achieve the required power output. The saturator is the only component whose weight and cost reduce as it becomes shorter. Except for A 15 40 , which increases its total weight compared with A 5 40 , the reduction in the weight of the humidifier outbalances the increment in the weight of the heat exchangers, but not the increment in the cost. When the pinch point temperature is increased to 15 K, the total acquisition cost of the system marginally increases by around 3% while the thermal efficiency falls by approximately 0.45 pp.
The comparison of cycles A 5 40 , B 5 40 , and C 5 40 (Figure 9), where the effectiveness of all the heat exchangers is reduced at the same time, shows the exponential relationship between the technology level of the components, and their weight and cost. When the effectiveness of the heat exchangers increases from 0.75 to 0.85 ( C 5 40 B 5 40 ), the total weight increases by 14% and the total cost by 28%. For a further effectiveness increase to 0.95 ( B 5 40 A 5 40 ), the weight rises by 46% and the cost by 80% with respect to the baseline cycle. On the other hand, the thermal efficiency shows a quasi-linear correlation with the cycle design parameters. From C 5 40 to B 5 40 , the efficiency rises by 2.8 pp, and from B 5 40 to A 5 40 , an increase of 2.7 pp is observed (Figure 3).
Considering each heat exchanger separately, between cycles A 5 40 and C 5 40 , the intercooler is the component that undergoes the largest variation in weight, manifesting a reduction of 77%. The economizer shows a reduction of 65% with regards to its reference cost, followed by the aftercooler with a reduction of 60%, and, finally, the recuperator with a reduction of 40%. On the other hand, the intercooler is the component that suffers the largest reduction in cost—82% of its reference cost, followed by the economizer, the aftercooler, and the recuperator—70%, 67%, and 35%, respectively. This demonstrates that the variations in the total weight of the heat exchangers and the variations in cost are linearly related, as the changes in cost are directly correlated with the variations in weight of each component.
Moreover, when comparing cycles D 5 40 , E 5 40 , F 5 40 , and G 5 40 with A 5 40 , it can be seen that the reduction of the technology level of a heat exchanger has a knock-on effect on the remaining heat exchangers of the system (see Figure 9). The aftercooler is the heat exchanger that experiences the largest reduction in weight and cost—88% and 87%, respectively. In addition, both the weight and cost of the aftercooler are cut by 39% when the effectiveness of the intercooler is reduced from 0.95 to 0.75 ( A 5 40 F 5 40 ). However, both the weight and cost of the aftercooler are cut by 39% and 17%, respectively, when the effectiveness of the economizer is reduced from 0.95 to 0.75 ( A 5 40 D 5 40 ).
The weight and cost of the economizer is reduced by 43% and 14%, respectively, when the recuperator effectiveness is changed from 0.9 to 0.8 ( A 5 40 G 5 40 ). Hence, the design of the power plant must account for the impact of the technology level of one of the components on the design, cost, and weight of the remaining heat exchangers.
The overall system estimated acquisition cost and weight is shown in Figure 10 normalized against the baseline cycle A 5 40 metrics. In terms of total weight, the change produced by the economizer and the recuperator—20% and 22% of the reference weight, respectively—is an order of magnitude higher than the changes produced by the intercooler, or the aftercooler—9%, and 1%, respectively. On the other hand, the changes produced by the intercooler, the recuperator, and the aftercooler—34%, 20%, and 8% of the reference cost, respectively—are one order of magnitude higher than the ones the economizer can create which is around 2%. In addition, from the contours illustrated in Figure 3 and Figure 10b, it can be demonstrated that the most efficient way to reduce the total cost of the heat exchangers is to reduce the effectiveness of the aftercooler. The ratio of the percentage variation in cost to the variation in thermal efficiency c ( % ) / η ( % ) is 17—i.e., the cost drops by 17% per percentage point drop of thermal efficiency, whereas, when reducing the effectiveness of the intercooler, recuperator and economizer, these ratios become 16, 9 and 1, respectively.

4. Conclusions

The parametric study of a humid air turbine system conducted in the current work has shown the high efficiency potential of this cycle across the design space, with a maximum thermal efficiency of 61.4%, achieved with maximum technology level of the heat exchangers and saturator, and maximum overall pressure ratio of at the gas generator. The absolute humidity at the inlet of the combustion chamber across the design space is within the limits for flame stability, never exceeding 0.25 kgv/kga.
The final selection of the configuration of the power plant will depend on the levelized cost of the power production, which would require performing a full economic analysis. Depending on the market where the power plant is intended, an investment analysis should be conducted in order for the most appropriate candidate power system to be identified.
The parameter that was found to primarily drive the thermal efficiency is the intercooler and recuperator effectiveness. For a change in intercooler effectiveness from 0.95 to 0.75, the thermal efficiency falls by 2 pp, whereas, for the recuperator, a change from 0.9 to 0.8 causes a reduction in thermal efficiency of 2.28 pp. Cycle efficiency is not significantly affected by aftercooler and economizer effectiveness.
The parametric studies also showed that the technology level of each heat exchanger affects the thermal efficiency, total cost, and total weight of the power system differently: the recuperator was found to have the greatest impact on thermal efficiency, whereas the estimated acquisition cost is found to be mainly driven by the intercooler, while the total weight is mostly affected by the economizer and recuperator.
Overall pressure ratio was found to have great impact over the cycle metrics; when the OPR becomes 30 from 40, the total cost of the heat exchangers increases by 10%, total weight by 5% while thermal efficiency is penalized by 0.67 pp. On the other hand, an increase of the saturator’s pinch temperature difference Δ T p s to 15 K penalizes the thermal efficiency by 0.65 pp, while the full system’s acquisition cost index was found to increase by 3%.
Overall, a typical design space of a complex humid air turbine power plant was systematically explored and the dependencies between key cycle parameters and component design including weight and acquisition cost were identified. The impact of heat exchanger effectiveness on cycle metrics was demonstrated, revealing their influence on thermal efficiency, cost and weight that was not previously known. The outcomes of this research constitute a step forward in understanding the performance of a complex power system across its design space and appreciating the potential of such systems for applications where high efficiency combined with low overall plant volume and weight are of importance.

Acknowledgments

This research program is financially supported by an Engineering and Physical Sciences Research Council (EPSRC) Industrial Cooperative Award in Science and Technology (I-CASE) Award and Rolls-Royce plc. (Bristol, UK) under the University Technology Centre in Aero System Design, Integration and Performance at Cranfield University (Cranfield, UK). The authors kindly thank Rolls-Royce plc. for permission to publish this work and for the technical support throughout the duration of the project.

Author Contributions

L.S.-d.-L. developed and implemented the heat exchanger and cycle design methodologies, G.D.B. developed the cycle thermal design and optimization platform, performed the simulations and analyzed the cycle performance data, P.L.O.-G. developed the heat exchanger detailed design and optimization framework, conducted the simulations and analyzed the design outcomes. P.K.Z. put together the manuscript.

Conflicts of Interest

The authors declare no conflict of interest.

Nomenclature

Symbols
CkJ/KHeat capacity
c$Cost
C*(-)Heat capacity ratio
Ci(-)Weighting coefficient
dtmSaturator packing bed diameter
Fi(-)Optimization fitness
hkJ/kgSpecific enthalpy
htmHeight of the packing bed of the saturator
H+MJ/kgEnthalpy invariant
k × AkW/KOverall heat transfer coefficient × Heat transfer area (Inverse of total resistance)
M+(-)Flow invariant
pMPaPressure
PmPerimeter
QMWHeat transfer
SP(-)Selection parameter
TKTemperature
ΔTps(-)Saturator pinch temperature difference

Abbreviations

ACAftercooler
CCCombustion chamber
CCGTsCombined cycle gas turbines
ECEconomizer
EvGTEvaporative gas turbine
GTGas turbine
HATHumid air turbine
ICIntercooler
OPROverall pressure ratio
ppPercentage point
RECRecuperator
relPRRelative pressure ratio
SATSaturator
TITTurbine inlet temperature

Subscripts

0Pinch conditions
1Bottom of the saturator
2Top of the saturator
aDry air
dewDew
gGas
satSaturation
vVapor
wWater

Greek Symbols

α Weighting coefficient
β Saturator bypass
ε Effectiveness
ϕ Relative humidity
ω Absolute humidity

Appendix A. Humidifier Design

The methodology, discussed by Sanchez de Leon [27] and originally developed by Aramayo-Prudencio [28], defines the design point saturator performance using the inlet pressure and temperature of the two streams (water and dry air) at the inlet and the pinch temperature difference T p s . The pinch point temperature difference is defined as the minimum temperature difference between the operating line of the water and the saturated air enthalpy line across the saturator [28]. For this modelling process, the air–vapor mixture is treated as an ideal mixture of ideal gases, while the air at the outlet of the saturator is assumed to be fully saturated [9]. From the conservation of the dry air and water mass as well as conservation of energy two invariants of the system, ( M + , H + ) can be defined as:
m w m a ω = M + ,
h a ( T g ) +   ω [ h v ( T g ) h w ( T w ) ] M + h w ( T w ) =   H + .
Under the assumption of ideal mixture of ideal gas, absolute humidity is defined as:
ω = Φ   p s a t ( T g ) p Φ   p sat ( T g )   R a R v .
For the calculation of the saturated gas thermodynamic properties, the above-defined system of equations needs to be solved for three sections along the saturator as follows:
Station “0” corresponds to the pinch condition between the operating and saturated enthalpy lines of the saturator. The temperature difference between the two abovementioned lines is characteristic of the available technology level, which corresponds to the height of the saturation tower. The thermodynamic properties of the saturated gas (temperature T 0 and absolute humidity ω 0 ) in this section are the unknowns of the system. The relative humidity of the gas on the saturation line is Φ = 1 , and T w , 0 in the operating line is determined as T w , 0 = T 0 + T p s   once the pinch point temperature difference is defined; therefore, the invariant and absolute humidity equations can be rewritten as the following in agreement with [28] as follows:
ω 0       p s a t ( T 0 ) p 1 Φ   p sat ( T 0 )   R a R v   = 0 ,
M + c p a c p w   ω 0 ( c p v c p w c p w +   p 1 p 1 p s a t ( T 0 )   R v c p w ( h f g ( T 0 ) R v   T 0 ) 2 ) = 0 ,
H +   h a ( T 0 ) ω 0 h f g ( T 0 ) +   ω 0 [ h w ( T 0 +   T p s ) h w ( T 0 ) ] + M + h w ( T 0 +   T p s ) =   0 .
Station “1” corresponds to the bottom section of the saturator—i.e., air inlet/water outlet, for which the unknowns are the water temperature T w , 1 and the water mass flow m w , 1 whereas the gas properties are known. Therefore, the invariant equations can be written as follows:
M + +   ω 1 m w , 1 m a = 0 ,
H +   h a ( T g , 1 ) ω 1 h f g ( T g , 1 ) +   ω 1 [ h w ( T w , 1 ) h w ( T g , 1 ) ] + M + h w ( T w , 1 ) =   0 .
Station “2” corresponds to the top section of the saturator—i.e., water inlet/air outlet—for which the unknowns are the outlet gas conditions, namely temperature T g , 2 and absolute humidity ω 2 , hence the gas mass flow. Air in this section is assumed to be saturated. The system of equations can be written as follows:
ω 2       p s a t ( T g , 2 ) p 1 Φ   p sat ( T g , 2 )   R a R v   = 0 ,
M + +   ω 2 m w , 2 m a = 0 ,
H +   h a ( T g , 2 ) ω 2 h f g ( T g , 2 ) +   ω 2 [ h w ( T w , 2 ) h w ( T g , 2 ) ] + M + h w ( T w , 2 ) =   0 .
The equations of station ”0” (Equations (A4)–(A6)) and station ”2” (Equations (A9)–(A11)) form a system of six equations and six unknowns that resolve the pinch conditions ( T 0 , ω 0 ), the gas outlet conditions ( T g , 2 , ω 2 ), and the two invariants M + and H + . Once the invariants are calculated, the equations of station ”1” (Equations (A7) and (A8)) allow the solution for the water outlet conditions.
This model has been validated against experimental results of a HAT pilot cycle obtained by Lindquist et al. [17] and the maximum error in the outlet proprieties of the two streams is 1.5% as reported in Table A1
Table A1. Validation of the saturator model against experimental data from Lindquist et al. [17].
Inlet/Input ConditionsOutlet Conditions
ParemeterUnitsDataParameterUnitsModelExperimental DataDiscrepancy (%)
m g , 1 (kg/s)2.17 m g , 2 (kg/s)2.56852.550.7
T g , 1 (K)346.75 T g , 2 (K)389.97389.150.2
p 1 (bar)7.88 ω 2 (-)0.1837--
m w , 2 (kg/s)3.48 m w , 1 (kg/s)3.08153.100.6
T w , 2 (K)419.35 T w , 1 (K)347.52352.851.5
T p s (K)10.-----

Appendix B. Heat Exchanger Design

A counter-current plate-fin architecture was chosen for the intercooler and aftercooler design. For the airside, a serrated fin arrangement was selected based on its heat transfer and mechanical properties as discussed in [31]. On the waterside, stainless steel plain fins were employed to minimize pumping work, decrease the risk of fouling or passage blocking and avoid potential corrosion problems. The effectiveness-Number of Transfer Units (ε-NTU) method was followed to estimate the heat transfer area as described by Kays and London [32]. The number of transfer units was obtained by means of the correlations provided by the Engineering Society Data Unit (ESDU) in [33]. To obtain the main heat exchanger dimensions, the heat transfer coefficient of the airside was estimated using the expressions provided by Yang and Li [34]. For the waterside, the equations suggested in [35] were employed to evaluate the heat transfer coefficient for turbulent flow, and the equations in [36] were utilized for the laminar flow.
The recuperator is an air-air heat exchanger and, as such, a serrated-fin configuration was considered for both sides. In addition, the recuperator was arranged in a counter-current multi-pass cross-flow configuration. Due to the presence of the reheater, the maximum temperatures that the recuperator has to be able to stand can go up to 900 °C. Previous research by McDonald [37], Maziasz [38], and Min [39] has stated that Inconel 625 presents excellent creep resistance properties. Therefore, the passes with a temperature higher than 800 °C were assumed to be made of Inconel 625, whereas the rest of the heat exchanger material was assumed to be stainless steel. For the calculation of the heat transfer area, the ε-NTU method was followed [32]. The number of transfer units was obtained by means of the ESDU correlations [33] and the heat transfer coefficient was estimated with the equations purposed by Yang and Li [34].
In the economizer, up to 25% percent of the moisture in the air condenses during design point operation. Hence, to avoid issues associated with passage blocking due to the presence of contaminated air and water inside its passages, a mixture of finned-tube and plain-tube configuration was selected. The first part of the heat exchanger (dry part), where no condensation takes place, was designed using a finned-tube configuration. The later part (wet part), where the condensation begins to occur, was designed in plain-tube to ease the flow of the condensing moisture. The tubes are arranged in a counter-current multi-pass cross-flow configuration, with the air flowing over the tubes and the water through them in an effort to minimize passage blocking and fouling and ease maintenance procedures. The ε-NTU method [32] was followed to calculate the number of transfer units. Then, to calculate the heat transfer coefficient of the dry airside flow, the correlations given in the ESDU items [40] were utilized. However, in the wet part, the heat and mass transfer process was simulated following the model developed in [41]. The heat transfer coefficient of the water was evaluated as dictated in the ESDU items [35].
An index of the acquisition cost of the four heat exchangers specified above was estimated using heat transfer area based correlations. For the plate-fin geometries, the expressions proposed by Traverso and Massardo [42] were used. These correlations were originally derived for heat exchangers made of aluminum alloys; consequently, the material correction factors suggested by Towler and Sinnott [43] were applied to consider the different alloys employed. For the economizer, the correlation presented by Casarosa [44] was utilized for estimating its acquisition price. All cost estimates were updated to 2015 by means of the Chemical Engineering Plant Cost Index (CEPCI) [45].
For a prescribed thermodynamic “design vector” of the system, several different heat exchangers designs can be identified. A genetic algorithm based multi-objective optimization approach was applied to identify the individual that features the best compromise between cost and compactness [29]. The compactness was evaluated by means of the outlet perimeter, defined as the sum of the three main dimensions—i.e., height, length, and width. The result of each optimization was a Pareto front. In principle, any point within this Pareto front is an optimal candidate, and the balance between compactness and cost will depend on the considered application. To select the traded configuration from the Pareto front, a selection parameter S P (see Equation A12) of each configuration in the Pareto is calculated and finally the one with the lowest S P is selected. F i ( x ) represents the fitness of each individual in the Pareto—i.e., cost and perimeter, and α i represents the weighting coefficients. These coefficients allow the designer to place more emphasis on any of the objectives when selecting the heat exchanger from the Pareto front. In the current case, their values were set to 0.5, in order to select the configuration that trades equally both objectives:
S P ( x ) =   i = 0 i = n α i ( F i ( x ) max ( F i ) ) 2 ;   α i = 1 .
For the saturator design, a structured packing-bed tower was selected. For packing sizing, the models presented by Coulson and Richardson [46], and Aramayo-Prudencio and Young [47] were used. This method calculates the thermodynamic performance of the saturator tower using as input the geometrical data and the inlet conditions. Thus, it allows the derivation of the tower’s key dimensions—i.e., the height and diameter of the packing—on a single iterative process, as the thermodynamic performance is defined by the cycle. The model was validated against experimental data presented by Lindquist et al. [17] and the results are presented in Table A2. The cost of the tower was calculated based on the shell weight and the packing volume. For the packing material a cost of 3800 USD/m3 was assumed while a material cost of 8800 USD/ton was used for the vessel, both made in stainless steel based on [48]. To account for the costs of the droplet eliminators, water sprays, and the rest of subcomponents, an additional 14,000 USD was added on top of the baseline value of the saturator [48].
Table A2. Validation of tower packing height calculation against experimental data from Lindquist et al. [17].
Inlet/Input ConditionsOutlet Conditions
ParameterUnitsDataParameterUnitsModelExperimental DataDiscrepancy (%)
m g , 1 (kg/s)2.17 m g , 2 (kg/s)2.542.550.4
T g , 1 (K)346.75 T g , 2 (K)390.64389.150.4
p 1 (bar)7.88 ω 2 (-)0.176--
h t (m)0.57-----
d t (m)0.70-----
m w , 2 (kg/s)3.48 m w , 1 (kg/s)3.113.100.4
T w , 2 (K)419.35 T w , 1 (K)358.67352.851.6

References

  1. Jonsson, M.; Yan, J. Economic Assessment of Evaporative Gas Turbine Cycles With Optimized Part Flow Humidification Systems. In Proceedings of the ASME Turbo Expo, Atlanta, GA, USA, 16–19 June 2003. [Google Scholar]
  2. Traverso, A.; Massardo, A.F. Thermoeconomic Analysis of Mixed Gas—Steam Cycles. Appl. Therm. Eng. 2002, 22, 1–21. [Google Scholar] [CrossRef]
  3. Nakhamkin, M.; Swensen, E.; Wilson, J.M.; Gaul, G.; Polsky, M. The Cascaded Humidified Advanced Turbine (CHAT). J. Eng. Gas Turbines Power 1996, 118, 565–571. [Google Scholar] [CrossRef]
  4. Rao, A.D. Process for Producing Power. U.S. Patent No. 4,829,763, 16 May 1989. [Google Scholar]
  5. Chiesa, P.; Lozza, G.; Macchi, E.; Consonni, S. An Assessment of the Thermodynamic Performance of Mixed Gas-Steam Cycles Part B—Water-Injected and Hat Cycles. J. Eng. Gas Turbines Power 1995, 117, 499–508. [Google Scholar] [CrossRef]
  6. Lazzaretto, A.; Segato, F. Thermodynamic Optimization of the HAT Cycle Plant Structure—Part I: Structure of the Heat Exchanger Network. J. Eng. Gas Turbines Power 2001, 123, 1–7. [Google Scholar] [CrossRef]
  7. Lazzaretto, A.; Segato, F. Thermodynamic Optimization of the HAT Cycle Plant Structure—Part II: Structure of the Heat Exchanger Network. J. Eng. Gas Turbines Power 2001, 123, 8–16. [Google Scholar] [CrossRef]
  8. Ågren, N.D.; Westermark, M.O.J. Design Study of Part-Flow Evaporative Gas Turbine Cycles: Performance and Equipment Sizing—Part I: Aeroderivative Core. ASME J. Eng. Gas Turbines Power 2003, 125, 201–215. [Google Scholar] [CrossRef]
  9. Ågren, N.D.; Westermark, M.O.J. Design Study of Part-Flow Evaporative Gas Turbine Cycles: Performance and Equipment Sizing—Part II: Industrial Core. ASME J. Eng. Gas Turbines Power 2003, 125, 216–227. [Google Scholar] [CrossRef]
  10. Thern, M. Theoretical and Experimental Evaluation of a Plate Heat Exchanger Aftercooler in an Evaporative Gas Turbine Cycle. In Proceedings of the ASME Turbo Expo, Atlanta, GA, USA, 16–19 June 2003. [Google Scholar]
  11. Wang, B.; Zhang, S.; Xiao, Y. Steady State Off-Design Performance of Humid Air Turbine Cycle. In Proceedings of the ASME Turbo Expo, Montreal, QC, Canada, 14–17 May 2007. [Google Scholar]
  12. Kim, T.S.; Song, C.H.; Ro, S.T.; Kauh, S.K. Influence of Ambient Condition on Thermodynamic Performance of the Humid Air Turbine Cycle. Energy 2000, 25, 313–324. [Google Scholar] [CrossRef]
  13. Takahashi, T.; Nakao, Y.; Koda, E. Analysis and Evaluation about Advanced Humid Air Turbine System. Chall. Power Eng. Environ. 2007, 341–344. [Google Scholar] [CrossRef]
  14. Kavanagh, R.M.; Parks, G.T. A Systematic Comparison and Multi-Objective Optimization of Humid Power Cycles—Part I: Thermodynamics. J. Eng. Gas Turbines Power 2009, 131. [Google Scholar] [CrossRef]
  15. Möller, B.F.; Obana, M.; Assadi, M.; Mitakakis, A. Optimisation of HAT-Cycles—With and without CO2 Capture. In Proceedings of the ASME Turbo Expo, Viena, Austria, 14–17 June 2004. [Google Scholar]
  16. Nyberg, B.; Thern, M. Thermodynamic studies of a HAT cycle and its components. Appl. Energy 2012, 89, 315–321. [Google Scholar] [CrossRef]
  17. Lindquist, T.; Thern, M.; Torisson, T. Experimental and Theoretical Results of a Humidification Tower in an Evaporative Gas Turbine Cycle Pilot Plant. In Proceedings of the ASME Turbo Expo, Amsterdam, The Netherlands, 3–6 June 2002. [Google Scholar]
  18. Araki, H.; Koganezawa, T.; Myouren, C.; Higuchi, S.; Takahashi, T.; Eta, T. Experimental and Analytical Study on the Operation Characteristics of the AHAT System. ASME J. Eng. Gas Turbines Power 2012, 134. [Google Scholar] [CrossRef]
  19. Wei, C.; Zang, S. Experimental Investigation on the Off-Design Performance of a Small-Sized Humid Air Turbine Cycle. Appl. Therm. Eng. 2013, 51, 166–176. [Google Scholar] [CrossRef]
  20. De Paepe, W.; Carrero, M.M.; Bram, S.; Parente, A.; Contino, F. Experimental Characterization of a T100 Micro Gas Turbine Converted to Full Humid Air Operation. Energy Procedia 2014, 61, 2083–2088. [Google Scholar] [CrossRef]
  21. Yagi, M.; Araki, H.; Tagawa, H.; Koganezawa, T.; Myoren, C.; Takeda, T. Progress of the 40 MW-Class Advanced Humid Air Turbine Tests. ASME J. Eng. Gas Turbines Power 2013, 135. [Google Scholar] [CrossRef]
  22. Li, Y.G.; Pilidis, P.; Newby, M.A. An Adaptation Approach for Gas Turbine Design-Point Performance Simulation. J. Eng. Gas Turbines Power 2006, 128, 789–795. [Google Scholar] [CrossRef]
  23. Macmillan, W.L. Development of a Module Type Computer Program for the Calculation of Gas Turbine off Design Performance; Cranfield University: Cranfield, UK, 1974. [Google Scholar]
  24. Goodger, E.M.; Ogaji, S.O.T. Fuels and Combustion in Heat Engines; Cranfield University Press: Cranfield, UK, 2011. [Google Scholar]
  25. Young, J.B.; Wilcock, R.C. Modeling the Air-Cooled Gas Turbine: Part 2—Coolant Flows and Losses. ASME J. Turbomach. 2002, 124, 214–221. [Google Scholar] [CrossRef]
  26. Horlock, J.H.; Watson, D.T.; Jones, T.V. Limitations on Gas Turbine Performance Imposed by Large Turbine Cooling Flows. J. Eng. Gas Turbines Power 2001, 123, 487. [Google Scholar] [CrossRef]
  27. Sanchez, L. Advanced Gas-Turbine-Based Power Plants for Marine Commercial Applications. Ph.D. Thesis, Cranfield University, Cranfield, UK, 2014. [Google Scholar]
  28. Aramayo-Prudencio, A.; Young, J.B. The Analysis and Design of Saturators for Power Generation Cycles: Part 1—Thermodynamics. In Proceedings of the ASME Turbo Expo, Atlanta, GA, USA, 16–19 June 2003. [Google Scholar]
  29. Deb, K. Multi-objective Optimization Using Evolutionary Algorithms; John Wiley & Sons: New York, NY, USA, 2001. [Google Scholar]
  30. Göke, S. Ultra Wet Combustion: An Experimental and Numerical Study. Ph.D. Thesis, Technische Universität, Berlin, Germany, 2012. [Google Scholar]
  31. ESDU. Selection and Costing of Heat Exchangers. ESDU Data Items, 1 December 1994. [Google Scholar]
  32. Kays, W.M.; London, A.L. Compact Heat Exchangers, 3rd ed.; Krieger Pub. Co.: New York, NY, USA, 1984. [Google Scholar]
  33. ESDU. Design and Performance Evaluation of Heat Exchangers: The Effectiveness—NTU Method Part 3. ESDU Data Items, 1 July 1998. [Google Scholar]
  34. Yang, Y.; Li, Y. General Prediction of the Thermal Hydraulic Performance for Plate-Fin Heat Exchanger with Offset Strip Fins. Int. J. Heat Mass Transf. 2014, 78, 860–870. [Google Scholar] [CrossRef]
  35. ESDU. Heat Transfer Coefficients for Water or Steam in Plain Circular Tubes: Fully-Developed Turbulent Flow. ESDU Data Items, 1 November 1981. [Google Scholar]
  36. ESDU. Forced convection heat transfer in straight tubes. Part 2: Laminar and transitional flow. ESDU Data Items, 1 November 2001. [Google Scholar]
  37. McDonald, C.F. Recuperator Considerations for Future Higher Efficiency Microturbines. Appl. Therm. Eng. 2003, 23, 1463–1487. [Google Scholar] [CrossRef]
  38. Maziasz, P.J.; Swindeman, R.W. Selecting and developing advanced alloys for creep-resistance for microturbine recuperator applications. J. Eng. Gas Turbines Power 2003, 125, 310–315. [Google Scholar] [CrossRef]
  39. Min, J.K.; Jeong, J.H.; Ha, M.Y.; Kim, K.S. High temperature heat exchanger studies for applications to gas turbines. Heat Mass Transf. 2009, 46, 175–186. [Google Scholar] [CrossRef]
  40. ESDU. High-Fin Staggered Tube Banks: Heat Transfer and Pressure Drop for Turbulent Single Phase Gas Flow. ESDU Data Items, 1 Jane 1988. [Google Scholar]
  41. Gesellschaft, V. VDI Heat Atlas, 2nd ed.; Springer Science & Business Media: Berlin, Germany, 2010. [Google Scholar]
  42. Traverso, A.; Massardo, A.F. Optimal Design of Compact Recuperators for Microturbine Application. Appl. Therm. Eng. 2005, 25, 2054–2071. [Google Scholar] [CrossRef]
  43. Towler, G.P.; Sinnott, R.K. Chemical Engineering Design: Principles, Practice and Economics of Plant and Process Design, 2nd ed.; Butterworth-Heinemann: Oxford, UK, 2013. [Google Scholar]
  44. Casarosa, C.; Donatini, F.; Franco, A. Thermoeconomic Optimization of Heat Recovery Steam Generators Operating Parameters for Combined Plants. Energy 2004, 29, 389–414. [Google Scholar] [CrossRef]
  45. The Annual Cost Index of Chemical Engineering Plant. Chem. Eng. 2015, 122, 104.
  46. Coulson, J.M.; Richardson, J.F.; Harker, J.H.; Backhurst, J.R. Chemical Engineering: Particle Technology and Separation Process, 5th ed.; Butterworth-Heinemann: Oxford, UK, 2002; Volume 2. [Google Scholar]
  47. Aramayo-Prudencio, A.; Young, J.B. The Analysis and Design of Saturators for Power Generation Cycles: Part 2—Heat and Mass Transfer. In Proceedings of the ASME Turbo Expo, Atlanta, GA, USA, 16–19 June 2003. [Google Scholar]
  48. Lindquist, T. Evaluation, Experience and Potential of Gas Turbine Based Cycles with Humidification. Ph.D. Thesis, Lund Institute of Technology, Lund, Sweden, 2002. [Google Scholar]
Figure 1. Schematic layout of the Humid Air Turbine.
Applsci 07 00413 g001
Figure 2. Heat transfer process in the Economizer.
Applsci 07 00413 g002
Figure 3. Cycle thermal efficiency across the design space as a function of the heat exchanger effectiveness—OPR = 40 & T p s = 5 K.
Applsci 07 00413 g003
Figure 4. Absolute humidity at the inlet of the combustion chamber across the design space as a function of the heat exchanger effectiveness—OPR = 40 & T p s = 5 K.
Applsci 07 00413 g004
Figure 5. (a) normalized heat exchanger effectiveness vs. mass flow fraction through the saturator and aftercooler; (b) normalized heat exchanger effectiveness vs. absolute humidity at the inlet of the combustion chamber; and (c) normalized heat exchanger effectiveness vs. cycle thermal efficiency—OPR = 40 & T p s = 5 K.
Applsci 07 00413 g005
Figure 6. (a) normalized inverse total resistance, k × A of each heat exchanger vs. intercooler effectiveness ( A 5 40 F 5 40 ); (b) normalized k × A of each heat exchanger vs. aftercooler effectiveness ( A 5 40 E 5 40 ); (c) normalized k × A of each heat exchanger vs. economizer effectiveness ( A 5 40 D 5 40 ); and (d) normalized k × A of each heat exchanger vs. recuperator effectiveness ( A 5 40 G 5 40 )—OPR = 40 & T p s = 5 K.
Applsci 07 00413 g006aApplsci 07 00413 g006b
Figure 7. (a) saturator pinch temperature difference vs. cycle thermal efficiency and absolute humidity at the inlet of the combustion chamber ( A 5 40 A 15 40 ); (b) saturator pinch temperature difference vs. normalized k × A of each heat exchanger ( A 5 40 A 15 40 )—OPR = 40 & ε I C = 0.95 & ε A C = 0.95 & ε E C = 0.95 & ε R E C = 0.9.
Applsci 07 00413 g007
Figure 8. Variation of the k × A of the heat exchangers when varying the overall pressure ratio from 40 to 30 ( A 5 40 A 5 30 )— T p s = 5 K, ε I C = 0.95 & ε A C = 0.95 & ε E C = 0.95 & ε R E C = 0.9.
Applsci 07 00413 g008
Figure 9. (a) break down of heat exchanger total relative weight; and (b) break down of heat exchanger total relative cost. (Bar 1) OPR = 30 & ∆ T p s = 5 K; (Bar 2) OPR = 40 & ∆ T p s = 5 K; (Bar 3) OPR = 40 & ∆ T p s = 15 K.
Applsci 07 00413 g009
Figure 10. (a) heat exchanger total normalized weight and (b) total normalized acquisition cost index across the range of heat exchanger effectiveness for OPR = 40 & T p s = 5 K.
Applsci 07 00413 g010
Table 1. Range of parameters across which the parametric study was conducted.
ParameterUnitsRange
Intercooler, aftercooler, economizer effectiveness ε =   Q / Q m a x (-)[0.75, 0.8, 0.95]
Recuperator effectiveness ε =   Q / Q m a x (-)[0.8, 0.85, 0.9]
Saturator pinch temperature difference T p s (K)[5, 10, 15]
Overall pressure ratio O P R (-)[30, 40]
Table 2. Heat exchanger design parameters and range specfication.
Design VariableRange
Intercooler, Aftercooler, Economizer heat capacity ratio C * = C m i n / C m a x [0.6–0.95]
Relative pressure ratio r e l P R = log O P R P R L P C [0.25–0.75]
Saturator bypass β [0–1]
Table 3. Cycle nomenclature definition.
Parameter A B C D E F G
ε I C (-)0.950.850.750.950.950.750.95
ε A C (-)0.950.850.750.750.950.950.95
ε E C (-)0.950.850.750.950.750.950.95
ε R E C (-)0.900.850.80.900.900.900.80
Table 4. Design variables values of the baseline cycle A 5 40 with maximum thermal efficiency.
Optimized Design VariableUnitsValue
Thermal efficiency η H A T (%)61.4
Overall pressure ratioOPR(-)40
Relative pressure ratio r e l P R (-)0.53
Intercooler effectiveness ε I C (-)0.95
Aftercooler effectiveness ε A C (-)0.95
Economizer effectiveness ε E C (-)0.95
Saturator pinch temperature difference T p s (K)5
Recuperator effectiveness ε R E C (-)0.9
Intercooler heat capacity ratio C I C * (-)0.95
Aftercooler heat capacity ratio C A C * (-)0.95
Economizer heat capacity ratio C E C * (-)0.82
Saturator bypass β (-)0.43
GT inlet gas mass flow m ˙ g , G T   i n l e t (kg/s)40.6
Table 5. k × A of the heat exchangers for the reference cycle A 5 40 (see also Table 4).
ComponentUnitsk × A for Reference Cycle A 5 40
Intercooler(kW/K)545.5
Aftercooler(kW/K)267.7
Economizer(kW/K)389.1
Recuperator(kW/K)379.4
Table 6. Design variables values of the baseline cycle A 5 30 with maximum thermal efficiency.
Optimized Design VariableUnitsValue
Thermal efficiency η H A T (%)60.7
Overall pressure ratioOPR(-)30
Relative pressure ratio r e l P R (-)0.53
Intercooler effectiveness ε I C (-)0.95
Aftercooler effectiveness ε A C (-)0.95
Economizer effectiveness ε E C (-)0.95
Saturator pinch temperature difference T p s (K)5
Recuperator effectiveness ε R E C (-)0.9
Intercooler heat capacity ratio C I C * (-)0.95
Aftercooler heat capacity ratio C A C * (-)0.95
Economizer heat capacity ratio C E C * (-)0.70
Saturator bypass β (-)0.47
GT inlet gas mass flow m ˙ g , G T   i n l e t (kg/s)44.86

