Article

Application of a High-Power Reversible Converter in a Hybrid Traction Power Supply System

1
School of Electrical Engineering, Beijing Jiaotong University, Beijing 100044, China
2
Beijing Electrical Engineering Technology Research Center, Beijing 100044, China
*
Author to whom correspondence should be addressed.
Appl. Sci. 2017, 7(3), 282; https://doi.org/10.3390/app7030282
Submission received: 24 December 2016 / Revised: 25 February 2017 / Accepted: 7 March 2017 / Published: 14 March 2017
(This article belongs to the Special Issue Energy Saving)

Abstract

:
A high-power reversible converter can achieve a variety of functions, such as recovering regenerative braking energy, expanding traction power capacity, and improving an alternating current (AC) grid power factor. A new hybrid traction power supply scheme, which consists of a high-power reversible converter and two 12-pulse diode rectifiers, is proposed. A droop control method based on load current feed-forward is adopted to realize the load distribution between the reversible converter and the existing 12-pulse diode rectifiers. The direct current (DC) short-circuit characteristics of the reversible converter is studied, then the relationship between the peak fault current and the circuit parameters is obtained from theoretical calculations and validated by computer simulation. The first two sets of 2 MW reversible converters have been successfully applied in Beijing Metro Line 10, the proposed hybrid application scheme and coordinated control strategy are verified, and 11.15% of average energy-savings is reached.

1. Introduction

At present, diode rectifiers are still widely used in urban rail transit traction power supply systems to provide energy for the trains [1]. Since the energy can only be transmitted from alternating current (AC) to direct current (DC), the braking resistor must be employed to consume the surplus regenerative braking energy of the trains in order to avoid the abnormal rise of the DC voltage. This scheme will cause a very large waste of energy, increasing the tunnel temperature and the burden of the cooling system.
Energy storage based on electric double-layer capacitors (EDLC) and flywheels are widely used in the transportation field [2,3,4]. EDLC has good performance in terms of power density, charge and discharge time, long lifetime cycles, and lower internal resistance, so it can be used for storing regenerative braking energy of electric vehicles [5,6,7,8,9,10]. However, in the field of urban rail transit, the maximum regenerative braking power is usually up to several megawatts, so thousands of EDLCs would be needed, which requires a large installation space and cost [11]. Flywheels were firstly installed in Japan in 1988 for storing regenerative energy [12]. The rated energy and power of the flywheels are 25 kWh and 2000 kW, respectively. After that, flywheels were verified in tests at the London underground and Spain railways. However, all of them are just prototypes. Complex mechanisms and high costs limit their wide utilization. Flywheel systems for energy saving may be an important research direction in the future [13,14,15].
It is a good energy-saving method to invert the regenerative braking energy to the AC grid, which has been already applied in several subway lines [16,17,18,19,20,21]. However, it requires additional installation space, which will increase the cost of substation construction, and the utilization rate of the inverter is not very high.
It will be a good idea to introduce high-power reversible converters into the traction power supply system of urban rail transit. Not only will braking energy be recovered, but traction power supply can also be realized by the reversible converter. Thus, the capacity of diode rectifiers can be reduced, or one of the two existing 12-pulse rectifiers may be replaced by a reversible converter for the purpose of saving space.
Generally, the DC output characteristic of the reversible converter is constant, which can be realized by a simple voltage closed-loop. However, because it needs to work with the diode rectifier units in parallel, in order to share the traction load, the reversible converter must have a similar voltage droop characteristic as the diode rectifier. Droop control methods are commonly used in DC microgrids [22,23] and other distribution power systems [24,25,26]. Few studies have paid attention to the DC voltage control of the reversible converter used in traction power supply systems.
In the field of urban rail transit, the existing literature is mainly aimed at the steady state and transient short-circuit characteristics of the diode rectifiers [27,28]. A mathematical model of the 12-pulse rectifier is established, and the approximate expression of the short-circuit current is deduced at the outlet. The accuracy of the calculation method was verified by modeling and simulation. However, the DC short-circuit characteristics of the reversible converter are different from the diode rectifier. The DC short-circuit fault of the grid-connected inverter used in wind power generation systems was studied in the literature [29,30], which can be used as an important reference for this paper.
This paper aims to introduce the high-power reversible converter into the traction power supply system of urban rail transit, and lay a foundation for further application. The following sections are organized as follows: A hybrid traction power supply system composed of a diode rectifier and reversible converter is proposed in Section 2. The DC output characteristic of the 12-pulse rectifier is introduced and a droop control method based on load current feed-forward is proposed for the reversible converter in Section 3. In order to provide guidance for system protection, the DC short-circuit fault of the reversible converter is studied, the peak short current and rise time are both calculated, which agree with the simulation results in Section 4. The effectiveness of the coordination control strategy is verified by a field test at Beijing Metro Line 10 in Section 5. Finally, conclusions are made in Section 6.

2. Proposed Hybrid Traction Power Supply Scheme

At present, the traction power supply equipment installed in the traction substation is a typical 24-pulse rectifier, which is made up of two 12-pulse rectifiers. In this way, AC grid current harmonics and DC voltage ripple can be reduced, and the system redundancy can be increased.
For diode rectifiers, DC output voltage is uncontrollable, and the energy can only be transmitted from AC to DC. In order to reuse the braking energy and reduce the DC voltage fluctuation, a high-power reversible converter is introduced into the traction power supply system. Figure 1 shows the proposed hybrid traction power supply scheme. In Figure 1a, an additional reversible converter branch is added, but in Figure 1b, a 12-pulse rectifier is replaced by a high-power reversible converter. It is obvious that no additional installation space is required in Figure 1b. The arrows indicate the direction of the energy flow.
No matter what kind of scheme, the reversible converter has a four-quadrant operation capability. When the train is in the traction state, the reversible converter can provide energy for the train, and reduce the DC voltage drop. When the train is in the braking state, the reversible converter can invert the braking energy back to the AC grid, and save energy. The overvoltage caused by regenerative braking can be suppressed effectively.
Since the diode rectifier and reversible converter will work in parallel, their work characteristic must be studied, respectively, and then a coordinated control strategy should be adopted.

3. Coordinated Control Strategy

3.1. Direct Current (DC) Output Characteristics of the 12-Pulse Rectifier

A 12-pulse rectifier can be equivalent to an ideal DC voltage source Uk in series with an internal resistance Req and a diode D, as shown in Figure 2.
The DC output characteristic curve of a 12-pulse rectifier is shown in Figure 3. The critical current (or transition current) Idg is bounded. The curve is divided into two curves: ① is the curve that two 6-pulse rectifiers work in a push-pull mode; ② is the curve that two six-pulse rectifiers work in parallel. Udoo denotes the no-load voltage of a 6-pulse rectifier, Udio denotes the ideal no-load DC voltage of a 12-pulse rectifier, UdN denotes the rated output voltage of a 12-pulse rectifier, IdN denotes the rated output voltage of a 12-pulse rectifier.

3.1.1. Curve ①

The DC voltage and current show typical 12-pulse characteristics. However, at every moment there is actually a single three-phase bridge rectifier at work. Its no-load voltage is
U doo = 1 π / 6 π 12 π 12 2 U 2 L cos θ d θ = 6 2 π × 2 U 2 L sin π 12 = 1.398 U 2 L
where U2L is the voltage effective value at the secondary side of the transformer. Thus, the mathematical model of the output curve ① can be described as
U dc = U doo 3 π X c I dc .
The equivalent resistance for curve ① is as follows:
R eq 1 = 3 2 π X c .

3.1.2. Curve ②

When the DC load current is larger than the critical current Idg, the output curve is shown as ②. The two six-pulse rectifiers work completely in parallel. The load is shared equally by them. The voltage Udio, which is the cross point of curve ② extended to vertical axis, is called the ideal no-load DC voltage. The voltage of Udio is equal to 1.35U2L.
Since the two six-pulse rectifiers work in parallel at the same time, the equivalent resistance for curve ② will be reduced to half of the curve ①, as follows:
R eq 2 = 3 2 π X c
The mathematical description of the curve ② is
U d = U dio 3 2 π X c I d .

3.2. DC Output Characteristic of the Reversible Converter

Typical DC output voltage characteristic of the reversible converter is constant. However, due to the demand of operating in parallel with the 12-pulse diode rectifier, it should have similar voltage droop characteristics.
That means DC output voltage will drop with the increase of DC current, as follows:
U dc = U k R dp × I dc
where Uk is the no-load output voltage for reversible converter. Rdp is the equivalent resistance.
A voltage droop control method based on output current feed-forward is presented in this paper, as shown in Figure 4. It includes three parts, which are called droop control, DC voltage control, and dq current control, respectively. Droop control is employed to calculate the target voltage Udc*, which decreases with the increase of the DC, complying with the law of Equation (5). The LIM1 will limit the value of the target DC voltage within the allowable range. DC voltage control adopts a classic proportional integral (PI) regulator without static error, so the influence of system parameter variation and external disturbance for the DC voltage can be eliminated, and the actual DC voltage can follow the target well. The output of the DC voltage control loop is the active current given value id*, which will be limited by LIM2, in order to avoid the overload of the reversible converter. The dq current control is based on rotating synchronous coordinates d-q. Thanks to the coordinate transformation, id and iq are DC components, and the PI compensator can reduce the error of the fundamental component to zero. With the proposed control method above, the linearity of the output curve can be guaranteed and strong system stability can be obtained.

3.3. Coordinated Control Strategy

Figure 5a shows the ideal scheme for output curves of the reversible converter and the 12-pulse diode rectifier. Udo is the ideal no-load DC voltage of both the 12-pulse diode rectifier and the reversible converter. ULIM is the DC voltage target value when the reversible converter works in the inverting state. A and B are the power limit points. With the increase of the train traction power, the DC voltage will drop fast. Above the voltage UB, the output curves are completely the same, and they share the traction load equally. However, because the value of Rdp will change with the output current, it will increase the difficulty of software implementation. Figure 5b shows a simplified scheme in which the value of Rdp is fixed.

4. Analysis of the DC Short-Circuit Characteristics of the Reversible Converter

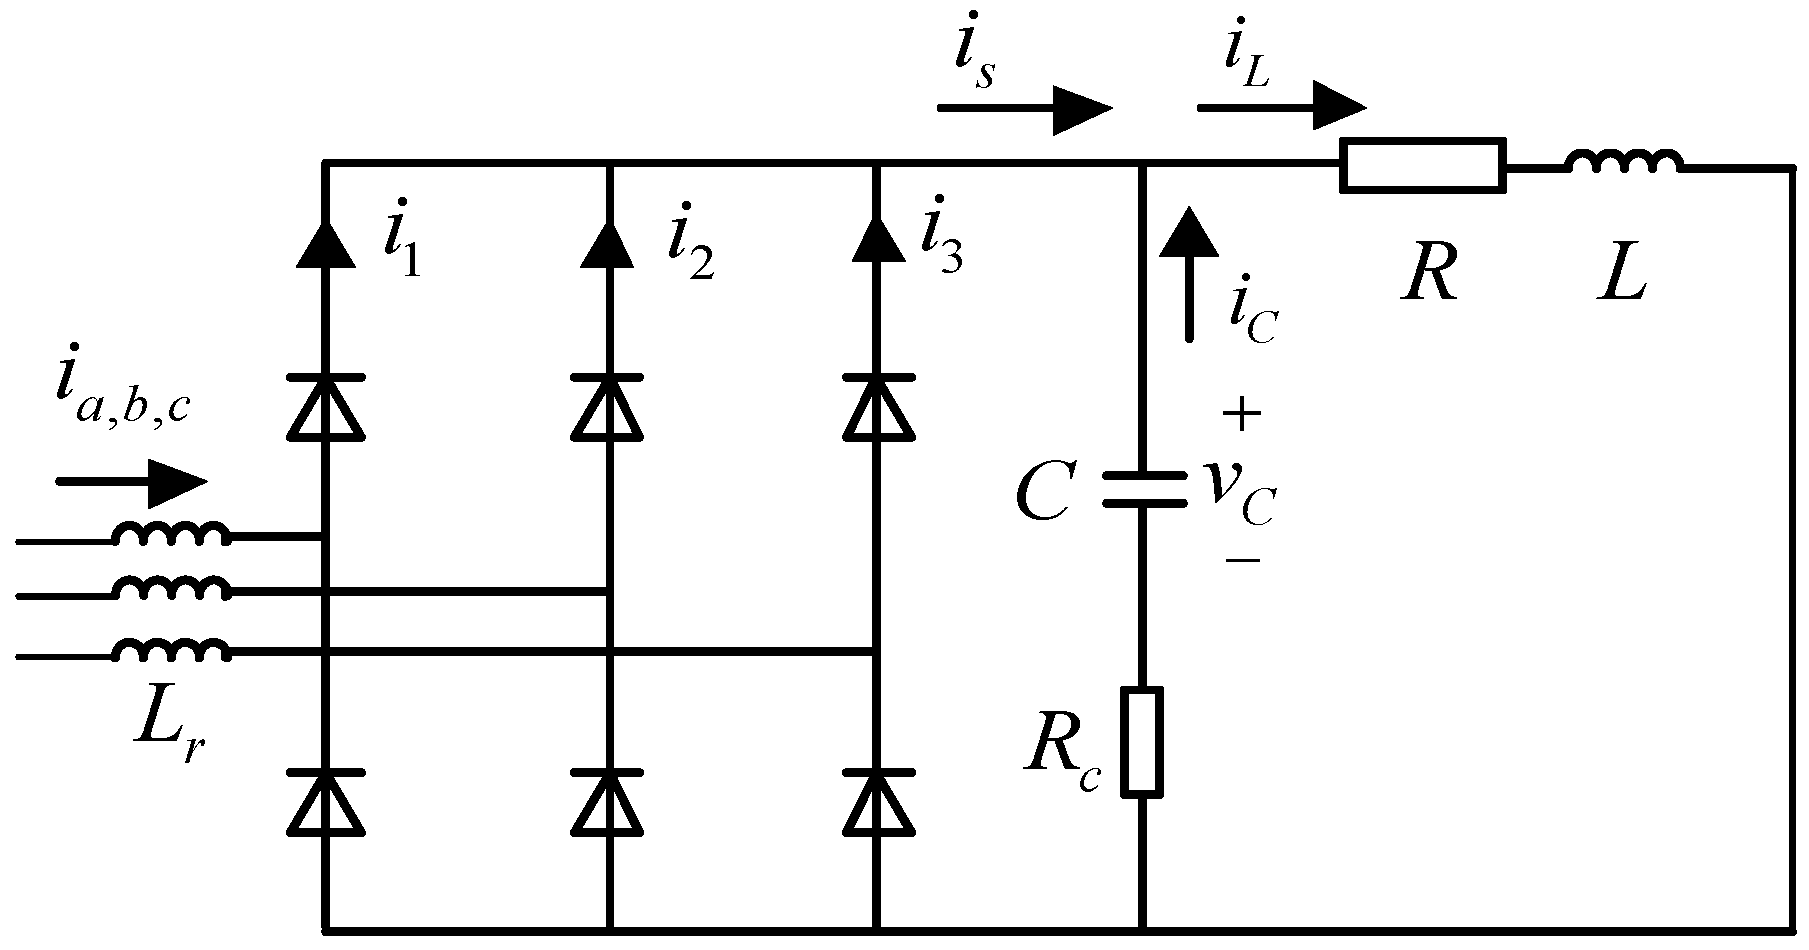
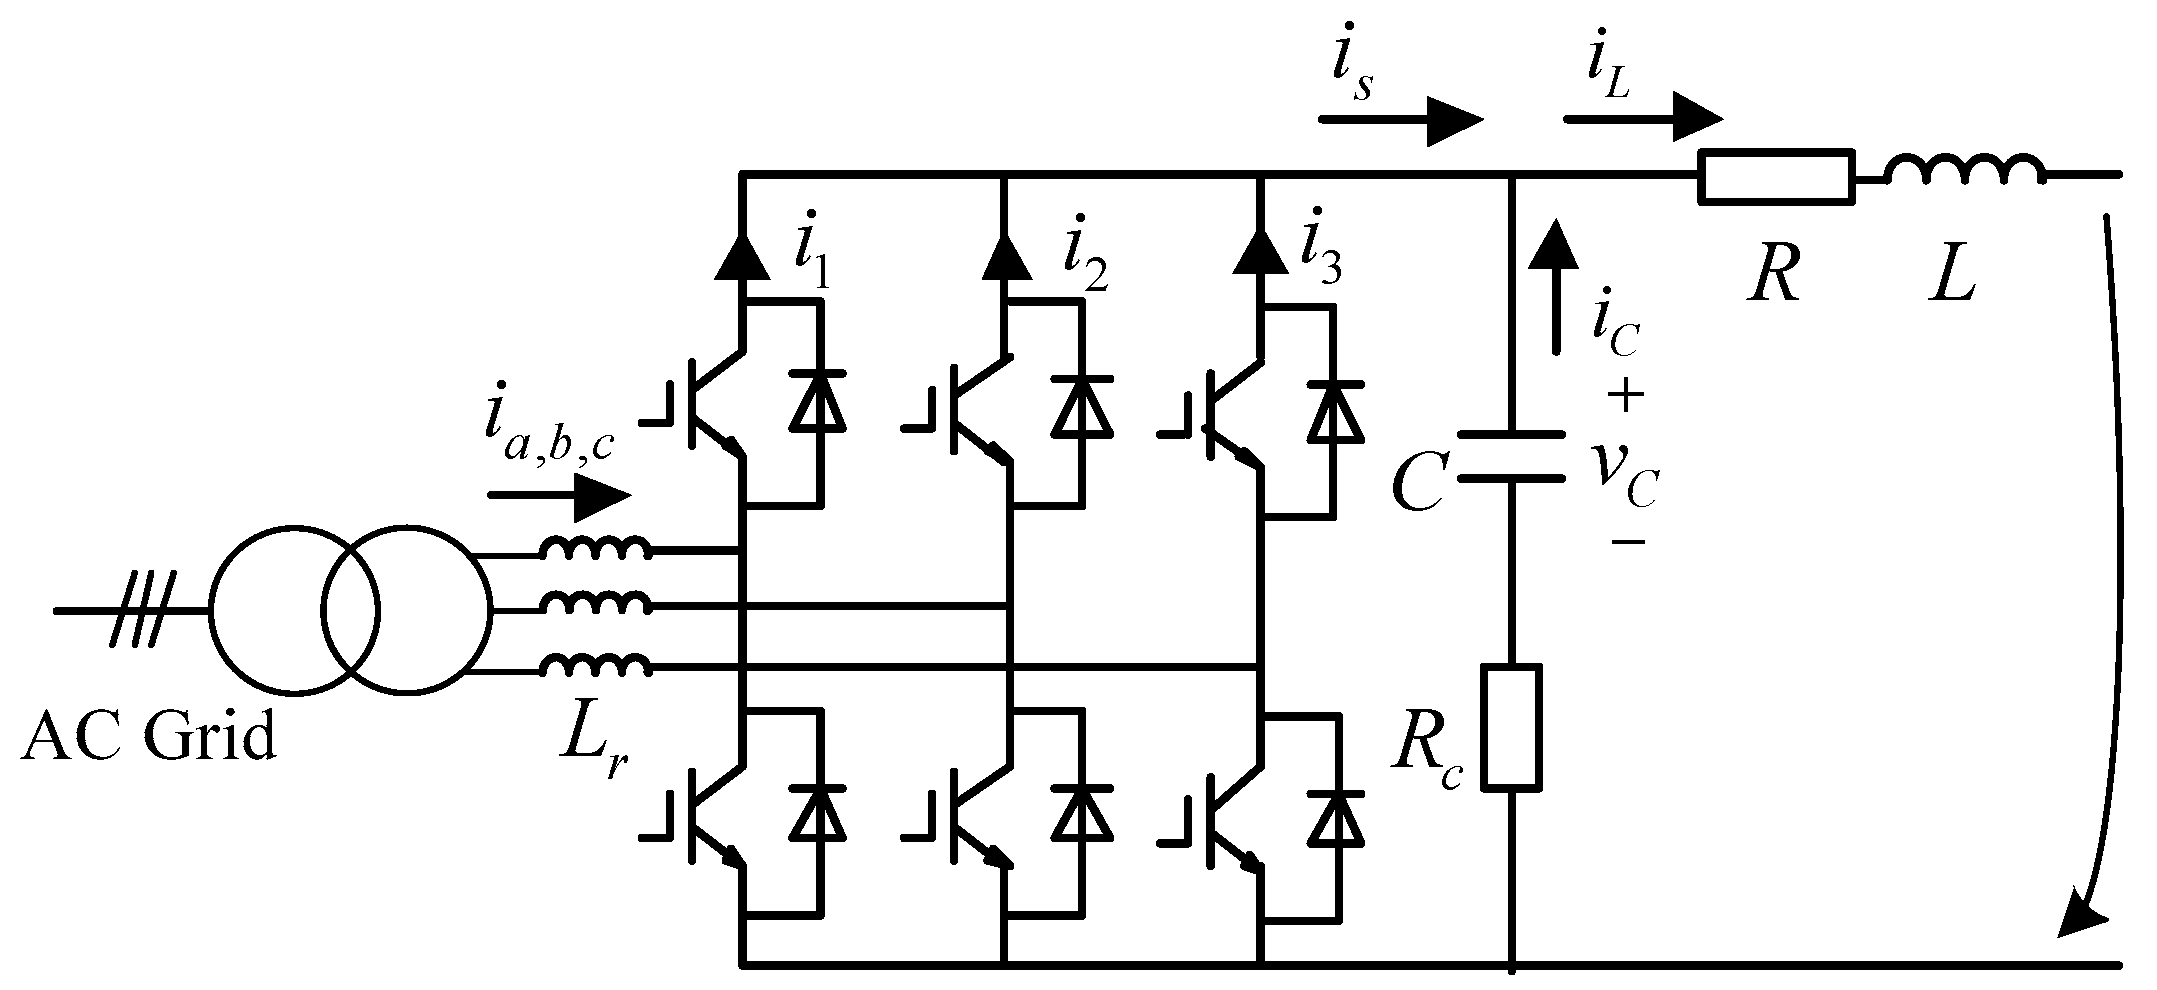
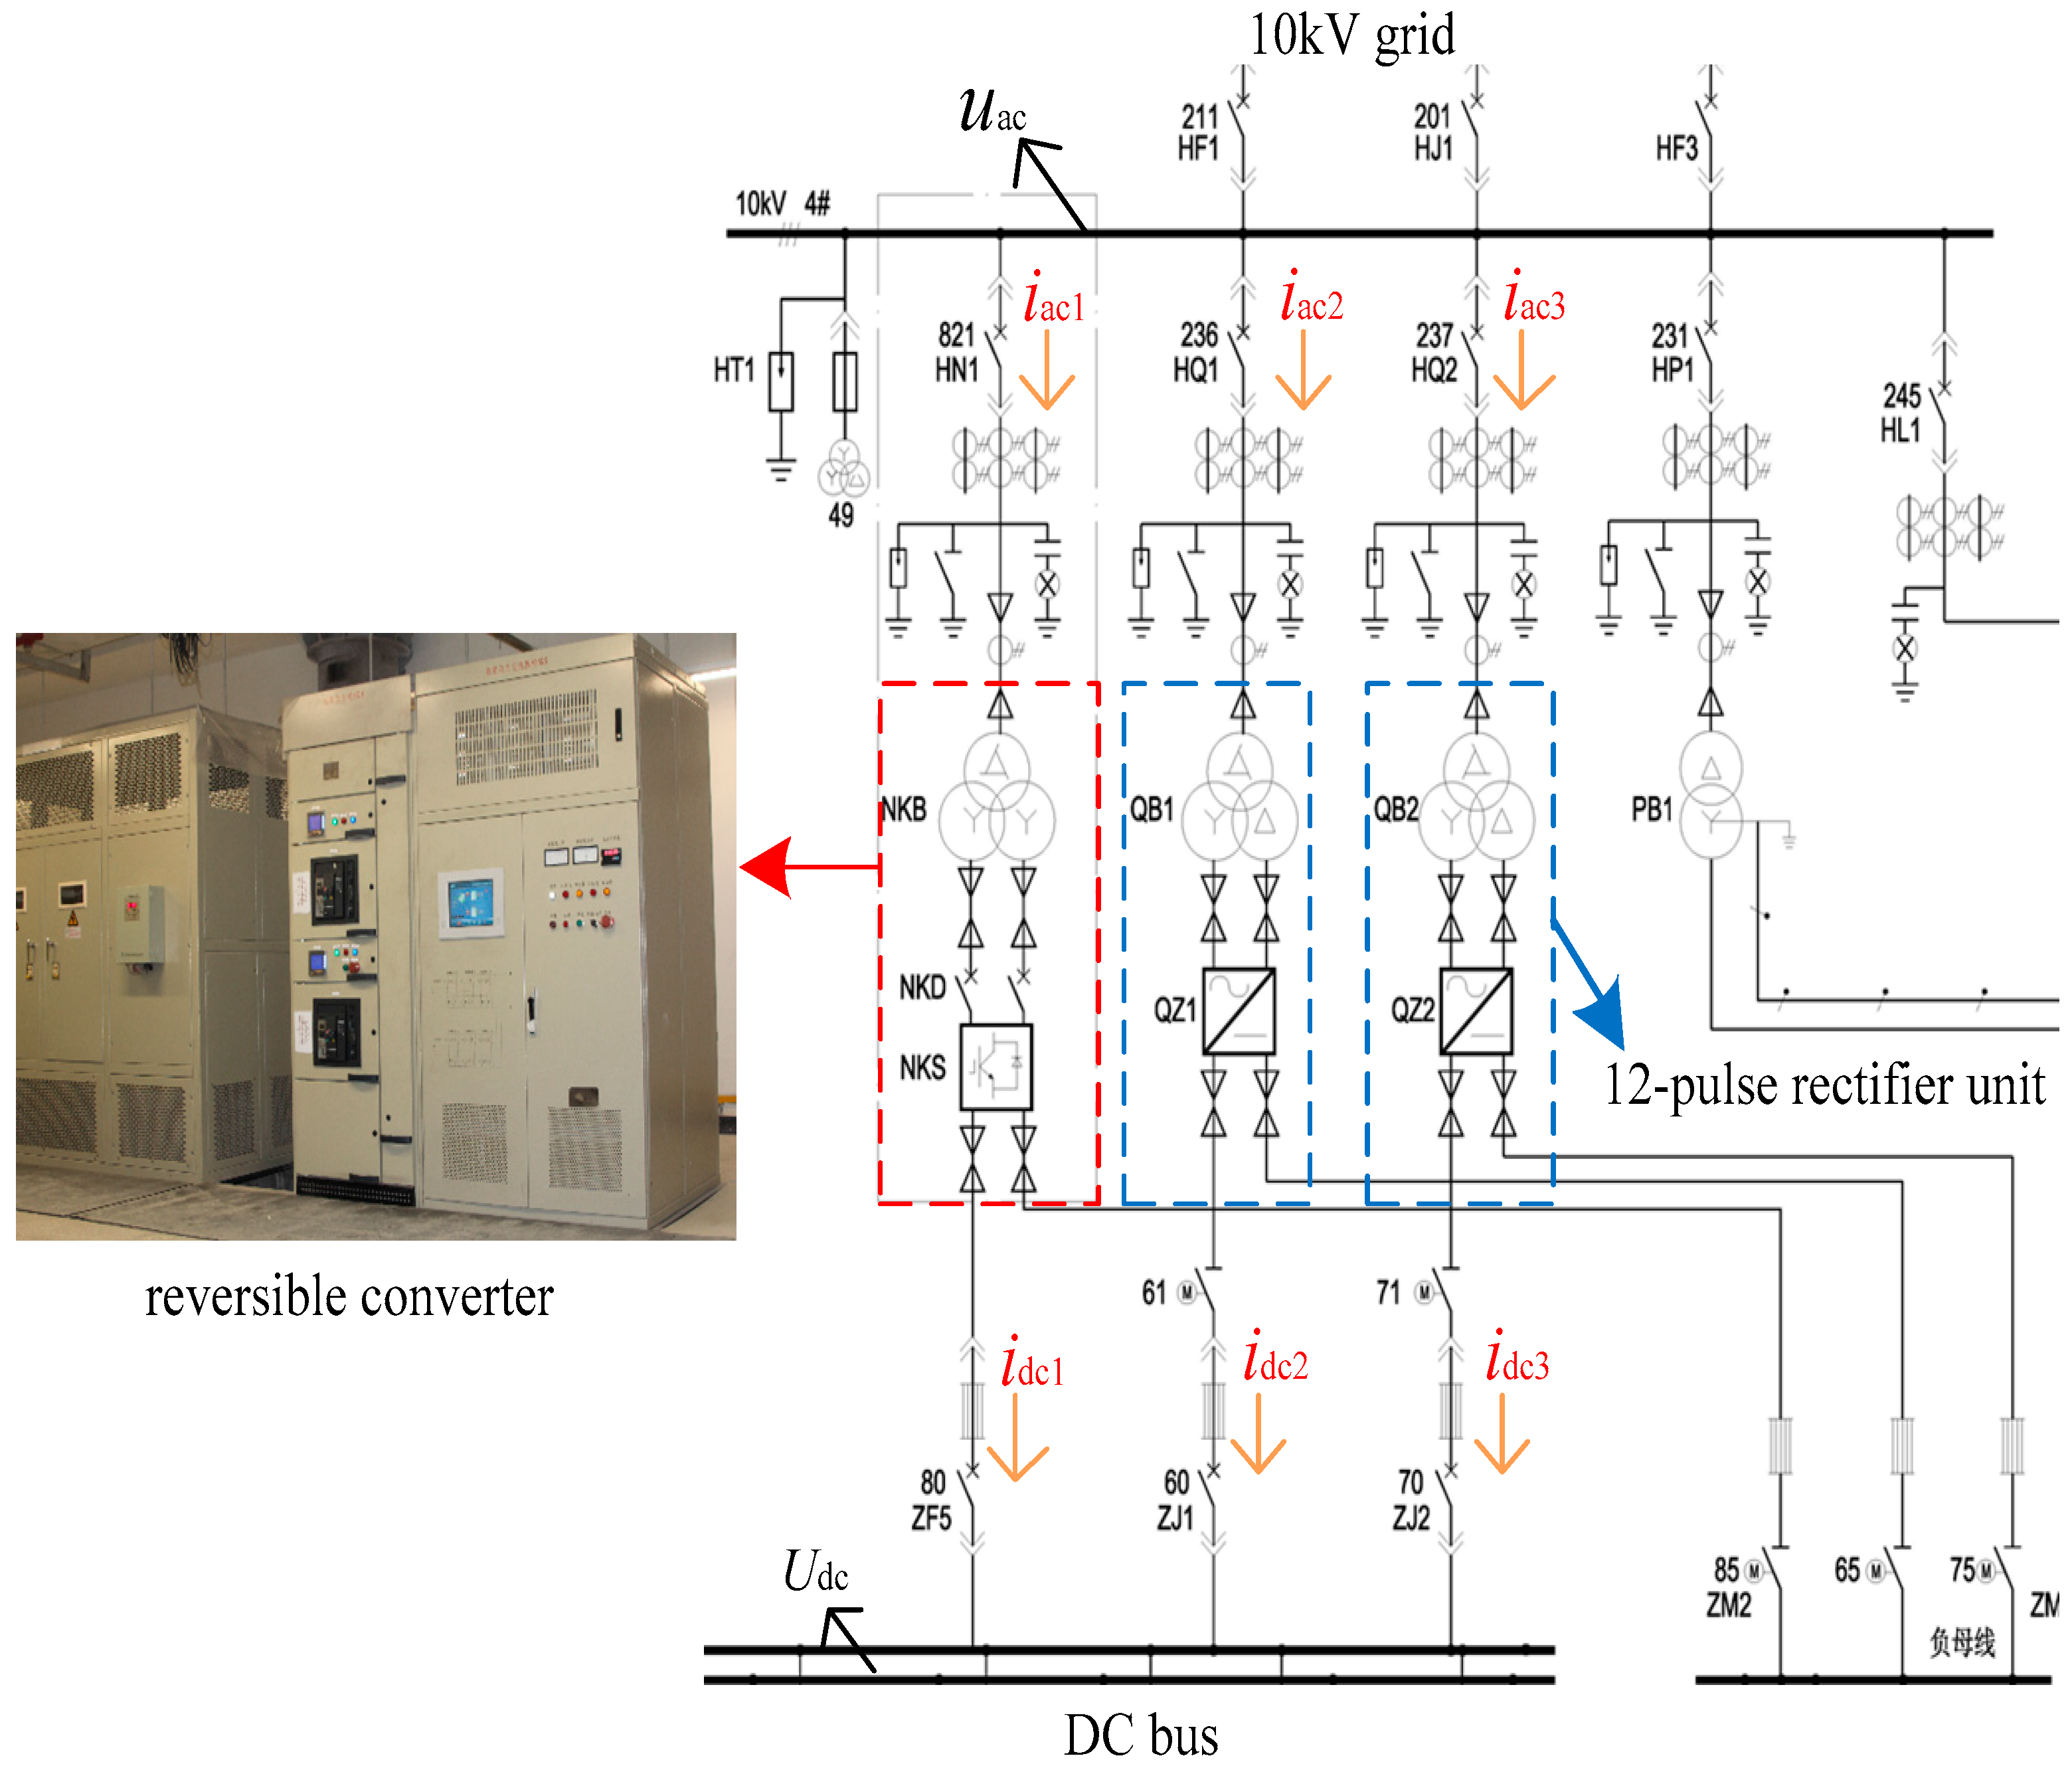
Figure 6 shows the DC short-circuit fault of the reversible converter. R and L are the equivalent resistance and inductance of the DC line, and the value of R and L varies according to the position of the short-circuit point from the converter DC output. C is the DC capacitor of the converter. Lr is the AC filter inductance. Rc is the equivalent series resistance of the DC capacitor C. It can be seen that it is a complex nonlinear circuit when a DC short-circuit fault occurs. The whole period can be divided into the following three stages [29].

4.1. Stage of Resistance-Inductance-Capacitor (RLC) Second-Order Response

In this stage, the DC short-circuit fault occurs instantly, the capacitor C discharges quickly, and the DC voltage drops quickly from the initial value to zero. The DC fault current correspondingly rises rapidly. During this period, (R + Rc), L and C constitute an Resistance-Inductance-Capacitor (RLC) series second-order circuit. The C and L have initial values when the DC short-circuit fault occurs. Due to the presence of the AC inductor 
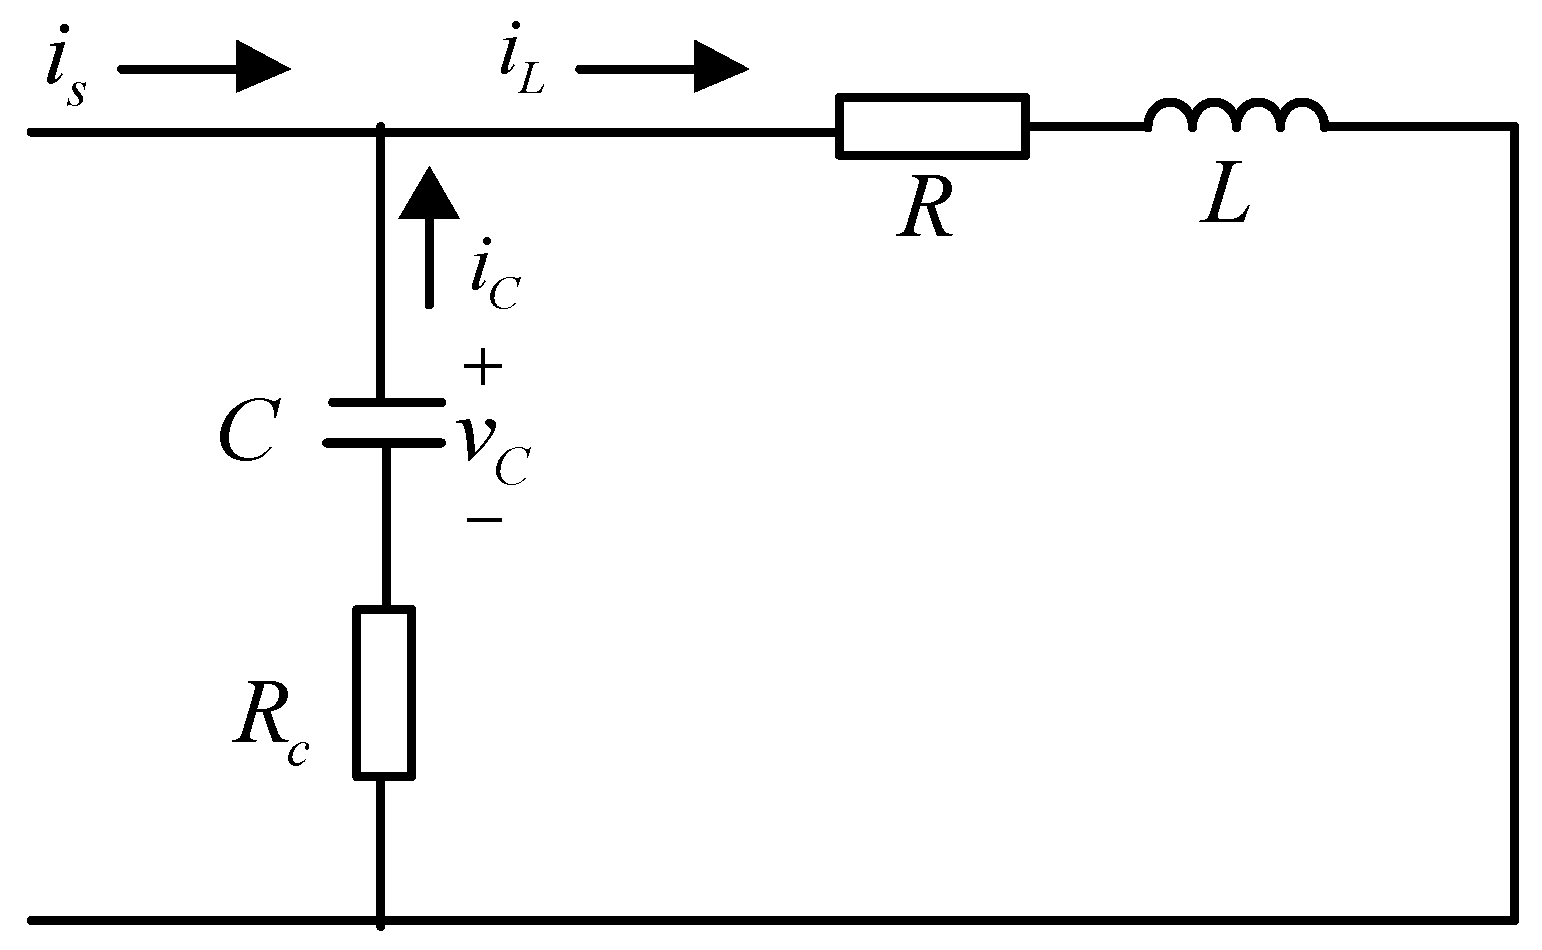
Lr, the three-phase AC current cannot be mutated, but flows through the six anti-parallel diodes, so there is an external excitation current to the second-order RLC circuit. As shown in Figure 7, this stage can be seen as a full response (including zero-input response and zero-state response) process of the RLC series circuit.
Zero input response process: Regardless of the influence of the AC system (without considering the is), it is the zero-input response process of the RLC second-order circuit. From Kirchhoff Voltage Laws (KVL):
L C d 2 v c d t 2 + ( R   +   R c ) C d v c d t + v c = 0 .
According to the relationship of (R + Rc) and 2 L / C , Equation (6) may have different solutions, considering R and Rc are small, this paper only analyses ( R + R c ) < 2 L / C .
Assume that the short circuit fault occurs at moment t0, the initial condition is vc(t0) = V0, iL(t0) = I0. The circuit is in the oscillation discharge process and, from Equation (6), the zero-input response components of the DC side voltage and current after fault are as follows:
v c = V 0 ω 0 ω e δ t sin ( ω t + β ) I 0 ω C d e δ t sin ( ω t )
i L 1 = C d v c d t = I 0 ω 0 ω e δ t sin ( ω t β ) + V 0 ω L e δ t sin ( ω t ) ω 2 = 1 L C ( R + R c 2 L ) 2 ,   δ = R + R c 2 L ,   ω 0 = δ 2 + ω 2 = 1 L C ,   β = arctan ω δ .
From Equation (7), when C discharges to zero, that is, vc = 0, the instant time is
t 1 = t 0 + γ ω ,   γ = arctan [ ( V 0 ω 0 C d sin β ) / ( I 0 V 0 ω 0 C d cos β ) ] .
Substituting Equation (9) into Equation (8):
i L 1 ( t 1 ) = I 0 ω 0 ω e δ ( γ ω ) sin ( γ β ) + V 0 ω L e δ ( γ ω ) sin γ .
Generally, when a metal short-circuit fault occurs in the DC line, ( ( R + R c ) / 2 L ) 2 is far smaller than 1/LC, It can be assumed that ω = ω 0 , that is, the zero-input response component of the DC inductor current can be reduced to
i L 1 = e δ t ( V 0 C L sin ω t + I 0 cos ω t ) .
Making θ = arctan ( I 0 V 0 L C ) ; then Equation (11) becomes
i L 1 = e ( R + R c 2 L ) t [ C L V 0 2 + I 0 2 sin ( ω t + θ ) ] .
Zero state response process: As shown in Figure 7, assume that there is no initial value on C and L. The current supplied to the DC side by the AC system is regarded as a constant value is. At this moment, it can be considered that the RLC second-order circuit is in the process of zero-state response, and from Kirchhoff Current Laws (KCL),
L C d 2 i L 2 d t 2 + ( R + R c ) C d i L 2 d t + i L 2 = i s .
Equation (13) can be solved the same way as calculating the zero-state response. The zero-state response of the DC inductor current can be obtained as
i L 2 = I s I s e δ t sin ( ω t + β ) I s ( R + R c ) 2 L ω e δ t sin ( ω t ) = I s I s e δ t sin ( ω t + β ) I s ( R + R c ) 2 C L e δ t sin ( ω t )
where the δ , ω , β is the same as in Equation (8).
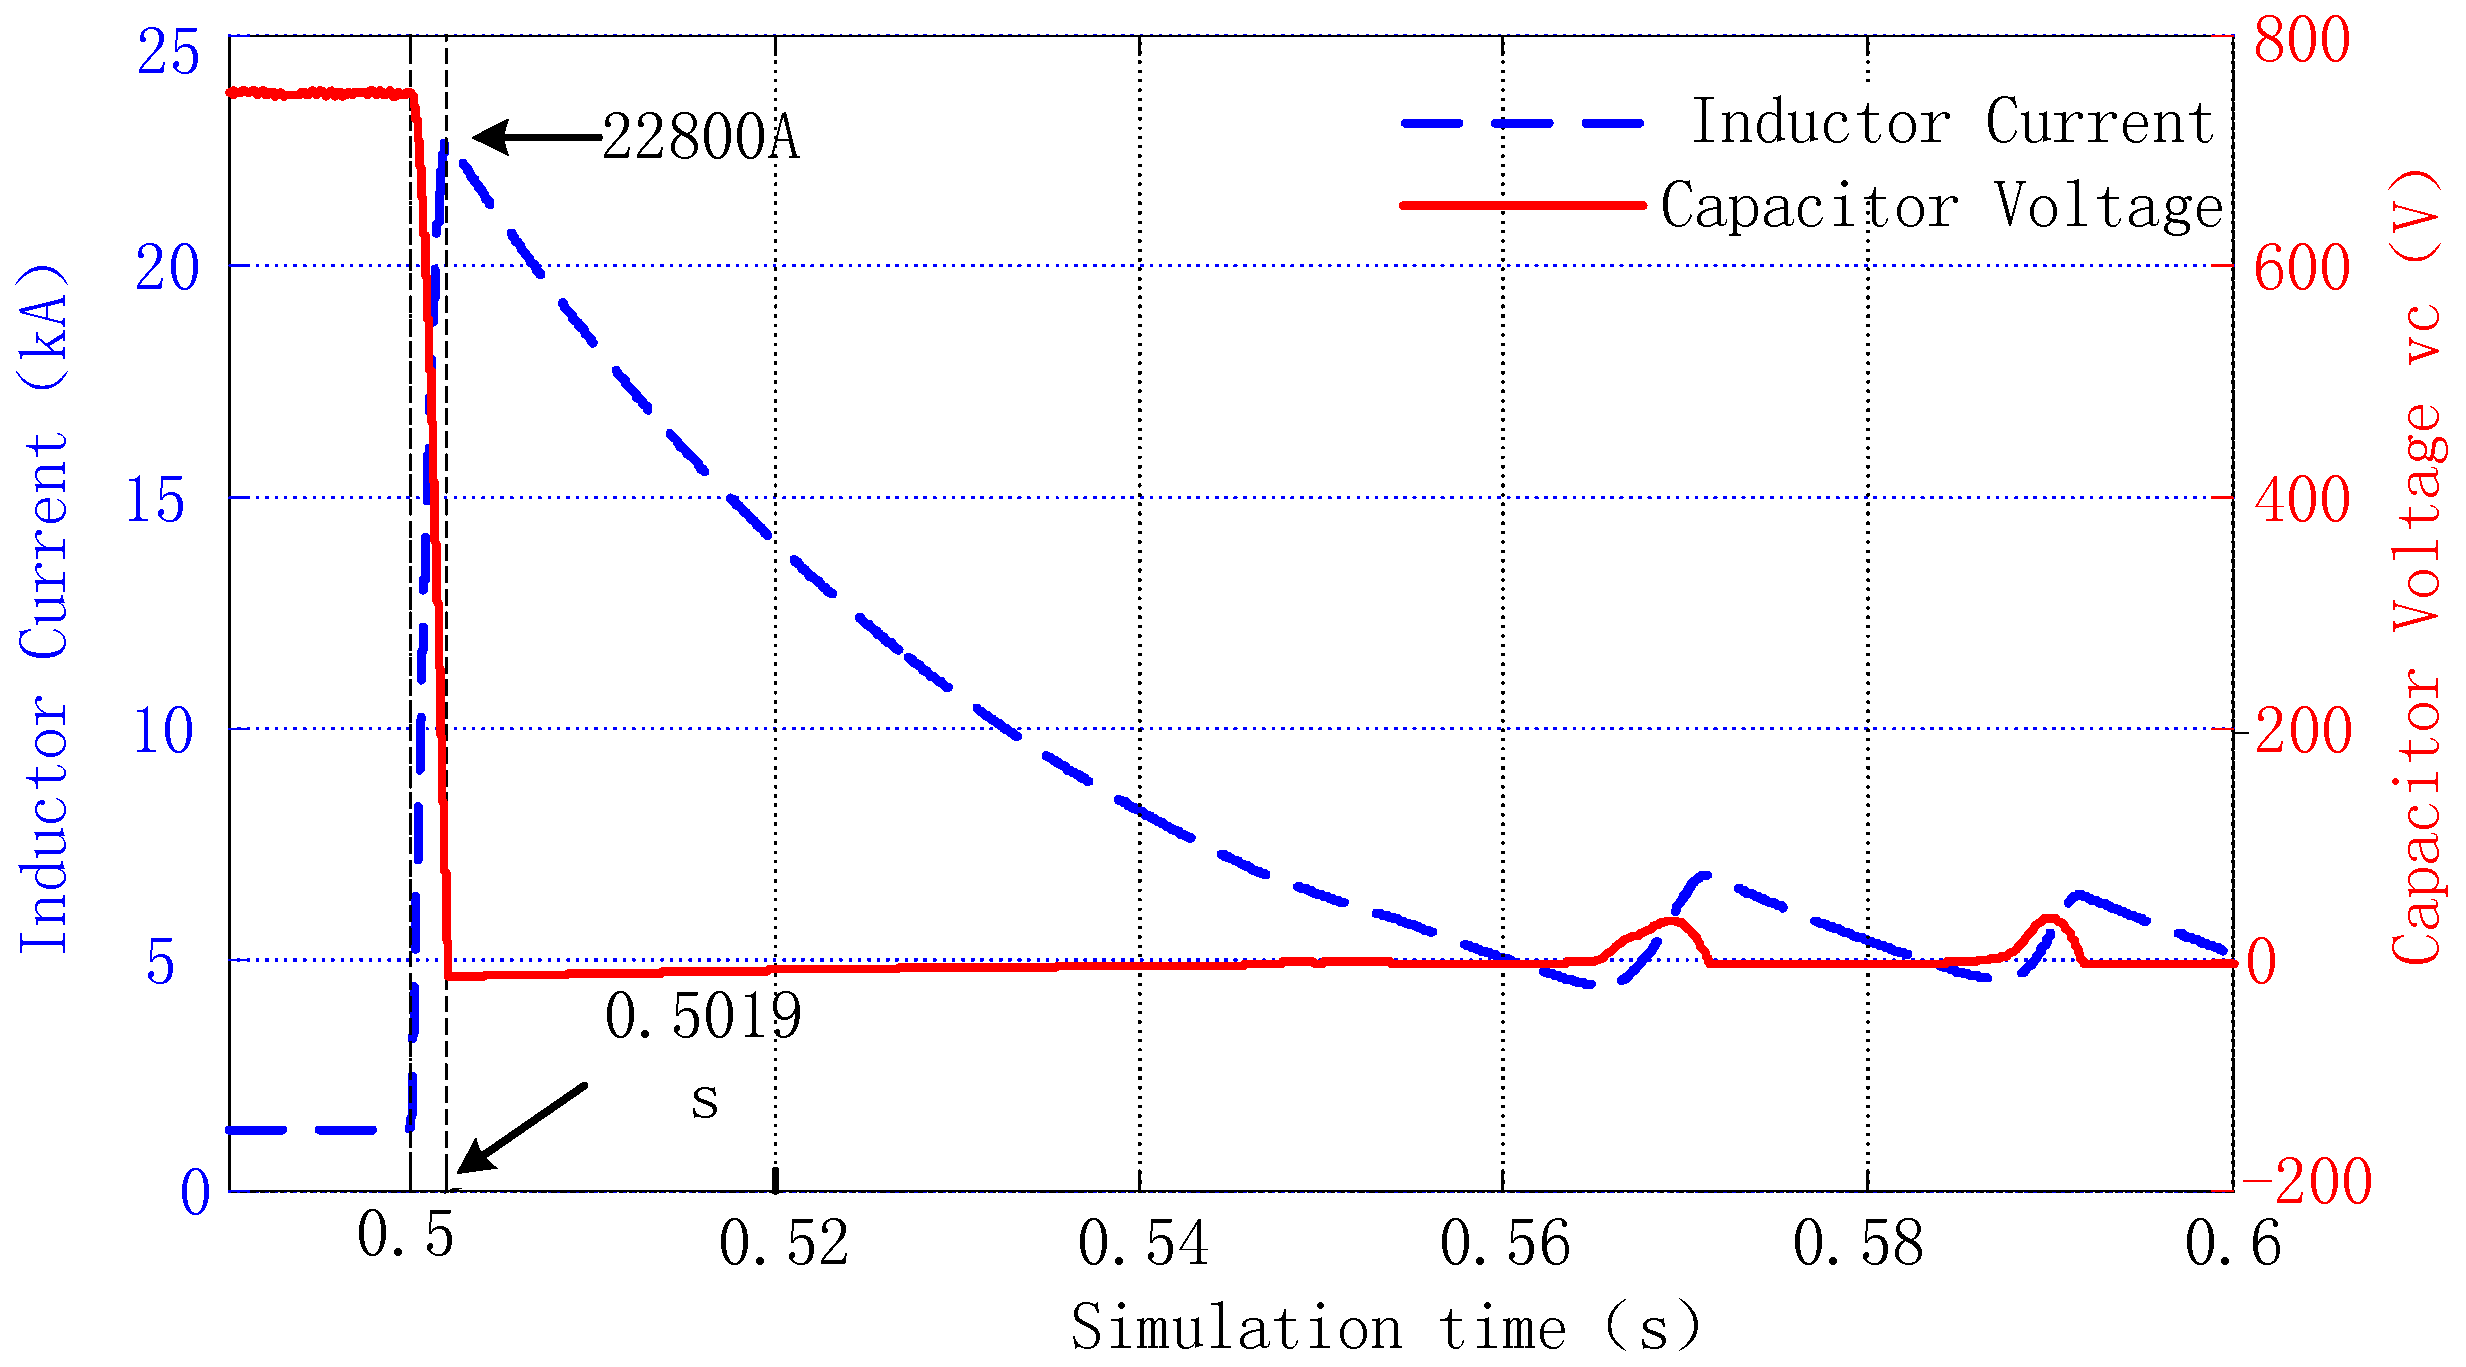
The DC inductor current in this stage is the sum of the zero-input response component and the zero-state response component from Equations (12) and (14), that is
i L = i L 1 + i L 2 .
From Equations (12), (14) and (15), it can be seen that the DC inductor current iL is composed of two parts in this stage. Since the zero-input response component is of a large proportion, when the zero-input response component reaches its peak value, the total DC inductor current also reaches the peak value, and the following conclusions can be obtained: When a DC short-circuit fault occurs, the larger the initial DC voltage V0 of C and the initial current I0 of L are, the higher the peak value of the DC inductor will be. When the initial values of DC voltage and DC inductor current are constant, the peak current of the DC inductor will increase with the increase of DC capacity C, but decrease with the decrease of DC line inductance L. This is because, under a certain DC voltage, the larger the capacitance value is, the more electric field energy can be released by the capacitor C after the short-circuit fault, and the more electromagnetic energy stored in the inductor, the larger the DC inductor current peak value can reach. The smaller the inductance value is, the greater the current required to store the same energy, and the larger the current is, the greater the total inductor current peak value will be.

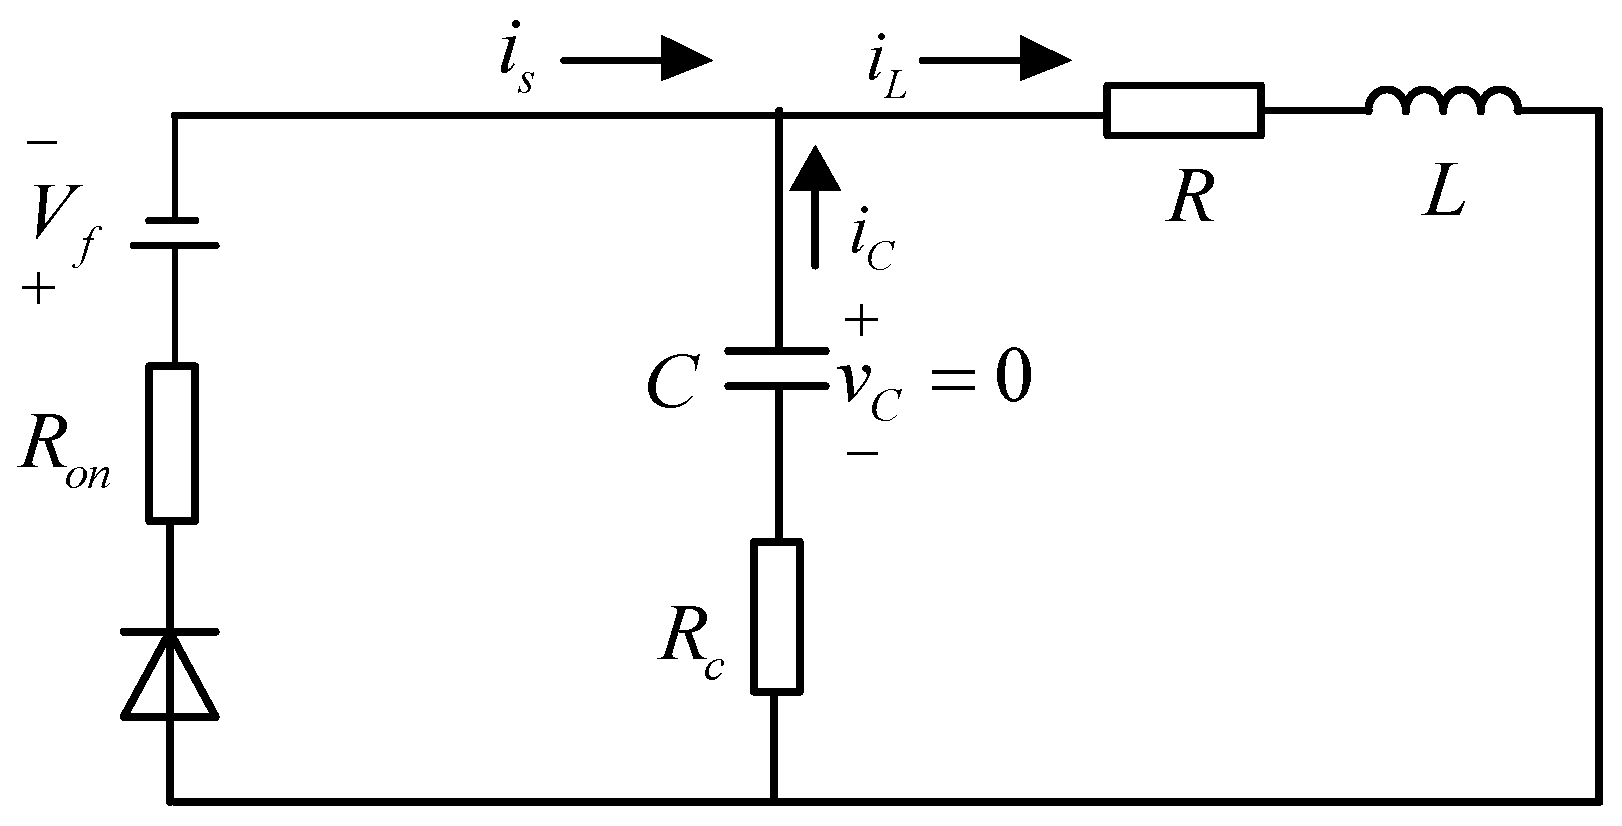
4.2. Stage of Resistance-Inductance-Diode (RLD) First-Order Response

This stage begins with the capacitor DC voltage falling to zero, and continues until the capacitor is recharged. When vc > 0, the capacitor discharges and the current flows through the line impedance. With the capacitor discharge, DC voltage vc will decrease. When vc drops to zero, that is moment t1, the inductor begins to discharge, and the fault current will flow through the anti-parallel diodes of the three-phase bridge, assuming that the initial condition is iL(t1) = I0′. The equivalent circuit is shown in Figure 8, the Ron is the total equivalent internal resistance of the six anti-parallel diodes, and Vf is the their total turn-on voltage drop.
At this moment, the circuit becomes a first-order circuit and the DC inductor current decreases with the exponential law as follows:
i L ( t ) = I 0 e ( ( R + R on ) / L ) t .
This process is the most dangerous time for the diodes, because there is a large inductor discharge current suddenly flowing through the diodes in this period, and the diodes can be damaged instantly because of the large initial current. Therefore, the diode over-current capability should be considered in the selection of switching devices.
The time that capacitor C discharges to zero, and the value of the short-circuit current at that time, can be simplified as
t 1 = t 0 + γ ω = t 0 + L C arctan ( V 0 I 0 C L )
i L ( t 1 ) = i L 1 ( t 1 ) + i L 2 ( t 1 ) = e δ t 1 C L V 0 2 + I 0 2 + I s I s e δ t 1 cos γ I s ( R + R c ) C 2 L e δ t 1 sin γ
where γ = arctan ( V 0 I 0 C L ) , ω = 1 L C , δ = R + R c 2 L .
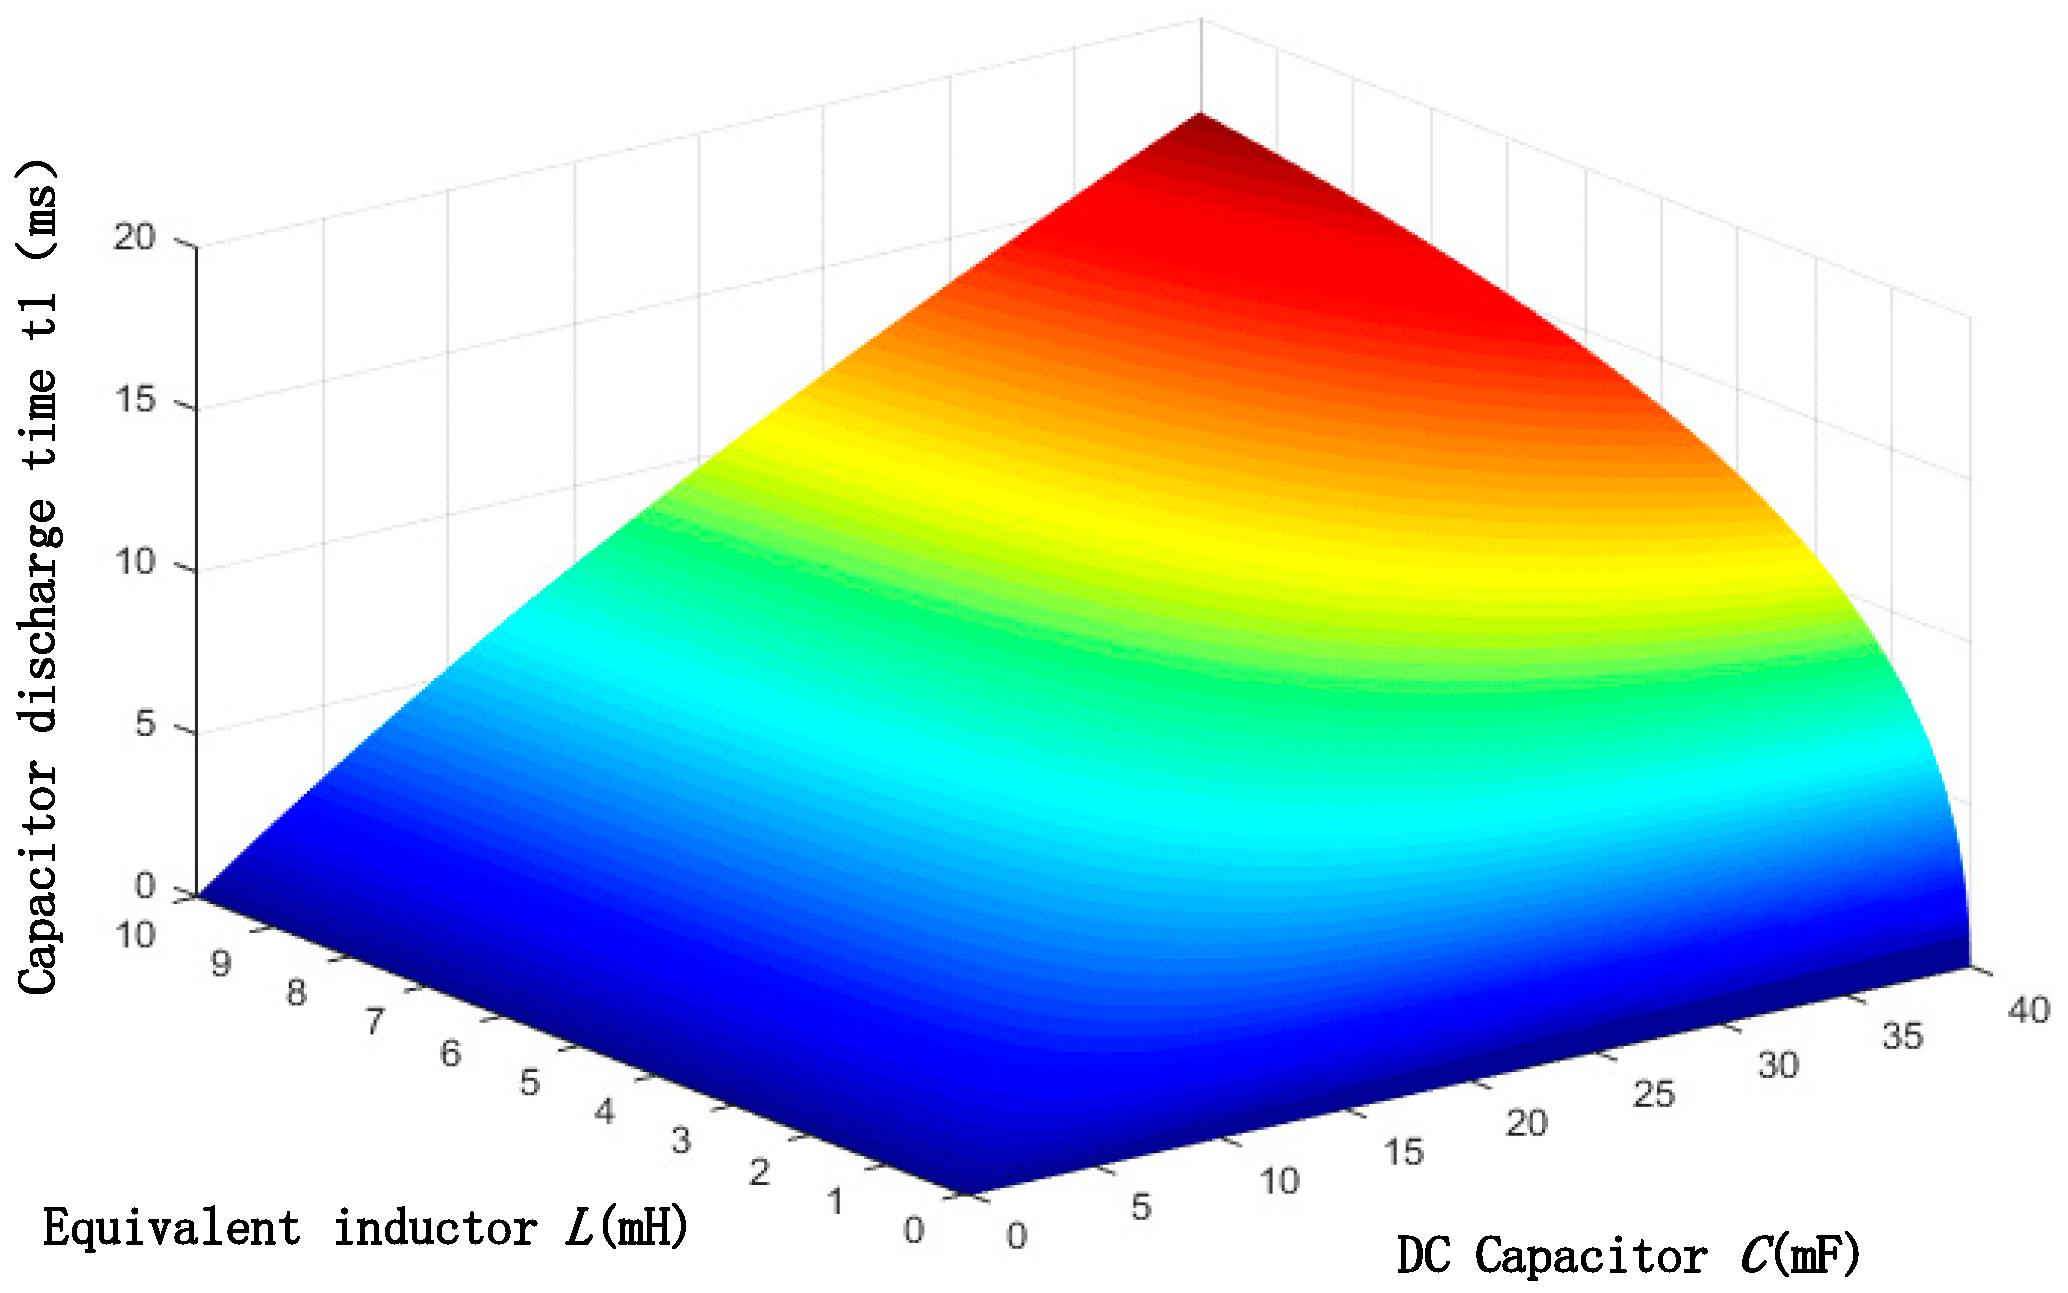
From Equation (17), the time of capacitor C discharging to zero, that is, the maximum over-current time of the diode, is related to the value of L and C, as well as V0 and I0. The relationships among capacitance discharge time, inductance value, and capacitance value are shown in Figure 9 when V0 = 750 V, and I0 = 1300 A. It can be seen that the capacitor discharge time will increase with the increase of the total inductance value and capacitance value.
It can be seen from Equation (18) that the inductor peak current is related to the value of L and C, as well as V0, I0 and Is at the fault instant. The relationships among the inductor peak current, inductance value, and capacitance value are shown in Figure 10, when V0 = 750 V, I0 = 1300 A, and Is = 1800 A. It can be seen that the inductor peak current increases with the increase of the capacitance value, and decreases with the increase of the total inductance, which is in accordance with the analysis conclusions in Section 4.1.
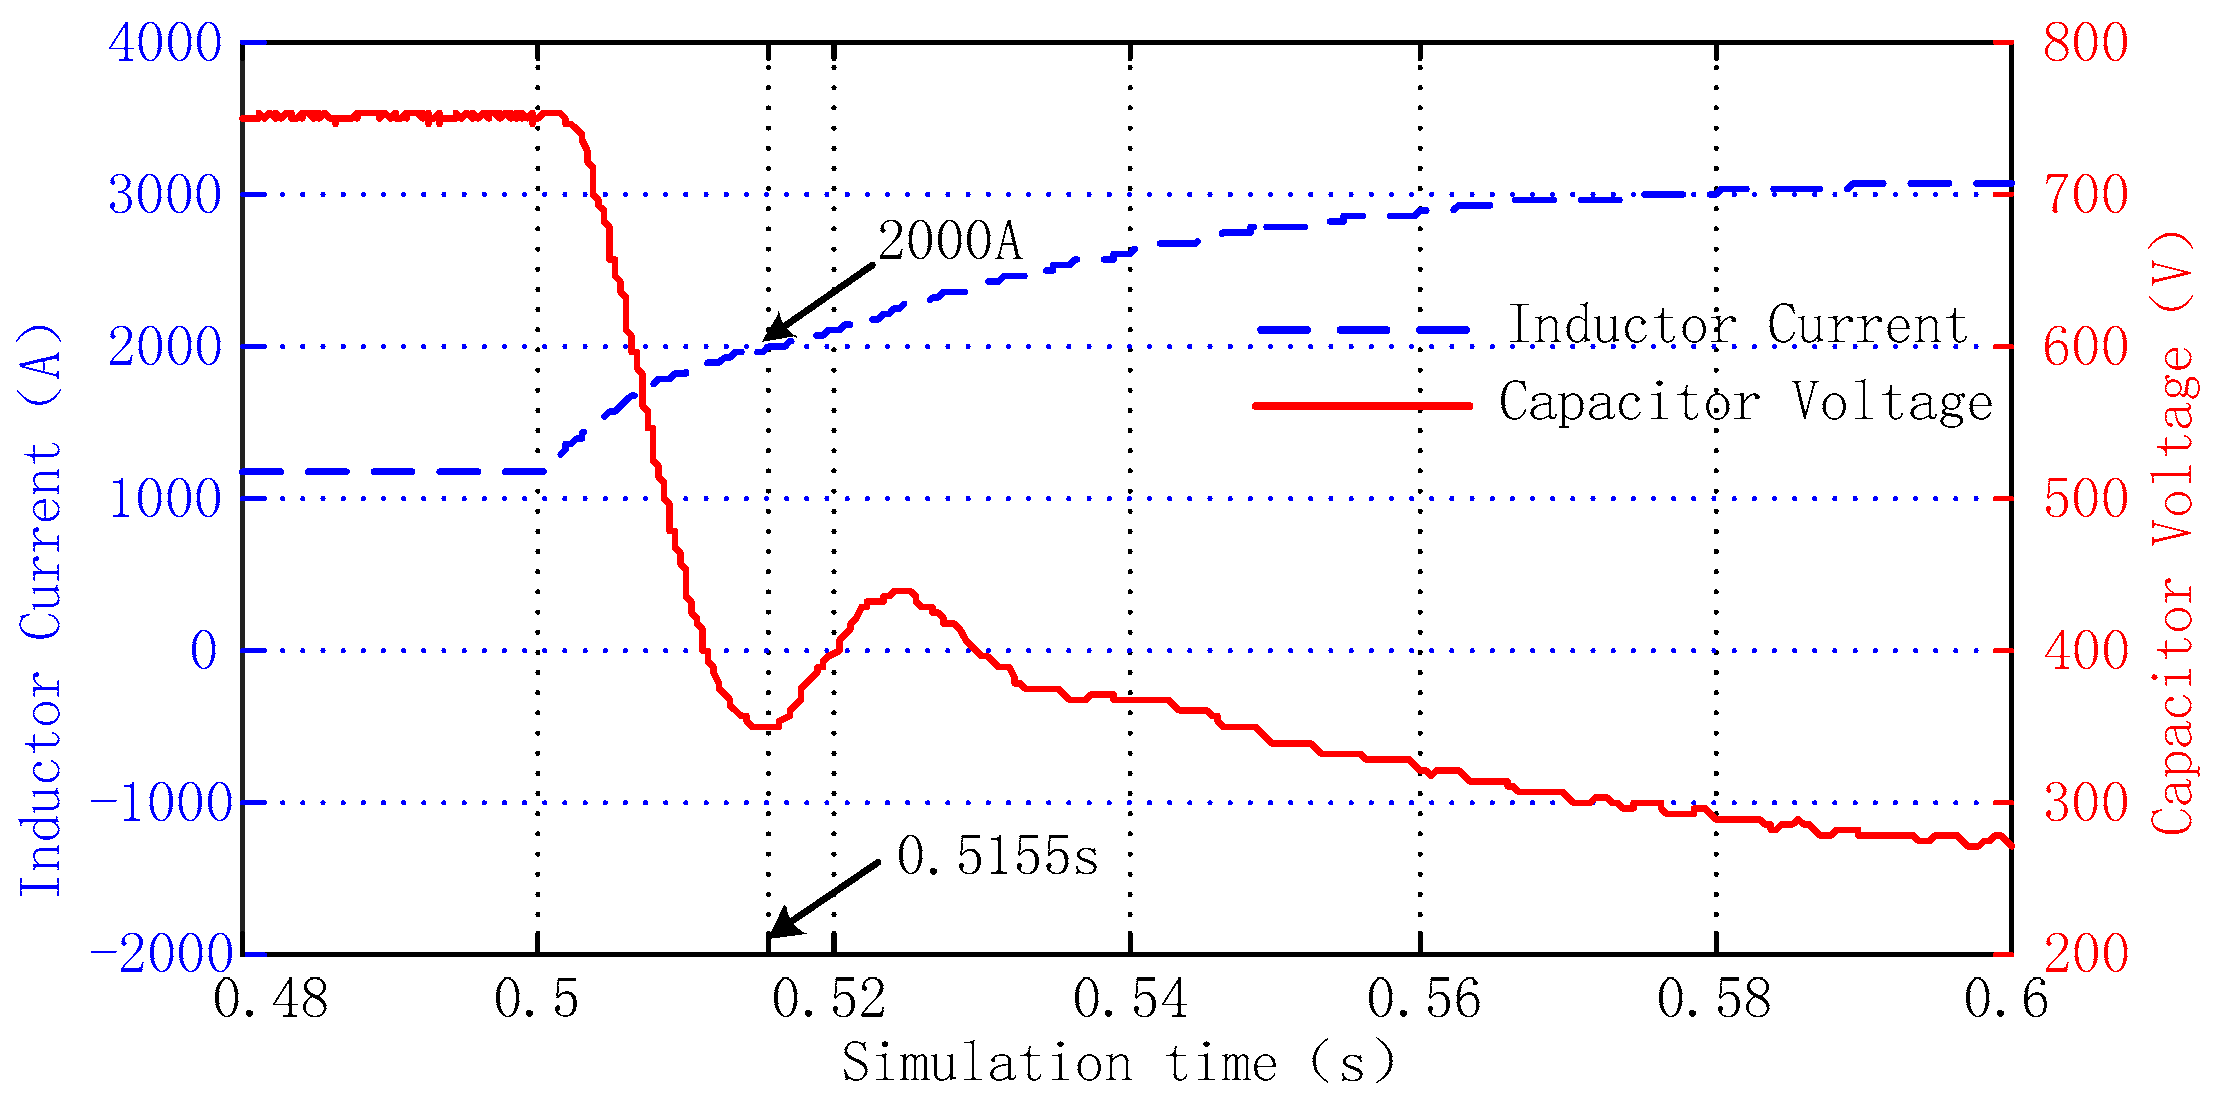
The discharge time of the DC capacitor and the inductor peak current are analyzed by the RLC second-order discharge circuit. It can be seen from Equation (16) that the peak current begins to discharge as the initial current in the RLD first-order response. The AC system provides current for the DC side through the diode in the actual first-order discharge process, so the actual DC inductor current should be the sum of the inductor discharge current and AC system supply current. As the DC inductor current decays and the AC grid current increases, the capacitor starts charging again and the DC voltage increases at the same time.

4.3. Stage of the Uncontrolled Rectification

When a short-circuit fault occurs, the reversible converter cannot be immediately separated from the AC and DC network by breakers. As a result, the anti-parallel diodes will form a three-phase bridge rectifier circuit, and the AC system will continue to deliver power to the DC side until the breakers open, as shown in Figure 11.
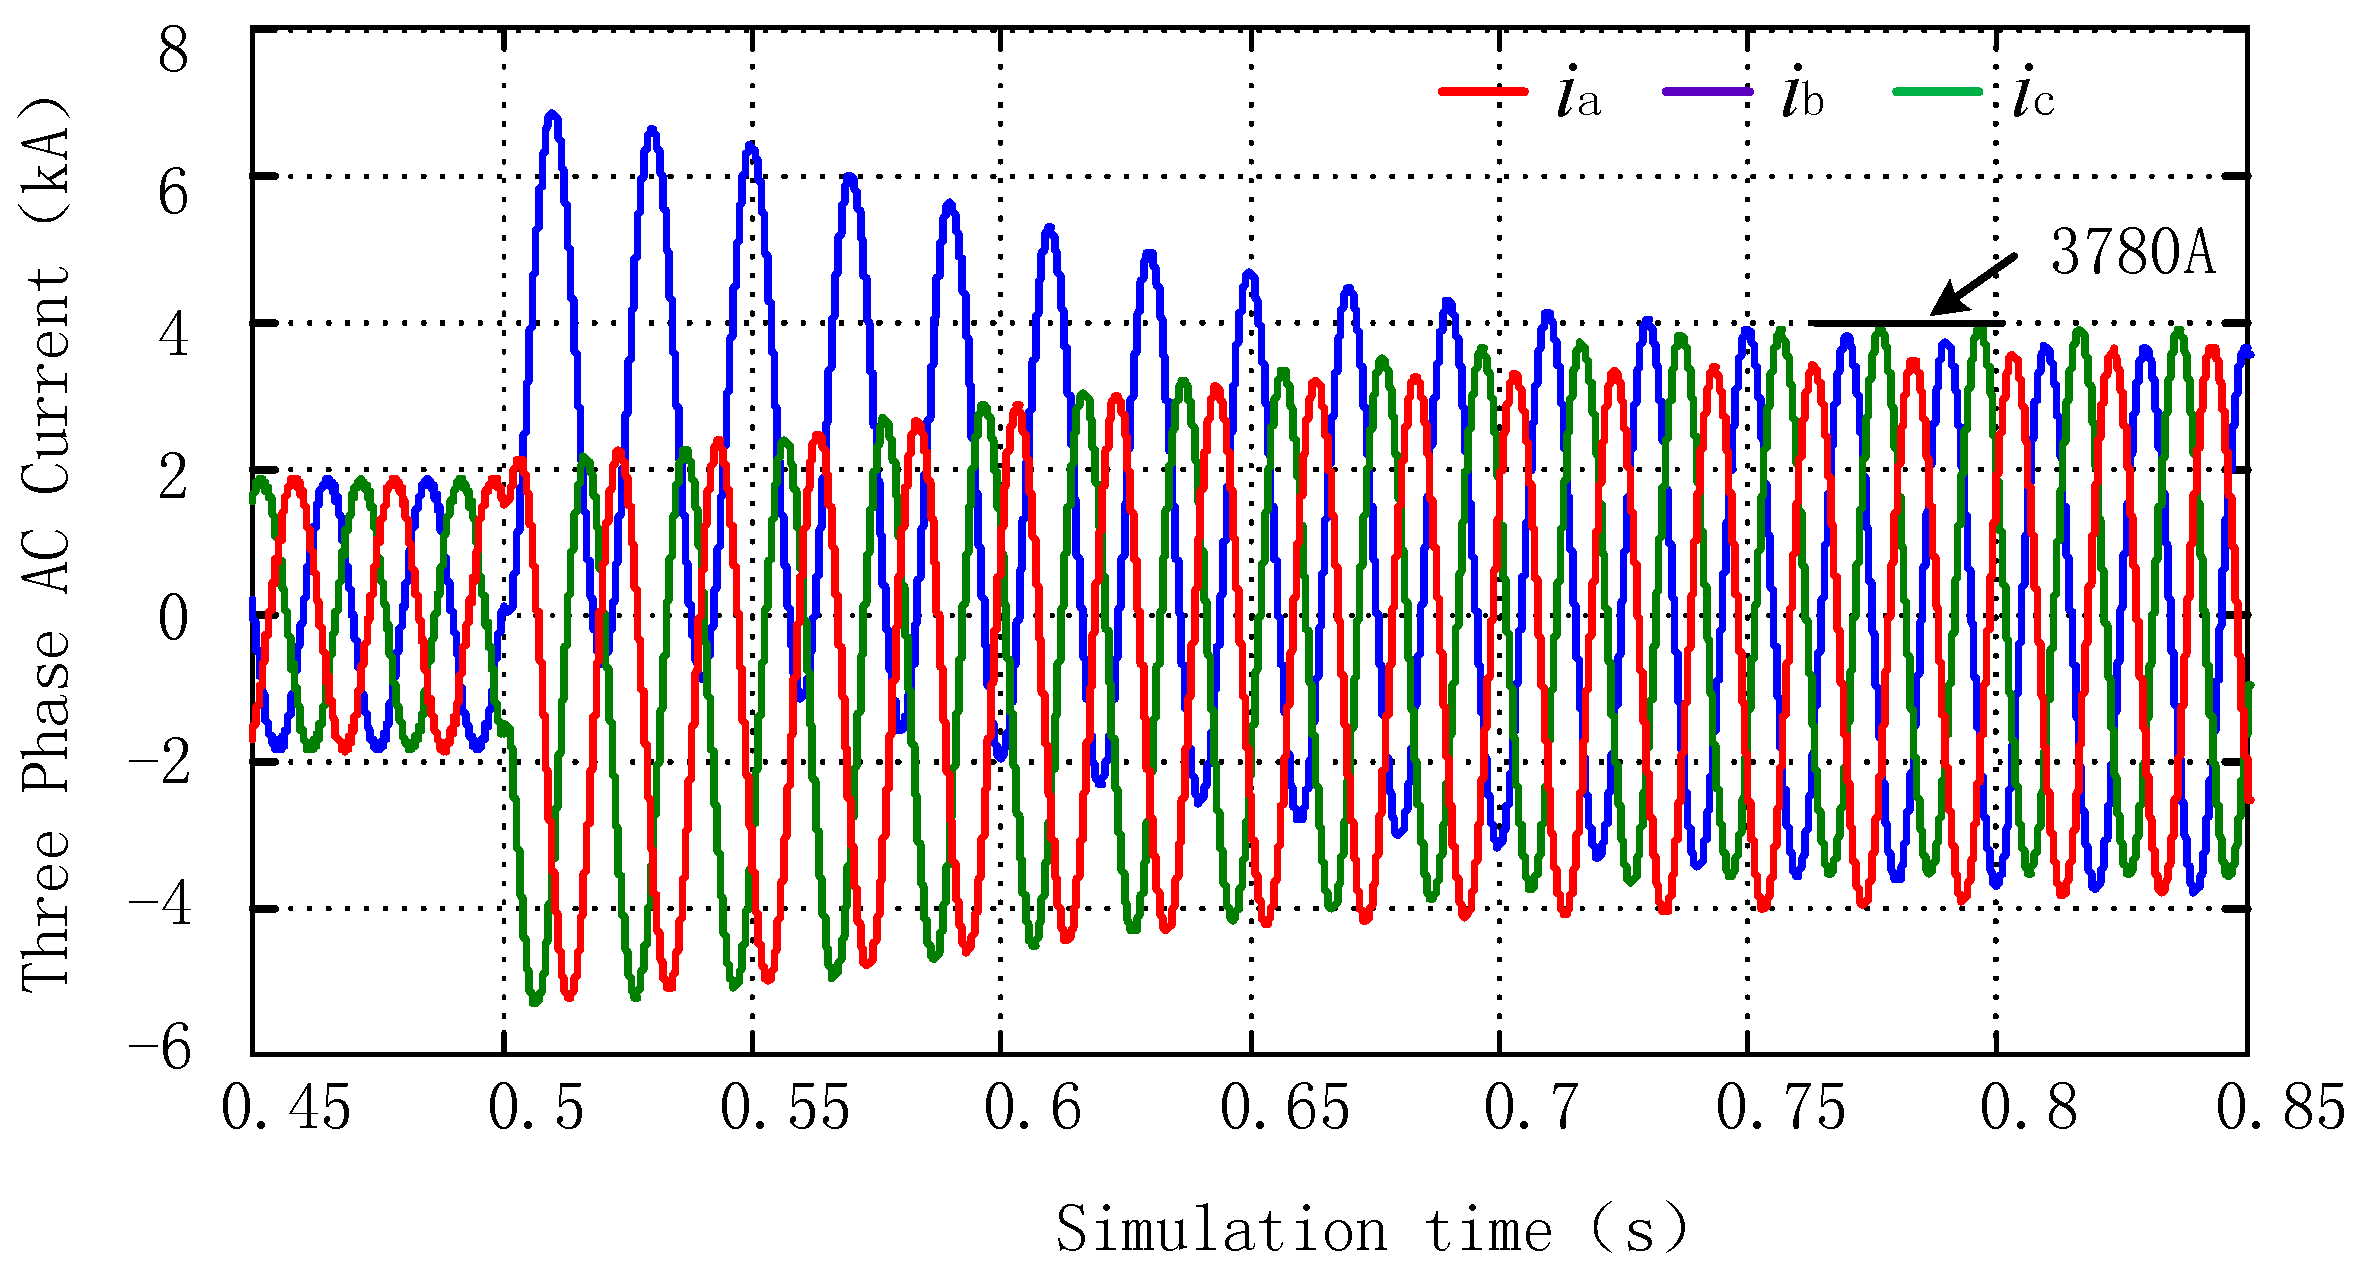
The system is equivalent to a three-phase uncontrolled rectifier working in the DC-side short-circuit state. The short-circuit current can be calculated by the transient analysis method. Assume that the phase current before short-circuit occurs is as follows:
i a | 0 | = I m | 0 | sin ( ω t + α φ | 0 | )
where I m | 0 | is the current amplitude, ω is the synchronous angular frequency, α is the phase angle, and φ | 0 | is the impedance angle.
Three-phase short-circuit current can be obtained:
i a = I m sin ( ω t + α φ ) + [ I m | 0 | sin ( α φ | 0 | ) I m sin ( α φ ) ] e t / τ i b = I m sin ( ω t + α 120 φ ) + [ I m | 0 | sin ( α 120 φ | 0 | ) I m sin ( α 120 φ ) ] e t / τ i c = I m sin ( ω t + α + 120 φ ) + [ I m | 0 | sin ( α + 120 φ | 0 | ) I m sin ( α + 120 φ ) ] e t / τ
where Im is the short-circuit current period component amplitude, φ is the impedance angle of the circuit loop, Lr is the AC inductance, and τ is the time constant of circuit loop.
φ = arctan [ ω ( L r + L ) / R ] ,   τ = ( L r + L ) / R ,   I m 2 V n R x + 3 ω L r
where Vn is the root-mean-square voltage of the transformer secondary.
From Equation (21), when the AC inductance Lr is constant, the short-circuit current period component amplitude Im is related to the line equivalent resistance R. The farther the location of the short-circuit point is from the reversible converter, the smaller the short-circuit current period component Im will be.
Three-phase uncontrolled rectifier transfers the short-circuit current, whose value is greater than zero, to the DC side. Thus, the short-circuit current on the DC side is as follows:
i s = i 1 + i 2 + i 3 = i a , ( > 0 ) + i b , ( > 0 ) + i c , ( > 0 ) .

5. Simulation and Experiment

5.1. DC Short-Circuit Fault Simulation

A simulation model was built according to the reversible converter circuit topology in Figure 6, and the specific parameters are shown in Table 1.
Due to the fact that the location of the short-circuit point is unpredictable, the simulation study is carried out in two situations, which are called proximal short-circuit (PSC) and remote short-circuit (RSC). Suppose the resistance of the overhead contact line is r1 = 0.028 Ω/km, the inductance of that is l1 = 2.6629 mH/km, the resistance of the rail is r2 = 0.023 Ω/km, the inductance of the rail is l1 = 1.78 mH/km. Thus, the equivalent line resistance is r = r1 + r2 = 0.051 Ω/km, and the equivalent line inductance is l = l1 + l1 = 4.4429 mH/km.
Related parameters and calculated results of PSC are shown in Table 2.
Simulation results of the PSC are shown in Figure 12 and Figure 13:
Related parameters and calculated results for RSC are shown in Table 3.
Simulation results for RSC are shown in Figure 14 and Figure 15.
The simulation results and the theoretical calculation results are compared in Table 4.
From the comparisons in Table 4, some conclusions can be obtained. When the RSC occurs, the simulation results basically agree with the theoretical calculation results. However, when the RSC occurs, there are greater differences between simulation results and theoretical results. The reason is that the discharge current of the DC capacitor in RSC is smaller than the current that is provided by the AC system, so when the capacitor discharge is finished, the DC inductor current has not reached its peak value, but continues to increase slowly to the steady state short current.
It is known from the above comparison that the peak short-circuit current in PSC is larger, and the rise is also faster, so it will do greater harm to semiconductor devices. In order to protect the reversible converter effectively, the PSC should be seriously considered.

5.2. Coordinated Control Experiments

Two sets of high-power reversible converters have been successfully applied in the SHILIHE and XIDIAOYUTAI traction substations of Beijing Metro Line 10 (Beijing, China) as a demonstration example. The parameters of the reversible converters are shown in Table 5.
The system main circuit of the traction substation is shown in Figure 16. Uac indicates the voltage of the AC 10 kV grid, iac1 indicates the AC current of the reversible converter, iac2 and iac3 indicate the AC current of each 12-pulse rectifier, respectively, idc1 indicates the DC current of the reversible converter, idc2 and idc3 indicate the DC current of each 12-pulse rectifier, respectively, and Udc indicates the DC bus voltage. The reversible converter has the same DC output characteristic as shown in Figure 5b.
Figure 17 shows the voltage and current waveforms on the 10 kV side when the reversible converter and two 12-pulse rectifiers are working in parallel. As shown in Figure 17a, when the train is speeding up, the reversible converter and two 12-pulse rectifiers all work in the rectifying state: they share the train power. As shown in Figure 17b, when the train is slowing down, the reversible converter works in the inverting state, and the two 12-pulse rectifiers are blocked because of the high DC bus voltage. It is obvious that the AC current waveforms of the reversible converter are higher qualified than that of the 12-pulse rectifiers.
Figure 18 shows the DC voltage and current waveform when the reversible converter and a 12-pulse rectifier are working in parallel. The meanings of the symbols are shown in Figure 16.
As seen in Figure 18, along with the increase of traction power of the train, the DC bus voltage decreases significantly, but the DC current of the reversible converter and 12-pulse rectifier unit increase immediately. However, it is obvious that the current increase rate of the reversible converter is greater than that of the 12-pulse rectifier unit. The trends basically agree with the DC output curves shown in Figure 5b. When the train work state is changed to braking from traction, the current of both 12-pulse rectifiers reduce to zero, but the DC current of the reversible converter changes from positive to negative, which means that the regenerative braking energy of the train has been fed back to the AC 10 kV grid through the reversible converter.
Traction and braking energy statistics of one substation are shown in Table 6. A and B denote traction energy provided by each 12-pulse rectifier, respectively, C denotes the traction energy provided by the reversible converter, and D denotes the braking energy recovered by the reversible converter.
Figure 19 shows the histogram of the traction energy provided by the reversible converter and each 12-pulse rectifier for clarity. The reversible converter has provided nearly one third of the total traction power (the average proportion is 36.5%). However, it will be found that the traction power provided by the reversible converter is slightly more than that of each 12-pulse rectifier. The reason for this is that the DC output curve of the reversible converter is above that of the 12-pulse rectifier in the light load region, as shown in Figure 5b.
In order to evaluate the energy-saving effect of the reversible converter used in the traction power supply system more clearly and intuitively, the average energy-saving percentage over a long period is defined as η:
η = i = 1 n E i n v _ i i = 1 n E r e c _ i × 100 %
where E i n v _ i denotes the inverting energy of the reversible converter every day, and E i n v _ i denotes the total rectifying energy of the reversible converter and 12-pulse rectifiers every day.
In Table 6, regenerated energy and total traction energy change every day, but according to Equation (23), the average energy-saving percentage η (from 18 June 2016 to 30 June 2016) is calculated as high as 11.15%.

6. Conclusions

In this paper, the high-power reversible converter, which can not only be used to recuperate regenerative braking energy, but also provide traction energy, is applied to construct a new hybrid traction power supply system for urban rail transit. A droop control method based on load current feed-forward is proposed to realize the load distribution between the reversible converter and the existing 12-pulse diode rectifiers. It is successfully verified by the field test carried out on Beijing Metro Line 10. The DC short-circuit characteristics of the reversible converter is studied, and then the relationship between the peak fault current and the circuit parameters are derived. Theoretical calculation and computer simulation shows that the peak fault current in RSC is larger, and the time to reach the peak value is also shorter. Thus, it will do greater harm to the reversible converter. The field test data indicates that the average value of energy-savings percentage for one substation is as high as 11.15%.

Acknowledgments

This research was supported by National Key Research and Development Program 2016YFB1200504.

Author Contributions

Gang Zhang proposed the hybrid traction power supply system and the droop control method based on load current feed-forward. Jianglin Qian studied the DC short-circuit characteristics and carried out the simulation. Xinyu Zhang analyzed the field test data.

Conflicts of Interest

The authors declare no conflict of interest.

References

  1. Mayet, C.; Delarue, P.; Bouscayrol, A.; Chattot, E.; Verhille, J.N. Dynamic model and causal description of a traction power substation based on 6-pulse diode rectifier. In Proceedings of the 2014 IEEE Vehicle Power and Propulsion Conference (VPPC), Coimbra, Portugal, 27–30 October 2014; pp. 1–6.
  2. Yang, Z.; Xia, H.; Wang, B.; Lin, F. An overview on braking energy regeneration technologies in Chinese urban railway transportation. In Proceedings of the 2014 International Power Electronics Conference (IPEC-Hiroshima 2014—ECCE ASIA), Hiroshima, Japan, 18–21 May 2014; pp. 2133–2139.
  3. Ratniyomchai, T.; Hillmansen, S.; Tricoli, P. Recent developments and applications of energy storage devices in electrified railways. IET Electr. Syst. Transp. 2014, 4, 9–20. [Google Scholar] [CrossRef]
  4. Arboleya, P.; Bidaguren, P.; Armendariz, U. Energy is on board: Energy storage and other alternatives in modern light railways. IEEE Electr. Mag. 2016, 4, 30–41. [Google Scholar] [CrossRef]
  5. Fajri, P.; Lee, S.; Prabhala, V.A.K.; Ferdowsi, M. Modeling and Integration of Electric Vehicle Regenerative and Friction Braking for Motor/Dynamometer Test Bench Emulation. IEEE Trans. Veh. Technol. 2016, 65, 4264–4273. [Google Scholar] [CrossRef]
  6. Hernandez, J.C.; Sutil, F.S. Electric Vehicle Charging Stations Feeded by Renewable: PV and Train Regenerative Braking. IEEE Lat. Am. Trans. 2016, 14, 3262–3269. [Google Scholar] [CrossRef]
  7. Grbovic, P.J.; Delarue, P.; Moigne, P.L.; Bartholomeus, P. The Ultracapacitor-Based Controlled Electric Drives with Braking and Ride-Through Capability: Overview and Analysis. IEEE Trans. Ind. Electron. 2011, 58, 925–936. [Google Scholar] [CrossRef]
  8. Itani, K.; Bernardinis, A.D.; Khatir, Z.; Jammal, A.; Oueidat, M. Extreme conditions regenerative braking modeling, control and simulation of a hybrid energy storage system for an electric vehicle in extreme conditions. IEEE Trans. Transp. Electr. 2016, 2, 465–469. [Google Scholar] [CrossRef]
  9. Meitei, S.N.; Kharghoria, A.P.; Chetia, U.K.; Deka, S. Regenerative braking along with ABS system in hybrid vehicles. In Proceedings of the 2016 International Conference on Computation of Power, Energy Information and Commuincation (ICCPEIC), Chennai, India, 20–21 April 2016; pp. 317–320.
  10. Parvini, Y.; Vahidi, A. Optimal charging of ultracapacitors during regenerative braking. In Proceedings of the 2012 IEEE International Electric Vehicle Conference (IEVC), Greenville, SC, USA, 4–8 March 2012; pp. 1–6.
  11. De la Torre, S.; Sánchez-Racero, A.J.; Aguado, J.A.; Reyes, M.; Martínez, O. Optimal Sizing of Energy Storage for Regenerative Braking in Electric Railway Systems. IEEE Trans. Power Syst. 2015, 30, 1492–1500. [Google Scholar] [CrossRef]
  12. Okui, A.; Hase, S.; Shigeeda, H.; Konishi, T.; Yoshi, T. Application of energy storage system for railway transportation in Japan. In Proceedings of the 2010 International Power Electronics Conference—ECCE ASIA, Sapporo, Japan, 21–24 June 2010; pp. 3117–3123.
  13. Zhou, L.; Tang, X.; Qi, Z. Control method for flywheel array energy storage system in energy harvesting from electric railway. In Proceedings of the 2014 IEEE Conference and Expo Transportation Electrification Asia-Pacific (ITEC Asia-Pacific), Beijing, China, 31 August 2014–3 September 2014; pp. 1–5.
  14. Jandura, P.; Richter, A.; Ferková, Ž. Flywheel energy storage system for city railway. In Proceedings of the 2016 International Symposium on Power Electronics, Electrical Drives, Automation and Motion (SPEEDAM), Anacapri, Italy, 22–24 June 2016; pp. 1155–1159.
  15. Pastor, M.L.; Rodriguez, L.G.T.; Velez, C.V. Flywheels Store to Save: Improving railway efficiency with energy storage. IEEE Electr. Mag. 2013, 1, 13–20. [Google Scholar] [CrossRef]
  16. Lukasiak, P.; Antoniewicz, P.; Swierczynski, D.; Kolomyjski, W. Technology comparison of energy recuperation systems for DC rail transportation. In Proceedings of the 2015 IEEE 5th International Conference on Power Engineering, Energy and Electrical Drives (POWERENG), Riga, Latvia, 11–13 May 2015; pp. 372–376.
  17. Cornic, D. Efficient recovery of braking energy through a reversible dc substation. In Proceedings of the Electrical Systems for Aircraft, Railway and Ship Propulsion, Bologna, Italy, 19–21 October 2010; pp. 1–9.
  18. Popescu, M.; Bitoleanu, A.; Suru, V.; Preda, A. System for converting the DC traction substations into active substations. In Proceedings of the 2015 9th International Symposium on Advanced Topics in Electrical Engineering (ATEE), Bucharest, Romania, 7–9 May 2015; pp. 632–637.
  19. Suru, C.V.; Popescu, M.; Bitoleanu, A. Control algorithm implementation for a filtering and regeneration system used in urban traction DC substations. In Proceedings of the 2016 International Symposium on Power Electronics, Electrical Drives, Automation and Motion (SPEEDAM), Anacapri, Italy, 22–24 June 2016; pp. 651–656.
  20. Kim, S.-A.; Han, G.-J.; Han, S.-W.; Cho, Y.-H. Initial firing angle control of 12-pulse parallel connected thyristor dual converter for urban railway power substations. In Proceedings of the 2016 International Symposium on Power Electronics, Electrical Drives, Automation and Motion (SPEEDAM), Anacapri, Italy, 22–24 June 2016; pp. 645–650.
  21. Zhang, G.; Liu, Z.; Chen, D.; Diao, L.; Lin, W.; Li, Z. Control and implementation of reversible multi-modular converter with interleaved space vector modulation. In Proceedings of the 2007 International Conference on Mechatronics and Automation, Chengdu, China, 5–8 August 2007; pp. 3463–3468.
  22. Lu, X.; Guerrero, J.M.; Sun, K.; Vasquez, J.C. An Improved Droop Control Method for DC Microgrids Based on Low Bandwidth Communication with DC Bus Voltage Restoration and Enhanced Current Sharing Accuracy. IEEE Trans. Power Electron. 2014, 29, 1800–1812. [Google Scholar] [CrossRef]
  23. Eren, S.; Pahlevani, M.; Bakhshai, A.; Jain, P. An Adaptive Droop DC-Bus Voltage Controller for a Grid-Connected Voltage Source Inverter with LCL Filter. IEEE Trans. Power Electron. 2015, 30, 547–560. [Google Scholar] [CrossRef]
  24. Huang, Y.; Yuan, X.; Hu, J.; Zhou, P.; Wang, D. DC-Bus Voltage Control Stability Affected by AC-Bus Voltage Control in VSCs Connected to Weak AC Grids. IEEE J. Emerg. Sel. Top. Power Electron. 2016, 4, 445–458. [Google Scholar] [CrossRef]
  25. Wu, T.F.; Chang, C.H.; Lin, L.C.; Yu, G.R.; Chang, Y.R. DC-Bus Voltage Control With a Three-Phase Bidirectional Inverter for DC Distribution Systems. IEEE Trans. Power Electron. 2013, 28, 1890–1899. [Google Scholar] [CrossRef]
  26. Xiao, L.; Xu, Z.; An, T.; Bian, Z. Improved Analytical Model for the Study of Steady State Performance of Droop-controlled VSC-MTDC Systems. IEEE Trans. Power Syst. 2016. [Google Scholar] [CrossRef]
  27. Pozzobon, P. Transient and steady-state short-circuit currents in rectifiers for DC traction supply. IEEE Trans. Veh. Technol. 1998, 47, 1390–1404. [Google Scholar] [CrossRef]
  28. Murali, P.; Santoso, S. Dynamic modeling of short-circuit behavior of a six-pulse rectifier. In Proceedings of the 2011 IEEE Electric Ship Technologies Symposium, Alexandria, VA, USA, 10–13 April 2011; pp. 486–491.
  29. Zhang, L.R. Control and Protection of the Wind Turbine-Based DC Microgrid. Ph.D. Thesis, North China Electric Power University, Beijing, China, 19 June 2015. [Google Scholar]
  30. Tang, G.; Xu, Z.; Zhou, Y. Impacts of three MMC-HVDC configurations on AC system stability under DC line faults. In Proceedings of the IEEE Power & Energy Society General Meeting, Denver, CO, USA, 26–30 July 2015; p. 1.
Figure 1. Proposed hybrid traction power supply scheme. (a) Hybrid scheme I; (b) Hybrid scheme II.
Applsci 07 00282 g001
Figure 2. Equivalent circuit of a 12-pulse rectifier.
Applsci 07 00282 g002
Figure 3. 12-pulse rectified output characteristic curve.
Applsci 07 00282 g003
Figure 4. Voltage droop control method based on output current feed-forward.
Applsci 07 00282 g004
Figure 5. Proposed coordinated control strategy. (a) Ideal scheme; (b) Simplified scheme.
Applsci 07 00282 g005
Figure 6. DC short-circuit fault of the reversible converter.
Applsci 07 00282 g006
Figure 7. Resistance-Inductance-Capacitor (RLC) second-order circuit response equivalent circuit.
Applsci 07 00282 g007
Figure 8. Equivalent circuit of Resistance-Inductance-Diode (RLD) first-order circuit response.
Applsci 07 00282 g008
Figure 9. The relationships among capacitor discharge time, the equivalent inductance L, and capacitance C when V0 = 750 V, I0 = 1300 A.
Applsci 07 00282 g009
Figure 10. The relationships among inductor peak current, the equivalent inductance L, and capacitance C when V0 = 750 V, I0 = 1300 A, and Is = 1800 A.
Applsci 07 00282 g010
Figure 11. The stage of uncontrolled rectification.
Applsci 07 00282 g011
Figure 12. DC inductor current and capacitor voltage for proximal short-circuit (PSC).
Applsci 07 00282 g012
Figure 13. Three-phase AC current for PSC.
Applsci 07 00282 g013
Figure 14. DC inductor current and capacitor voltage for RSC.
Applsci 07 00282 g014
Figure 15. Three-phase AC current for RSC.
Applsci 07 00282 g015
Figure 16. Main circuit of the traction substation in Beijing Metro Line 10.
Applsci 07 00282 g016
Figure 17. AC current waveforms when the reversible converter and two 12-pulse rectifiers work in parallel. (a) train in traction state; (b) train in regenerative braking state.
Applsci 07 00282 g017aApplsci 07 00282 g017b
Figure 18. DC voltage and current waveforms when the reversible converter and a 12-pulse rectifier work in parallel.
Applsci 07 00282 g018
Figure 19. Traction energy distribution between the reversible converter and each 12-pulse rectifier.
Applsci 07 00282 g019
Table 1. Converter parameters for the simulation. AC: alternating current; DC: direct current.
ItemsValues
AC input voltage Vn450 V
DC output voltage Vd750 V
AC side inductor Lr300 μH
DC Capacitance C36 mF
Capacitance parasitic resistance Rc0.02 mΩ
Equivalent internal Resistance of diode Ron0.3 mΩ
Rated power P1 MW
Switching frequency fs2 kHz
Table 2. Related parameters and calculated results for proximal short-circuit (PSC).
ItemsValues
Short-circuit distance x10 m
Line resistance R0.51 mΩ
Line inductance L0.044 mH
Theoretical discharge time of capacitance t11.9 ms
Theoretical peak current inductance iL(t1)23,000 A
Theoretical period component amplitude of short-circuit current Im3886 A
Table 3. Related parameters and calculated results for RSC.
ItemsValues
Short-circuit distance x1.7 km
Line resistance R86.7 mΩ
Line inductor L7.553 mH
Theoretical discharge time of capacitor t114.6 ms
Theoretical peak current of inductance iL(t1)2572 A
Theoretical period component amplitude of short-circuit current Im2550 A
Table 4. The comparison between the simulation results and theoretical calculation results.
Short-Circuit PointParametersCalculation ResultsSimulation Results
PSC, x = 10 mt11.9 ms2 ms
iL(t1)23,000 A22,800 A
Im3886 A3780 A
RSC, x = 1.7 kmt114.6 ms15.5 ms
iL(t1)2572 A2000 A
Im2550 A3000 A
Table 5. Parameters of the reversible converter.
ParameterValueParameterValue
AC grid voltage10 kVTransformer capacity1.6 MVA
DC rated voltage750 VIGBT specification2400 A/1700 V
Converter capacity2 MWSwitching frequency2 kHz
Table 6. Used and regenerated energy (MWh).
Date12-Pulse Rectifier 1/A12-Pulse Rectifier 2/BReversible ConverterTotal Traction Energy/A + B + CPercentage of C/(A + B + C)
Rectifying/CInverting/D
2016/6/184.4324.4824.6990.97413.61334.52%
2016/6/193.8803.9284.4740.76912.28236.43%
2016/6/205.1865.2275.5281.49815.94134.68%
2016/6/214.4634.5055.4561.59314.42437.83%
2016/6/224.3454.3775.1832.15413.90537.27%
2016/6/234.4764.5145.1962.33414.18636.63%
2016/6/244.8744.9165.1981.94214.98834.68%
2016/6/253.5213.5604.2820.65611.36337.68%
2016/6/263.5083.5484.6230.51111.67939.58%
2016/6/274.3904.3935.3271.38914.11037.75%
2016/6/284.6424.6545.3362.33514.63236.47%
2016/6/294.7174.7525.2902.51914.75935.84%
2016/6/304.4184.4535.0411.37013.91236.23%
sum56.85257.30965.63320.044179.79436.50%

