Article

Postharvest Quality Monitoring and Variance Analysis of Peach and Nectarine Cold Chain with Multi-Sensors Technology

1
Beijing Laboratory of Food Quality and Safety, China Agricultural University, Beijing 100083, China
2
Department of Informatics, University of Rijeka, Radmile Matejčić 2, Rijeka HR-51000, Croatia
3
Key Laboratory of Protected Horticultural Technology, Forestry and Fruit Research Institute, Shanghai Academy of Agricultural Sciences, Shanghai 201403, China
4
Faculty of Agriculture, Department of Pomology, University of Zagreb, Svetošimunska 25, Zagreb HR-10000, Croatia
*
Authors to whom correspondence should be addressed.
Appl. Sci. 2017, 7(2), 133; https://doi.org/10.3390/app7020133
Submission received: 21 November 2016 / Revised: 21 December 2016 / Accepted: 23 January 2017 / Published: 29 January 2017

Abstract

:
Fresh peaches and nectarines are very popular for their high nutritional and therapeutic value. Unfortunately, they are prone to rapid deterioration after harvest, especially if the cold chain is not well maintained. The objective of this work is to study the environmental fluctuation and the quality change of fresh peaches and nectarines in cold chain. The temperature, relative humidity, and CO2 level were real-time monitored by sensor nodes with a wireless sensor network (WSN). The cold chain lasted for 16.8 h and consisted of six segments. The dynamic change of temperature, relative humidity, and CO2 level were real-time monitored and analyzed in detail in each of the six stages. The fruit quality index (fruit weight, fruit firmness, and soluble solids concentration (SSC)) were detected and analyzed immediately before the first stage (S1) and at the beginning of the last stage (S6). The results show that without good temperature control fruit softening is the most significant problem, even in a short chain; the WSN node can provide complete and accurate temperature, humidity, and gas monitoring information for cold chains, and can be used to further improve quality and safety assurance for peach fruit cold chains.

1. Introduction

Fresh peaches and nectarines are fruits that are appreciated worldwide by consumers for their juicy texture, high nutrient content, and pleasant flavor [1,2]. As a kind of climacteric fruits, peaches and nectarines have relatively short lives when compared with other fruits, such as apples, due to fast softening, physiological disorders, and overall deterioration of quality, which significantly decrease their marketing period [3,4,5,6]. The fruit cold chain aims to reduce the quality loss and safety hazards of fruit by the use of artificial refrigeration technology. In that way, peaches and nectarines are stored in a low temperature environment at all times when they are in various stages, such as processing, storage, transportation, sale, etc. [7,8,9].
With limited land resources and an ever-growing population, the food supply chain is faced with the challenge of increasing the handling efficiency and minimizing post-harvest food losses. Those challenges can be resolved by intelligent food logistics technology, including sensor technology to monitor the logistic conditions, radio frequency identification (RFID) and GPS technology to improve transport modalities, new warehouse management approaches, shelf life models, or the combination of one or more of these aspects [10,11]. The importance of these aspects is of crucial importance in highly perishable fruits such as peaches and nectarines. The peach and nectarine cold chain is complex with high information discrepancy. Different possible combinations of temperature, relative humidity, CO2, O2, and ethylene concentrations occurring in cold chain may significantly affect fruit perishability, metabolic changes, and cause unpredictable variability in fruit quality, such as the loss of fruit firmness, and the onset of physiological disorders and decay [12,13,14,15]. Therefore, it is urgent to analyze the dynamic characteristics of peaches and nectarines in cold chain environments by intelligent monitoring technology, and to improve the traceability and transparency of the peaches and nectarines in cold chain and guarantee the quality and safety of the fruits.
Though there are many environmental factors that affect the quality and safety of peach and nectarine cold chains, temperature, relative humidity, and CO2 level are considered to be the main factors [16,17,18,19]. Among them, temperature is the key factor [10] that directly affects the respiration rate of the peaches and nectarines and the antioxidative activity of the fruits. Suitable temperature management is an effective technology for slowing this ripening and reducing decay development after harvest [20,21]. Humidity levels that are higher than an optimum value promote the growth of microorganisms and result in abnormal splitting of peaches and nectarines, and humidity levels that are lower than the optimum value can result in wilting, brown rot, and the decrease of firmness of fruits, as well as damage to the appearance of fruit tissue [22,23]. CO2 and O2 concentrations strongly affect fruit metabolism and fruit shelf life [10], therefore concentration levels must be monitored to avoid postharvest losses. Peaches and nectarines are characterized by exhibiting a sharp rise in CO2 and ethylene production at the onset of ripening accompanied with the increase of respiration rate, which leads to dramatic changes in fruit quality [24,25]. It is critical to monitor these factors in real time in order to adjust the temperature, relative humidity, and CO2 at optimal levels during the cold chain.
One of the best solutions and an inevitable trend for enabling real time cold chain monitoring is the implementation of the Wireless Sensor Network (WSN), which is considered to be a cost-effective sensor and communications technology with low energy consumption and advanced networking capabilities for monitoring objects and transmitting information to the end-user via a wireless and multi-hop network [26,27,28,29,30]. The sensed information can accurately reflect what happens in the fresh fruit cold chain by providing suppliers and distributors with continuous and accurate readings throughout the distribution process. Supply chain monitoring system is based on a smart logistic unit (SLU) which was originally built for strawberries [26,31] and showed good potential for achieving food safety and shelf life together with logistic efficiency and system sustainability. The data acquired with SLU can be used for implementing a first-expired-first-out (FEFO) management strategy in order to optimize shelf life of the product in terms of market distance and product shelf life potential. Although currently applied in many cases, the FIFO management strategy has numerous disadvantages [10], but the most important are unpredictable shelf life potential and high possibility of postharvest loss.
This study aims to monitor the temperature, relative humidity and CO2 level and the quality of peach and nectarine cold chain by multi-sensors technology (WSN) in real time in order to improve the transparency and traceability of the cold chain. The cold chain process, variance analysis, and the evaluation of quality parameters (firmness, soluble solids concentration (SSC), and weight loss) were considered and implemented in the study methods.

2. Materials and Methods

2.1. Plant Material

Peaches (cv. Sugar Top) and nectarines (cv. Big Bang Rebus 036) were grown in an orchard near Kašić, Croatia (44°08′59″ N, 15°28′22″ E). The trees were four years old and grown in spindle bush training form. All orchard management practices were applied regularly. The postharvest fruit quality is also affected by various preharvest factors, such us cultivar, climate, orchard management practices [32], and netting [33,34,35].
Photoselective netting is an innovative technology, by which chromatic elements are incorporated into netting materials in order to gain specific physiological and horticultural benefits, in addition to the initial protective purpose of each type of net (shade-, anti-hail-, wind-, insect-proof, etc.) [34]. Red nets absorb UV and B regions of light spectra and allow red and far-red parts of light spectra (i.e., wavelengths of 580 nm and up) to pass. This light modification, together with increased scattering and diffused light effect, causes photosynthetic and photomorphogenic processes [34,35] which can significantly affect plant vigor and fruit maturation in various horticultural crops.
Two samples of fruits were harvested. One sample was harvested from trees grown under Agritenax photoselective red anti-hail nets produced by Tenax S.r.l. (Italy) (mesh size 2.4 mm × 4.8 mm). Tree netting was performed immediately after full bloom and the trees remained covered during the whole vegetation period. The second sample was harvested from trees that were not covered with photoselective nets, which served as control.

2.2. Experimental Scheme
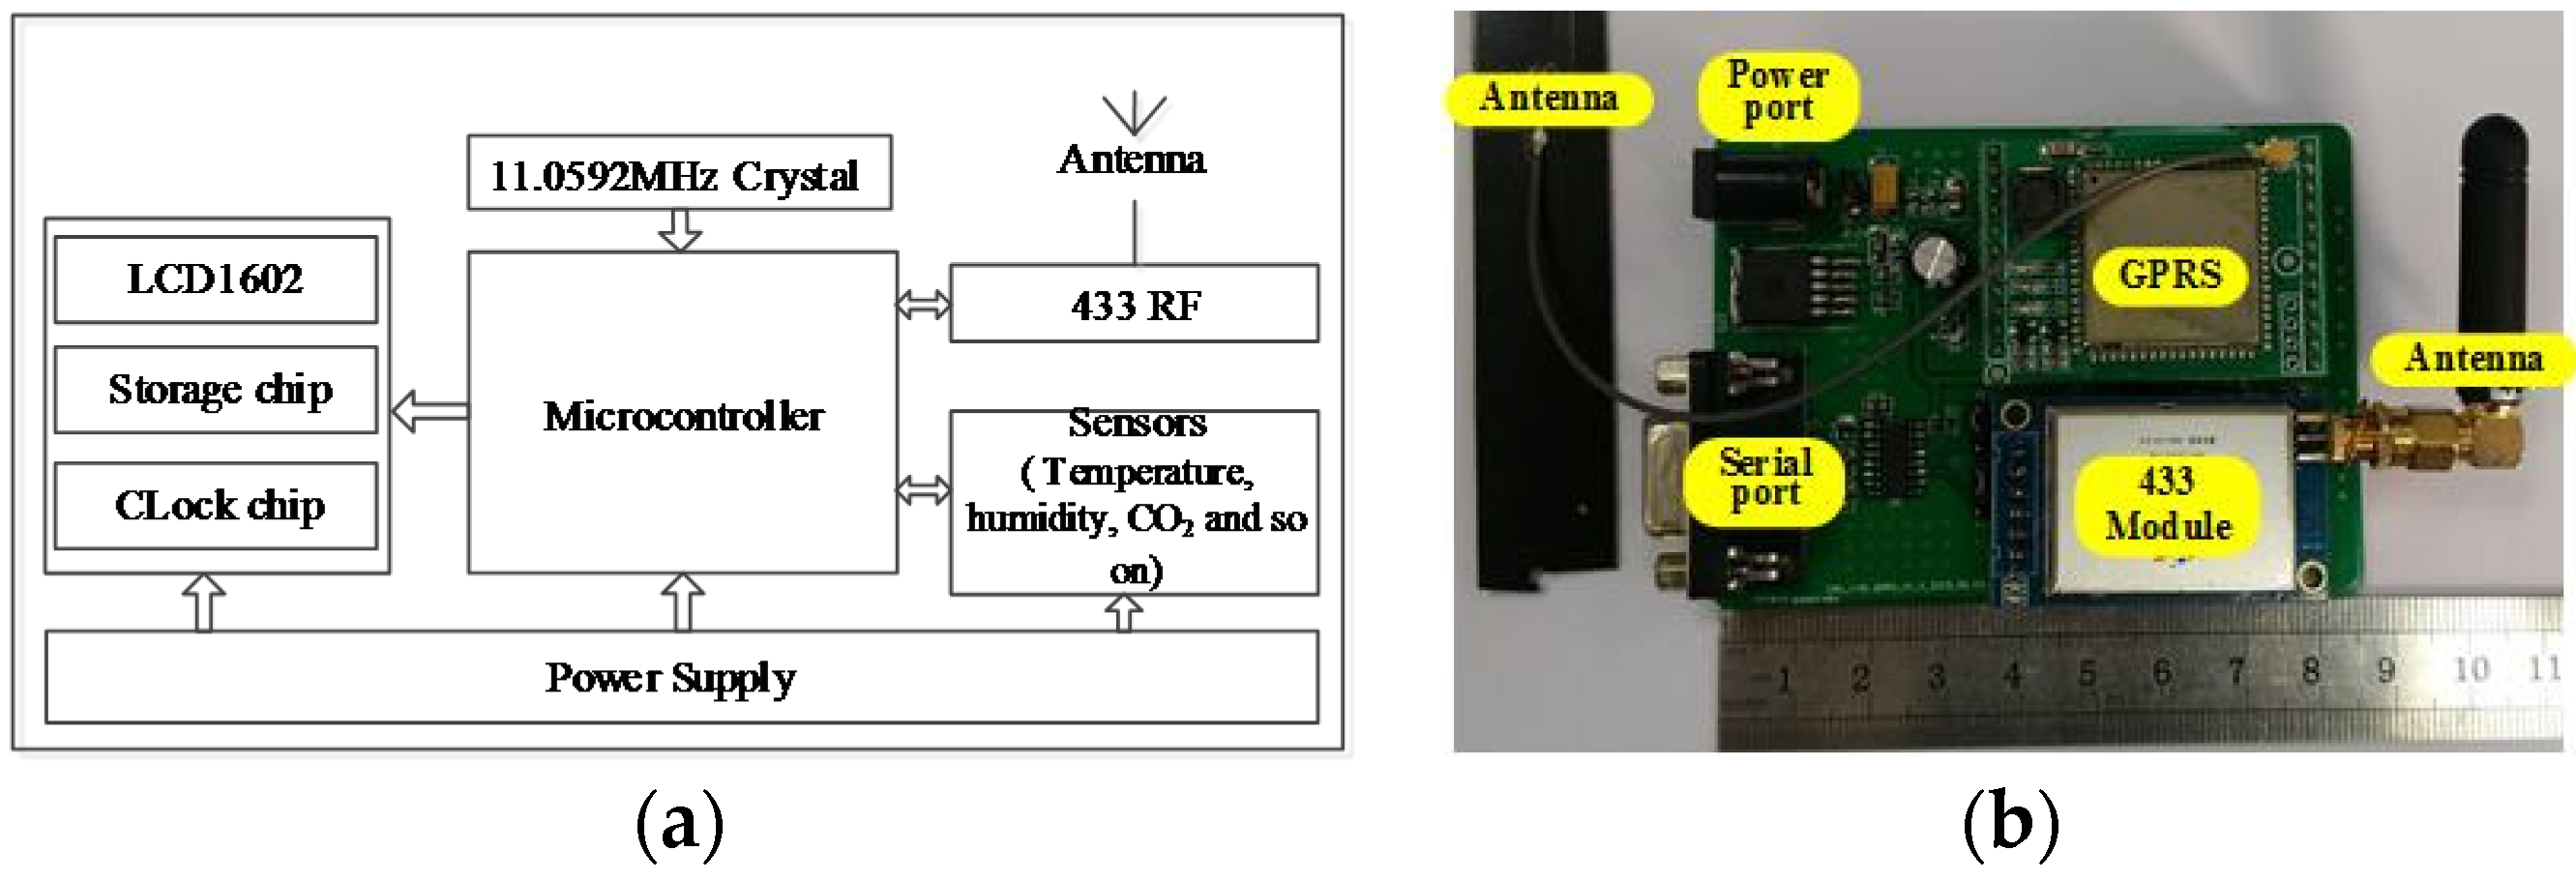
The cold chain was simulated by harvesting fruits into open cardboard boxes, and their loading into vehicles, transportation, and cold storage. The fruits were transported 283 km from the orchard to Zagreb, Croatia by the route presented in Figure 1. During the transport and in subsequent cold storage, real-time monitoring of temperature, relative humidity, CO2, and GPS for experimental fruit was performed by WSN.
Firmness, weight loss, total soluble solids (TSS), titratable acid (TA), and sensory properties are important factors of fruit quality and they play significant roles in consumer preferences, thus having a prominent role in fruit quality assessment during storage [36,37,38]. Weight loss (WL), SSC, and firmness are the easiest quality indicator among these quality indicators to measure using a handheld penetrometer during the cold chain logistics, while the others need special instruments or environments. Therefore, it is practicable and important to select WL, SSC, and firmness to evaluate the quality of peaches and nectarines in actual cold chain logistics.
Fruit weight was determined on the same subsamples using analytical balance before transport (the initial weight, IW) and after cold storage (the final fruit weight, FW). Weight loss was calculated from the difference (IW−FW) and expressed as the percent reduction of IW. Fruit firmness and juice soluble solids concentration (SSC) were measured using ten pieces of fruit from each subsample (i.e., the fruit grown under red net and the control fruit) immediately before the transport and again after the cold storage. Fruit firmness was determined with an Effegi penetrometer (model FT 327, Milano, Italy) fitted with a 7.9-mm diameter plunger. Measurements were taken at four equatorial positions on each fruit at 90°. SSC values of the juice were measured in each fruit with a digital refractometer (Atago, PAL-2, Tokyo, Japan).

2.3. WSN Nodes

The WSN nodes consisted of a number of slave sensor nodes (SSNs) and a master sensor node (MSN), which applied 433 MHz as the radio frequency to increase the transmission performance and form a wireless sensor network. Each SSN included a microcontroller, a 433 module with the antenna, sensors, a EEPROM (Electrically Erasable Programmable Read-Only Memory) chip, a clock chip, and a battery power supply. The MSN was an integration of a microcontroller, a 433 module with the antenna, a GPRS (General Packet Radio Service) module, and a battery power supply.
The physical implementation of the WSN nodes is demonstrated in Figure 2a,b. STC12LE5A60S2 (STC micro TM, Shanghai, China) was used as the microcontroller to improve processing speed, maintain low-power usage, and improve the capacity of disturbance resistance, in order to realize system functionality of the SSN and the MSN. Having a CC1110 as the core chip of the 433 module with the antenna presented many advantages over traditional wire transmission due to its low maintenance cost, low power consumption, high mobility, and high transmission performance. A GPRS module in the MSN via the RS232 bus, was used to communicate between the MSN in the vehicle and the remote server. An EEPROM chip was used to save sensor information when signals were cut off in long international transport. A clock chip was used to control the time when data collected was saved and produced a timing pulse to wake up the CPU (Central Processing Unit). The use of LCD1602 was optional, but it could be used to display information when the sensor nodes were tested. Sensors were used together with the real time remote monitoring terminal in order to monitor the temperature, humidity, CO2, O2, and ethylene levels periodically.
Based on the field study and the existing literature review, sensor requirements are specified in Table 1. The temperature, relative humidity, CO2, and GPS data in the peach and nectarine cold chain logistics were acquired and monitored by adopting the digital temperature and relative humidity sensor AM2322 (AOSONG, Guangzhou, China), CO2 sensor ATI (analytical technology incorporated, New York, NY, USA), and U-BLOX M8030 (u-blox, Thalwil, Zürich, Switzerland). The range of temperature, relative humidity, and CO2 were from −40 °C to +80 °C, 0% to 99.9%, and 0%–5%, respectively, and the accuracy was ±0.3 °C, ±2.0%, and ±0.1%, respectively. The temperature, humidity, and CO2 sensors were not used in the fruit cold chain until they were calibrated. The supply voltage of the slave sensor node was supplied by a lithium battery (aigo, Beijing, China), whose nominal voltage and capacity was 5 V and 8000 mAh, respectively, while the master sensor node was equipped with a 5 V, 2 A power adapter to provide a continuous supply.

2.4. Data Analysis

The data on firmness, SSC, and WL were statistically analyzed with the SAS 9.4 statistical package (SAS Institute, Cary, NC, USA), using the one-way analysis of variance (ANOVA) and LSD (Least Significant Difference) test. p-values of less than 0.05 were considered statistically significant.
The values of all quality parameters were determined by the average of ten fruits. The data regression, fitting, and processing were performed by using OriginPro 9.1 software (OriginLab corporation, Northampton, MA, USA). The correlation of the fruit quality parameters was considered to be significant when Pearson correlation coefficient was higher than 0.8 (R > 0.8).

3. Results and Discussion

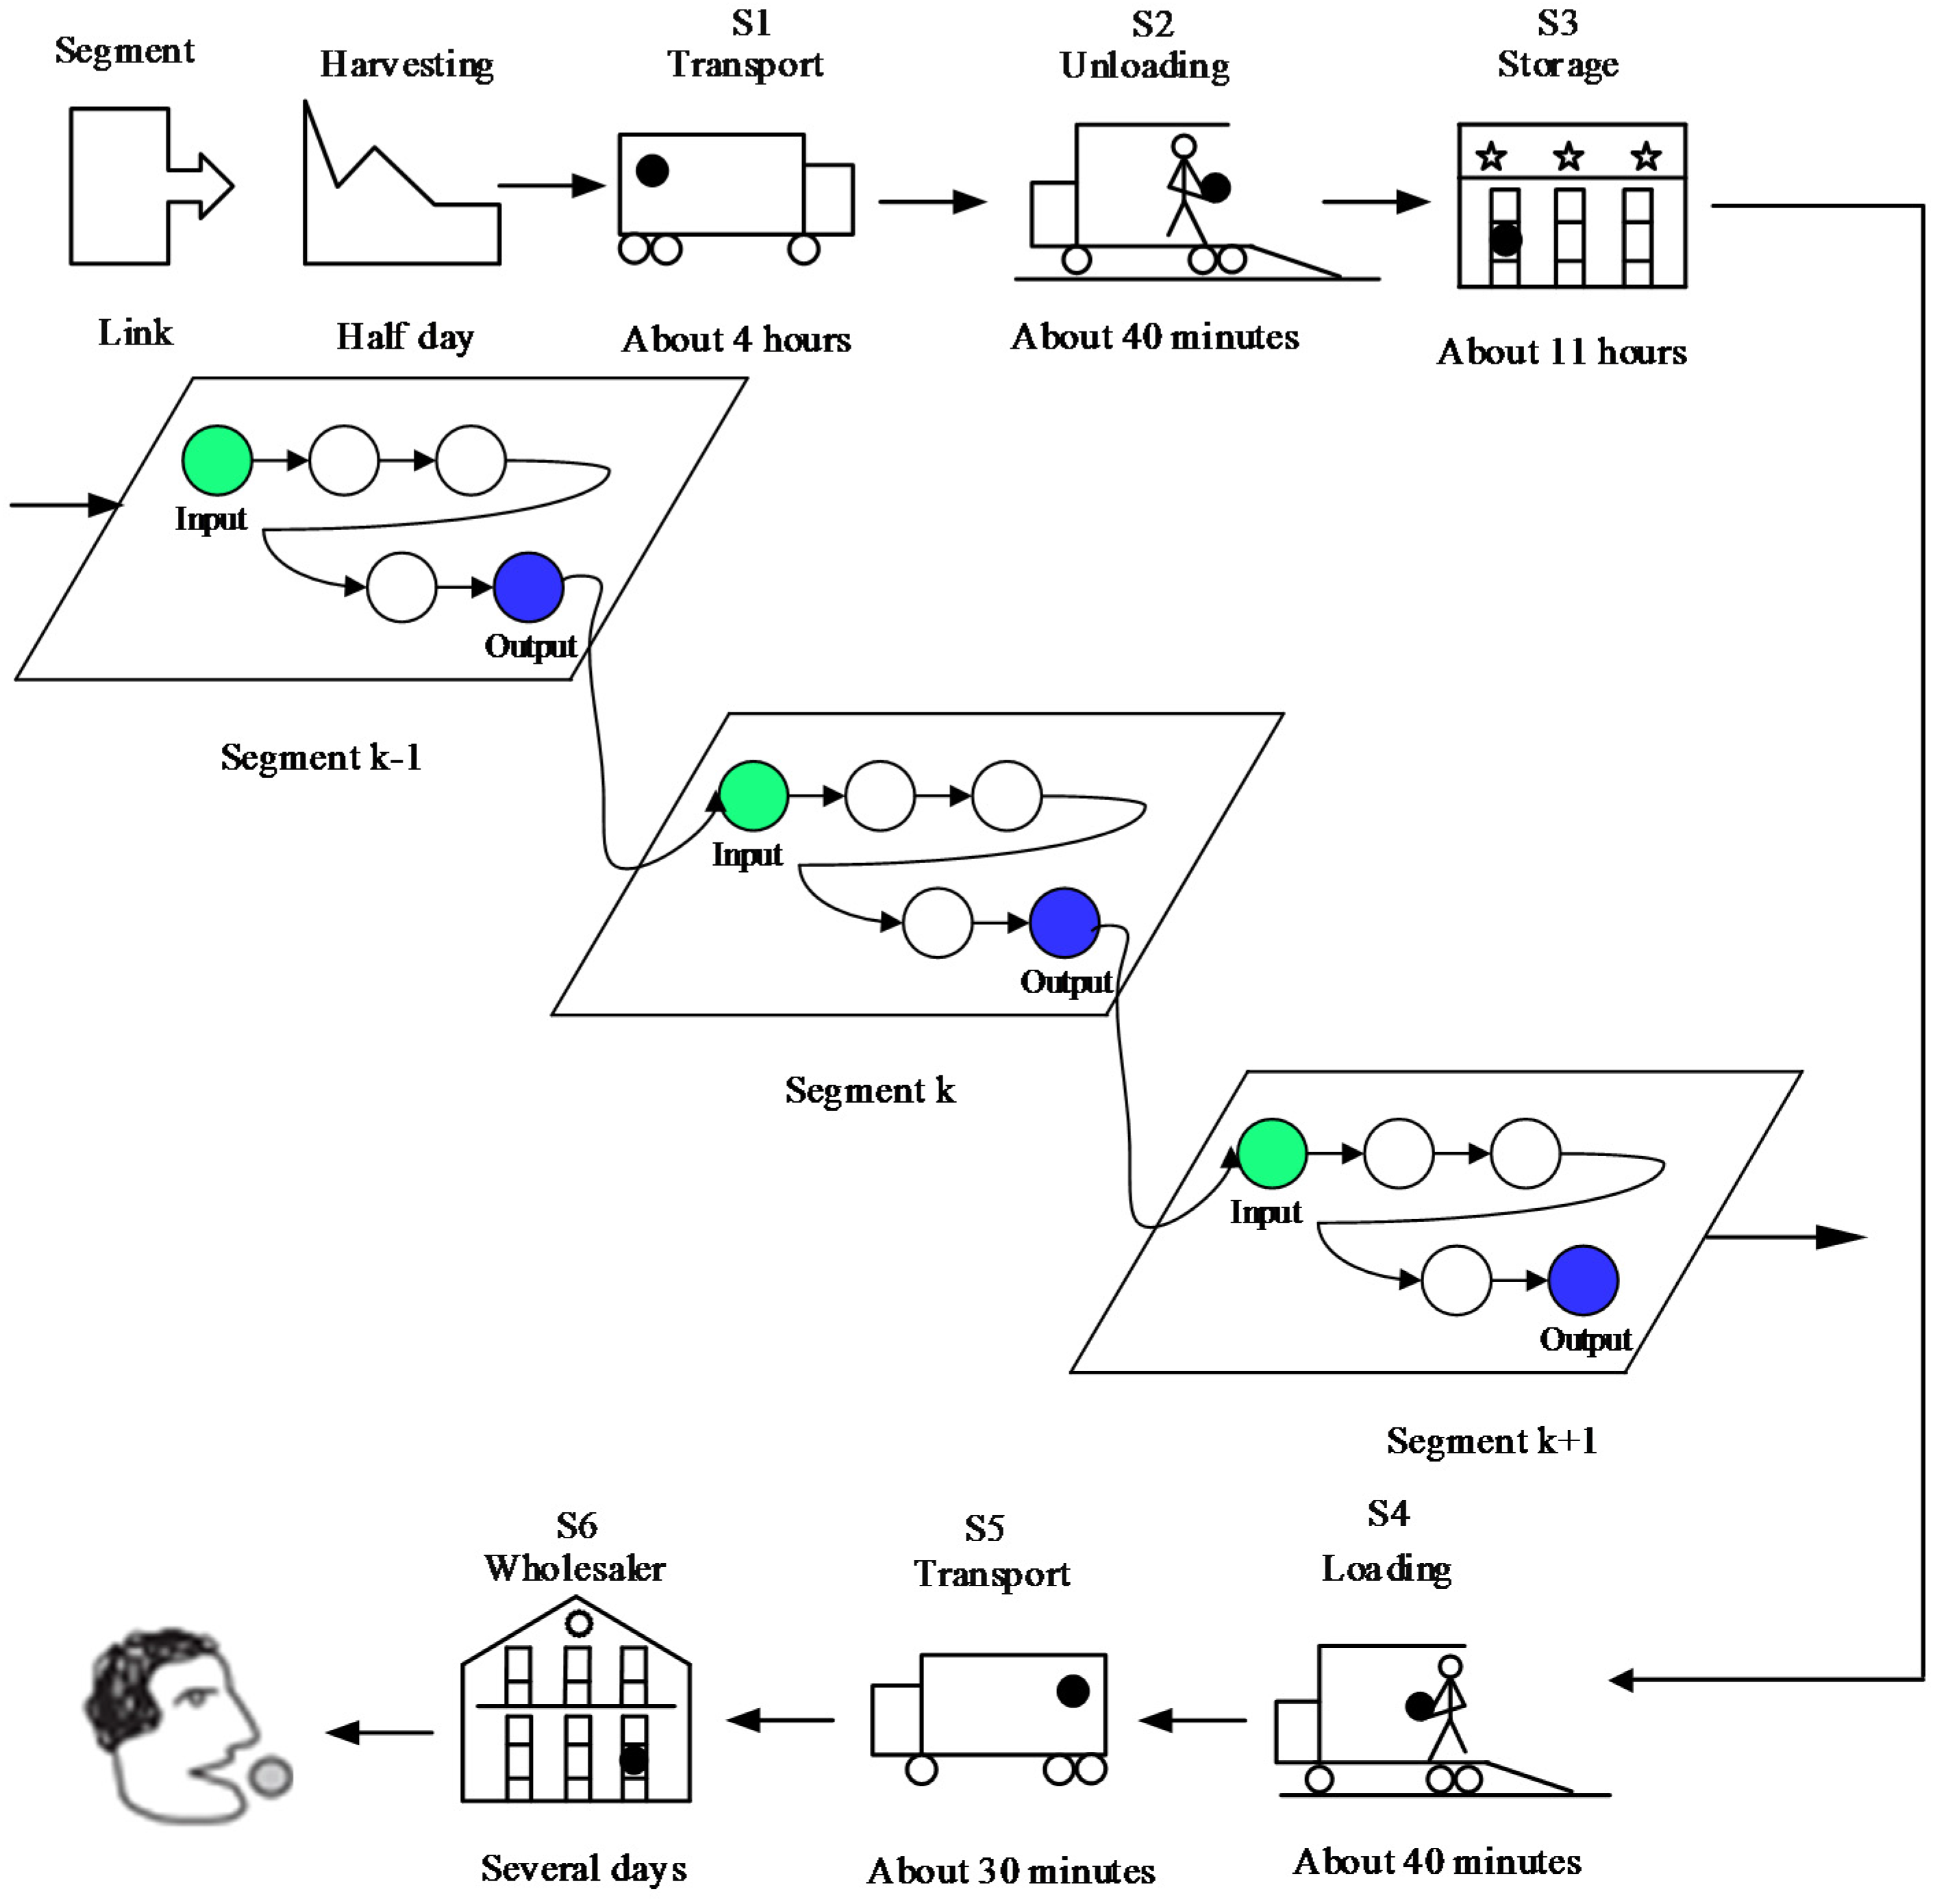
3.1. Business Flow Analysis for Cold Chain

As presented in Figure 3, the cold chain process lasted for 16.8 h starting from picking and harvesting in the orchard and ending with on-the-shelf retail with the following stages:
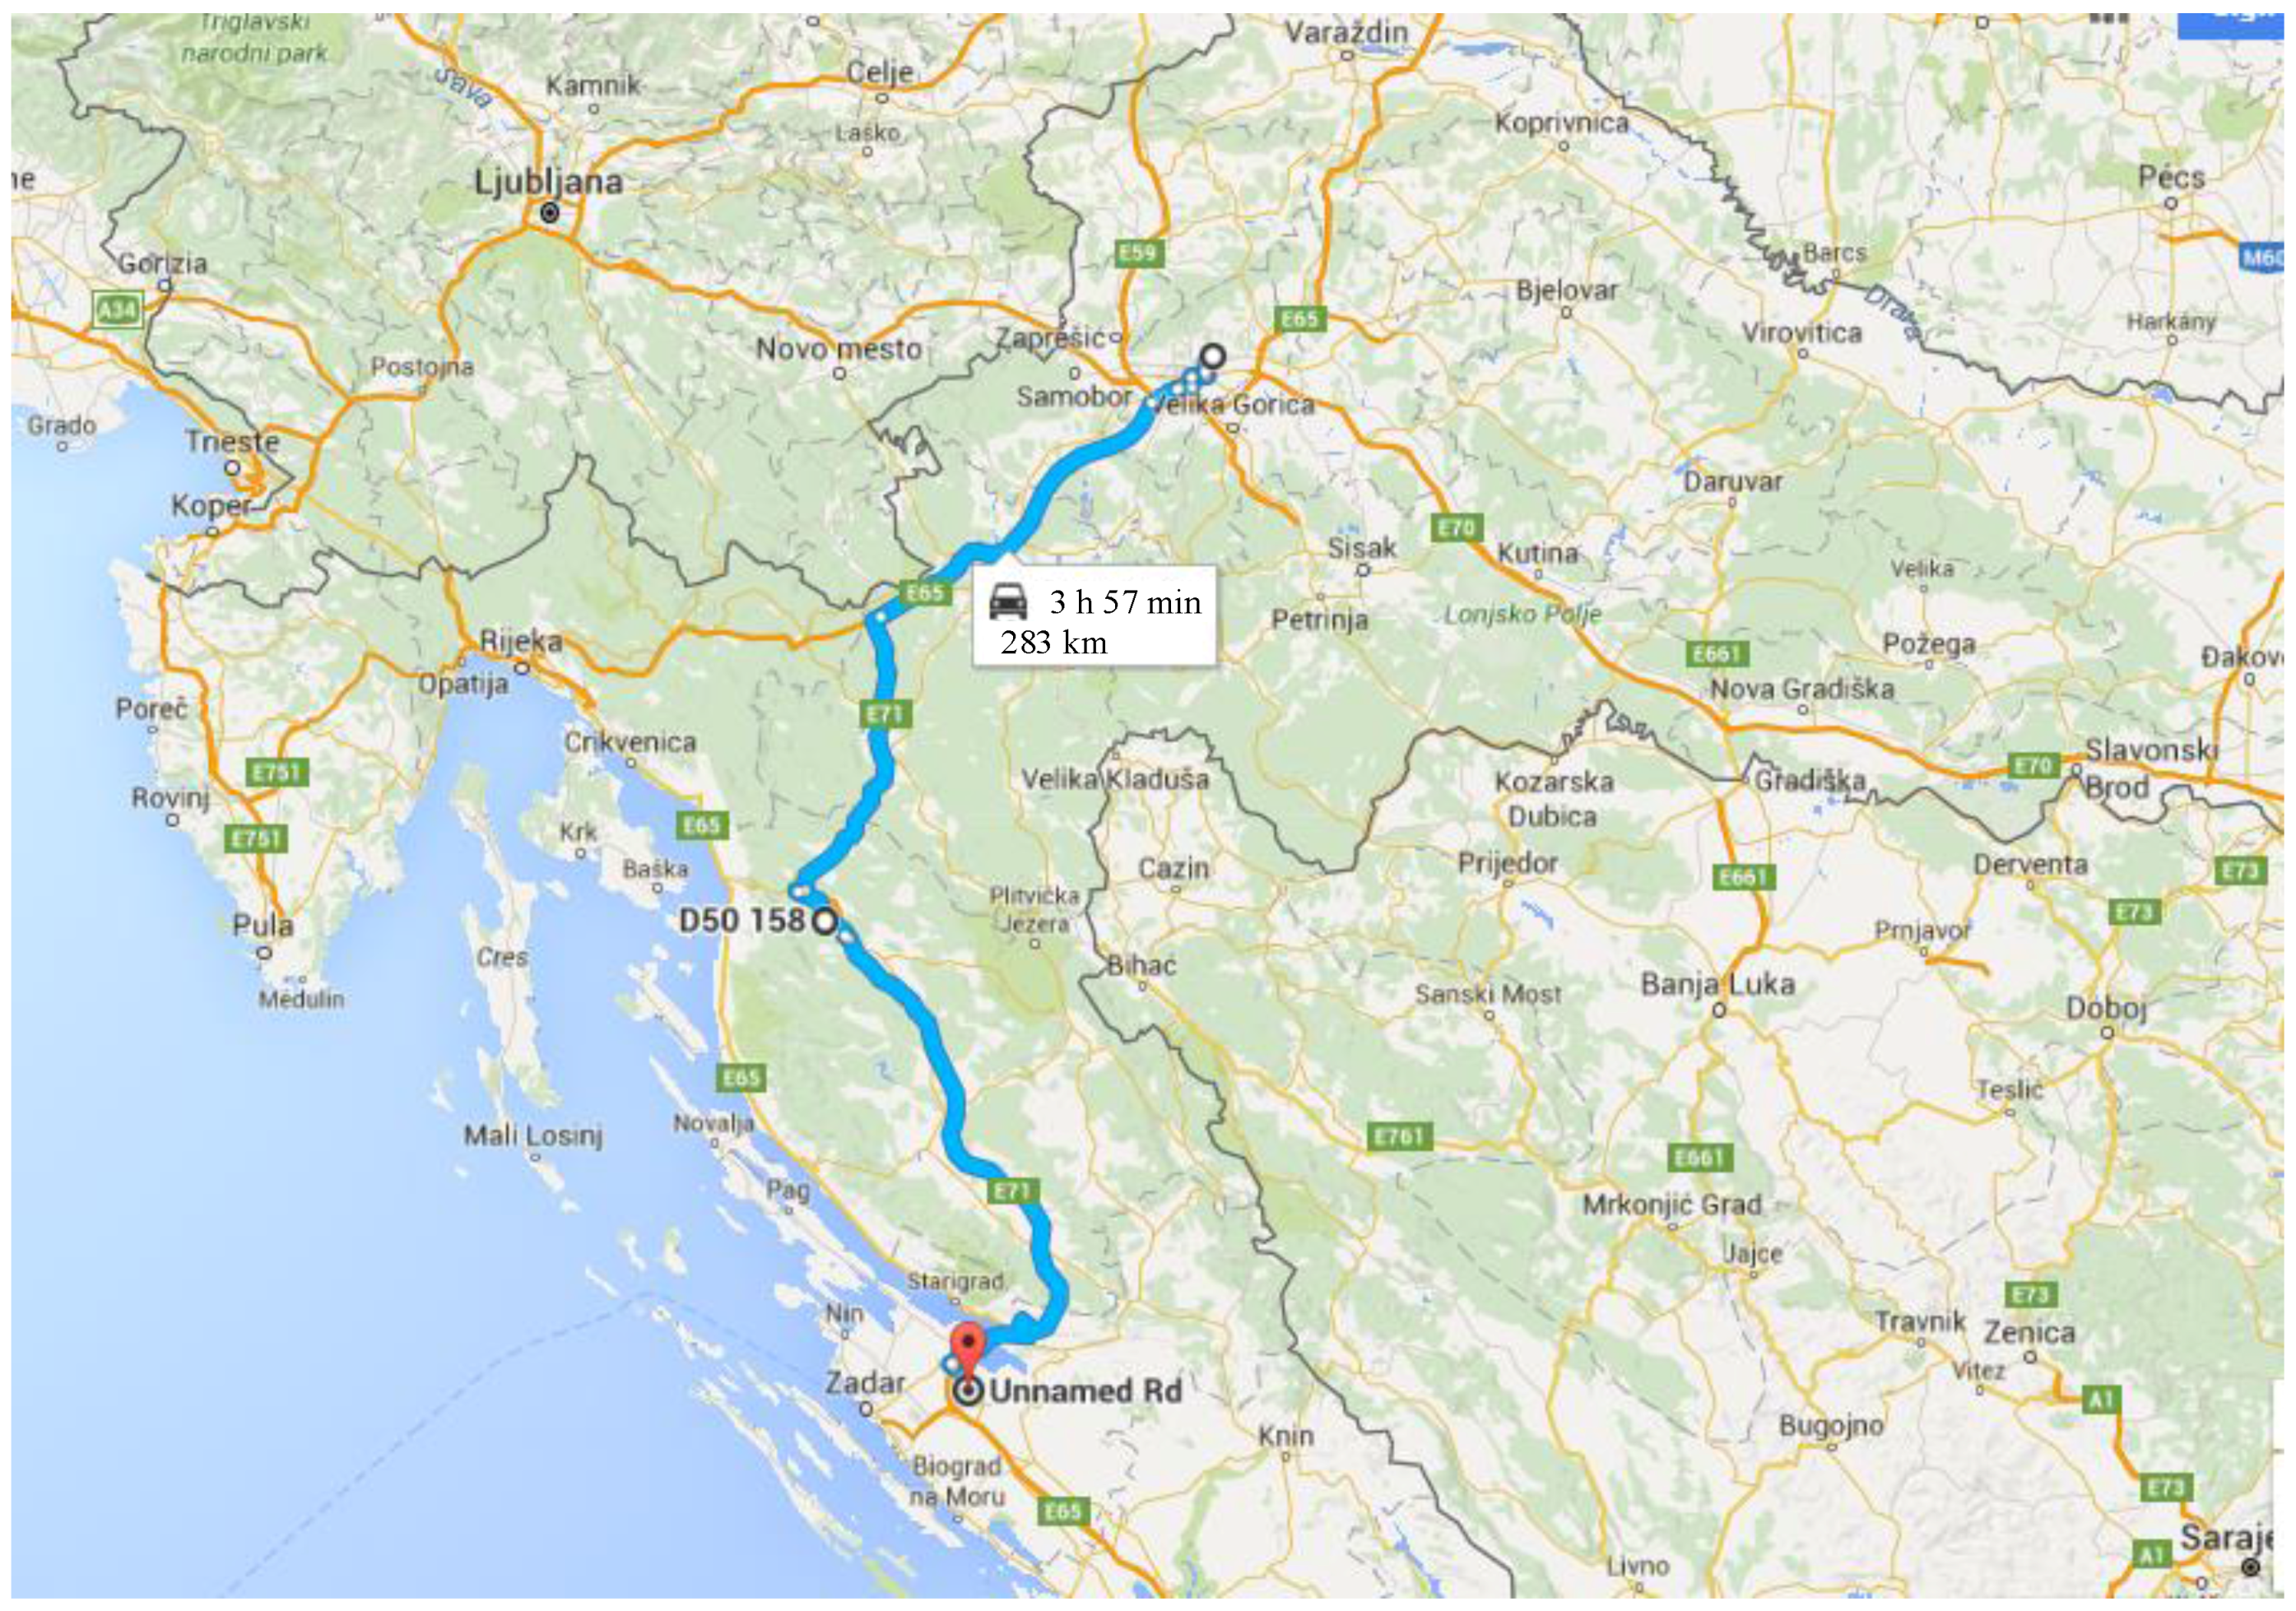
S1: Normal transportation (about 4 h). Four boxes of fruit were harvested during non-rainy cooler times of the day (<25 °C) and transported from Kašić (near Zadar), Croatia to overnight cold storage in Zagreb. The peaches should be picked when they are fully ripe during dry weather and packed into boxes. The temperature, relative humidity, and CO2 level varied with the ambient air and respiration heat released by fruit. The fruit quality deteriorates and senesces quickly at ambient temperature after harvest.
S2: Unloading cargo. This process involved the unloading of the fruit from the car to the refrigerator, which lasted about 40 min. The temperature and relative humidity varied with the ambient temperature. This process should be performed fast and carefully to reduce the handling damage.
S3: Fresh fruit cold storage (about 11 h). The fruit was stored in the refrigerator overnight. The temperature decreased rapidly and the relative humidity rose quickly in this process, resulting in the complex change of CO2 levels.
S4: Loading cargo (40 min). The fruit was loaded from the refrigerator to the car the next morning. The temperature rose, and relative humidity and CO2 level decreased because of the influence of ambient air in the process.
S5: Short normal transportation (30 min). Fruit were transported to the market. The temperature was continuously rising to the ambient temperature level, and the relative humidity and CO2 level were falling continuously.
S6: Display and sale (several days). The fruit were simulated as being displayed and sold by wholesalers or retailers. The temperature, relative humidity, and CO2 level varied with the ambient temperature.
The information flow from segment k − 1 to segment k + 1 is also showed in Figure 3. The output of segment k − 1 is the input of segment k. The output of segment k is not only significantly affected by temperature, relative humidity, and CO2 level, but is also affected by the input of the segment. As such, the dynamic changes of temperature, relative humidity, and CO2 level need to be real-time monitored and analyzed in detail in each of the six stages.

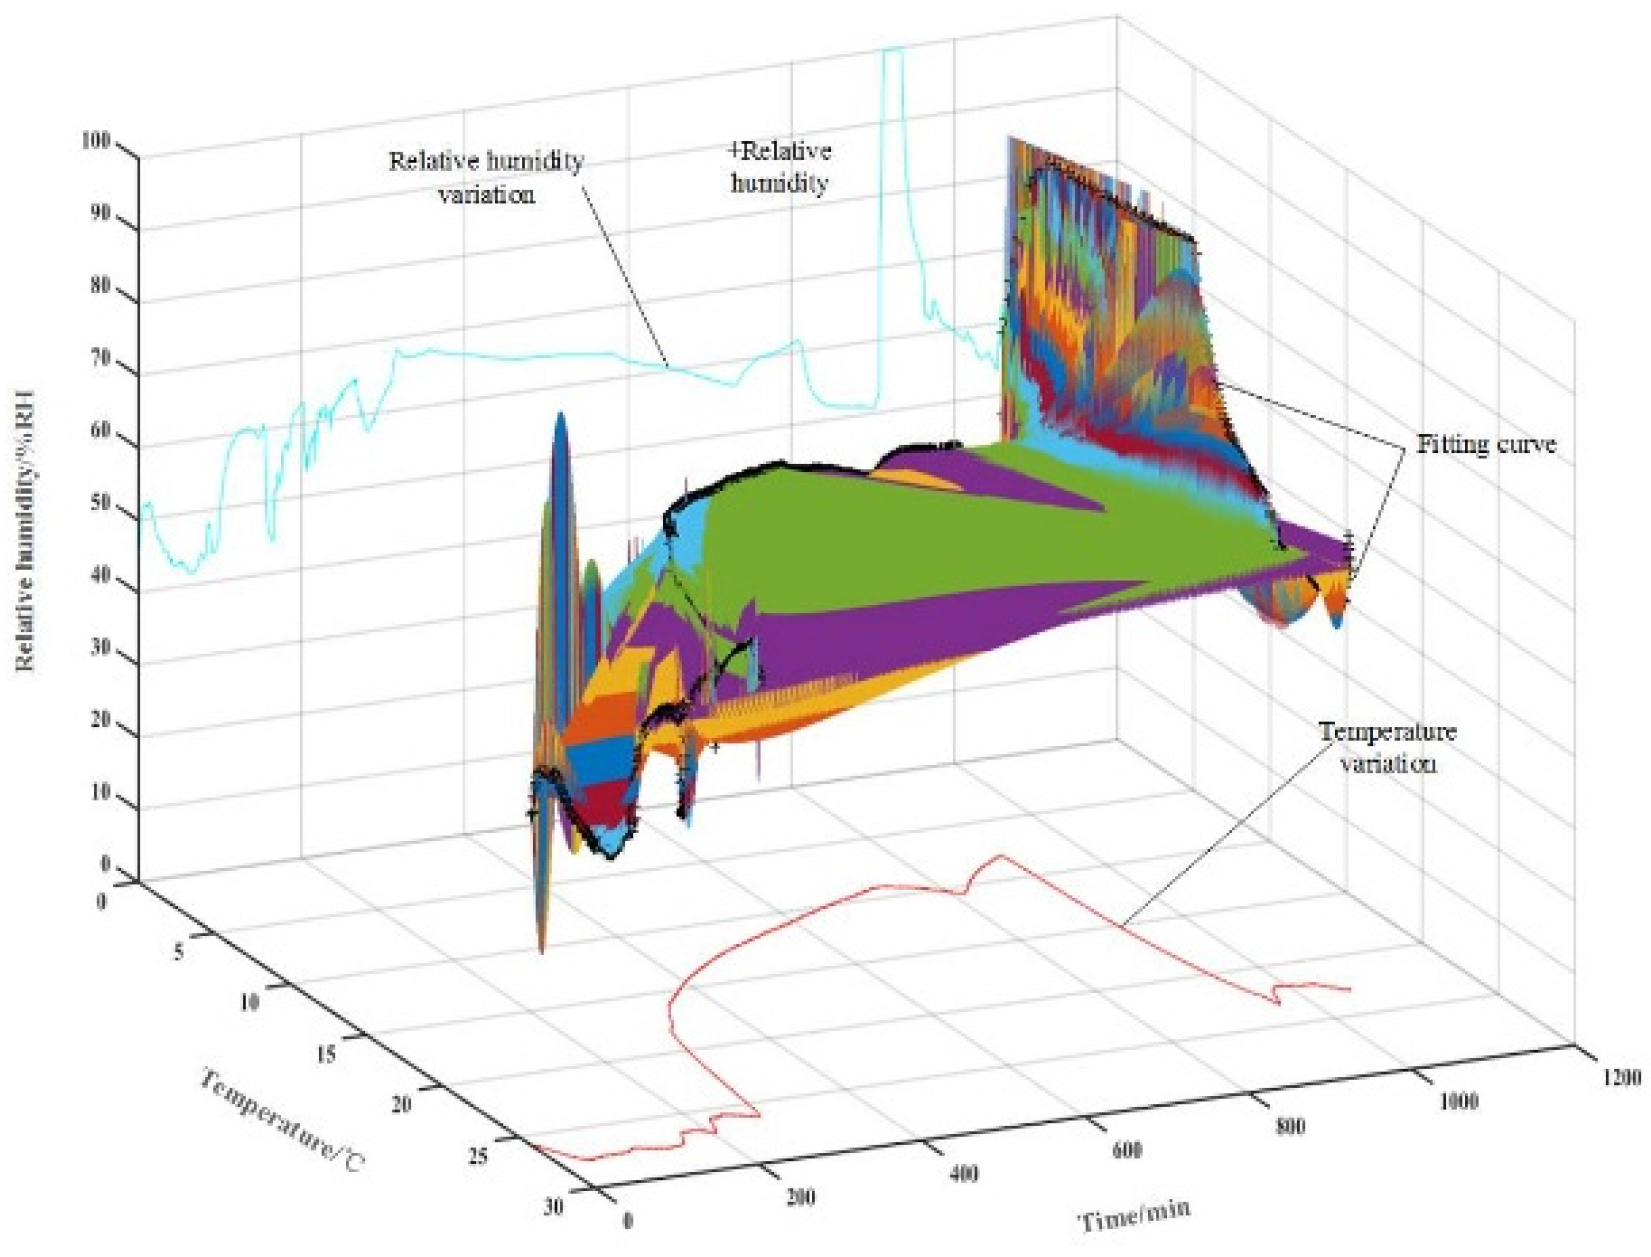
3.2. Environmental Fluctuation Analysis for Cold Chain

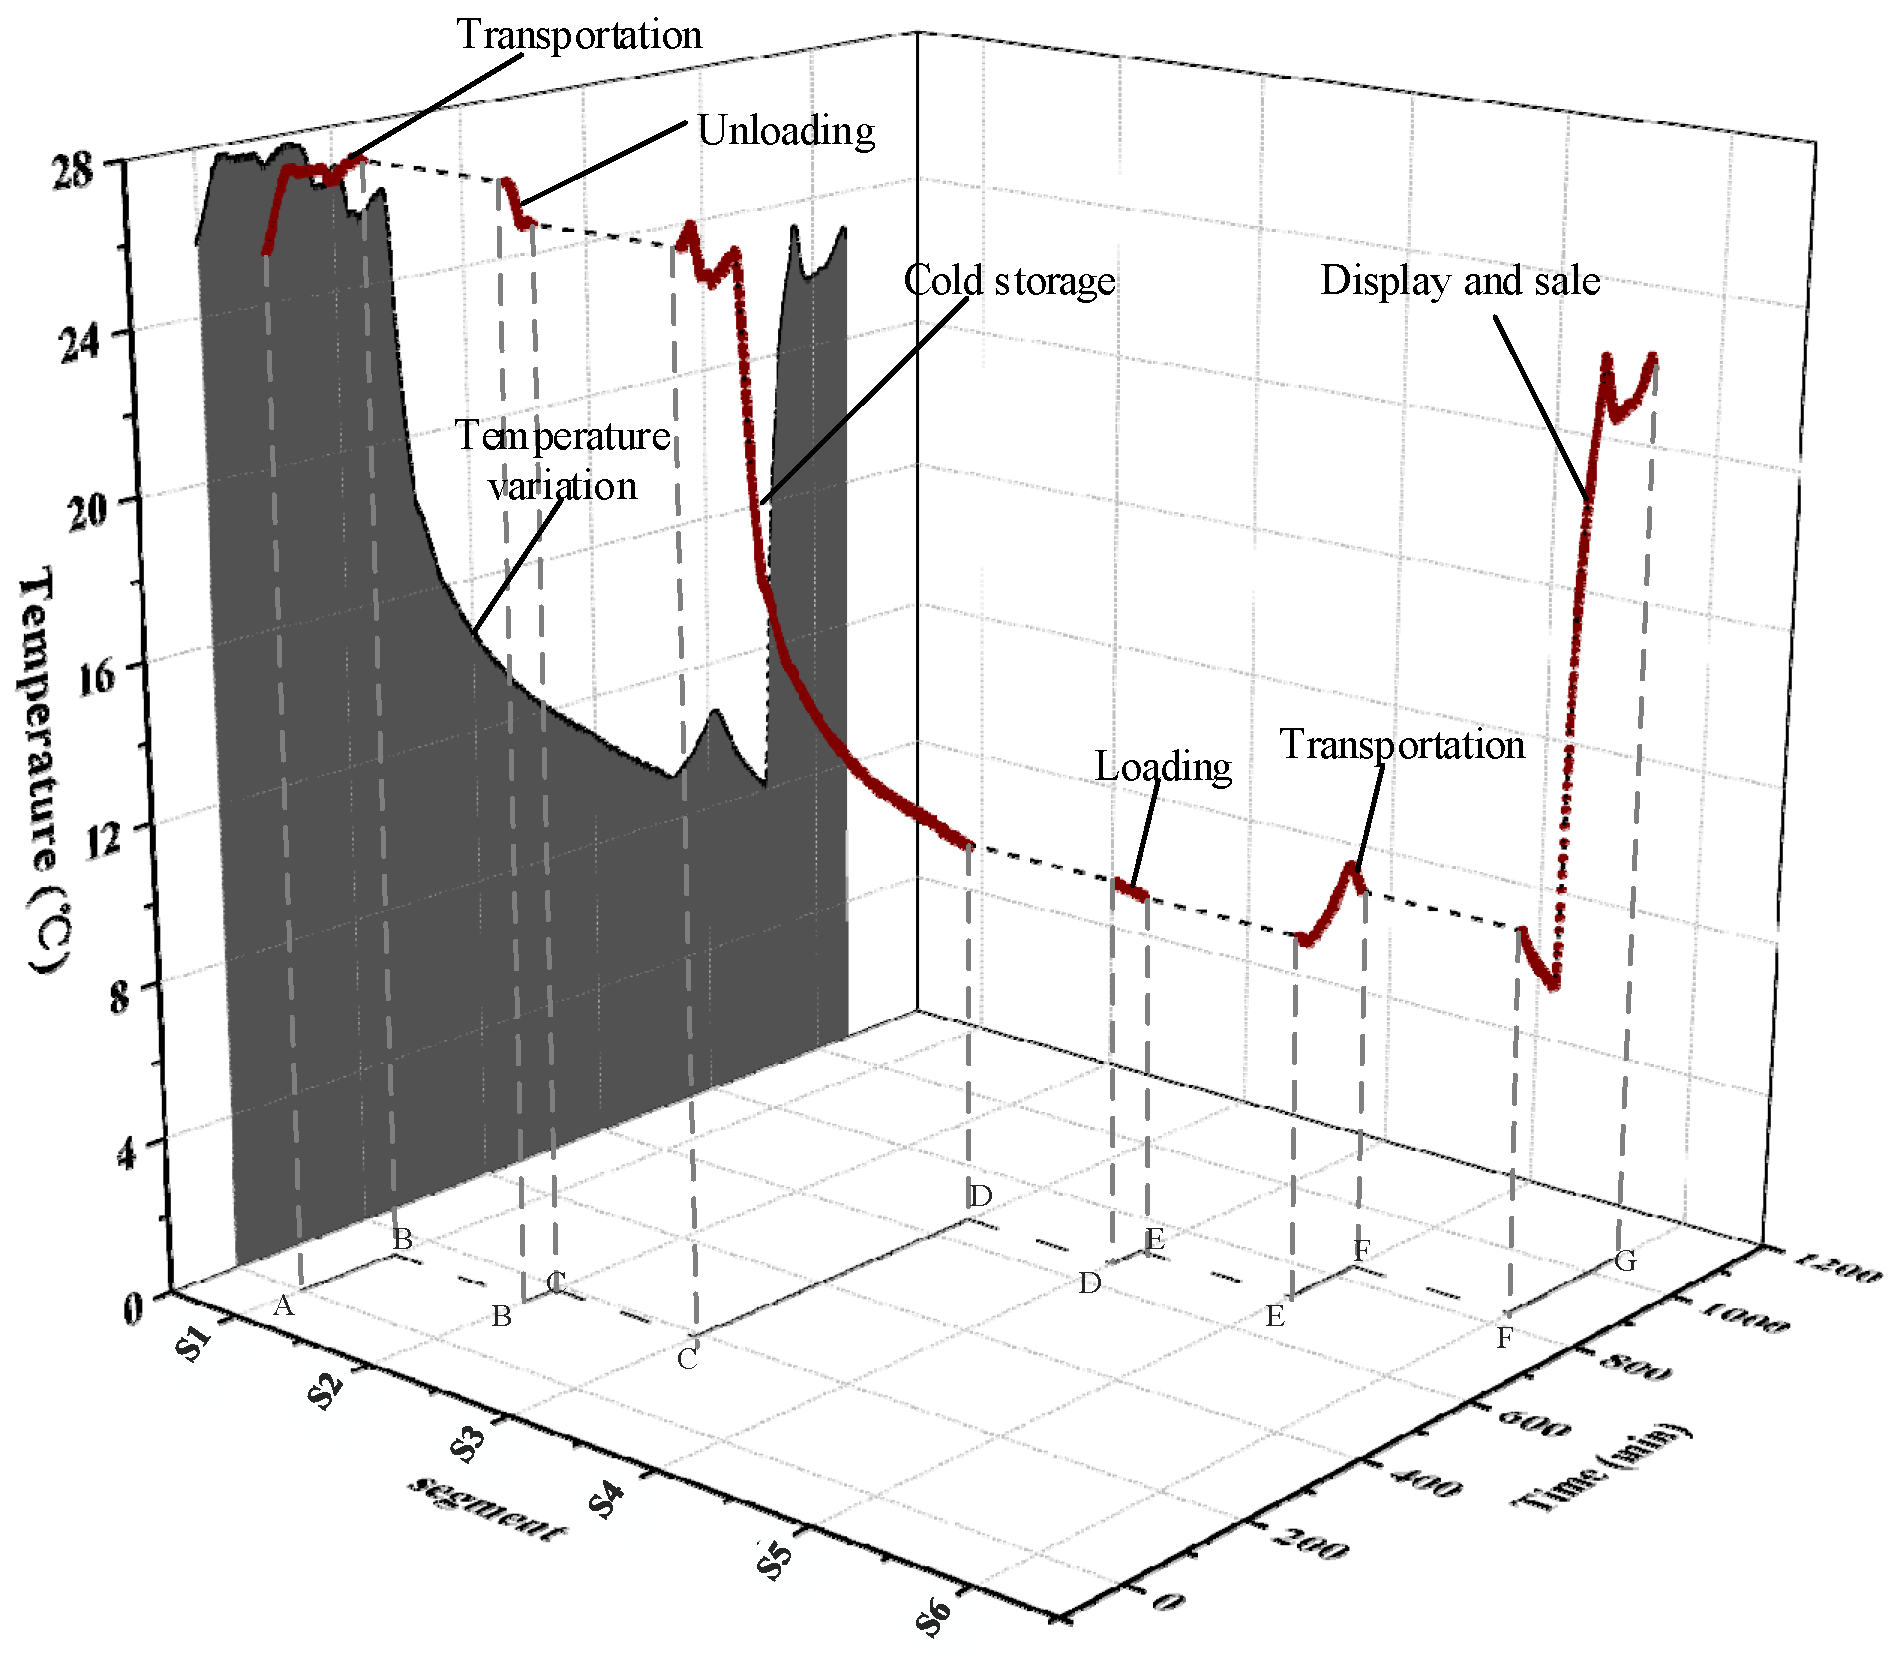
3.2.1. Temperature Change along with Time

The temperature fluctuation for the fresh peach and nectarine cold chain is described in Figure 4. The black shadowed area is the projection of the three-dimensional curve, which stands for the temperature variation with the change of time. The segment S1 represents the normal transportation stage after the fresh fruit were harvested in the orchard. The temperature in the segment S1, which mainly varied with the ambient temperature, ranged from about 25.8 °C to 27.7 °C. The temperature slowly rose because of the influence of the ambient temperature and the energy released by the respiration of fresh fruit. The segment S2 represents the process of unloading the fruit, and the temperature ranged from 26.5 °C to 27.60 °C. The quality management of fresh fruit cold chain demanded a quick fruit unloading. The segment S3 represents the cold storage of fresh fruit at 4 °C refrigeration temperature; at this point the temperature was quickly reduced from 26.08 °C to 9.4 °C. There was a small decrease in temperature in the loading segment, represented by S4. The temperature in the segment S5 started to rise slowly, while the fresh fruit were transported to the market. During the S6, the temperature rose rapidly from 8 °C to the ambient temperature of 23.3 °C.

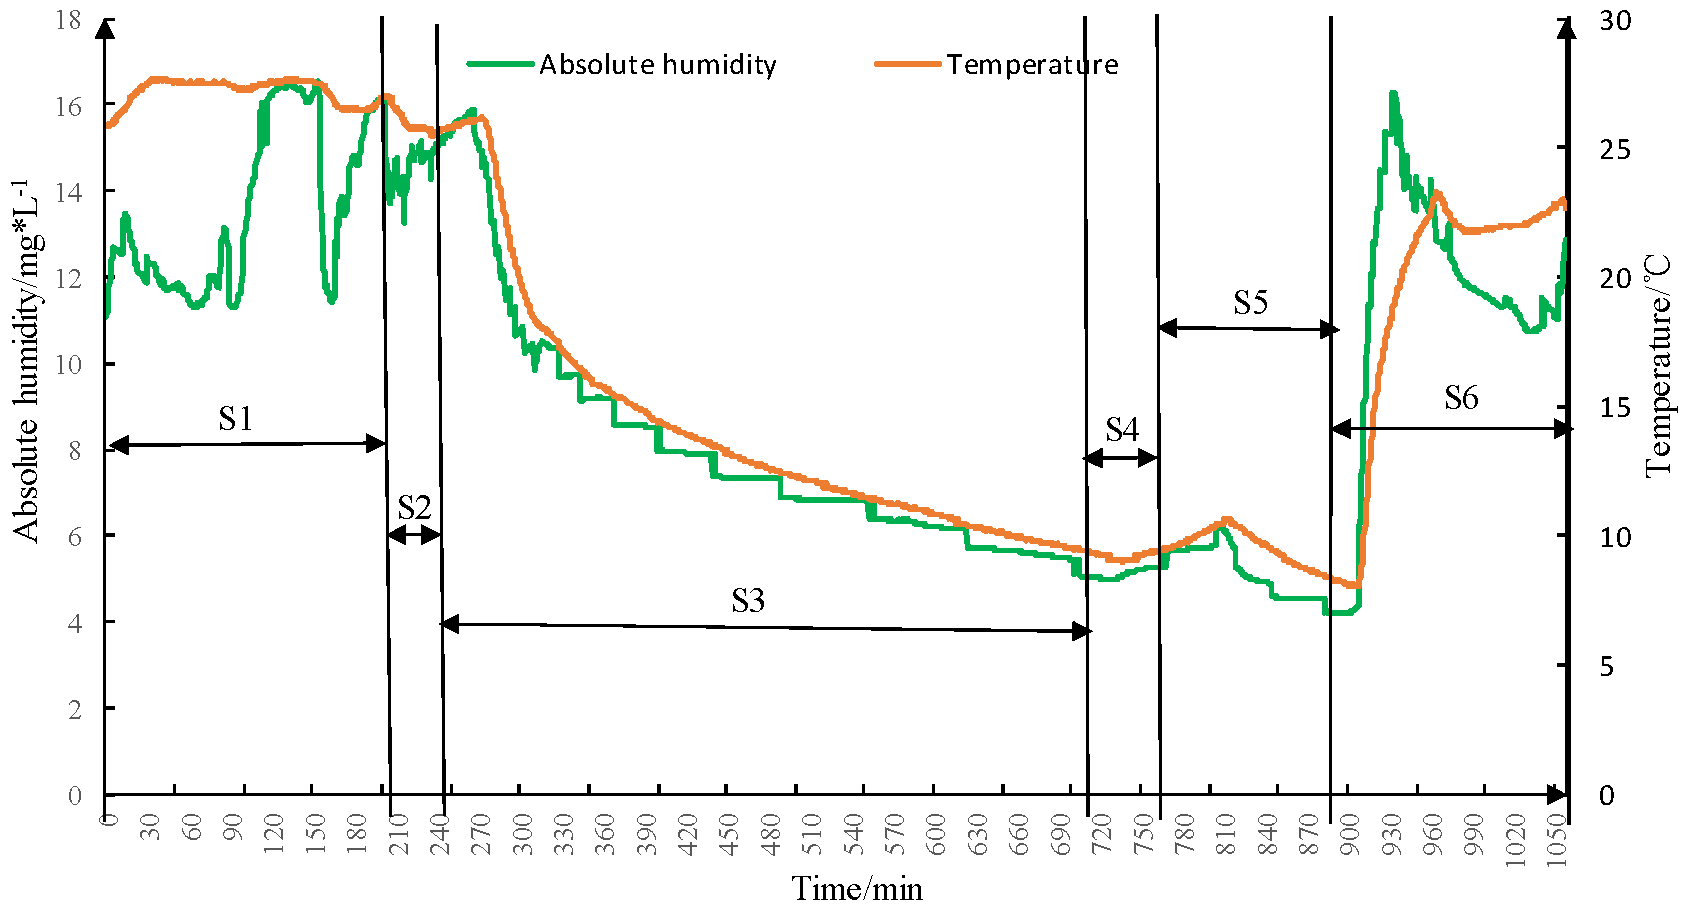
3.2.2. Relative Humidity Change over Time

The relative humidity and temperature fluctuation in the fresh fruit cold chain is illustrated in Figure 5. The green curve is the relative humidity variation over time, and the red curve is the temperature variation over time. During the segment S1, the relative humidity slowly decreased in the beginning and then increased as a consequence of the temperature change and energy released by the respiration of fresh peaches. The relative humidity rapidly rose from 44.40% to 60.8% in the transportation segment S2. The relative humidity of segment S3 had a small fluctuation in the initial stage and then declined slowly as the temperature declined. In the segment S4, the relative humidity decreased continuously. The change of the relative humidity was the same as the change of temperature in the loading segment S5 and S6. The results show that the system worked well and largely reflects the temperature and humidity information of fresh peaches cold chain logistics, which is consistent with other literature [39].
Absolute humidity is the water content of air at a given temperature expressed in grams per cubic meter, which is calculated by the equation of state of a hypothetical ideal gas and the relative humidity. It does not take temperature into consideration. The absolute humidity and temperature fluctuation in the fresh fruit cold chain is showed in Figure 6. The curve trend of absolute humidity and temperature appear almost the same in the S3, S4, S5, and S6 segments.

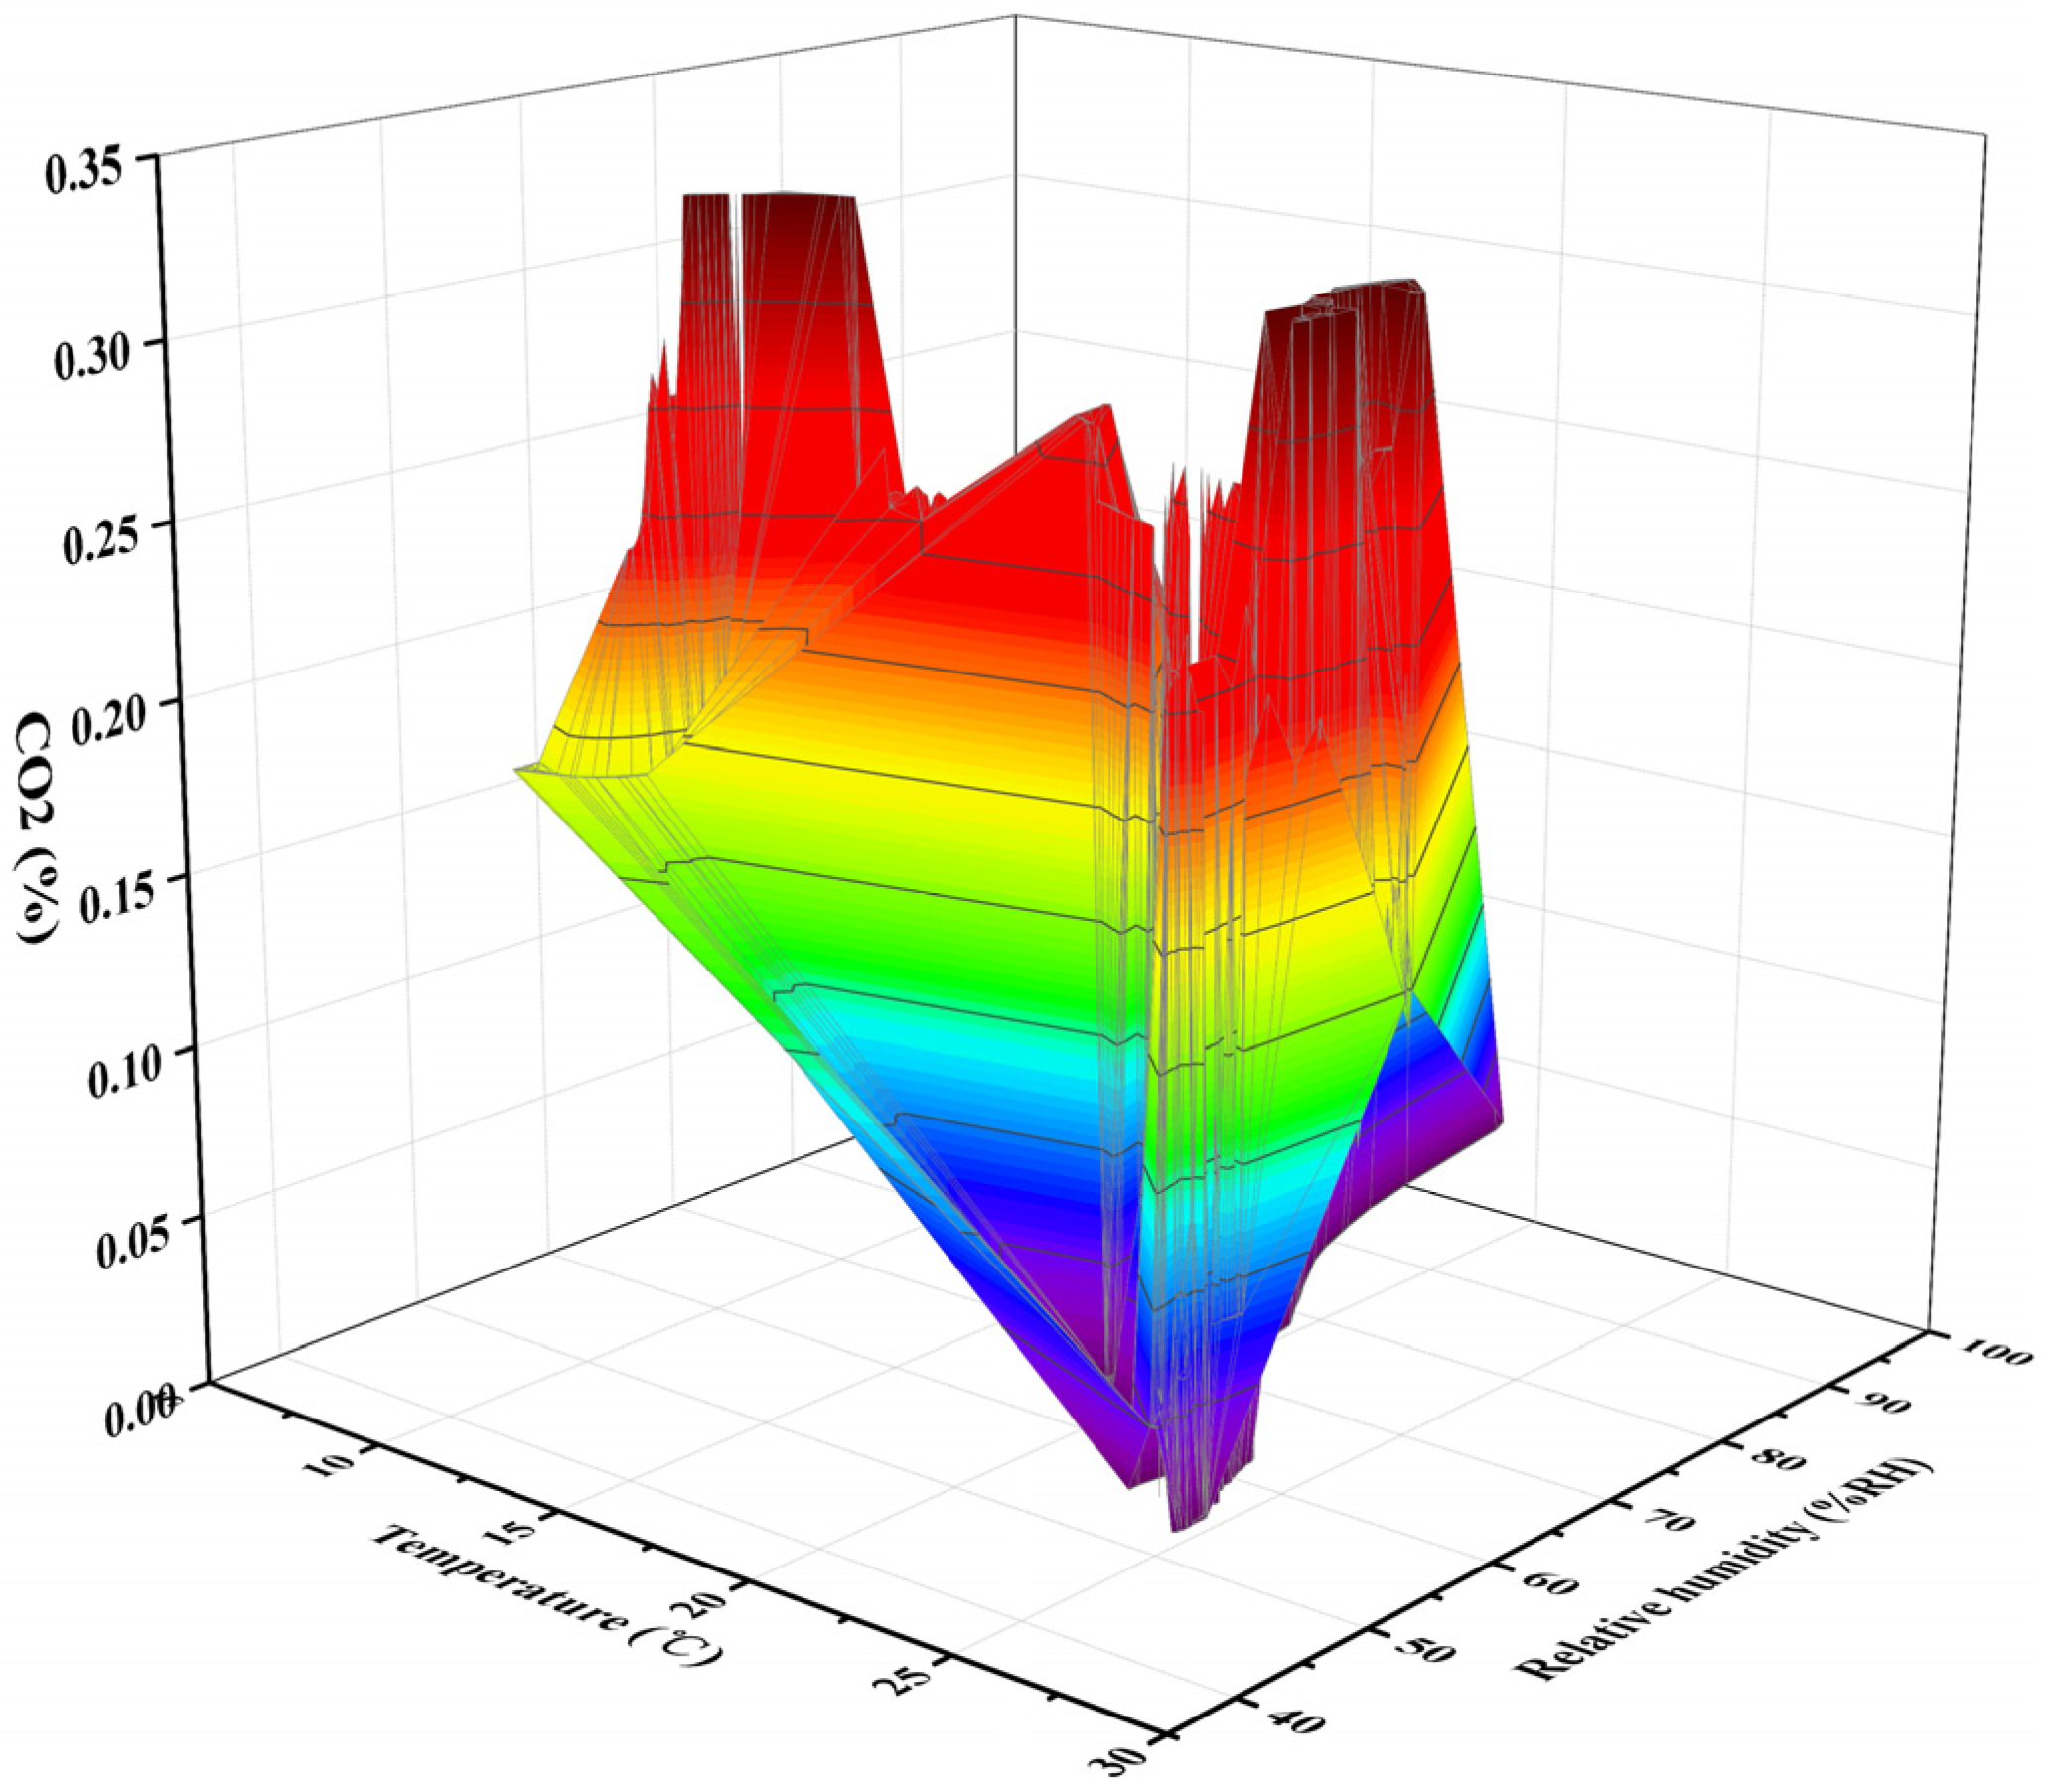
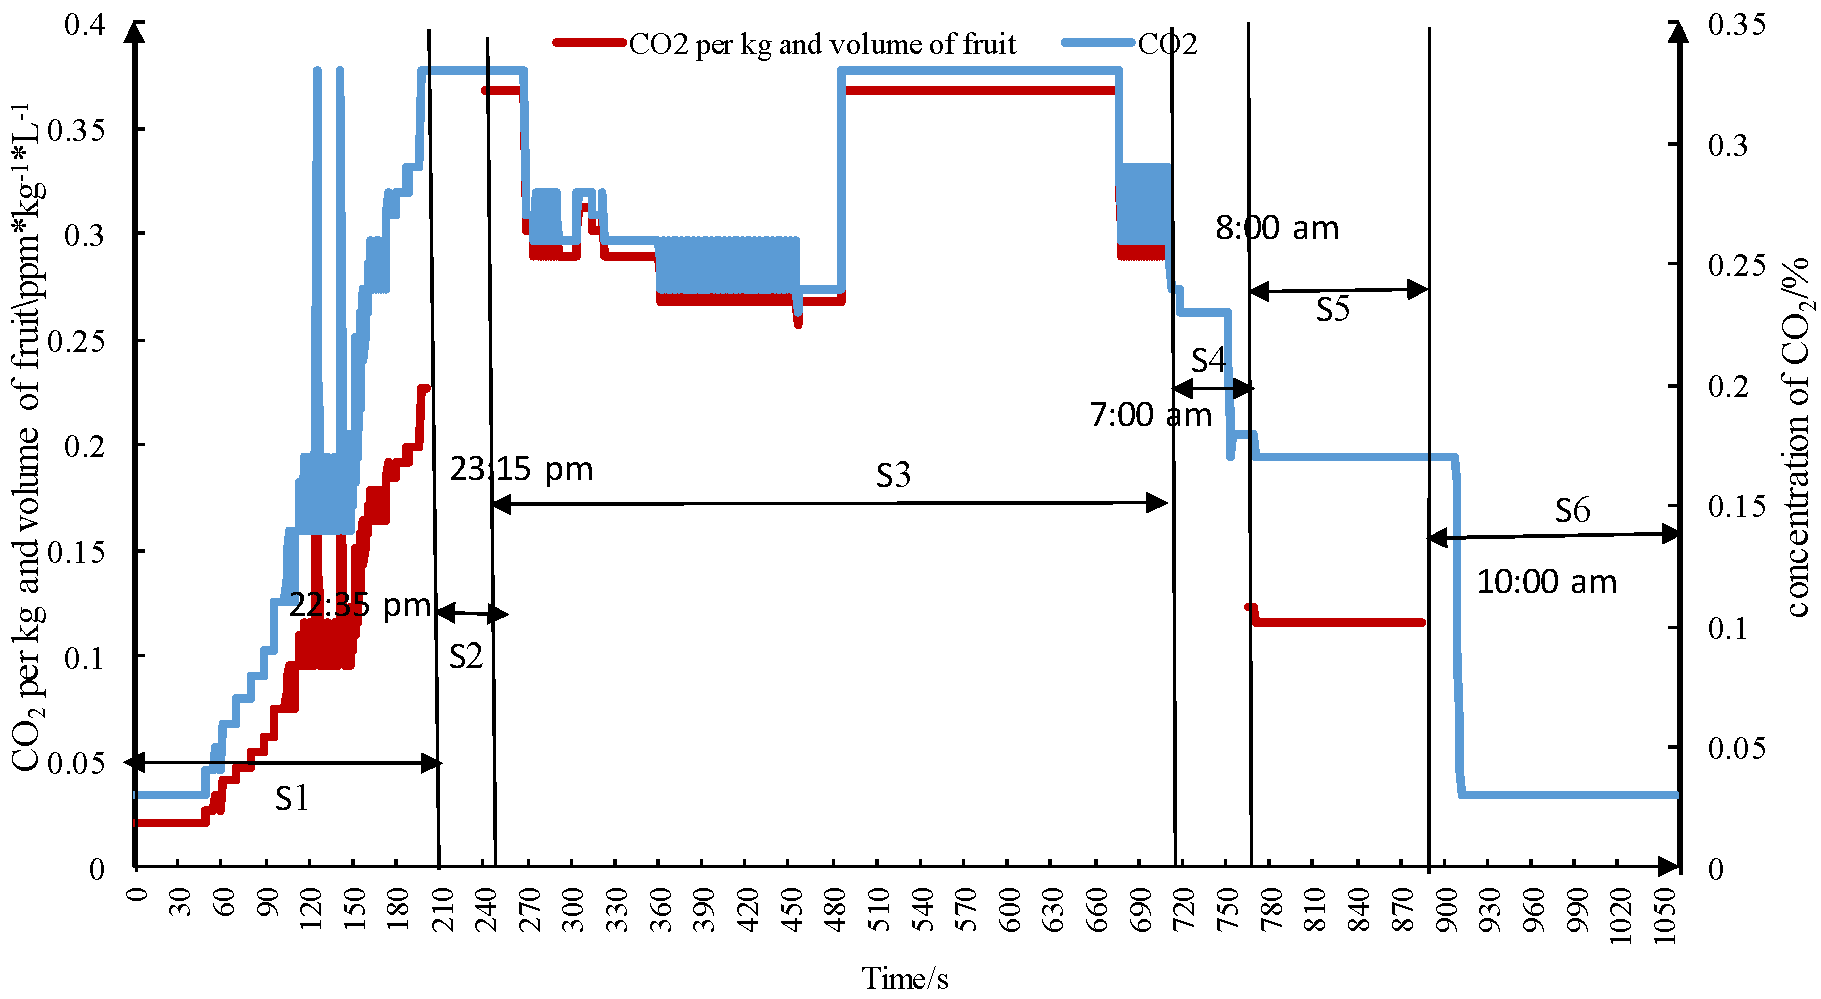
3.2.3. CO2 Level Change with Temperature and Relative Humidity Fluctuation

The CO2 level change with temperature and relative humidity fluctuation in the peach and nectarine cold chain is presented in Figure 7. The curve of the CO2 level is very complex with the energy released by the life activities of fresh fruits and mutual influence of temperature and relative humidity. The curve of CO2 level and the CO2 level per kg and volume of fruit over time is showed in Figure 8. As the volume of headspace for peach and nectarine in the loading, unloading process, and display and sale process is difficult to quantitatively estimate, the CO2 level per kg and volume of fruit over time in these processes are not calculated. Moreover, the curve trend of CO2 level and the CO2 level per kg and volume of fruit over time are the same in the segment S1, S3, and S5 (among them, 0.06% CO2 is equal to the CO2 level of 600 ppm).
The CO2 level experienced rapid changes in segment S1 and S2 from about 0.03% to 0.33%, as the consequence of the influence of the ambient air, temperature, and relative humidity, as well as the respiration of the fresh fruit. During the storage segment S3, the CO2 level changed following a ladder-like fluctuation. The CO2 level declined rapidly in segment S4 and S5 from about 0.33% to 0.03%. During segment S6, after a brief delay the CO2 level experienced a sharp decline due to the effect of temperature and humidity change, then varied with the ambient air. The monitoring data results largely reflect the atmosphere of fresh peach and nectarine cold chain logistics, which could be real-time monitored via the sensor nodes installed. The results show that the system could provide complete and accurate temperature, humidity, and gas monitoring information throughout the cold chain, and was thereby able to provide more effective safety and quality assurance for fresh fruit in the cold chain.

3.2.4. Accuracy Evaluation of Sensor Nodes

Critical factors for the sensor nodes include packet losses rate, battery life, and the accuracy of sensor nodes [31], as can be observed in Table 2. The packet losses rate of radio transmission was below 0.2% in the peach and nectarine cold chain from Kašić to Zagreb, Croatia. The node power management circuit ensured the nodes’ stable operation up until a total voltage drop to 3 V (0% battery charge). The battery charge status varied from 80% to 90% after approximately one day.

3.3. Fruit Quality Parameter Analysis

3.3.1. The Weight Change of Peaches and Nectarines

The data representing the fruit quality in the chain are shown in Table 3. The weight of the peaches and nectarines decreased during the short chain. The average weight loss of nectarine control fruits and nectarines grown under red net were 1.86% and 2.18%, respectively, and there was no significant difference between these two groups. The same situation was with peaches (2.43% and 2.89%, respectively). However, weight loss of peaches grown under red net was significantly higher than for the nectarine control fruit. The results show that weight loss during the short chain was minimal, since in peaches that are immediately stored at low temperature after harvest, observed weight loss can be up to 5% [40], which is double the values obtained in our study.

3.3.2. The Firmness Change of Peaches and Nectarines

The firmness of nectarines and peaches fruit largely decreased during the experimental chain. There were large differences in the fruit softening rates between peaches and nectarines, as well between fruits grown under red net as compared to control fruit. Moreover, the firmness decline rate for nectarines from control trees and nectarines grown under red net were 31.2% and 42.6%, respectively, which is larger than the firmness decline rate of peaches grown under red net (22.07%) and peaches from control (12.71%) trees. The firmness decline rate of fruit grown under red net is higher than in control fruits. This is especially pronounced in nectarines whose softening rate for fruits grown under the red nets was almost double the softening rate of control fruits. In the fresh peach industry, mechanical properties of the fruit flesh and particularly the softening speed are the most limiting factors of fruit quality along the commercial chain [3]. The results of this study show that fruit softening is not only cultivar-dependent [3,41], but is also significantly affected by the red netting since fruits grown under red net softened more rapidly than control fruit. Red netting increases firmness in nectarines [42], which is contrary to the results of our study since no significant differences were found in fruit firmness as affected by red netting. This might be a consequence of some other environmental preharvest factors or cultivar differences. Increased CO2 concentration during cold chain (Figure 6) was always below 5% and could significantly decrease softening [43].

3.3.3. The SSC Change of Peaches and Nectarines

The SSC of nectarines and peaches is largely decreased during the experimental chain. The SSC decline rate of nectarines grown under red net and nectarines from control were 8.15% and 11.06%, respectively. The SSC decline rate for nectarines was more than four times higher than in peaches (2.06% and 2.35%). Regarding the SSC values for nectarines, the decline rate for nectarines grown under the red net was a little smaller than the SSC decline rate of nectarines from control trees. The SSC decline rate of peaches grown under the red net was also a little smaller than the SSC decline rate of peaches from control trees. The quality data results largely reflect the quality change of nectarine and peach fruit in the short chain [37] and suggest that nectarines are more prone to postharvest quality deterioration than peaches. Therefore, postharvest cold chain of nectarines must be monitored and controlled more closely in order to preserve fruit quality.

4. Conclusions

This paper presents the determination and identification of the critical quality parameters for fresh peaches and nectarines in cold chain logistics implemented by the real-time monitoring of temperature, relative humidity, and CO2 fluctuation. The implementation comprises the use of the implemented WSN nodes, and their effect on fresh peach and nectarine fruits, in order to improve the cold chain management as well as provide the sustainability of fresh peach fruit cold chain logistics.
The environmental fluctuation analysis for cold chain demonstrates the temperature, relative humidity, and CO2 characteristics in the fresh peaches and nectarine cold chain logistics. The identification of dramatic changes provides an early warning for the need to take effective measures in advance and resolve any problems that may cause unexpected quality loss.
Several quality parameters for cold chain, such as weight loss, firmness, and SSC can be used to describe the quality change of fresh peaches and provide a comprehensive assessment of fruit quality in general. In this study, the weight of the peaches and nectarines, as well as their firmness and SSC, was largely decreased during the short chain. The quality data suggest that nectarine fruit is more prone to postharvest quality deterioration than peach fruit. Therefore, postharvest cold chain of nectarines must be more precisely monitored and controlled to preserve fruit quality.
The results of this study provide some theoretical basis for the assessment of the fresh peach fruit quality in cold chain logistics, which can be used by producers and distributors in the further planning of their cold chain logistics in order to maintain a good economic value of their products.

Acknowledgments

This work was supported by DBN Young Scholars Research Program and the National Key Research and Development Program of China (2016YFD0400901). This experiment was done in Croatia during a visit by the first author that was supported by the Chinese-Croatian bilateral Scientific and Technological Cooperation Programme (7-1).

Author Contributions

Xiaoshuan Zhang and Tomislav Jemrić conceived and designed the experiments, they made the same contributions. Xiang Wang and Tomislav Jemrić performed the experiments. Xiang Wang and Huijuan Zhou analyzed the data. Maja Matetić contributed materials/analysis tools. Xiang Wang wrote the paper. Xiaoshuan Zhang, Tomislav Jemrić and Maja Matetić contributed to the paper’s modification and refinement.

Conflicts of Interest

The authors declare no conflict of interest.

Practical Applications

The proposed method could be adapted into other fruits postharvest quality monitoring and traceability applications.

References

  1. Gang, C.; Li, J.; Chen, Y.; Wang, Y.; Li, H.; Pan, B.; Odeh, I. Synergistic Effect of Chemical Treatments on Storage Quality and Chilling Injury of Honey Peaches. J. Food Process. Preserv. 2015, 39, 1108–1117. [Google Scholar] [CrossRef]
  2. Rizzolo, A.; Bianchi, G.; Vanoli, M.; Lurie, S.; Spinelli, L.; Torricelli, A. Electronic nose to detect volatile compound profile and quality changes in ‘Spring Belle’ peach (Prunus persica L.) during cold storage in relation to fruit optical properties measured by time-resolved reflectance spectroscopy. J. Agric. Food Chem. 2013, 61, 1671–1685. [Google Scholar] [CrossRef] [PubMed]
  3. Shinya, P.; Contador, L.; Predieri, S.; Rubio, P.; Infante, R. Peach ripening: Segregation at harvest and postharvest flesh softening. Postharvest Biol. Technol. 2013, 86, 472–478. [Google Scholar] [CrossRef]
  4. Zhang, L.; Chen, F.; Yang, H.; Sun, X.; Liu, H.; Gong, X.; Jiang, C.; Ding, C. Changes in firmness, pectin content and nanostructure of two crisp peach cultivars after storage. LWT-Food Sci. Technol. 2010, 43, 26–32. [Google Scholar] [CrossRef]
  5. Zhang, L.; Chen, F.; Yang, H.; Ye, X.; Sun, X.; Liu, D.; Yang, B.; An, H.; Deng, Y. Effects of temperature and cultivar on nanostructural changes of water-soluble pectin and chelate-soluble pectin in peaches. Carbohydr. Polym. 2012, 87, 816–821. [Google Scholar] [CrossRef]
  6. Raffo, A.; Nardo, N.; Tabilio, M.R.; Paoletti, F. Effects of cold storage on aroma compounds of white- and yellow-fleshed peaches. Eur. Food Res. Technol. 2008, 226, 1503–1512. [Google Scholar] [CrossRef]
  7. Laguerre, O.; Hoang, H.M.; Flick, D. Experimental investigation and modelling in the food cold chain: Thermal and quality evolution. Trends Food Sci. Technol. 2013, 29, 87–97. [Google Scholar] [CrossRef]
  8. Aung, M.M.; Chang, Y.S. Temperature management for the quality assurance of a perishable food supply chain. Food Control 2014, 40, 198–207. [Google Scholar] [CrossRef]
  9. Lim, T.-P.; Chye, F.Y.; Sulaiman, M.R.; Suki, N.M.; Lee, J.-S. A structural modeling on food safety knowledge, attitude, and behaviour among Bum Bum Island community of Semporna, Sabah. Food Control 2016, 60, 241–246. [Google Scholar] [CrossRef]
  10. Hertog, M.L.A.T.M.; Uysal, I.; McCarthy, U.; Verlinden, B.M.; Nicolaï, B.M. Shelf life modelling for first-expired-first-out warehouse management. Philos. Trans. R. Soc. A Math. Phys. Eng. Sci. 2014, 372, 20130306. [Google Scholar] [CrossRef] [PubMed]
  11. Sciortino, R.; Micale, R.; Enea, M.; La Scalia, G. A webGIS-based system for real time shelf life prediction. Comput. Electron. Agric. 2016, 127, 451–459. [Google Scholar] [CrossRef]
  12. Li, Y.X.; Wang, G.X.; Liang, L.S. Effect of cold acclimation treatment and exogenous ethylene treatment on woolliness related enzymes on ‘Okubo’ peach fruits during low temperature storage. Acta Hortic. 2012, 934, 1103–1109. [Google Scholar] [CrossRef]
  13. Infante, R.; Aros, D.; Contador, L.; Rubio, P. Does the maturity at harvest affect quality and sensory attributes of peaches and nectarines? N. Z. J. Crop Hortic. Sci. 2012, 40, 103–113. [Google Scholar] [CrossRef]
  14. Yang, H.; Chen, F.; An, H.; Lai, S. Comparative studies on nanostructures of three kinds of pectins in two peach cultivars using atomic force microscopy. Postharvest Biol. Technol. 2009, 51, 391–398. [Google Scholar] [CrossRef]
  15. Girardi, C.L.; Corrent, A.R.; Lucchetta, L.; Zanuzo, M.R.; Da Costa, T.S.; Brackmann, A.; Twyman, R.M.; Nora, F.R.; Nora, L.; Silva, J.A.; et al. Effect of ethylene, intermittent warming and controlled atmosphere on postharvest quality and the occurrence of woolliness in peach (Prunus persica cv. Chiripá) during cold storage. Postharvest Biol. Technol. 2005, 38, 25–33. [Google Scholar] [CrossRef]
  16. Akbudak, B.; Eris, A. Physical and chemical changes in peaches and nectarines during the modified atmosphere storage. Food Control 2004, 15, 307–313. [Google Scholar] [CrossRef]
  17. Lurie, S.; Crisosto, C.H. Chilling injury in peach and nectarine. Postharvest Biol. Technol. 2005, 37, 195–208. [Google Scholar] [CrossRef]
  18. Ortiz, A.; Echeverría, G.; Graell, J.; Lara, I. Overall quality of ‘Rich Lady’ peach fruit after air- or CA storage. The importance of volatile emission. LWT-Food Sci. Technol. 2009, 42, 1520–1529. [Google Scholar] [CrossRef]
  19. Ahmed, M.J.; Singh, Z.; Khan, A.S. Postharvest Aloe vera gel-coating modulates fruit ripening and quality of ‘Arctic Snow’ nectarine kept in ambient and cold storage. Int. J. Food Sci. Technol. 2009, 44, 1024–1033. [Google Scholar] [CrossRef]
  20. Jin, P.; Wang, K.; Shang, H.; Tong, J.; Zheng, Y. Low-temperature conditioning combined with methyl jasmonate treatment reduces chilling injury of peach fruit. J. Sci. Food Agric. 2009, 89, 1690–1696. [Google Scholar] [CrossRef]
  21. Zhang, B.; Xi, W.; Wei, W.; Shen, J.; Ferguson, I.; Chen, K. Changes in aroma-related volatiles and gene expression during low temperature storage and subsequent shelf-life of peach fruit. Postharvest Biol. Technol. 2011, 60, 7–16. [Google Scholar] [CrossRef]
  22. Zhu, S.; Liu, M.; Zhou, J. Inhibition by nitric oxide of ethylene biosynthesis and lipoxygenase activity in peach fruit during storage. Postharvest Biol. Technol. 2006, 42, 41–48. [Google Scholar] [CrossRef]
  23. Casals, C.; Teixidó, N.; Viñas, I.; Llauradó, S.; Usall, J. Control of Monilinia spp. on stone fruit by curing treatments: Part I. The effect of temperature, exposure time and relative humidity on curing efficacy. Postharvest Biol. Technol. 2010, 56, 19–25. [Google Scholar] [CrossRef]
  24. Ziosi, V.; Noferini, M.; Fiori, G.; Tadiello, A.; Trainotti, L.; Casadoro, G.; Costa, G. A new index based on vis spectroscopy to characterize the progression of ripening in peach fruit. Postharvest Biol. Technol. 2008, 49, 319–329. [Google Scholar] [CrossRef]
  25. Ortiz, A.; Seymour, G.B.; Tucker, G.A.; Lara, I. Cell wall disassembly during the melting phase of softening in ‘Snow Queen’ nectarines. Postharvest Biol. Technol. 2010, 58, 88–92. [Google Scholar] [CrossRef]
  26. La Scalia, G.; Nasca, A.; Corona, O.; Settanni, L.; Micale, R. An innovative shelf life model based on smart logistic unit for an efficient management of the perishable food supply chain. J. Food Process Eng. 2015, 40. [Google Scholar] [CrossRef]
  27. Xiao, X.; Wang, X.; Zhang, X.; Chen, E.; Li, J. Effect of the Quality Property of Table Grapes in Cold Chain Logistics-Integrated WSN and AOW. Appl. Sci. 2015, 5, 747–760. [Google Scholar] [CrossRef]
  28. Xiao, X.; He, Q.; Fu, Z.; Xu, M.; Zhang, X. Applying CS and WSN methods for improving efficiency of frozen and chilled aquatic products monitoring system in cold chain logistics. Food Control 2016, 60, 656–666. [Google Scholar] [CrossRef] [Green Version]
  29. Wang, J.; Wang, H.; He, J.; Li, L.; Shen, M.; Tan, X.; Min, H.; Zheng, L. Wireless sensor network for real-time perishable food supply chain management. Comput. Electron. Agric. 2015, 110, 196–207. [Google Scholar] [CrossRef]
  30. Qi, L.; Xu, M.; Fu, Z.; Mira, T.; Zhang, X. C2SLDS: A WSN-based perishable food shelf-life prediction and LSFO strategy decision support system in cold chain logistics. Food Control 2014, 38, 19–29. [Google Scholar] [CrossRef] [Green Version]
  31. Ruiz-Garcia, L.; Barreiro, P.; Robla, J.I. Performance of ZigBee-Based wireless sensor nodes for real-time monitoring of fruit logistics. J. Food Eng. 2008, 87, 405–415. [Google Scholar] [CrossRef] [Green Version]
  32. Mahajan, P.V.; Caleb, O.J.; Singh, Z.; Watkins, C.B.; Geyer, M. Postharvest treatments of fresh produce. Philos. Trans. R. Soc. A Math. Phys. Eng. Sci. 2014, 372, 20130309. [Google Scholar] [CrossRef] [PubMed]
  33. Lee, T.-C.; Zhong, P.-J.; Chang, P.-T. The effects of preharvest shading and postharvest storage temperatures on the quality of ‘Ponkan’ (Citrus reticulata Blanco) mandarin fruits. Sci. Hortic. 2015, 188, 57–65. [Google Scholar] [CrossRef]
  34. Shahak, Y. Photoselective netting: An overview of the concept, R&D and practical implementation in agriculture. Acta Hortic. 2014, 1015, 155–162. [Google Scholar]
  35. Shahak, Y.; Kong, Y.; Ratner, K. The wonders of yellow netting. Acta Hortic. 2016, 1134, 327–334. [Google Scholar] [CrossRef]
  36. Cano-Salazar, J.; Echeverría, G.; Crisosto, C.H.; Lopez, L. Cold-Storage Potential of Four Yellow-Fleshed Peach Cultivars Defined by Their Volatile Compounds Emissions, Standard Quality Parameters, and Consumer Acceptance. J. Agric. Food Chem. 2012, 60, 1266–1282. [Google Scholar] [CrossRef] [PubMed]
  37. Cano-Salazar, J.; López, M.L.; Echeverría, G. Relationships between the instrumental and sensory characteristics of four peach and nectarine cultivars stored under air and CA atmospheres. Postharvest Biol. Technol. 2013, 75, 58–67. [Google Scholar] [CrossRef]
  38. Ma, C.; Fu, Z.; Xu, M.; Trebar, M.; Zhang, X. Evaluation on home storage performance of table grape based on sensory quality and consumers’ satisfaction. J. Food Sci. Technol. 2016, 53, 1363–1370. [Google Scholar] [CrossRef] [PubMed] [Green Version]
  39. Aiello, G.; La Scalia, G.; Micale, R. Simulation analysis of cold chain performance based on time–temperature data. Prod. Plan. Control 2012, 23, 468–476. [Google Scholar] [CrossRef]
  40. Tareen, M.J.; Abbasi, N.A.; Hafiz, I.A. Postharvest application of salicylic acid enhanced antioxidant enzyme activity and maintained quality of peach cv. ‘Flordaking’ fruit during storage. Sci. Hortic. 2012, 142, 221–228. [Google Scholar] [CrossRef]
  41. Giné-Bordonaba, J.; Cantín, C.M.; Echeverría, G.; Ubach, D.; Larrigaudière, C. The effect of chilling injury-inducing storage conditions on quality and consumer acceptance of different Prunus persica cultivars. Postharvest Biol. Technol. 2016, 115, 38–47. [Google Scholar] [CrossRef]
  42. Giaccone, M.; Forlani, M.; Basile, B. Tree vigor, fruit yield and quality of nectarine trees grown under red photoselective anti-hail nets in southern Italy. Acta Hortic. 2012, 287–293. [Google Scholar] [CrossRef]
  43. Nanos, G.D.; Mitchell, F.G. Carbon dioxide injury and flesh softening following high-temperature conditioning in peaches. Hortscience 1991, 26, 562–563. [Google Scholar]
Figure 1. The transport route used in the experiment.
Applsci 07 00133 g001
Figure 2. The physical implementation of the WSN (wireless sensor network) nodes. (a) The flow chart of slave sensor node; (b) Hardware of master sensor node.
Applsci 07 00133 g002
Figure 3. Process and information flow of the peach and nectarine cold chain.
Applsci 07 00133 g003
Figure 4. The temperature fluctuation in the fresh peach and nectarine cold chain.
Applsci 07 00133 g004
Figure 5. The relative humidity and temperature fluctuation in the fresh fruit cold chain.
Applsci 07 00133 g005
Figure 6. The absolute humidity and temperature fluctuation in the fresh fruit cold chain.
Applsci 07 00133 g006
Figure 7. The CO2 level change with temperature and relative humidity fluctuation for the peach and nectarine cold chain.
Applsci 07 00133 g007
Figure 8. The curve of CO2 level and the CO2 level per kg and volume of fruit over time.
Applsci 07 00133 g008
Table 1. Monitoring parameters for peach and nectarine cold-chain.
ParameterTemperature RangeHumidity RangeVolume of CO2GPS Module
Theoretical range−2 °C–36 °C50%–95%0%–5%Maximum height: 50,000 m
Sensor moduleAM2322AM2322ATIU-BLOX M8030
Sensor range−40 °C–80 °C0%–99.9%0%–5%WGS-84
Sensor accuracy<±0.3 °C±2%±0.1%Speed error < 0.1 m/s, direction error < 0.5 degrees
Response time5 s5 s<30 sTime accuracy: 30 ns
Power consumption<0.1 mW<0.1 mW<25 mW<35 mW
Table 2. The accuracy evaluation of sensor nodes.
SpeciesPacket Losses RateAccuracy ErrorBattery Charge Status
Kašić-Zagreb cold chain<0.2% (2100) aTemperature: <0.75%80%–90% (1 day)
humidity: <2%
CO2: <2%
Distance error of GPS: <30 m
a Number of measurements.
Table 3. The quality of peaches and nectarines in the experimental fresh peach and nectarine chain.
SampleAverage Weight Loss (%)Initial FirmnessFinal FirmnessFirmness Decline Rate (%) xInitial SSCFinal SSCSSC Decline Rate (%) x
nectarine control1.86 b3.59 ab2.47 ab31.209.23 a8.21 a11.06
nectarine red net2.18 ab3.85 a2.21 b42.609.20 a8.45 a8.15
peach control2.43 ab2.99 bc2.61 a12.718.50 ab8.3 a2.35
peach red net2.89 a2.94 c2.29 ab22.078.27 b8.1 a2.06
Note: Values inside column followed by the same letter are not statistically significant according to LSD (Least Significant Difference) test at p ≤ 0.05 level; X—statistical analysis was not performed.

