Article

Effects of Nominal Maximum Aggregate Size on the Performance of Stone Matrix Asphalt

Highway College, Chang’An University, Xi’an 710064, China
*
Author to whom correspondence should be addressed.
Appl. Sci. 2017, 7(2), 126; https://doi.org/10.3390/app7020126
Submission received: 14 November 2016 / Revised: 15 January 2017 / Accepted: 20 January 2017 / Published: 26 January 2017
(This article belongs to the Section Materials Science and Engineering)

Abstract

:
It is well known that the performance of hot mix asphalt (HMA) in service life is closely related to a proper aggregate gradation. A laboratory study was conducted to investigate the effects of nominal maximum aggregate size (NMAS) on the performance of stone matrix asphalt (SMA). The volumetric characteristics and performance properties obtained from wheel tracking tests, permeability test, beam bending test, contabro test are compared for SMA mixes with different NMAS. The results indicated that voids in mineral aggregate (VMA) and voids filled with asphalt (VFA) of SMA mixtures increased with a decrease of aggregate size in aggregate gradation. SMA30 had the lowest optimum asphalt content among all the mixtures. Increase of NMAS contributed to improvement of the rutting resistance of SMA mixtures. However, a decrease of NMAS showed better cracking and raveling resistance. Permeability rate of SMA was primarily affected by the air voids (AV) and break point sieve, but was also sensitive to aggregate gradation to some extent, with reduced NMAS corresponding to less permeability rate. Based on the test results, SMA5 and SMA13 are suggested to be used as a water-proof layer in bridge deck pavement, and SMA20 and SMA30 are suggested to be used as binder course in asphalt pavement, which needs to possess superior rutting resistance at high temperature.

Graphical Abstract

1. Introduction

Stone matrix asphalt (SMA) has been used successfully in Europe for over 20 years. SMA was first used in Europe as a mixture to resist the wear of studded tires. However, an additional benefit found about SMA was its superior rutting resistance [1,2].
SMA is a type of hot mix asphalt (HMA) characterized by higher content of coarse aggregate and rich mastic, which is composed of relatively high contents of asphalt binder and mineral fillers, and small contents of fine aggregate and stabilized additives. Gap-graded aggregates with stone-on-stone contact renders SMA highly resistant to shear deformation. Compared with dense graded mixture, SMA contains more asphalt binder, which leads to a durable asphalt mixture with better resistance to cracking, moisture damage and age-hardening. The addition of stabilizers, such as fiber, is just used to prevent the drain down of asphalt binder during the production and placement of SMA [3,4].
Among all the elements in the composition of HMA, aggregate gradation is perhaps the most important one affecting the performance of asphalt mixture. Various methods for aggregate gradation design have been studied and provided. The Bailey method has been promoted in recent years to select aggregate gradation in HMA and performed well in Illinois. A set of characteristic sieves have been defined in the Bailey method according to EN 13108-1 [5], which has offered effective tools to design and evaluate the aggregate packing in HMA. For SMA with aggregate gradation designed by the Bailey method, low water damage and in turn good durability can usually be accomplished [6]. However, due to the lack of extensive verification in field, the Bailey method is still not fully known to help designers to choose appropriate aggregate gradation [7].
For the HMA designed by Superpave mix design procedure, aggregate gradation is not only crucial to the volumetric properties, but also an important determining factor in the performance of asphalt mixture. The aggregate gradation is known to affect the stiffness, stability, durability, permeability, workability, fatigue resistance, skid resistance and moisture sensitivity of asphalt mixture [8].
According to the results of an investigation by Ruth et al., a well-balanced, continuously graded mix provides the best rut resistance for Superpave mixtures [9].
Hot mix asphalt mixtures with a larger maximum aggregate size generally exhibit a resistance to permanent deformation that is superior to that of mixes with a smaller maximum aggregate size. The effect of NMAS on SMA designed mixtures is of considerable interest, the research was needed to objectively assess the role of NMAS in the overall performance of SMA.
For bases that use a dense-graded friction course (Splittmastic asphalts) and an open-graded frication course (porous European mixes), it is well known that pavement texture impacts surface performance, type-vehicles interaction and road safety. At a given level of compaction, the thickness of the sample affects volumetric, texture spectrum and the expected life of the pavement [10,11].
David Woodward et al. summarized a laboratory investigation into the Wear Stone Mastic Asphalt road surfacing material. They found that 14 mm and 10 mm SMA behave in similar ways using The Road Test Machine. The main difference is that SMA14 has greater possible macrotexture [
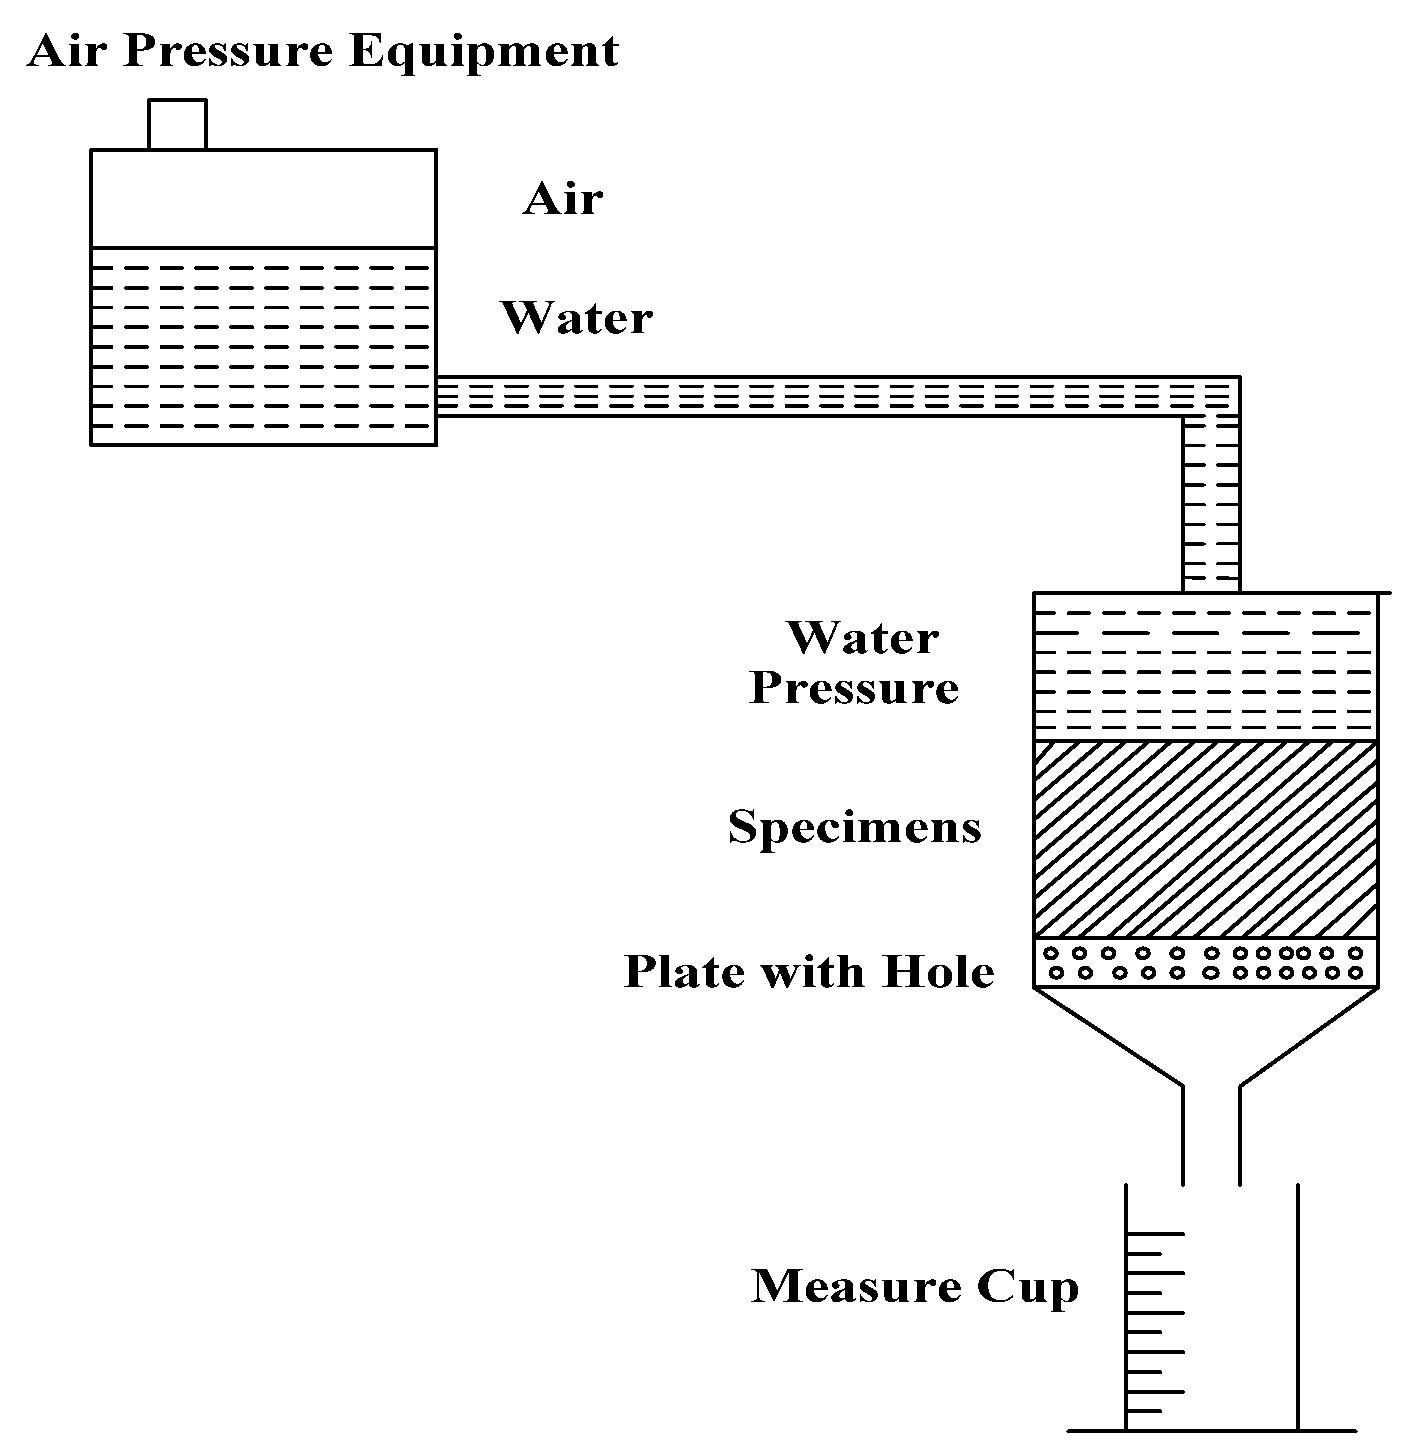
12]. SMA has special composition and structure which is different from common asphalt mixture. To find out what influence the aggregate characteristics have on performance, we need to evaluate the effects of different NMAS on SMA by various fundamental engineering tests, such as the wheel tracking test, three-point bending test, permeability test and Cantabro test. The results are conducive to guide the design and application of SMA in actual projects.

2. Materials

Properties of different aggregates are shown in Table 1. The mineral filler used was limestone power, and cellulose fiber as a drainage inhibitor for asphalt binder was applied in SMA. Properties of both are shown in Table 2 and Table 3. A straight 60/80 penetration graded asphalt was used for all mixtures. Properties of asphalt are shown in Table 4. The fiber was added at 0.3% by the mass of mixture.

3. Gradations of SMA Mixtures

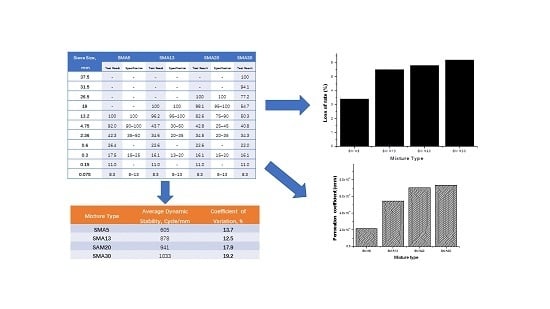
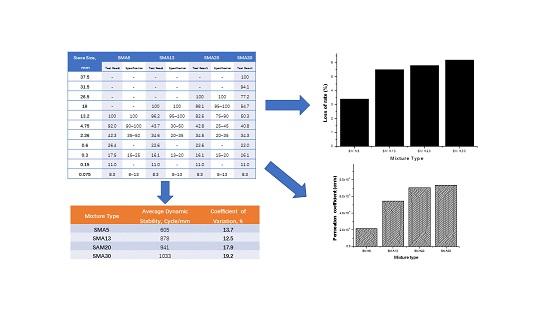
The gradations of SMA5, SMA13, SMA20 and SMA30 are presented in Table 5.
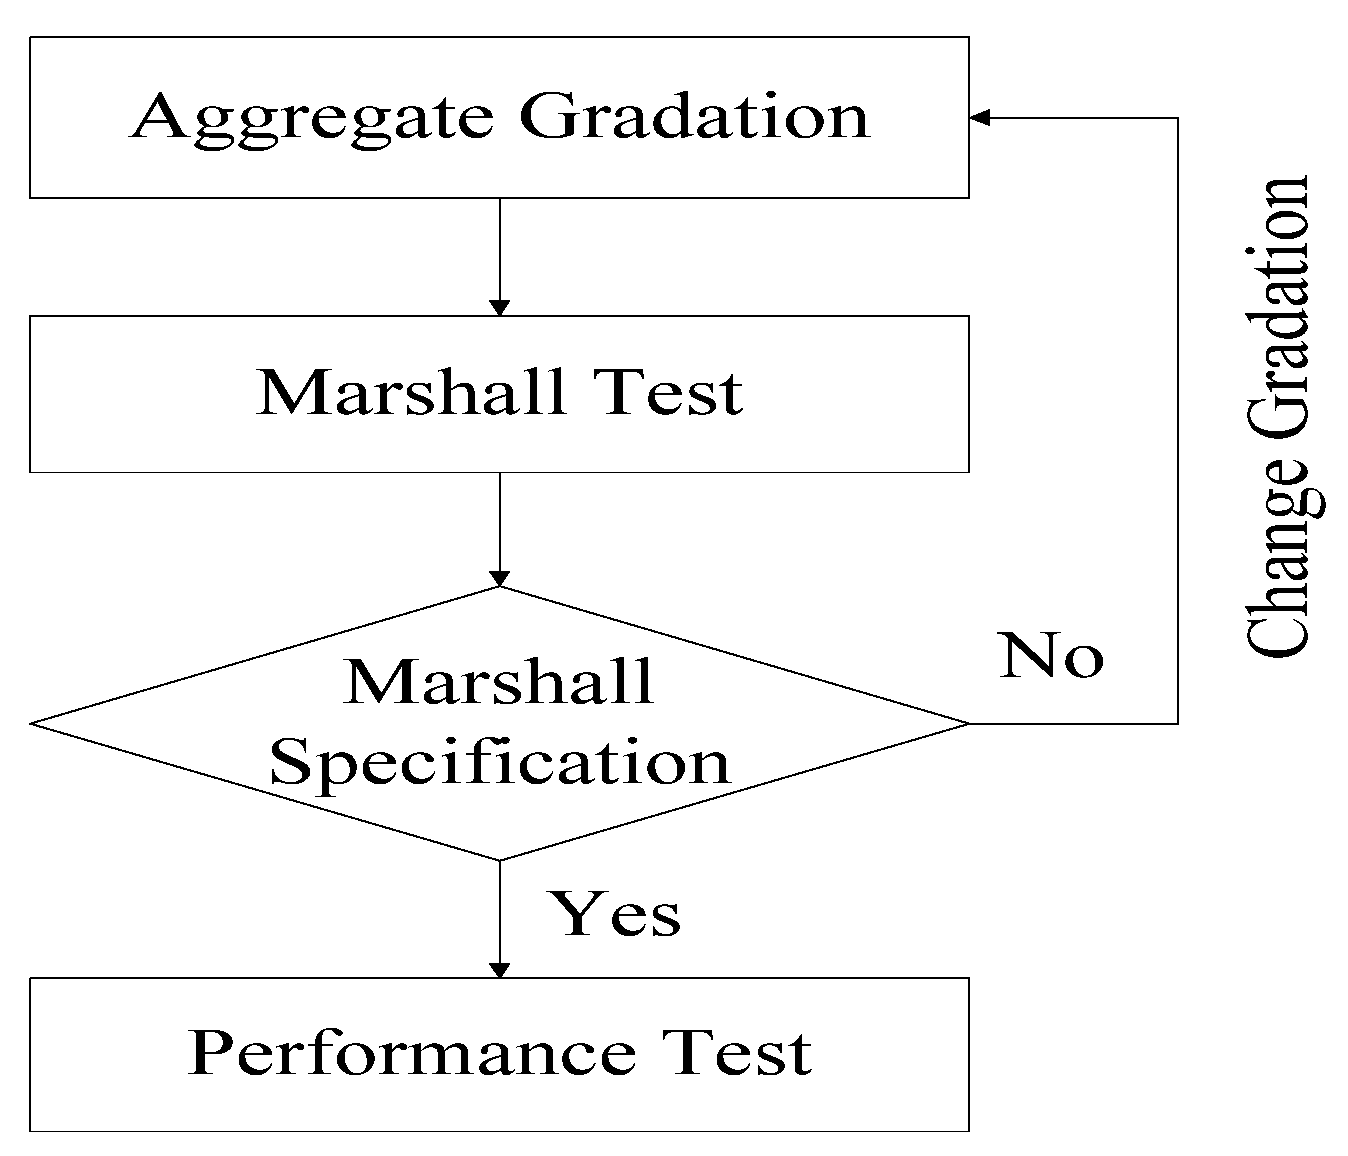
All the asphalt mixtures were designed with the standard Marshall method to determine the optimum asphalt content. The detailed design procedure can be seen in Figure 1. The Marshall Specimens of SMA5, SMA13 and SMA20 mixes were 63.5 mm high and 101.6 mm in diameter, and compacted using 75 blows on each side. The Marshall Specimens of SMA30 were 95.2 mm high and 152.4 mm in diameter, and compacted using 112 blows on each side.
The mix design results for four SMA mixtures are summarized in Table 6, in which optimum binder content, Air voids (AV), Voids in mineral aggregate (VMA), Voids filled with asphalt (VFA), Stability, flow value and retained stability are included.
Table 6 shows that air void decreased, and VMA and VFA increased with the decrease of NMAS in aggregate gradation, but the stability failed to present inerratic changing trends for SMA mixtures with different NMAS. The optimum asphalt contents shown in Table 7 varied from 4.5% to 6.4%. By comparison, SMA30 had the lowest optimum binder content among all the mixtures. For the retained stability, it increased marginally with decreased NMAS.

4. Analysis on Test Results

4.1. Wheel Tracking Test Results

The Wheel-tracking test based on JHS 230-1992 [14] was used to evaluate the rutting susceptibility of the SMA mixtures. An 0.7 MPa wheel load at 60 °C temperature under dry conditions was adopted. Specimens were 300 mm in width, 300 mm in length and 50 mm in height for SMA5, SMA13 and SMA20, and specimens were 300 mm in width, 300 mm in length and 100 mm in height for SMA30. The testing indictor of dynamic stability (DS) was expressed by Equation (1)
D S = 630 d 60 d 45
where, d60 is rut depth at 60 min, mm; d45 is rut depth at 45 min, mm; DS is the dynamic stability, cycles/mm.
The higher the DS of asphalt mixtures, the better resistance to permanent deformation at high temperature is.
Wheel tracking test results are presented in Table 7.
Table 7 shows that the DS of SMA mixtures were enhanced with the increase of NMAS. In other words, decrease of passing percent on 4.75 mm sieve was conducive to improvement of rutting resistance of SMA mixture.

4.2. Three-Point Bending Test Results

Three point bending tests based on JHR 3-7-5 [14] were performed to evaluate the mechanical properties of the asphalt concretes in terms of resistance to cracking. The specimens, which were 50 × 50 × 300 mm rectangular beams, were tested to determine the bending strength at −10 °C and 20 °C with a loading rate of 50 and 100 mm/min. The results of bending strength, strain and stiffness of asphalt mixtures are presented in Table 8.
It can be found in Table 8 that the stiffness decreased and strain increased with the reduction of NMAS for SMA mixtures. As for bending stress, it was proportional to the change of NMAS; especially for the results at 20 °C. Bending strain is a significant material property, which is often utilized as an indicator of ductility and cracking potential for the asphalt mixture. Asphalt mixtures with higher strain at failure are more resistant to cracking than those with lower values under similar loading and environmental conditions. The rank of bending strain for different SMA mixtures is as follows. It can be concluded that a decrease of NMAS helped to improve the cracking resistance of SMA mixtures.
SMA5 > SMA13 > SMA20 > SMA30

4.3. Permeability Test Results

Permeability test was conducted according to JIS A 1218-1990 [14]. The permeability device is presented in Figure 2, and the test condition is as follows.
Water pressure: 150 kpa, 24 h, and then 500 kpa, 24 h.
Temperature: 20 °C.
The permeability results of four different SMA mixtures are illustrated in Figure 3.
Figure 3 shows that the permeability of all mixtures decreased as NMAS decreased. In general, the permeability rate of mixes increases as the air voids content increase. At 2%–4% air voids, the permeability rate is approximately 107 cm/s. Westermanis break line criterion between high and low pavement permeability rate (104 cm/s) corresponds to an AV content of approximately 7% [15,16]. The permeability rate of larger NMAS mixture is higher than that of smaller NMAS mixture. Table 9 illustrates the relationship between AV, NMAS, break point sieve and permeability of the designed SMA mixtures. It was speculated that break point sieve and AV were more closely related to permeability of SMA mixtures than NMAS, which was consistent with the ideas of L. Allen Cooley [17].

4.4. Cantabro Test Results

Marshall specimens with 101.6 mm diameter and about 63.5 mm high for SMA5, SMA13 and SMA20, and 150 mm diameter and about 52 mm high for SMA30, were fabricated for Cantabro test according to JHS 231-1992 [14]. The specimens were put into a LOS ANGELS drum without any steel ball, and then given 300 rotations with a speed of 30–33 rpm at 20 °C. By comparing the mass of specimens before and after the rotation, the weight of loss was calculated. Cantabro loss is generally used as an important index of bonding property between asphalt and aggregate.
The Cantabro test results are presented in Figure 4, which illustrates a decrease of loss rate with the reduction of NMAS. Asphalt mixtures with smaller aggregate size displayed better raveling resistance than those with larger aggregate size. Therefore, SMA mixtures with smaller aggregate size can be designed to optimize the wear resistance of asphalt pavement.

5. Conclusions

Based upon the test results and analyses from this limited study, the following conclusions were drawn:
(1)
VMA and VFA of SMA mixtures increased with decrease of NMAS in aggregate gradation of SMA, and SMA30 had lower optimum binder content than the other SMA mixtures.
(2)
Increase of NMAS contributed to improving the rutting resistance of SMA mixtures.
(3)
Although a decrease of NMAS had some adverse impacts on the strength, it helped to enhance the cracking resistance of SMA mixtures at low and medium temperatures.
(4)
Permeability rate of SMA was primarily affected by the AV content and break point sieve, and was also sensitive to aggregate gradation to some extent. Reduced NMAS corresponded to a lower permeability rate for SMA mixtures.
(5)
SMA mixtures with smaller aggregate size displayed better raveling resistance than those with larger aggregate size.
(6)
Based on the performance test results in this paper for different SMA mixtures, SMA5 and SMA13 are suggested to be used as water-proof layer in bridge deck pavement. SMA20 and SMA30 are suggested to be used as binder course in asphalt pavement, which needs to possess superior rutting resistance at high temperature.

Acknowledgments

The author would like to thank National Institute for Land and Infrastructure Management in Japan supporting this research.

Author Contributions

Peiwen Hao conceived and designed the experiments; Hongying Liu and Peiwen Hao analyzed the data; Peiwen Hao contributed reagents/materials/analysis tools; Hongying Liu and Jinzhi Xu wrote the paper.

Conflicts of Interest

The authors declare no conflict of interest.

References

  1. Brown, E.R.; Haddock, J.E. Method to Ensure Stone on Stone Contact in Stone Matrix Asphalt Paving Mixture. In Transportation Research Record; National Research Council: Washington, DC, USA, 1997; Volume 1583, pp. 11–18. [Google Scholar]
  2. Walaa, S.M.; Stuart, K.D. Evaluation of Stone Matrix Asphalt versus Dense Graded Mixtures. In Transportation Research Record; National Research Council: Washington, DC, USA, 1994; Volume 1454, pp. 58–65. [Google Scholar]
  3. Sebaaly, P.E.; Ridolfi, D.; Gangavaram, R.S.; Epps, J.A. Selecting Most Desirable Hot Mix Asphalt Mixture. In Transportation Research Record; National Research Council: Washington, DC, USA, 1997; Volume 1590, pp. 99–107. [Google Scholar]
  4. Kevin, D.S.; Malmquist, P. Evaluation of Using Different Stabilizers in the U.S. Route 15 (Maryland) Stone Matrix Asphalt. In Transportation Research Record; National Research Council: Washington, DC, USA, 1994; Volume 1454, pp. 48–57. [Google Scholar]
  5. Graziani, A.; Ferrotti, G.; Pasquini, E.; Canestrari, F. An application to the european practice of the bailey method for hma aggregate grading design. Procedia Soc. Behav. Sci. 2012, 53, 990–999. [Google Scholar] [CrossRef]
  6. Pasetto, M.; Baldo, N. Influence of the aggregate skeleton design method on the permanent deformation resistance of stone mastic asphalt. Mater. Res. Innov. 2012, 18, S96–S101. [Google Scholar] [CrossRef]
  7. Vavrik, W.R.; Pine, W.J.; Carpenter, S.H. Aggregate Blending for Asphalt Mix Design: Bailey Method. In Transportation Research Record; National Research Council: Washington, DC, USA, 2002; Volume 1789, pp. 146–153. [Google Scholar]
  8. Kandhal, P.S.; Cooley, L.A. The Restricted Zone in the Superpave Aggregate Gradation Specification. In NCHRP Report 464, TRB; National Research Council: Washington, DC, USA, 2001. [Google Scholar]
  9. Ruth, B.E.; Roque, R.; Nukunya, B.; Davis, R.; Marasteanu, M.; Vavrik, W.; Fee, F.; Taylor, M.; Dukatz, E.; Li, X. Aggregate gradation characterization factors and their relationships to fracture energy and failure strain of asphalt mixtures. J. Assoc. Asph. Paving Technol. 2002, 71, 310–344. [Google Scholar]
  10. Praticò, F.G.; Vaiana, R.A. Study on the relationship between mean texture depth and mean profile depth of asphalt pavements. Constr. Build. Mater. 2015, 101, 72–79. [Google Scholar] [CrossRef]
  11. Praticò, F.G.; Vaiana, R.A. Study on volumetric versus surface properties of wearing courses. Constr. Build. Mater. 2013, 38, 766–775. [Google Scholar] [CrossRef]
  12. Woodward, D.; Millar, P.; Lantieri, C.; Sangiorgi, C.; Vignali, V. The wear of stone mastic asphalt due to slow speed high stress simulated laboratory trafficking. Constr. Build. Mater. 2016, 110, 270–277. [Google Scholar] [CrossRef]
  13. Service Center of Port Engineering. Specification for Civilian Airport Construction Works; Tokoyo Aviation Bureau: Tokoyo, Japan, 2007. (In Japanese)
  14. Japan Road Association. Manual for Test Method of Pavement; MARUZEN Publishing Co. Ltd: Tokoyo, Japan, 1996. (In Japanese) [Google Scholar]
  15. Praticò, F.G.; Vaiana, R.; Giunta, M. Pavement sustainability: Permeable wearing courses by recycling porous european mixes. J. Archit. Eng. 2013, 19, 186–192. [Google Scholar] [CrossRef]
  16. Kunnawee, K.; Benson, C.H.; Behis, H.U. Hydraulic Conductivity (Permeability) of Laboratory-Compacted Asphalt Mixtures. In Transportation Research Record; National Research Council: Washington, DC, USA, 1981; Volume 1767, pp. 25–32. [Google Scholar]
  17. Cooley, L.A., Jr.; Brown, E.R. Potential of Using Stone Matrix Asphalt (SMA) for Thin Overlays; NCAT Report 03-01; National Center for Asphalt Technology, Auburn University: Auburn, AL, USA, 2003. [Google Scholar]
Figure 1. Flow chart of stone matrix asphalt (SMA) mixture design.
Applsci 07 00126 g001
Figure 2. Schematic of the permeability test device.
Applsci 07 00126 g002
Figure 3. Mixture types and permeability coefficients.
Applsci 07 00126 g003
Figure 4. Mixture type and loss of rate.
Applsci 07 00126 g004
Table 1. Properties of coarse and fine aggregate.
PropertiesCoarse AggregateFine Aggregate
20–30 mm10–20 mm5–13 mm3–5 mmScreenings StoneSand
Apparent specific gravity, g/cm32.7262.7822.7402.7562.7292.656
Surface dry specific gravity, g/cm32.7032.7462.7002.7172.6462.588
Bulk specific gravity, g/cm32.6902.7262.6762.6812.5982.547
Water Absorption, %0.490.740.881.021.841.61
Table 2. Properties of limestone mineral filler.
Sieve Size, mmPercent Passing, %
0.6100
0.3100
0.1591.3
0.07580.5
Apparent specific gravity, g/cm32.710
Table 3. Properties of cellulose fiber.
PropertiesValue
Maximum fiber length, mm5
Average fiber length, mm1
Average fiber diameter, mm0.045
Specific gravity, g/cm31.48
Table 4. Properties of asphalt.
PropertiesValueSpecification [12]
Penetration, 25 °C, 1/10 mm7060–80
Softening point, °C46.544–52
Ductility, 15 °C, cm140+>100
Solubility, %99.9>99
Thin film oven (163 °C, 5 h)Loss, %−0.04<0.6
Penetration ratio, %62.9>55
Density, g/cm31.028>1
Table 5. Aggregate gradations of SMA mixtures (percent passing, %).
Sieve Size, mmSMA5SMA13SMA20SMA30
Test ResultSpecification [13]Test ResultSpecification [13]Test ResultSpecification [13]Test Result
37.5------100
31.5------94.1
26.5----10010077.2
19--10010098.195–10054.7
13.210010096.295–10082.675–9050.3
4.7592.090–10043.730–5042.825–4540.8
2.3642.335–5034.620–3534.520–3534.3
0.626.4-22.6-22.6-22.0
0.317.515–2516.113–2016.115–2016.1
0.1511.0-11.0-11.0-11.0
0.0758.38–138.38–138.38–138.3
Table 6. Results of SMA mixture design.
PropertiesSMA5SMA13SMA20SMA30
Specimen Dimensions63.5 mm High and 101.6 mm Diameter63.5 mm High and 101.6 mm Diameter63.5 mm High and 101.6 mm Diameter95.2 mm High and 152.4 mm Diameter
Blow cycles on each side757575112
Asphalt content, %6.45.45.14.5
Air Void, %2.82.43.23.7
VMA, %17.715.215.314.3
Stability, kN10.729.649.9218.81
Flow value, 1/10 mm37393757
VFA, %84.284.279.174.1
Retained stability, %81.679.677.781.2
Table 7. Results of wheel tracking test.
Mixture TypeAverage Dynamic Stability, Cycle/mmCoefficient of Variation, %
SMA560513.7
SMA1387812.5
SAM2094117.9
SMA30103319.2
Table 8. Results of three-point bending test.
Test ConditionPropertiesSMA5SMA13SMA20SMA30
−10 °C50 mm/minBending Stress, MPaAverage8.810.911.310.4
CV, %10.29.0711.512.3
Strain,Average8.3 × 10−37.7 × 10−37.4 × 10−37.1 × 10⁻³
CV, %15.617.816.719.2
Stiffness, MPaAverage1060.21415.61527.01464.8
CV, %14.316.718.220.1
100 mm/minBending Stress, MPaAverage9.09.89.99.8
CV, %12.414.110.411.1
Strain,Average4.8 × 10−34.0 × 10−33.6 × 10−33.0 × 10⁻³
CV, %15.318.613.119.5
Stiffness, MPaAverage1875245027503266.7
CV, %17.113.118.917.5
20 °C50 mm/minBending Stress, MPaAverage2.52.93.83.8
CV, %8.910.312.211.9
Strain,Average3.0 × 10−22.4 × 10−22.2 × 10−22.0 × 10⁻²
CV, %12.610.417.918.1
Stiffness, MPaAverage83.3120.8172.7190
CV, %9.511.216.314.5
100/mm/minBending Stress, MPaAverage3.94.14.85
CV, %10.413.912.49.7
StrainAverage2.4 × 10−22.0 × 10−21.3 × 10−21.2 × 10⁻²
CV, %10.29.613.817.3
Stiffness, MPaAverage162.5205369.2416.7
CV, %8.611.116.213.5
Table 9. Pearson correlation check of SMA mixes.
Correlation Coefficients
ItemPermeability Coefficients, cm/sAir Void, %Nominal Maximum Aggregate Sieve Size Passing, %Break Point Sieve,%
Permeability coefficients, cm/sPearson correlation10.245−0.071−0.350
number4444

