Review

Line-Scan Hyperspectral Imaging Techniques for Food Safety and Quality Applications

1
USDA/ARS Environmental Microbial and Food Safety Laboratory, Beltsville Agricultural Research Center, 10300 Baltimore Ave., Beltsville, MD 20705, USA
2
USDA/ARS Food Quality Laboratory, Beltsville Agricultural Research Center, 10300 Baltimore Ave., Beltsville, MD 20705, USA
3
Department of Biosystems Machinery Engineering, College of Agricultural and Life Science, Chungnam National University, 99 Daehak-ro, Yuseoung-gu, Daejeon 305-764, Korea
*
Author to whom correspondence should be addressed.
Appl. Sci. 2017, 7(2), 125; https://doi.org/10.3390/app7020125
Submission received: 14 December 2016 / Revised: 12 January 2017 / Accepted: 18 January 2017 / Published: 26 January 2017
(This article belongs to the Special Issue Applications of Hyperspectral Imaging for Food and Agriculture)

Abstract

:
Hyperspectral imaging technologies in the food and agricultural area have been evolving rapidly over the past 15 years owing to tremendous interest from both academic and industrial fields. Line-scan hyperspectral imaging is a major method that has been intensively researched and developed using different physical principles (e.g., reflectance, transmittance, fluorescence, Raman, and spatially resolved spectroscopy) and wavelength regions (e.g., visible (VIS), near infrared (NIR), and short-wavelength infrared (SWIR)). Line-scan hyperspectral imaging systems are mainly developed and used for surface inspection of food and agricultural products using area or line light sources. Some of these systems can also be configured to conduct spatially resolved spectroscopy measurements for internal or subsurface food inspection using point light sources. This paper reviews line-scan hyperspectral imaging techniques, with introduction, demonstration, and summarization of existing and emerging techniques for food and agricultural applications. The main topics include related spectroscopy techniques, line-scan measurement methods, hardware components and systems, system calibration methods, and spectral and image analysis techniques. Applications in food safety and quality are also presented to reveal current practices and future trends of line-scan hyperspectral imaging techniques.

1. Introduction

Hyperspectral imaging technique is capable of acquiring both spatial and spectral information from a target by combining traditional imaging and spectroscopy methods, making it a powerful tool for many food and agricultural applications. Hyperspectral images are three-dimensional (3-D) in nature, with two spatial dimensions and one spectral dimension. The 3-D hyperspectral image data can be collected by three major image acquisition methods: point-scan, line-scan, and area-scan methods [1]. Since food commodities usually move along processing and production lines, the line-scan hyperspectral acquisition method naturally fits to inspect the individual moving food items. The hyperspectral imaging concept was brought to the food and agricultural field by scientists of the U.S. Department of Agriculture (USDA) in the late 1990s [2]. The practical implementation of line-scan hyperspectral imaging (particularly for reflectance and fluorescence techniques) for inspecting food and agricultural products was fulfilled in the early 2000s [3]. Since then, line-scan hyperspectral imaging techniques have drawn tremendous interest from both academic and industrial areas, and have been intensively researched and developed for food and agricultural applications during the past 15 years [1,4]. With the introduction of new measurement concepts and instruments, line-scan hyperspectral techniques are continuously evolving to expand the scope of their applications. For example, by using a newly available high-power narrow-linewidth line laser and dispersive Raman imaging spectrograph, macro-scale line-scan hyperspectral Raman imaging was recently realized [5], which opens a new avenue for rapid and high-throughput evaluation of food safety and quality.
This paper reviews line-scan hyperspectral imaging techniques in the food and agricultural area, with an emphasis on food safety and quality applications under indoor controlled lighting conditions. There is an introduction for the spectroscopy techniques (i.e., reflectance, transmittance, fluorescence, and Raman) and line-scan hyperspectral measurement methods (i.e., imaging and spatially resolved spectroscopy) in Section 2, giving basic concepts and ground rules for the rest of the paper. The focus of the paper is put on the introduction, demonstration, and summarization of existing and emerging line-scan hyperspectral imaging techniques for practical food and agricultural applications, including major hardware components (i.e., light sources, imaging spectrographs, and image sensors) working in different wavelength ranges (e.g., visible (VIS), near infrared (NIR), and short-wavelength infrared (SWIR)) in Section 3.1, representative imaging systems and spectral and spatial calibrations in Section 3.2, and techniques for analyzing hyperspectral images (i.e., typical hyperspectral image data, image preprocessing, band selection, and target identification) in Section 4. Applications for food and agricultural products are reviewed in Section 5 to reflect current practices and future trends. Conclusions in Section 6 present a summary and address future development of line-scan hyperspectral imaging techniques for food and agriculture.

2. Line-Scan Hyperspectral Measurement Techniques

2.1. Spectroscopy Techniques

Based on the nature of the interaction between the light energy and the sample, there are three major types of spectroscopy techniques for which line-scan hyperspectral imaging methods are currently in use for food and agricultural applications: reflectance and transmittance spectroscopy, fluorescence spectroscopy, and Raman spectroscopy. These spectroscopy techniques are presented in the following sections.

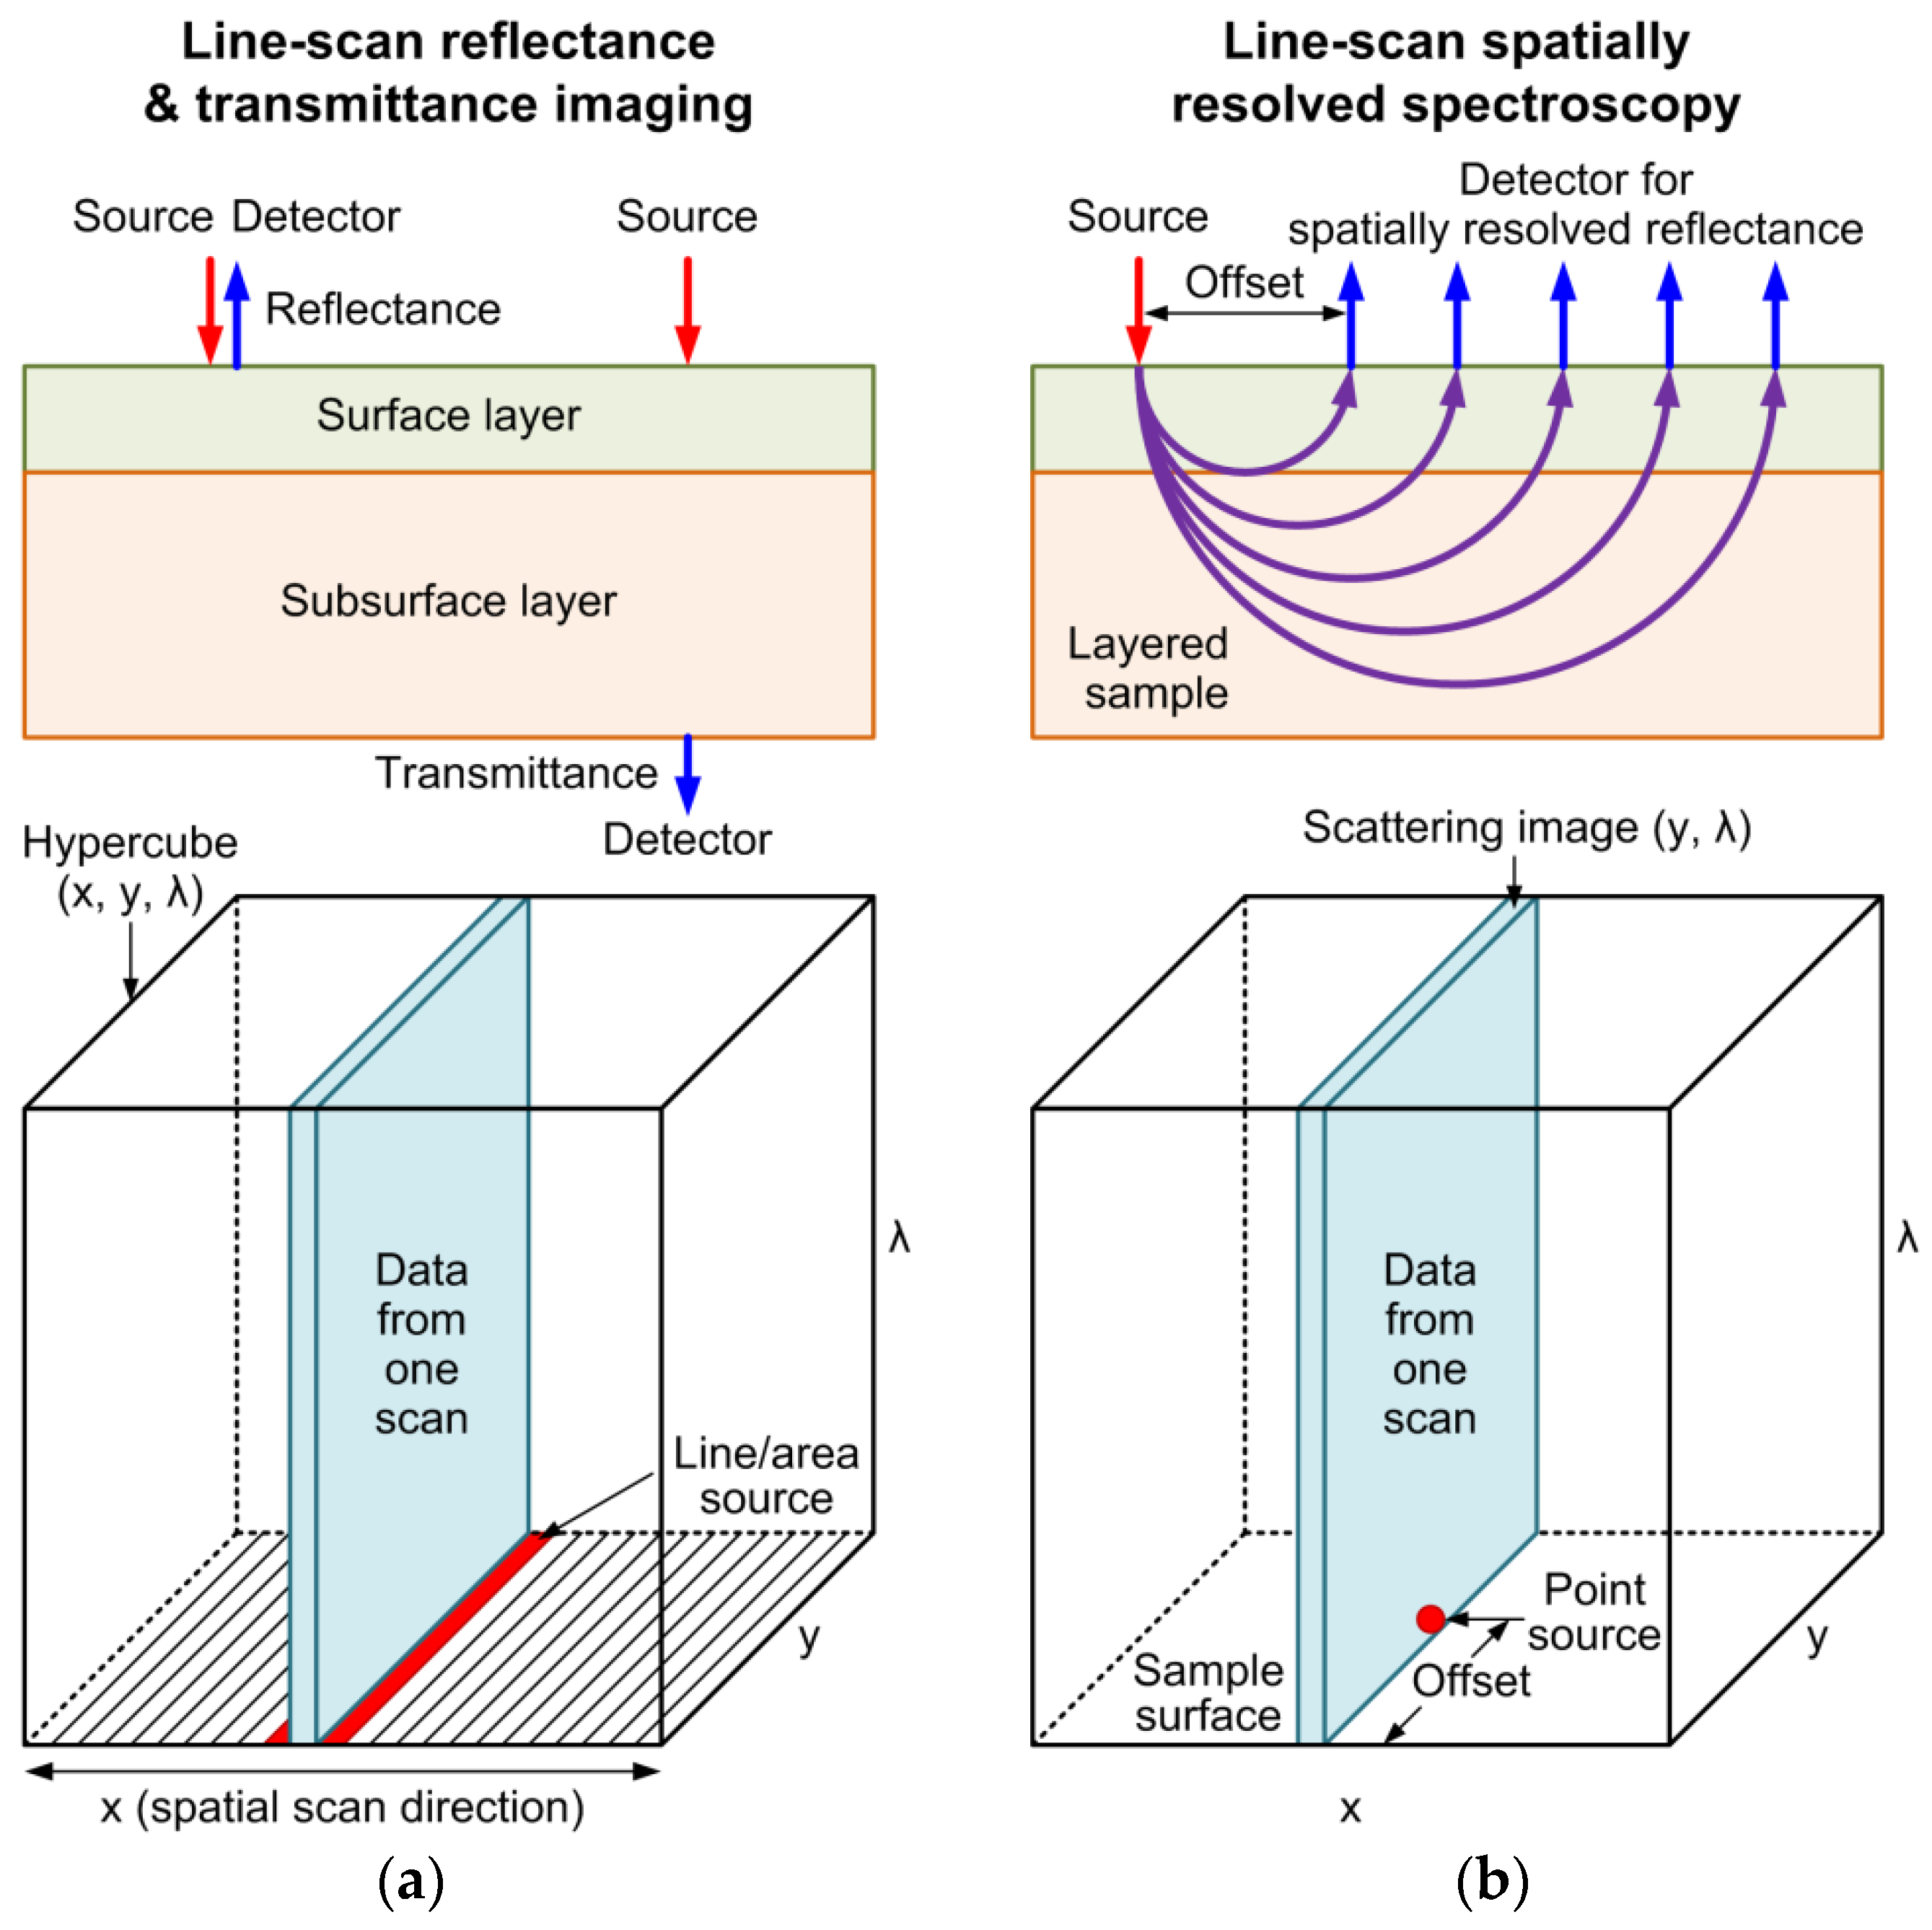
2.1.1. Reflectance and Transmittance Spectroscopy

Light interaction with biological materials, such as food and agricultural products, is a complicated phenomenon. When a biological sample is exposed to an illumination source (e.g., halogen light), a small amount of the incident light is reflected at the outer surface, causing specular reflectance. The remaining incident energy goes into the sample, and the photons undergo multiple scattering actions before they are absorbed or reflected back to reemerge from the sample surface, generating diffuse reflectance. Hence the reflectance measurement generally involves both specular and diffuse reflectance signals. When the sample is small and the illumination light is strong enough, the incident light can also result in diffuse transmittance through the sample. Reflectance and transmittance signals are normally acquired as a function of wavelength and presented in the form of spectra. Reflectance and transmittance spectroscopy techniques can work in a broad wavelength range from ultraviolet to infrared. The spectral constitution of the illumination light is not altered during light-sample interactions. Sample information can be obtained based on the intensity changes due to light reflection, absorption, and scattering at different wavelengths. Reflectance spectroscopy is usually used for sample surface inspection, while transmittance spectroscopy is useful for evaluating internal attributes of the sample.

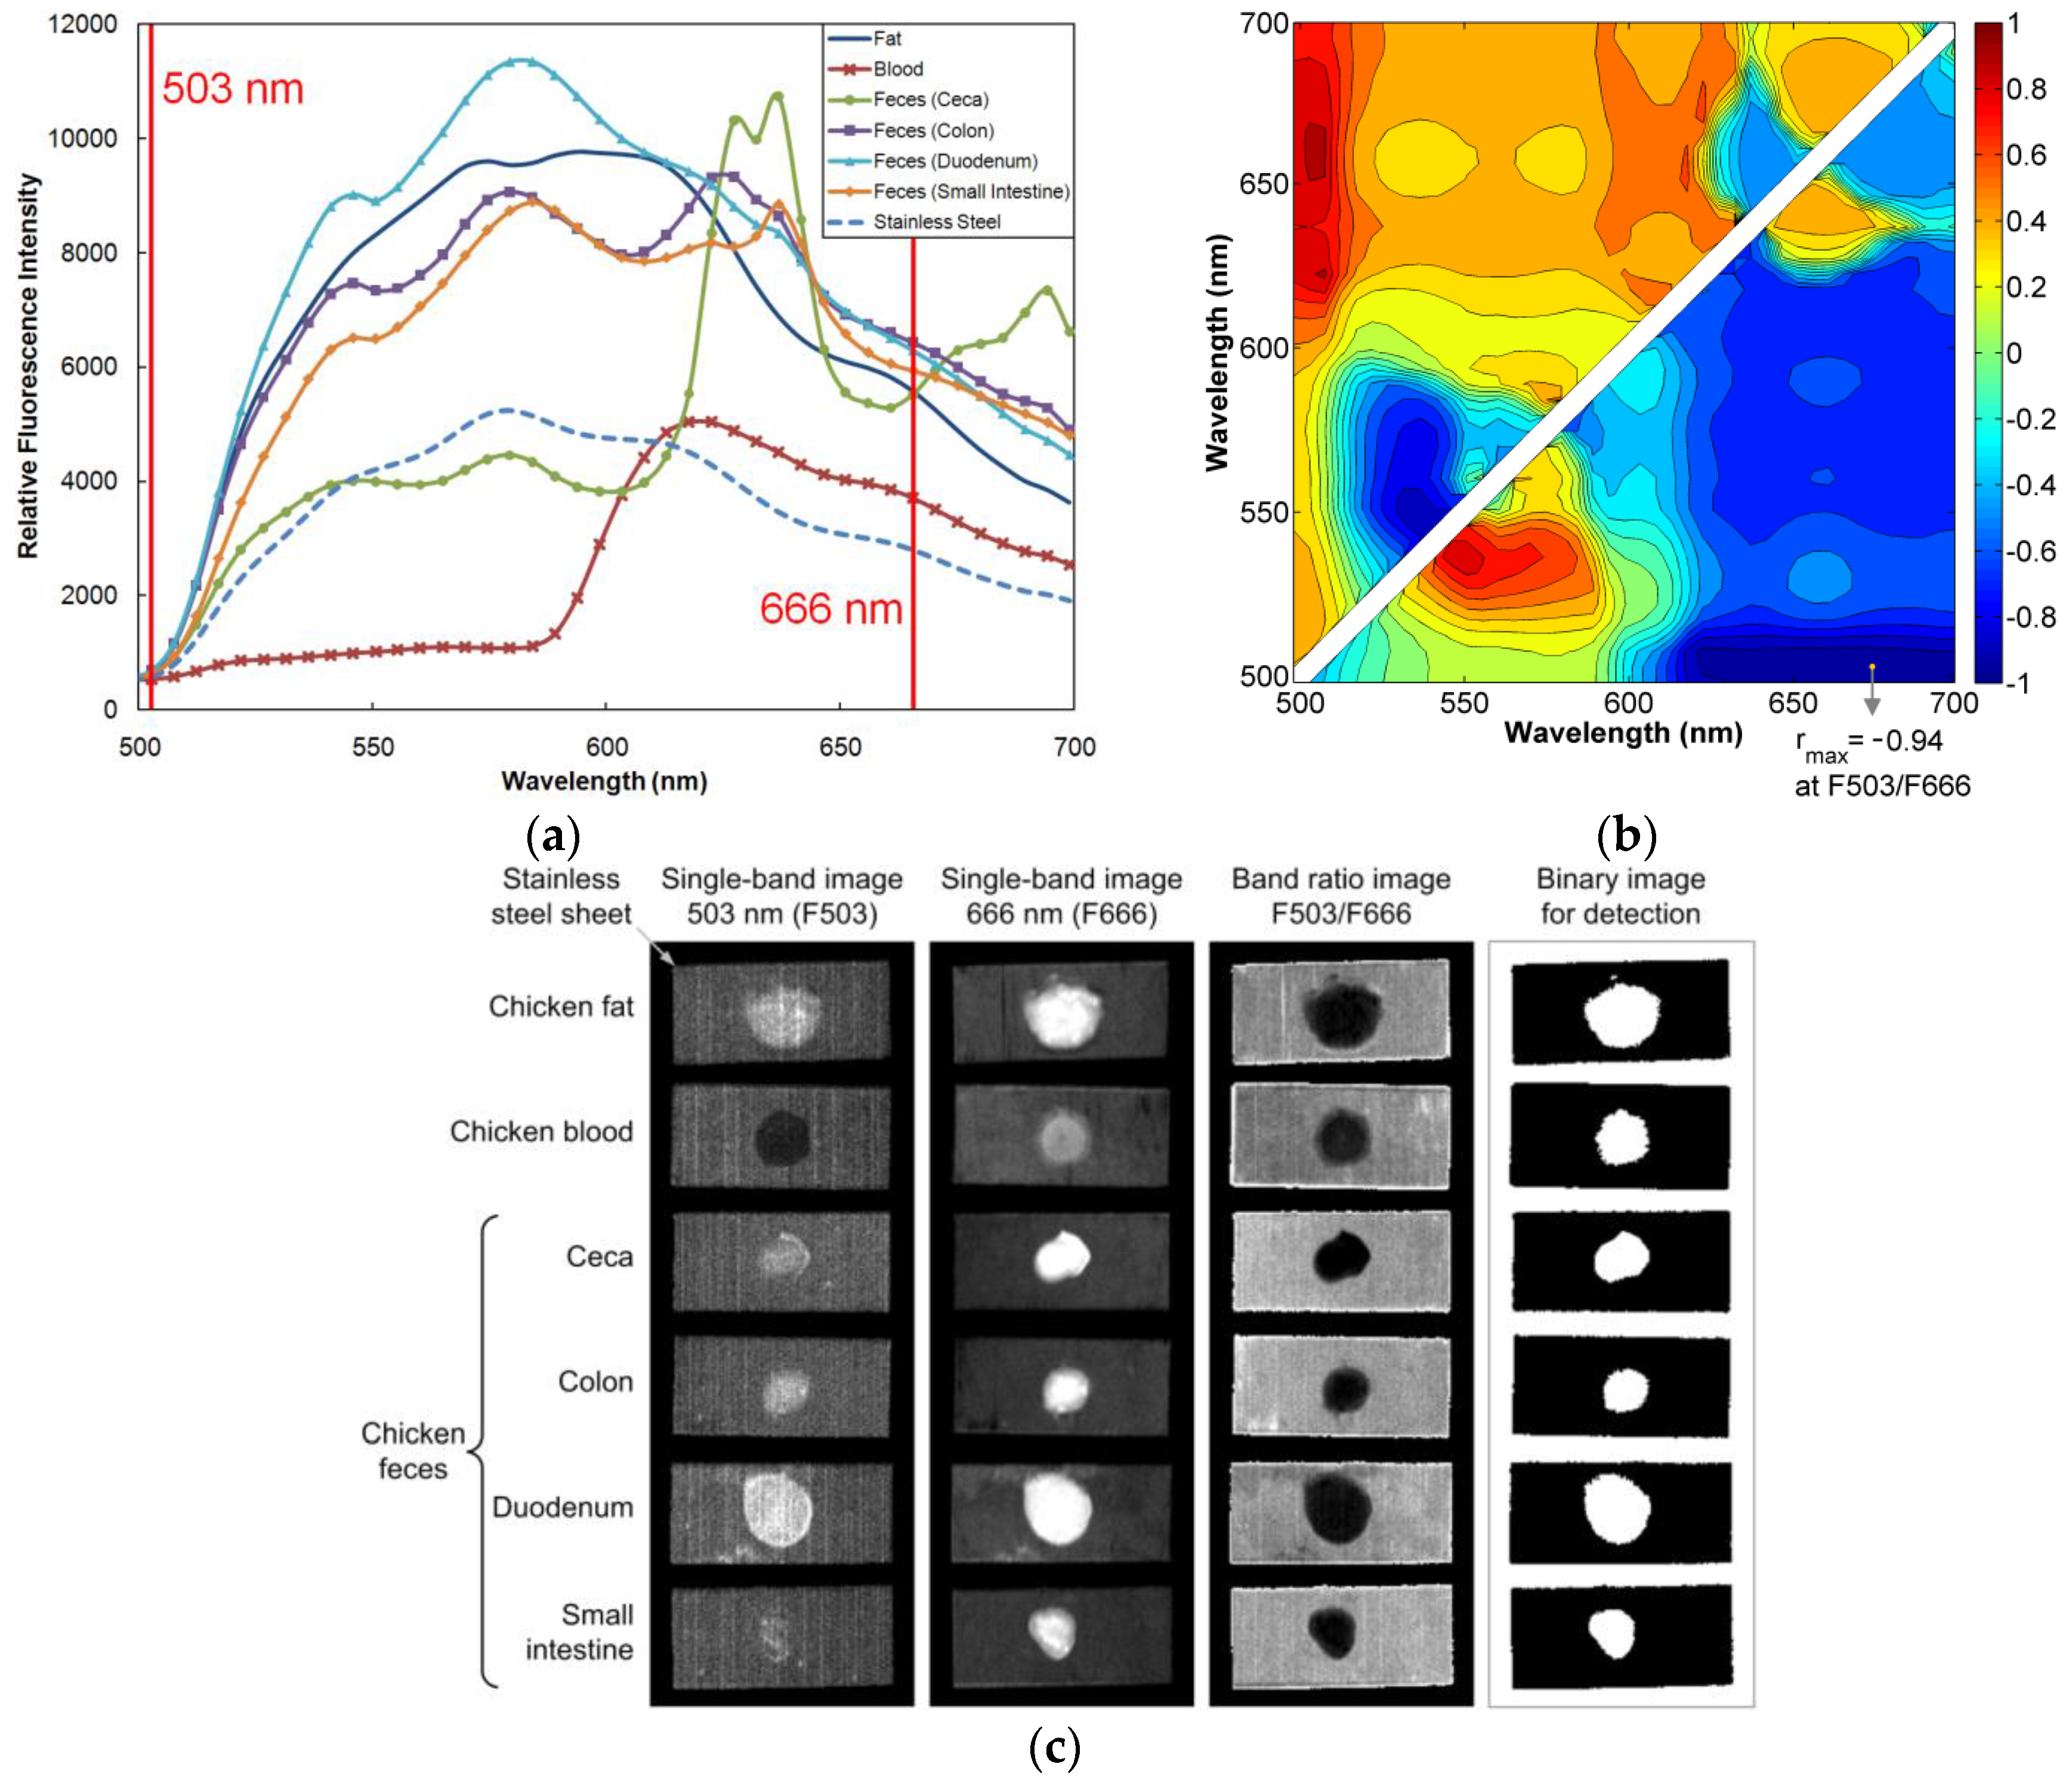
2.1.2. Fluorescence Spectroscopy

Fluorescence is the emission of light from a compound when a sample is excited by absorbing radiation energy. In general, the excitation wavelength is fixed, and high-intensity narrowband light (e.g., ultraviolet (UV) radiation) is usually used as a fluorescence excitation source. The emitted light, which normally has lower energy than the absorbed light, is often observed in a broad spectral range towards longer wavelengths, and it carries the composition information of the sample. The fluorescence signals are typically presented as an emission spectrum, which is a plot of the fluorescence intensity versus wavelength. The fluorescence intensity is generally proportional to the concentration of the fluorophore in the sample. When excited by the UV radiation, many plant and animal tissues (e.g., fat, leaves, and fruits) emit fluorescence emissions in the visible spectral region. The fluorescence emission maxima from biological materials typically appear in the blue, green, red, and far-red regions of the spectrum [6], and can be used to analyze the sample compositions. Fluorescence spectroscopy is considered to be a sensitive optical detection technique since it can measure subtle changes of biological samples.

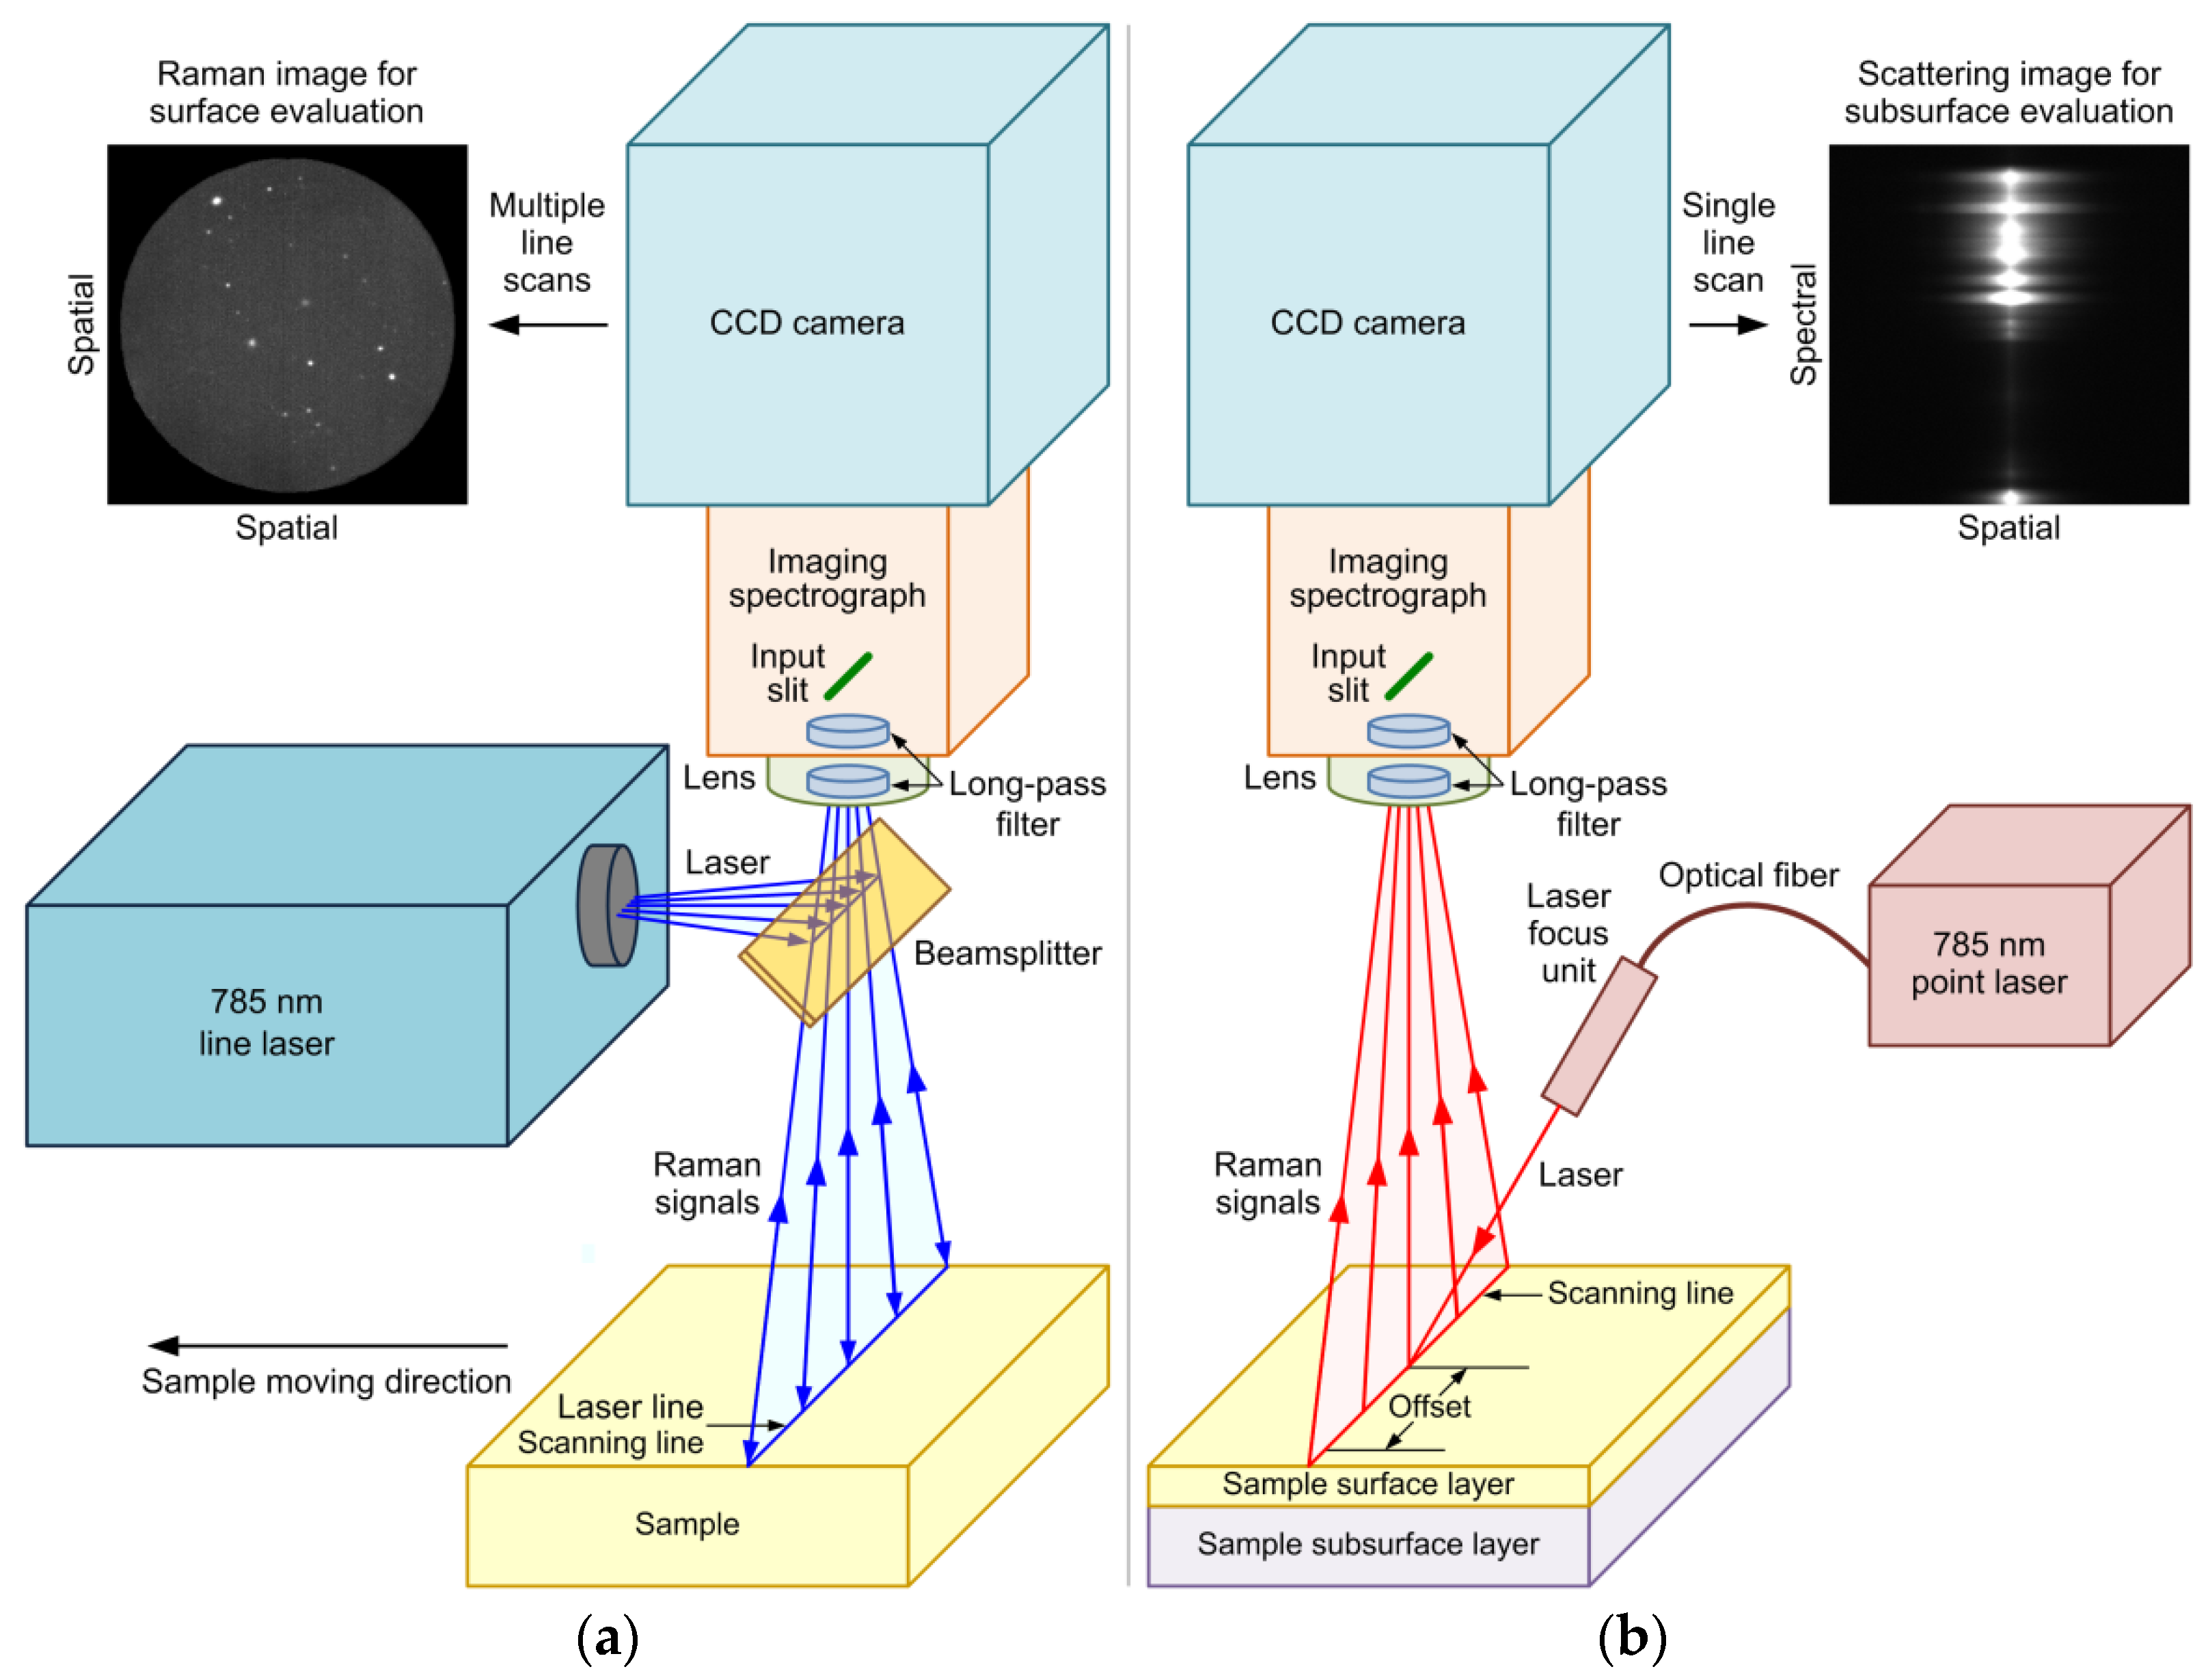
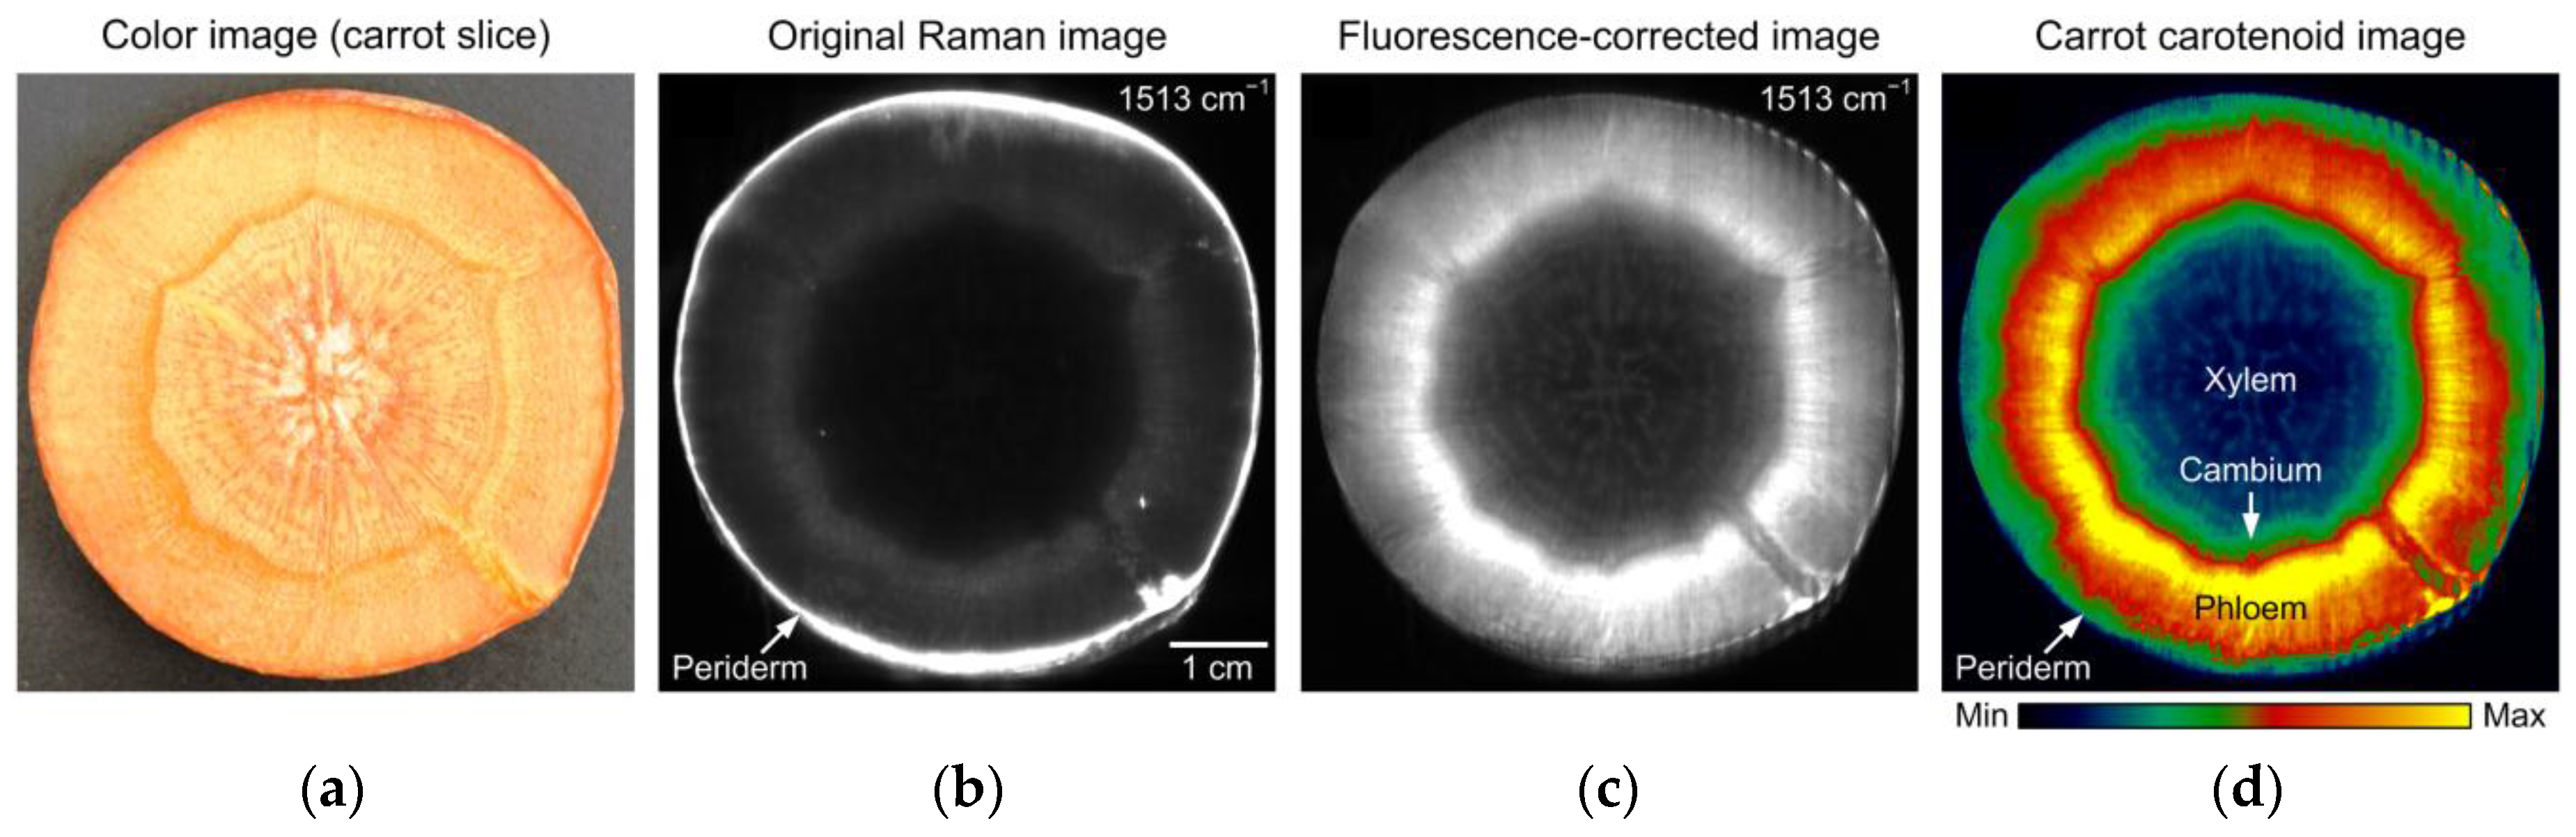
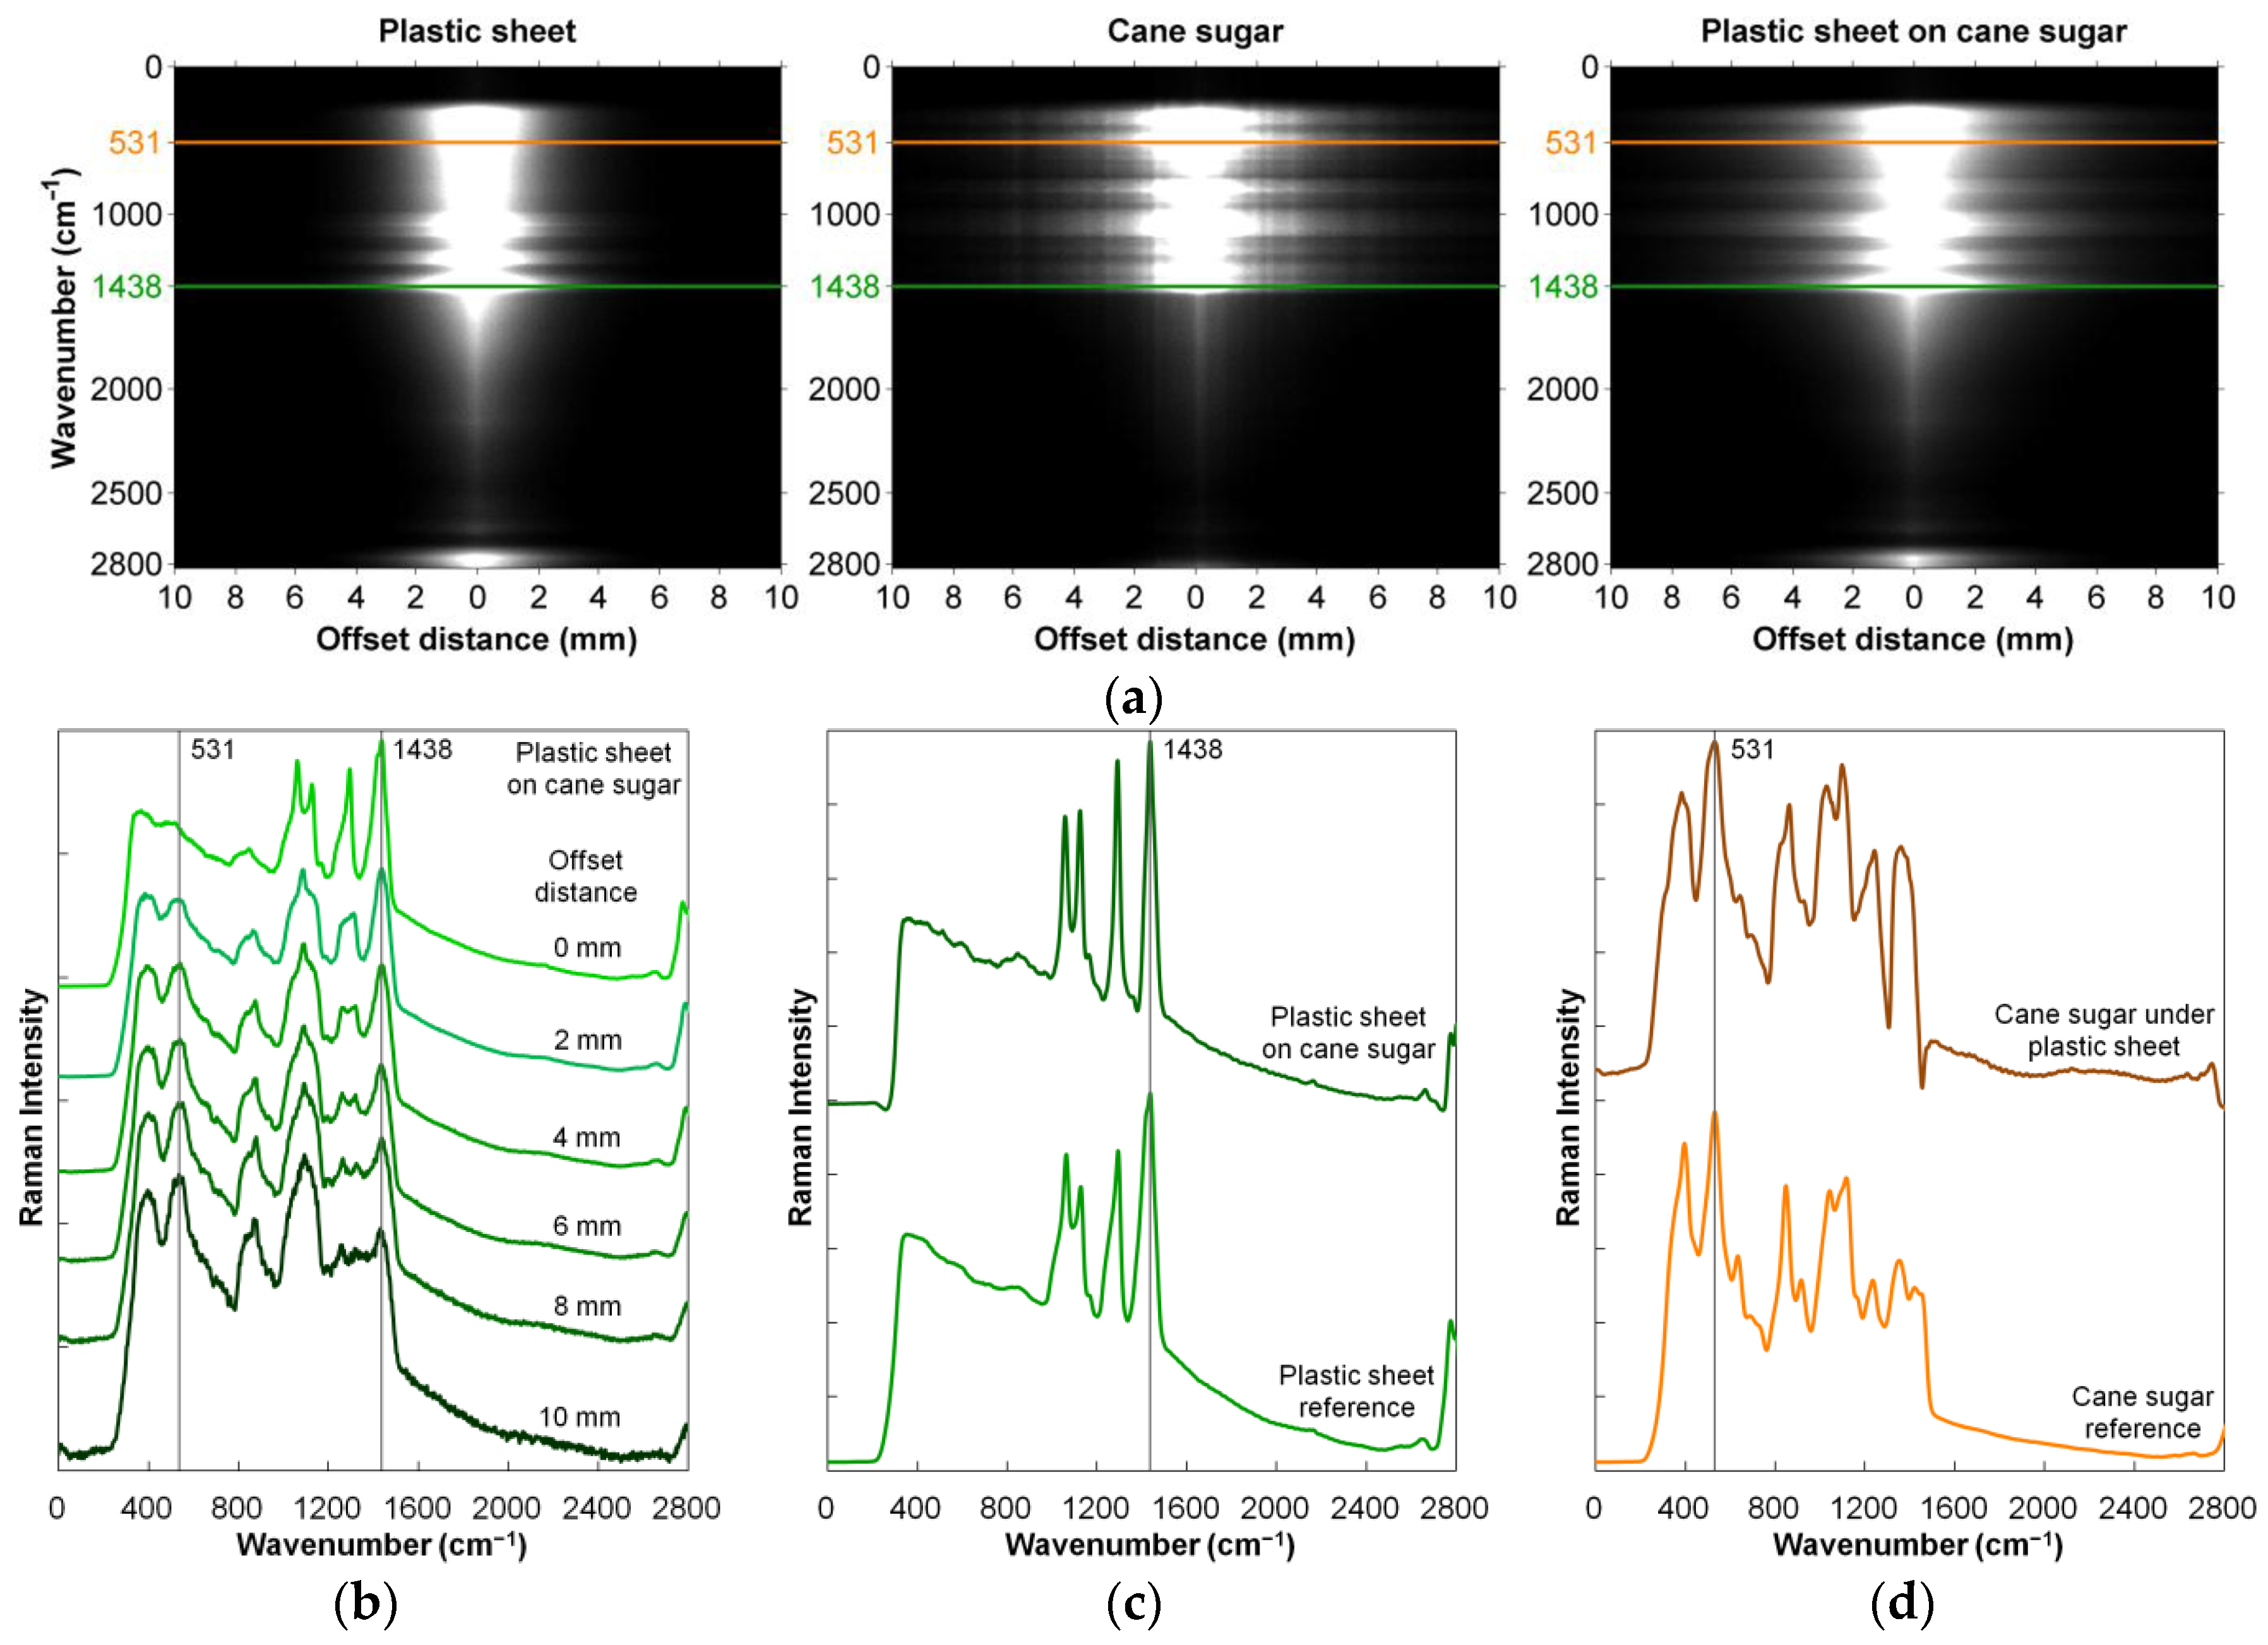
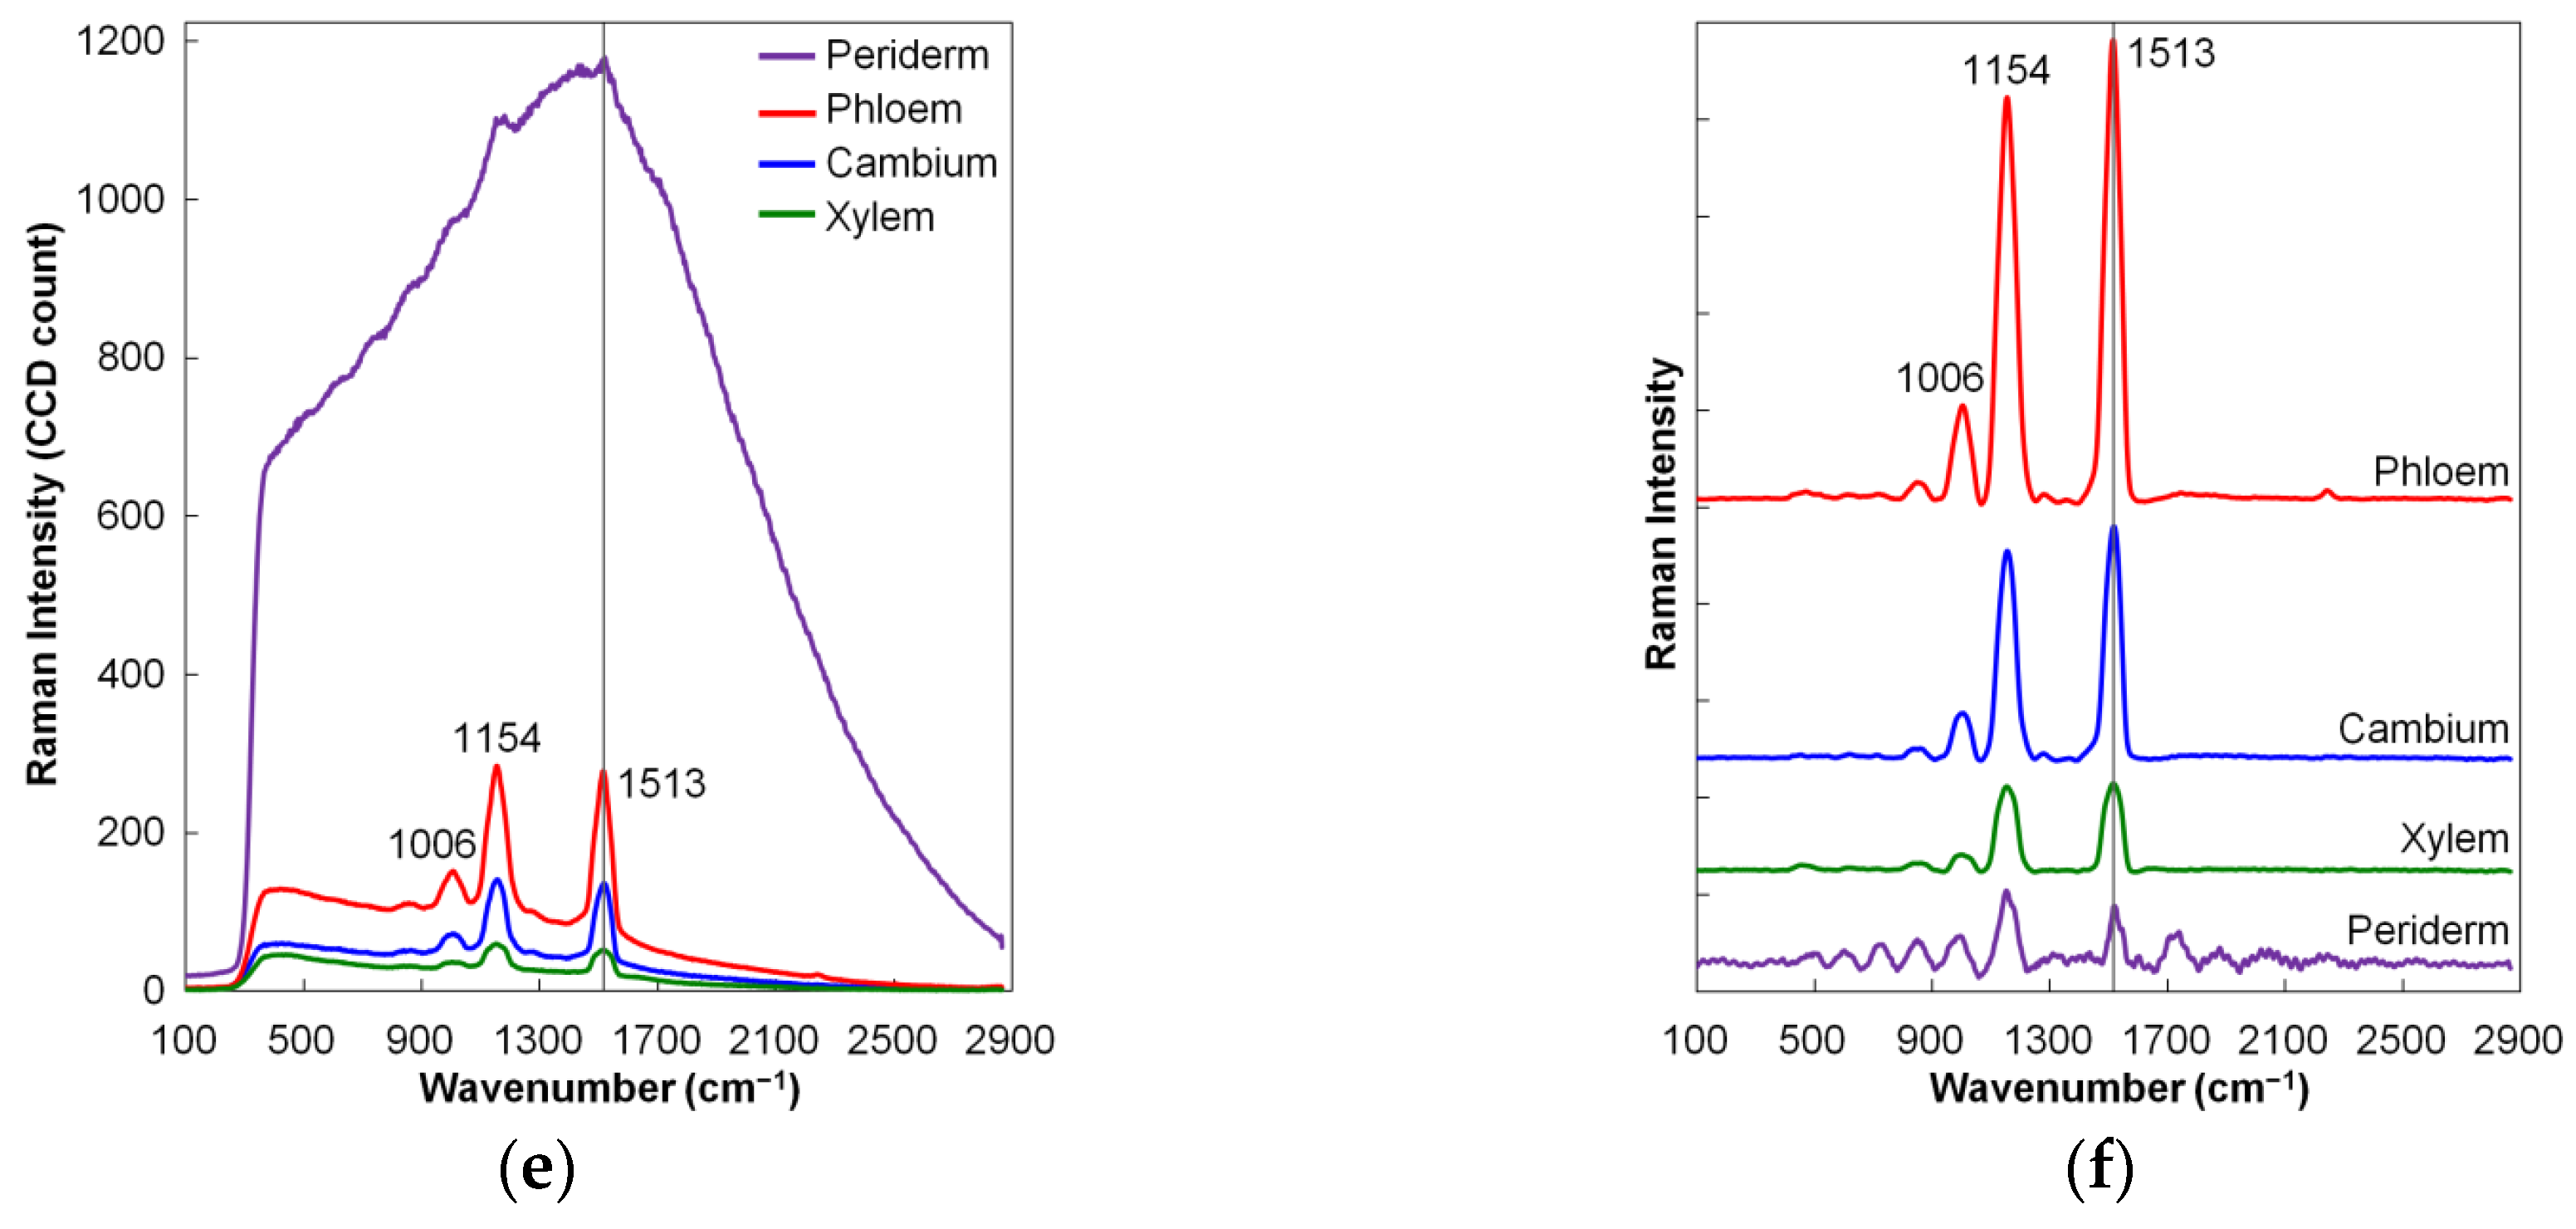
2.1.3. Raman Spectroscopy

High-energy monochromatic light (e.g., a laser) will be absorbed, reflected, and scattered when its photons interact with molecules of a sample. The scattered light consists of both elastic and inelastic scattering. The vast majority of scattering is elastically scattered light (Rayleigh scattering), which has the same frequency as the incident radiation. A very small portion of the photons will lose energy to the sample molecules when exciting them from the ground state to the excited state (Stokes scattering) or gain energy in the opposite process (anti-Stokes scattering). The Stokes and the anti-Stokes scattering are collectively called Raman scattering [7]. Typical Raman measurements only acquire the longer-wavelength Stokes scattering signals owing to the much higher intensity of Stokes scattering compared to that of anti-Stokes scattering. Since the probability of a Raman photon appearing is on the order of one out of 106–108 scattered photons, the Raman scattering intensity is very weak, and it is proportional to the laser intensity and the reciprocal of the fourth power of the excitation wavelength [7]. A typical Raman spectrum features a series of narrow and sharp peaks. The Raman peak positions are correlated to particular molecular vibrations at different frequencies, and they can be used to determine the sample compositions. The intensity of the Raman peak is linearly proportional to the concentration of the molecule, which can be used for quantitative analysis of the analyte.

2.2. Line-Scan Measurement Methods

Line-scan hyperspectral imaging can be arranged in different configurations to satisfy different detection requirements. Reflection and transmission measurements (Figure 1a) are two basic modes used in line-scan hyperspectral imaging techniques. In a reflection mode, a source and a detector are placed on the same side of the sample. The detector collects signals reflected from the sample, such as specular and diffuse reflectance, fluorescence, and backscattering Raman, which are commonly used for sample surface inspection. In a transmission mode, a source and a detector are arranged on opposite sides of the sample. The detector acquires transmittance signals passing through the sample, which can be used to assess bulk composition of the sample, especially for small individual items with an internal condition of weak absorption. For either reflection or transmission configurations, the line-scan hyperspectral imaging method (i.e., the pushbroom method) simultaneously acquires a slit of spatial information as well as full spectral information for each spatial point in the linear field of view (FOV) illuminated or excited by line or area light sources. A special 2-D image (y, λ), with one spatial dimension (y) and one spectral dimension (λ), is collected from each scan (Figure 1a). A complete hypercube (x, y, λ) is built line by line as the scan is conducted along the direction of motion (x) to cover the whole surface of the sample.
Hyperspectral transmittance imaging is able to obtain overall internal sample information. However, it generally cannot differentiate the information from individual sample layers due to lack of variations for the transmittance signals. Spatially resolved spectroscopy is a technique that can obtain subsurface information from a layered sample. The basic principle is to separate a point light source and a detector to allow light to travel through a deeper area of the sample (Figure 1b). Spatially resolved spectra are collected from a series of surface positions laterally offset from the point source, allowing compositions of the individual layers to be evaluated. The concept has been adopted for different spectroscopy techniques, such as spatially resolved diffuse reflectance [8], spatially resolved fluorescence spectroscopy [9], and spatially offset Raman spectroscopy [10]. Measurement methods using optical fiber probes are either slow (single fiber probe with mechanical movement) or restricted in offset range and interval selection (fiber probe array) for acquiring the spatially resolved spectra. Line-scan hyperspectral imaging techniques provide a flexible and efficient method for spatially resolved spectroscopy measurement [11,12]. The method collects a series of spectra all together in a broad offset range with a narrow spatial interval using one CCD exposure (Figure 1b). The scattering image (y, λ) acquired from a single scan is a complete set of the spatially resolved spectra with sufficient spatial and spectral information for subsurface evaluation of heterogeneous or layered food samples.

3. Line-Scan Hyperspectral Imaging Instruments

3.1. Major System Components

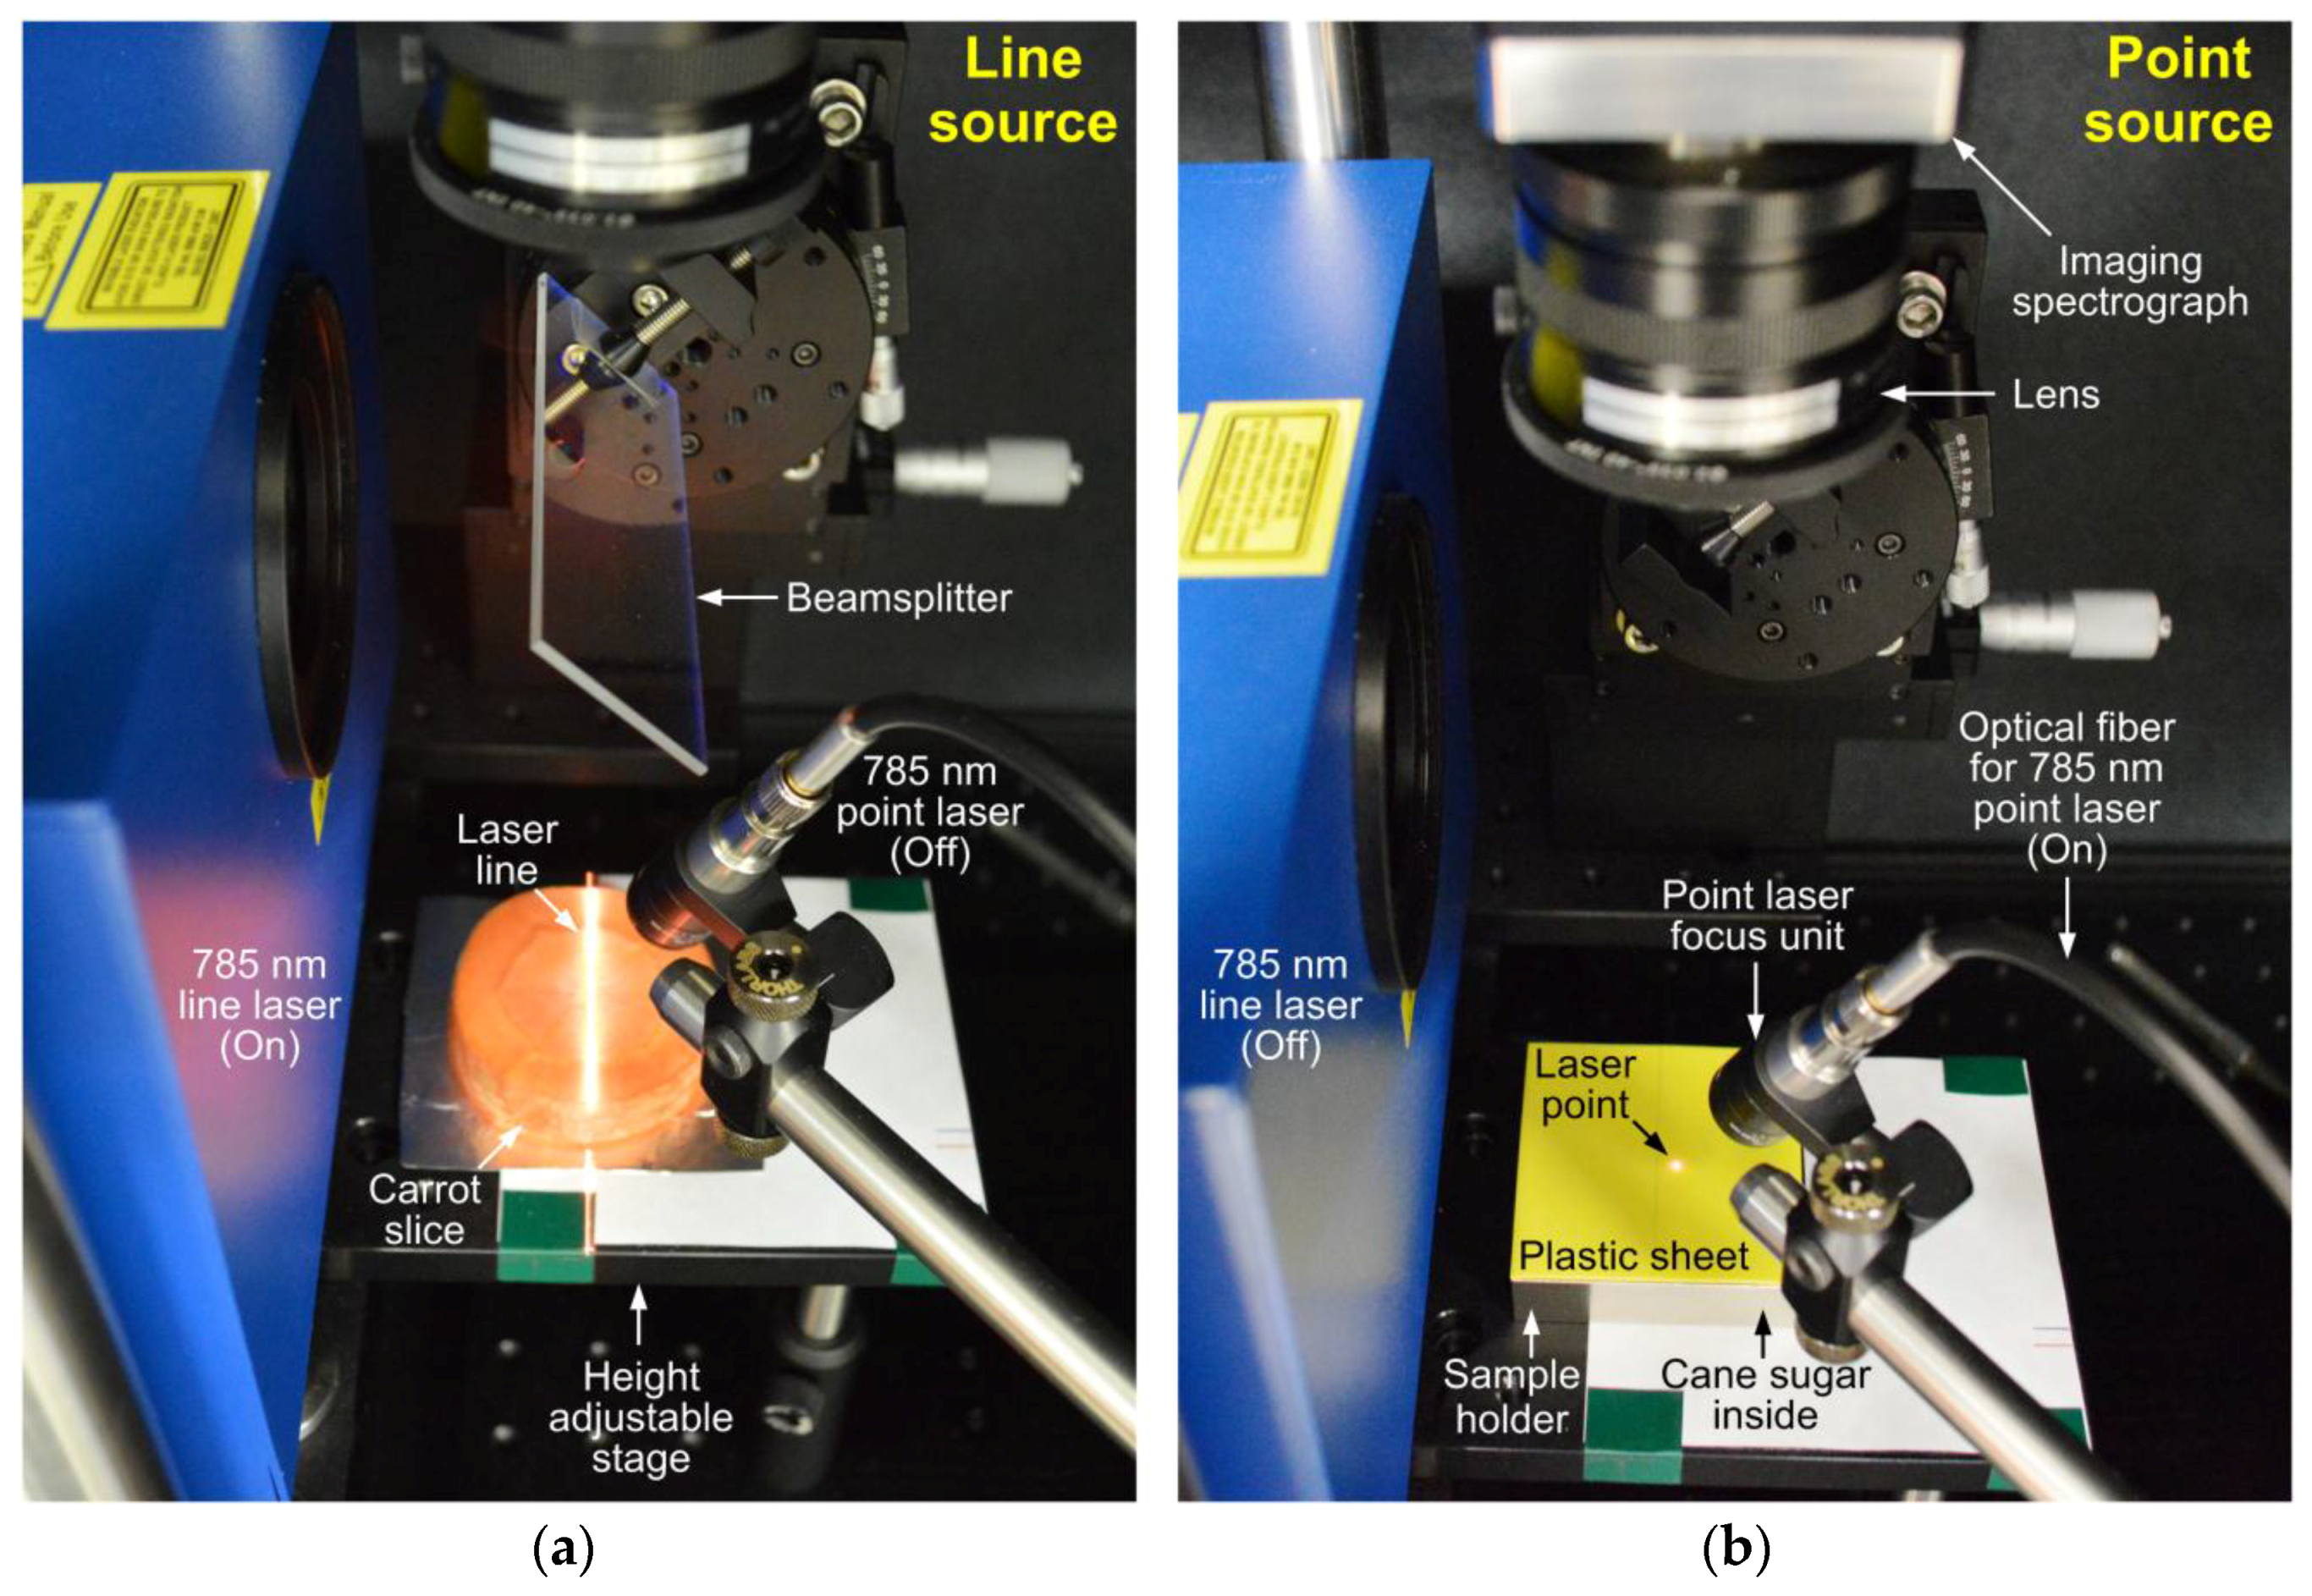
3.1.1. Light Sources

Illumination and excitation sources are two major types of light sources used in line-scan hyperspectral imaging systems. Broadband lights are commonly used illumination sources, and their spectral constitutions are not changed during light-sample interactions. Quartz tungsten halogen (QTH) lamps produce a smooth spectrum in a broad wavelength range from visible to infrared, and have been widely used as illumination sources in various reflectance and transmittance imaging measurements. Broadband light-emitting diodes (LEDs) have also been used to illuminate food and agricultural products for different hyperspectral applications. On the other hand, narrowband lights are usually used as excitation sources. High-intensity monochromatic light can excite biological materials during light-sample interactions to generate low-intensity light in a broad wavelength range (e.g., fluorescence emission and Raman scattering). Lasers are powerful excitation sources ideal for fluorescence and Raman measurements owing to their highly concentrated energy, perfect directionality, and true monochromatic emission. Narrowband LEDs are emerging excitation sources that offer many advantages such as long lifetime, low power consumption, low heat generation, small size, fast response, robustness, and non-sensitivity to vibration. Other light sources—such as ultraviolet (UV) fluorescent lamps, high-pressure arc lamps, and low-pressure metal vapor lamps—can also be used for excitation purposes.
Line-scan hyperspectral imaging systems generally have a line-shaped instantaneous field of view (IFOV). Area and line lights from illumination or excitation sources can be projected on the samples to cover the linear IFOV for line-scan surface evaluations. Point sources, which are usually generated using optical fibers and focus lenses, are required in line-scan spatially resolved spectroscopy measurements for subsurface evaluations, since spectral data need to be collected from a series of positions laterally away from the source. Figure 2 shows line laser and point laser excitation sources used in a line-scan hyperspectral Raman system. The 785 nm line laser (Figure 2a) with a maximum power of 5 W is created by spreading a high-intensity laser beam using a scanning mirror. The laser line, normally projected on the sample surface via a 45° dichroic beamsplitter, is about 1 mm wide and 24 cm long at a vertical distance (i.e., from beamsplitter to sample) of 28 cm. The line laser serves as the excitation source for line-scan Raman imaging measurements. On the other hand, the 785 nm point laser (Figure 2b) is delivered and focused on the sample surface using an optical fiber and a laser focus unit. The laser point is projected on the sample surface with an incident angle of 30°, and is approximately 1 mm in diameter with a maximum power of 350 mW. The point laser is used in line-scan spatially offset Raman spectroscopy measurements.

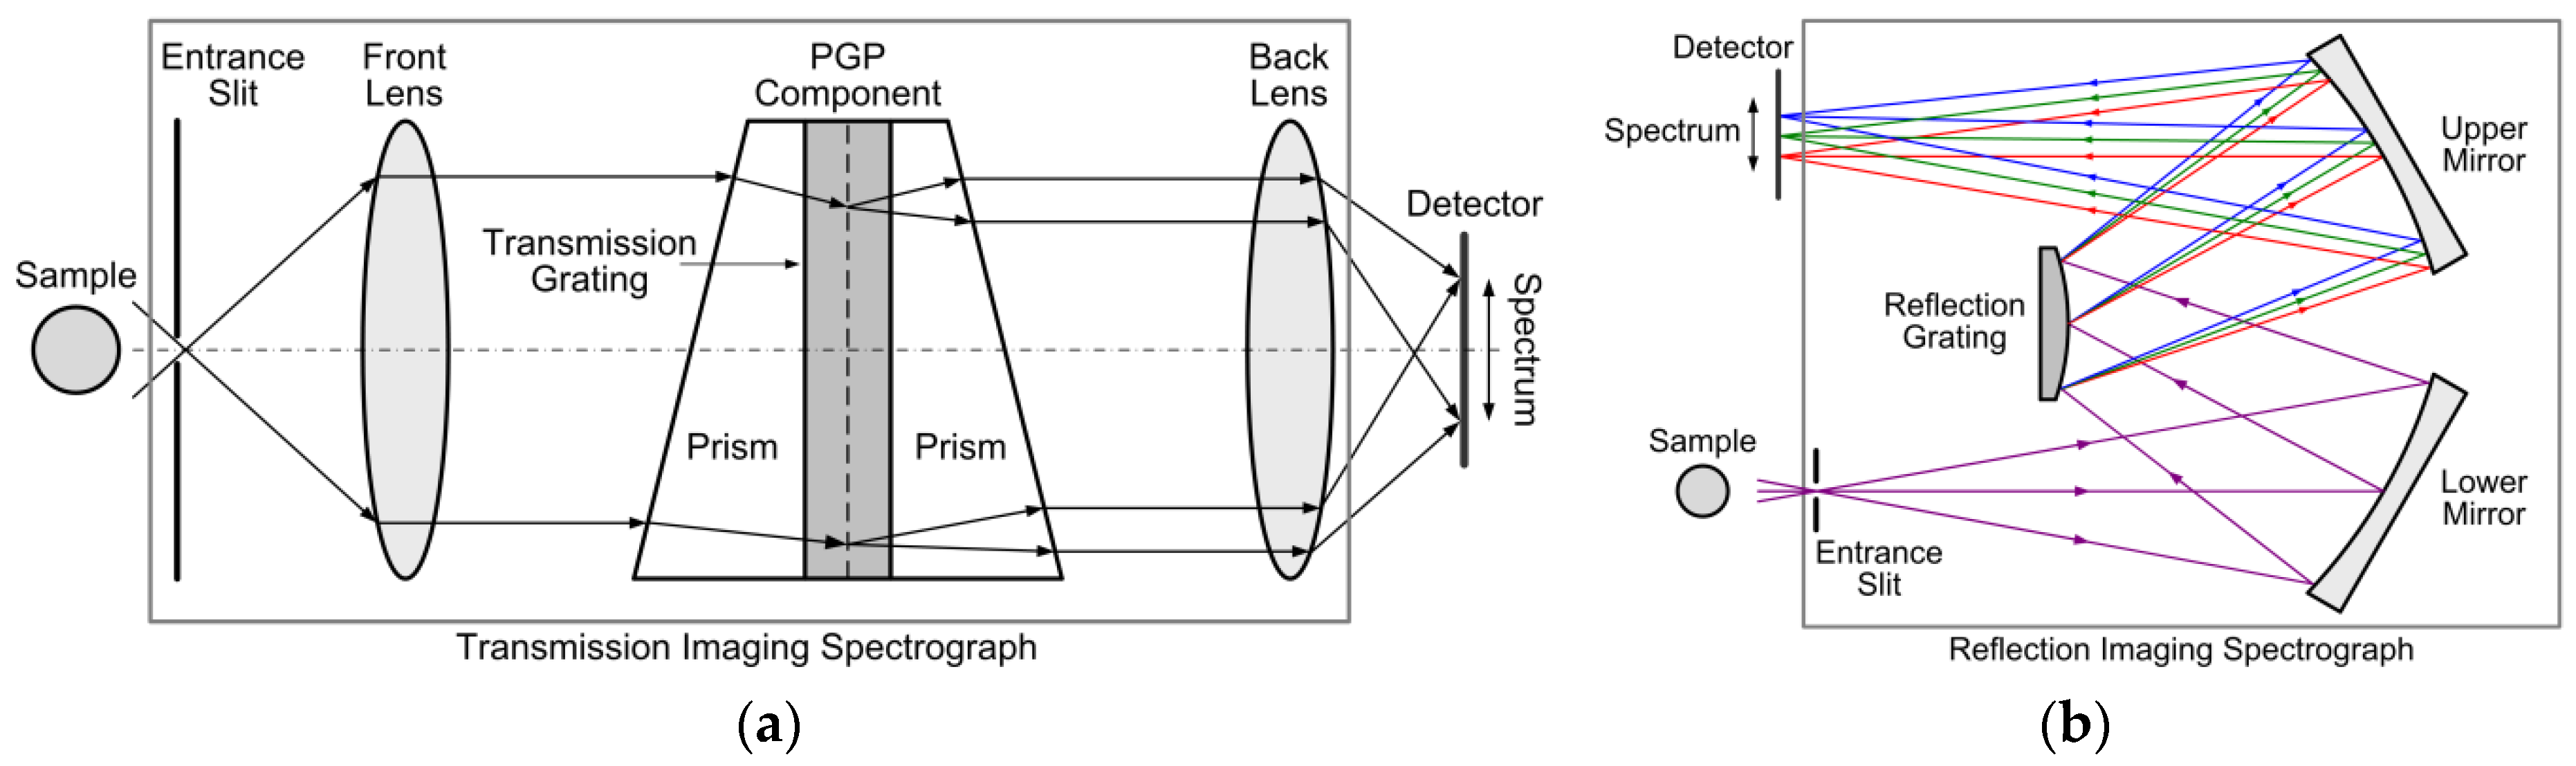
3.1.2. Imaging Spectrographs

An imaging spectrograph is an optical wavelength-dispersive device that spatially separates broadband light into different wavelengths. The imaging spectrograph acquires a line of spatial information from a target via an entrance slit, and it is the core component of line-scan hyperspectral imaging systems. Transmission and reflection gratings are two major types of diffraction gratings used in imaging spectrographs for wavelength dispersion. A transmission-grating-based imaging spectrograph is shown in Figure 3a. Incoming light is first collimated by a front lens and then dispersed at a prism-grating-prism (PGP) component, where light propagation direction is dependent on wavelength. The dispersed light is projected onto a detector through a back lens, creating a special 2-D image: one dimension represents spatial and the other spectral. Figure 3b shows a reflection-grating-based imaging spectrograph, which is specifically based on an Offner configuration. The spectrograph includes a pair of spherical mirrors and a convex reflection grating. The lower mirror guides light from the entrance slit to the reflection grating, where the beam is dispersed into different wavelengths. The upper mirror then reflects the dispersed light to the detector, where a continuous spectrum is formed for each spatial point along a scanning line on the sample. Dispersive imaging spectrographs are commercially available for different spectral regions, such as ultraviolet and visible (UV-VIS: 250–500 nm), visible (VIS: 380–800 nm), visible and near infrared (VNIR: 400–1000 nm), near infrared (NIR: 900–1700 nm), short-wavelength infrared (SWIR: 1000–2500 nm), and mid-wavelength infrared (MWIR: 3000–5000 nm). Imaging spectrographs working in narrower wavelength ranges (e.g., Raman spectrographs in 770–980 nm) are also available for particular applications (e.g., high spectral resolution).

3.1.3. Image Sensors

For line-scan hyperspectral systems based on dispersive imaging spectrographs, an image sensor is generally used with one dimension parallel to the wavelength dispersion direction for spectral information collection and the other parallel to the spectrograph entrance slit for spatial information collection. Charge-coupled devices (CCDs) are currently the mainstream image sensors. Spectral responses of the CCDs are mainly governed by the sensor substrate materials. Silicon CCDs have adequate quantum efficiency (QE) in visible and short-wavelength near-infrared (NIR) regions (e.g., 400–1000 nm). Deep depletion CCDs can improve the spectral response toward the red end of the visible region. Indium gallium arsenide (InGaAs) CCDs are the major image sensors used in the NIR region. Standard InGaAs CCDs have fairly flat and high QE in the region of 900–1700 nm. However, by altering the percentages of InAs and GaAs in the sensors, InGaAs CCDs can also be used effectively in SWIR range (i.e., 1000–2500 nm). Detectors working in the MWIR region (i.e., 3000–5000 nm) are also available, such as lead selenide (PbSe), indium antimonide (InSb), and mercury cadmium telluride (MCT). Low-light hyperspectral imaging applications usually need high-performance CCDs, such as electron-multiplying CCDs (EMCCDs) and intensified CCDs (ICCDs). Aside from CCDs, CMOS (complementary metal-oxide-semiconductor) cameras have emerged as alternative image sensors. A CMOS sensor includes both a photodetector and an active readout amplifier in each pixel (called active pixel), making it much faster for signal transfer than the vertical and horizontal registers used by CCDs to shift the electric charges. Hence the CMOS cameras are particularly suitable for high speed hyperspectral imaging applications, such as real-time inspection of food safety and quality on processing lines.

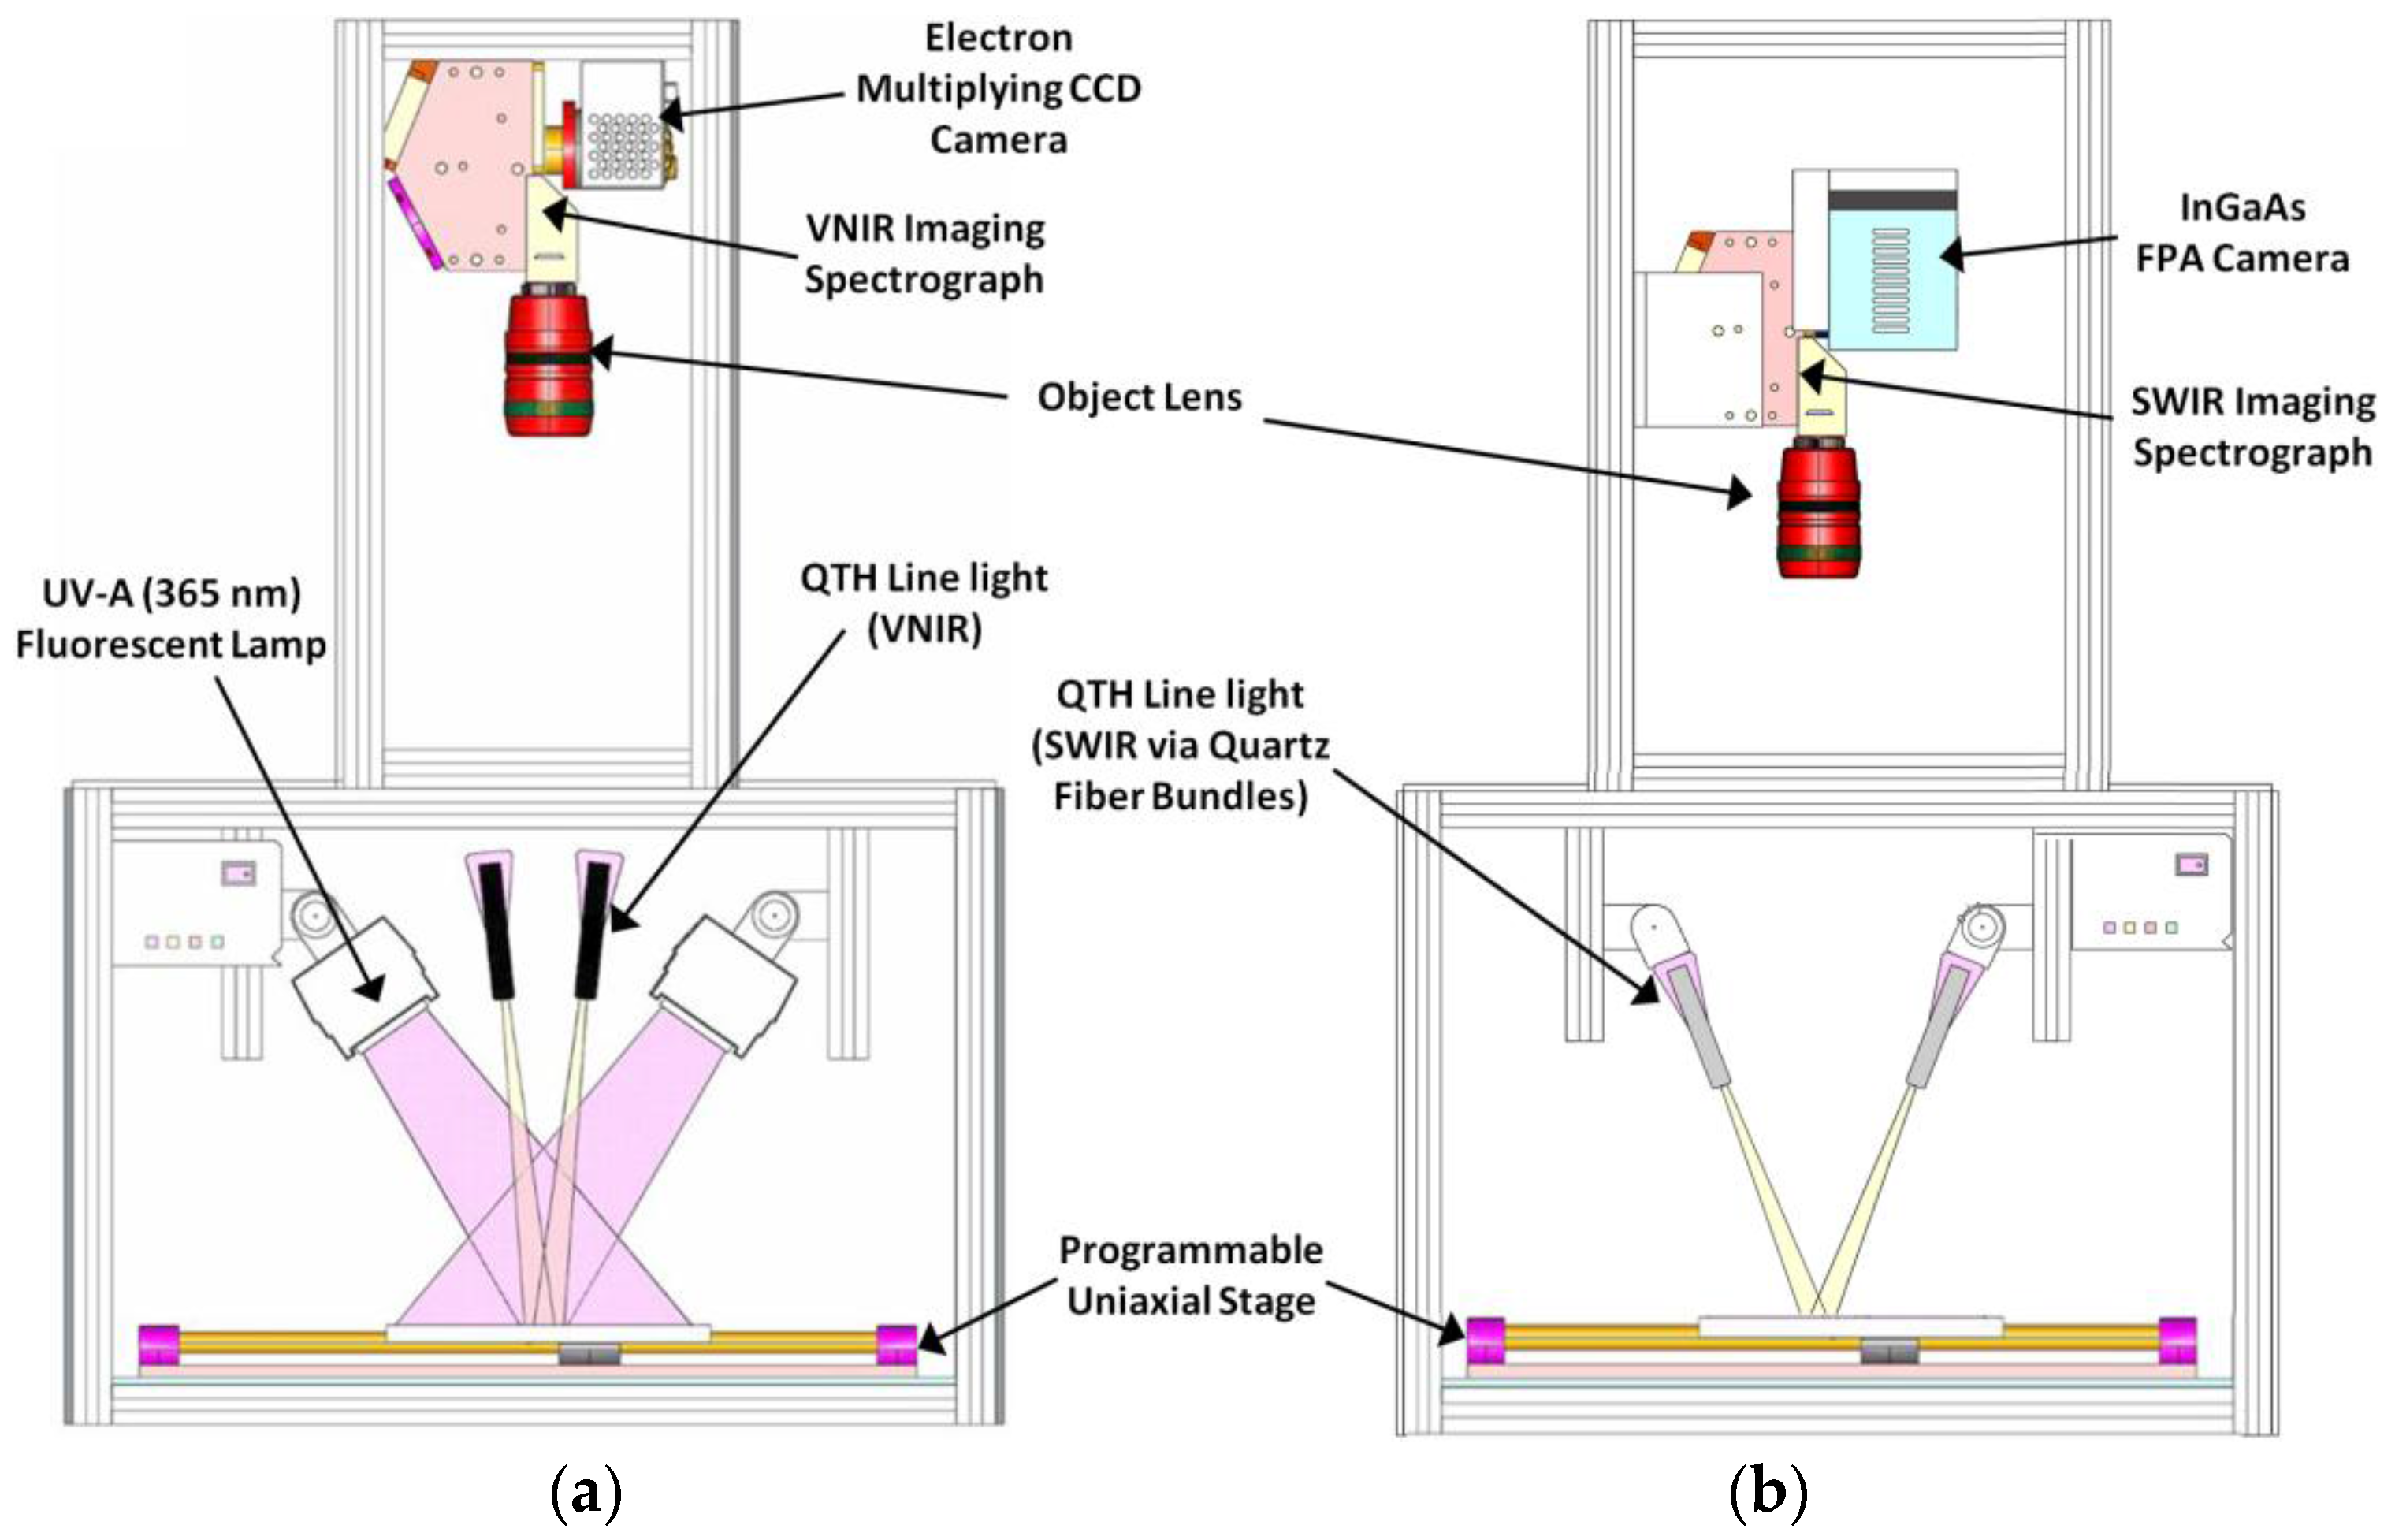
3.2. Line-Scan Hyperspectral Systems and Calibrations

Currently both commercial and custom-designed line-scan hyperspectral imaging systems are used for food and agricultural applications. The commercial integrated systems offer all-in-one solutions for more narrowly defined applications, and are increasingly adopted for routine evaluation of food and agricultural products. Meanwhile, custom-designed systems, which use modular components—such as light sources, imaging spectrographs, image sensors, and sample handling units—can provide more flexibility and versatility than the commercial systems since system components and configurations can be modified and optimized for different applications.
Figure 4 shows two custom-designed line-scan hyperspectral imaging systems working in the visible and near-infrared (VNIR) region (Figure 4a) and the short-wavelength infrared (SWIR) region (Figure 4b) [13]. In each system, a 150 W quartz tungsten halogen lamp (Dolan Jenner, MA, USA) is used as the illumination source for reflectance imaging. The light is conveyed from the lamp enclosure via a fiber assembly to form two thin fiber optic line lights (250 mm long each), which are arranged parallel to the transverse direction. Two UV-A (365 nm peak) fluorescent lamp assemblies (Spectronics, Westbury, NY, USA) are also used in the VNIR system for fluorescence imaging. The sensing unit of the VNIR system consists of a 35 mm focal length lens, a reflection imaging spectrograph (Hyperspec VNIR, Headwall Photonics, Fitchburg, MA, USA), and a 1004 (spatial) × 1002 (spectral) pixel EMCCD camera (Luca DL 604M, Andor Technology, South Windsor, CT, USA). The nominal wavelength range covered by the VNIR system is from 400 to 1000 nm. For the SWIR system, a 320 (spatial) × 256 (spectral) pixel InGaAs camera (XEVA-1.7-320, Xenics, Leuven, Belgium) with a reflection imaging spectrograph (Hyperspec SWIR, Headwall Photonics, Fitchburg, MA, USA) and a 25 mm focal length lens is used to acquire images in a nominal spectral region of 1000–1700 nm. For both systems, line-by-line hyperspectral reflectance or fluorescence images are collected by advancing a computer-controlled one-axis positioning stage in the direction perpendicular to the scanning lines of the imaging spectrographs. Fully-automated data acquisition software was developed for each system using Visual Basic (Microsoft, Redmond, WA, USA).
A custom-designed line-scan hyperspectral Raman system [14] is shown in Figure 5. The system can be configured for either a Raman chemical imaging (RCI) mode for surface evaluation (Figure 5a) or a spatially offset Raman spectroscopy (SORS) mode for subsurface evaluation (Figure 5b). In the RCI mode, a 785 nm line laser (Innovative Photonic Solutions, Monmouth Junction, NJ, USA) serves as an excitation source, which is normally projected on the sample surface via a 45° dichroic beamsplitter. The SORS mode uses a 785 nm point laser (Innovative Photonic Solutions, Monmouth Junction, NJ, USA), which is delivered and focused on the sample surface with an incident angle of 30° using an optical fiber and a laser focus unit. The RCI and SORS configurations share a common detection module consisting of a transmission imaging spectrograph (ImSpector R10E, Specim, Oulu, Finland) and a 1024 (spatial) × 1024 (spectral) pixel CCD camera (iKon-M 934, Andor Technology, South Windsor, CT, USA). A C-mount lens is attached to the spectrograph for aperture and focus adjustment. Two identical 785 nm long-pass filters are used to block the light at and below the laser wavelength (i.e., Rayleigh and anti-Stokes scattering). The system covers a wavenumber range from −674 to 2865 cm−1 with a spectral resolution of 14 cm−1. In the RCI mode, a one-axis motorized positioning table moves the samples to collect hyperspectral Raman data using multiple line scans. In the SORS mode, a single line scan is performed to acquire a Raman scattering image using one CCD exposure for subsurface inspection applications. In-house software developed using LabVIEW (National Instruments, Austin, TX, USA) is used to perform parameterization and data-transfer functions.
Spectral and spatial calibrations are needed for line-scan hyperspectral imaging systems to acquire meaningful data. The spectral calibrations map the pixel indices along the spectral dimension of the image sensor to the wavelengths or wavenumbers. Spectral calibration lamps are common tools used in spectral calibrations. For hyperspectral Raman systems, the spectral calibrations use relative wavenumbers as references instead of wavelengths used in absolute spectral calibrations. A single-wavelength laser and chemicals with known relative wavenumber shifts are usually used to calibrate the Raman systems. The relationship between pixel positions and corresponding wavelengths or wavenumbers can be established using linear or nonlinear regression models. On the other hand, the spatial calibrations are useful to adjust the field of view and estimate the spatial detection limit. The spatial resolution along the direction of sample movement depends on the step size of the movement, and the spatial range is determined by the step size and the number of scans. For the direction parallel to the scanning line, the length of instantaneous field of view (IFOV) determines the maximum sample width that can be covered, and it can be changed by adjusting the focal length of the lens and the lens-to-sample working distance. Figure 6 shows a spatial calibration example for a line-scan hyperspectral imaging system using a piece of paper printed with parallel lines spaced 2.5 mm apart. Under a setting using a lens with a 35 mm focal length and a working distance of 200 mm, the spatial resolution is 0.07 mm/pixel, and the IFOV length is 71.68 mm (Figure 6a). When a 23 mm lens and a 355 mm working distance are used, the spatial resolution is reduced to 0.20 mm/pixel, and the IFOV length is extended to 204.80 mm (Figure 6b). Hence the system can be arranged for either high spatial resolution or large field of view to accommodate different resolution and sample size requirements.

4. Hyperspectral Image Analysis Methods

4.1. Line-Scan Hyperspectral Image Data

Line-scan hyperspectral images are generally saved in a 3-D data format (x, y, λ) (see Figure 1a) of band interleaved by line (BIL). The BIL format stores data at all the bands from the first scan line, followed by all the bands from the second scan line. Data from subsequent multiple scan lines are interleaved in a similar manner. A complete spectrum can be plotted at any pixel, and 2-D spatial images can be compiled from all the scan lines at selected wavebands. On the other hand, line-scan spatially resolved spectral data from a single scan are usually saved in a 2-D scattering image format (y, λ) (see Figure 1b), in which spectra at different source-to-detector distances and spatial profiles at different wavelengths can be extracted for further analysis.
Figure 7 shows representative line-scan hyperspectral images of Golden Delicious apples. Figure 7a shows 13 reflectance images from 450 to 1650 nm at 100 nm increments collected from a Golden Delicious apple using the two hyperspectral systems (VNIR and SWIR) shown in Figure 4 [13]. These single-band images illustrate the variations of the spatial features as a function of wavelength, which can be used for various inspection purposes, such as detecting apple surface defects and contaminants. The image in Figure 7b is a light scattering image using a point halogen source with a line-scan spatially resolved diffuse reflectance measurement method [11]. Original reflectance spectra at three source-to-detector distances (i.e., 0, 3, and 6 mm) and normalized spatial profiles at three wavelengths (i.e., 600, 675, and 800 nm) are plotted to demonstrate the spectral and spatial information extracted along the vertical and horizontal dimensions of the scattering image. Light absorption and scattering properties of the apple, which are quantified respectively by the absorption coefficient (µa) and the reduced scattering coefficient (µs’), can be determined using a curve fitting method for the spatial profiles at all the wavelengths based on a diffusion theory model, and they can be used to evaluate apple internal quality attributes, such as fruit firmness and soluble solids content [15].

4.2. Hyperspectral Image Preprocessing

Original hyperspectral data are generally not suitable for direct qualitative/quantitative analysis since artifacts, noises, and undesired signals are also collected owing to test environments and imperfect components in the imaging systems. Spectral and image preprocessing procedures aim to remove these effects to make the data independent of the measurement conditions and systems. For reflectance measurements, flat-field correction, which aims to reduce artifacts caused by pixel-to-pixel signal variations and distortions along the optical path, is a frequently used preprocessing method. White diffuse reflectance panels—with a reflectance factor close to 100% over a broad wavelength range—are usually used as standards to convert original absolute intensities in CCD counts to relative reflectance in percent (typically in the range of 0%–100%). For fluorescence flat-field corrections, several flat-field materials (e.g., white inkjet paper, fluorescein, and rhodamine B) are usually needed for different spectral regions (e.g., blue, green, and red) due to limited spectral ranges in fluorescence emission (<150 nm) [3]. In Raman measurements for food and biological materials, fluorescence signals are commonly acquired in laser-sample interactions. The weak Raman scattering signals can be easily overwhelmed by the strong fluorescence signals. Hence fluorescence correction is a major preprocessing procedure in Raman data analysis. Based on its mathematical nature, the fluorescence baseline can be eliminated using different algorithms, such as polynomial curve fitting, least squares, wavelet transformation, Fourier transformation, and derivatives [16]. Besides the aforementioned procedures, other preprocessing methods such as spectral smoothing, normalization, image masking, and spatial filtering can also be used to reduce various useless signals in the original image data.
An example of fluorescence correction for Raman data of a carrot slice [14] is shown in Figure 8. Raman images were acquired using a step size of 0.07 mm by the line-scan hyperspectral system shown in Figure 2a and Figure 5a (see 785 nm line laser on the carrot in Figure 2a), resulting in a 900 × 900 × 1024 hypercube (900 scans and 1024 bands). Fluorescence signals were observed in the original Raman spectra at four selected tissue areas (Figure 8e). An original single-band Raman image (Figure 8b) was dominated by the strong fluorescence from the periderm layer. After removing the fluorescence background by a baseline correction method using adaptive iteratively reweighted penalized least squares (airPLS) [17], three major Raman peaks became more evident at 1006, 1154, and 1513 cm−1 (Figure 8f), which can be assigned to carotenoids in the carrot tissues. Because the periderm fluorescence was largely diminished in the corrected image at 1513 cm−1 (Figure 8c), the carotenoid Raman signals became the major feature owing to the peak intensities at this wavenumber. A color map image (Figure 8d), which was created based on the pixel intensities of the 1513 cm−1 corrected image, illustrates the relative concentration of the carotenoids and provides a better view of the carotenoid distribution over the carrot cross section than the color image (Figure 8a). The Raman chemical imaging method demonstrated in this example can be used to inspect Raman-active attributes (e.g., natural pigments) of other types of fruits and vegetables for monitoring quality, maturity, disease, and plant development.

4.3. Hyperspectral Band Selection

Redundant information exists across tens or hundreds of bands in 3-D hyperspectral images. Spectral dimension reduction and useful information retrieval are critical to analyze hyperspectral image data for qualitative/quantitative analysis. To fit multispectral imaging solutions for online and real-time rapid inspection applications using simple detection algorithms, a small subset of important bands (usually less than 10) must be selected. In the visible and near-infrared wavelength range, typical reflectance, transmittance, and fluorescence spectra naturally exhibit broad and overlapped spectral peaks and shoulders. Hence, it is generally not straightforward to identify the important bands that are optimal for specific hyperspectral imaging applications. Mathematical optimization algorithms and multivariate analysis techniques are usually required to reduce the spectral dimension and identify the key wavelengths. Commonly used methods include principal component analysis (PCA), partial least squares (PLS), linear discriminant analysis (LDA), correlation analysis (CA), artificial neural networks (ANN), genetic algorithm (GA), sequential forward selection (SFS), etc. In general, spectra from all hyperspectral image pixels or selected regions of interest (ROIs) are extracted to form a 2-D spectral data matrix on which multivariate analysis and band selection methods can be directly conducted to determine important wavelengths. It should be noted that Raman spectra are naturally characterized by narrow and sharp spectral peaks appearing at fixed wavenumbers with easy-to-understand physical/chemical meanings. Thus the band selection for hyperspectral Raman images is usually more straightforward without using the aforementioned advanced mathematical algorithms, especially for Raman spectra after fluorescence baseline correction.
Figure 9 shows an example of using correlation analysis to select important bands for hyperspectral fluorescence images to detect organic residues on poultry processing equipment surfaces. Fluorescence images were collected in the spectral region of 500–700 nm (42 bands in total) from chicken residues on stainless steel sheets by a line-scan hyperspectral system using high-power 400 nm blue LEDs as an excitation source [18], which is similar to the system illustrated in Figure 5a except for the 365 nm UV-A fluorescent lamps. Chicken fat, blood, four types of feces, and stainless steel exhibited different emission patterns in their representative fluorescence spectra (Figure 9a). Correlation coefficients were calculated between designated label values (i.e., “1” for organic residue samples and “0” for stainless steel sheets) and two-band ratios of the fluorescence spectra in an exhaustive way (i.e., evaluating all possible two-band combinations from the 42 wavebands). In the contour plot of the correlation coefficients (Figure 9b), the two-band ratio between 503 and 666 nm (F503/F666) was found to give the maximum absolute correlation value of 0.94. Two-band ratio images were calculated using the selected two bands, and binary images were then generated by applying a simple thresholding method to the F503/F666 ratio images (Figure 9c). The final binary images can be used to detect all the chicken residues on the stainless steel sheets. The selected wavelength pair can be adopted for developing a LED-based handheld fluorescence imaging device for inspecting poultry processing equipment surfaces.

4.4. Hyperspectral Target Identification

Hyperspectral target identification intends to recognize sample substances utilizing both spectral and spatial information from the collected images. In various food and agricultural applications, it is usually needed to identify target pixels on sample surfaces. The important wavelengths determined by band selection methods can be used to develop simple algorithms (e.g., band ratio) for simple and fast detection purposes (e.g., pass-or-fail food safety inspection). The example shown in Figure 9 demonstrated that ratio fluorescence images using two selected bands can be used to detect chicken organic residues on stainless steel sheets. However, the two bands may not be sufficient to identify or differentiate the six different types of the organic residues. Whole spectra from hyperspectral images are often necessary for precise target identification. The hyperspectral pixels can be recognized based on statistical comparisons between the extracted spectra and reference spectra of interesting targets using spectral matching methods, such as spectral angle mapper and spectral information divergence [19]. After spectral matching, a 2-D rule image is usually generated, and image postprocessing procedures (e.g., thresholding, spatial filtering) are often used to create the final results for identification, classification, and mapping tasks. On the other hand, spectral signals from line-scan spatially resolved spectroscopy measurement for heterogeneous or layered samples are normally mixed. Curve resolution and mixture analysis methods can be used to segregate and resolve the spectra from different components in a mixture. For example, self-modeling mixture analysis (SMA) is an effective method for such purpose. SMA decomposes a data matrix into the outer product of pure component spectra and contributions [20]. The resolved spectra can be identified using the aforementioned spectral matching methods.
An example of separating mixed spectra from layered samples based on mixture analysis for spatially offset Raman spectroscopy (SORS) measurement is shown in Figure 10. A line-scan hyperspectral Raman system working in the SORS mode (Figure 5b) was used to collect SORS data from a layered sample, which was created by placing a 1 mm thick plastic sheet cut from an original sugar container on top of a layer of granulated cane sugar (see Figure 2b) [21]. A 1024 × 1024 spatial-spectral scattering image covering a source-to-detector distance range of 0–36 mm (on both sides of the 785 nm laser point) was acquired over a wavenumber range of 0–2815 cm−1. The longest scattering distances for pure plastic and sugar appeared at 1438 and 531 cm−1 (Figure 10a), which are attributed to the highest Raman peaks of plastic and sugar, respectively. Raman signals for both plastic and sugar were observed in the scattering image of the plastic-on-sugar sample. As offset distances increased for the SORS spectra (Figure 10b), the relative intensities of the 1438 cm−1 plastic peaks were steadily weakened, while those of the 531 cm−1 sugar peaks were gradually amplified. The Raman signals from the two layers were successfully separated using self-modeling mixture analysis on the SORS data. Pure component spectra resolved from SMA (Figure 10c,d) recovered all the major Raman features of the plastic sheet and the cane sugar. This example reveals the potential of the line-scan SORS technique coupled with the SMA method for nondestructive subsurface inspection of food safety and quality.

5. Food Safety and Quality Applications

Over the past 15 years, line-scan hyperspectral imaging techniques have been intensively researched and developed for measuring physical, chemical, and biological properties of a broad range of food and biological materials. The application scope has been expanded rapidly into many food and agricultural areas such as food safety and quality evaluation, plant maturity and disease monitoring, raw material screening, food processing assessment, and equipment sanitation inspection. Table 1 lists many such line-scan hyperspectral imaging applications. The selected applications, which are representative rather than exhaustive, were categorized based on the underlying spectroscopy techniques used in the line-scan hyperspectral imaging measurements. It should be noted that these applications are generally under indoor-controlled lighting conditions (e.g., laboratory and food processing plant). Outdoor and field applications of the hyperspectral imaging techniques (e.g., plant cultivation and phenotyping) [22,23] are beyond the scope of this review. Food and agricultural products are complicated systems that can be considered mixtures of different types of molecules. The interesting molecules in a food matrix can be investigated based on different types of spectral information. Reflectance, transmittance, fluorescence, and Raman spectroscopy and imaging techniques can be used to analyze many intrinsic compositions (e.g., proteins, fats, carbohydrates, carotenoids, fatty acid, and inorganics) and extrinsic components (e.g., bacteria, adulterants, and contaminants) of the food and biological samples.
As shown in Table 1, one main application area is food surface inspection. Reflectance imaging in the visible and near-infrared region, fluorescence imaging in the visible region, and Raman imaging in the near-infrared region can all be utilized to inspect exterior characteristics of different types of food and agricultural products, such as inspecting bruises on apples using reflectance [24], detecting fecal contamination on apples using fluorescence [6], and screening for chemical adulterants in food powders using Raman [25]. Transmittance imaging in the visible and near-infrared region using high-intensity light sources is suitable to assess overall interior attributes of small or thin food samples, such as detecting insect damage in soybean [26] and mapping fat distribution in pork belly and salmon fillet [27]. Integration of different spectroscopy techniques into hyperspectral imaging measurements can provide more detection capacities and achieve more accurate results than those using a single imaging mode, such as evaluating both external and internal quality of pickling cucumbers using integrated reflectance and transmittance imaging [28] and detecting aflatoxins in corn kernels using combined reflectance and fluorescence image data [29]. Besides imaging, spatially resolved spectroscopy techniques based on line-scan hyperspectral acquisition methods can be used for obtaining internal or subsurface information from heterogeneous or layered food samples, such as firmness assessment of peach fruit using spatially resolved diffuse reflectance spectroscopy [30] and through-plastic-package inspection of cane sugar using spatially offset Raman spectroscopy [21]. In addition, line-scan imaging systems working in both hyperspectral and multispectral modes have been developed, in which the number of bands, central wavelengths, and bandwidths can be controlled via software in the multispectral mode [31,32]. Such systems can scan hundreds of lines per second using CCD exposure times at the millisecond level, making them particularly useful to inspect fast-moving food items on the processing lines in real time.
Figure 11 shows an example of using line-scan hyperspectral/multispectral reflectance imaging for online wholesomeness inspection of freshly slaughtered poultry carcasses on a high-speed commercial chicken processing line [32]. The inspection system used a pair of high-power white LED line lights to illuminate chicken carcasses hung from shackles (Figure 11a). A sensing unit—which consisted of a C-mount lens, a transmission imaging spectrograph, and an EMCCD camera—was used to collect hyperspectral reflectance images line by line in 55 bands (389–753 nm) from the chicken carcasses that were moving at a speed of 140 birds per minute (bpm). Single-band 2-D spatial images (Figure 11b) were compiled from the acquired line-scan hyperspectral images for offline image and spectral analysis, such as region of interest (ROI) optimization and key band selection. Analysis of two-band ratios found that using the pairing of 580 and 620 nm (R580/R620) gave the largest difference between the average ROI reflectance spectra of the wholesome chickens and the systemically diseased chickens. The selected two wavelengths were then used by the same imaging system in multispectral imaging mode in a poultry plant. During continuous operation for over 100,000 chickens on a commercial 140-bpm kill line, the multispectral system achieved over 99% accuracy in identifying wholesome chickens and over 96% accuracy in identifying unwholesome chickens. The system can improve chicken product safety by preventing most unwholesome birds from entering the evisceration line and also by reducing the routine workload for food safety inspectors working in the chicken processing plants.

6. Conclusions

Line scanning is a major hyperspectral imaging measurement method that is well-suited for inspection of food and agricultural products, especially for food items moving along the processing and production lines. Driven by interest from both academic and industrial areas, line-scan hyperspectral imaging techniques have been evolving rapidly over the past 15 years in the food and agricultural field. The techniques have been intensively researched and developed with use of different physical principles and wavelength ranges. Various custom-designed line-scan hyperspectral imaging systems have been developed around the world, and successfully used to measure physical, chemical, and biological properties of a broad range of food and agricultural products for the purposes of surface, subsurface, and internal evaluations. As the technologies mature, integrated line-scan hyperspectral imaging systems have become commercially available to provide all-in-one inspection solutions, helping to further expand the scope of practical food applications. Existing and emerging techniques in this area were reviewed to reflect current practices and future trends of line-scan hyperspectral imaging for food safety and quality applications. Advances in both high-performance hardware components and fast data analysis methods and software will drive the future development of line-scan hyperspectral imaging techniques.

Acknowledgments

This research was partially supported by a grant from the Next-Generation BioGreen 21 Program (No. PJ01125602), Rural Development Administration, Republic of Korea.

Author Contributions

Moon S. Kim, Kuanglin Chao, and Stephen R. Delwiche conducted pioneering work on this subject and led the choice of the topic for the review; Byoung-Kwan Cho and Jianwei Qin further developed the techniques and performed the literature review; Jianwei Qin and Diane E. Chan wrote the paper.

Conflicts of Interest

The authors declare no conflict of interest.

References

  1. Qin, J.; Chao, K.; Kim, M.S.; Lu, R.; Burks, T.F. Hyperspectral and multispectral imaging for evaluating food safety and quality. J. Food Eng. 2013, 118, 157–171. [Google Scholar] [CrossRef]
  2. Lu, R.; Chen, Y. Hyperspectral imaging for safety inspection of food and agricultural products. Proc. SPIE 1999, 3544. [Google Scholar] [CrossRef]
  3. Kim, M.S.; Chen, Y.; Mehl, P.M. Hyperspectral reflectance and fluorescence imaging system for food quality and safety. Trans. ASAE 2001, 44, 721–729. [Google Scholar]
  4. Huang, H.; Liu, L.; Ngadi, M.O. Recent developments in hyperspectral imaging for assessment of food quality and safety. Sensors 2014, 14, 7248–7276. [Google Scholar] [CrossRef] [PubMed]
  5. Qin, J.; Chao, K.; Cho, B.; Peng, Y.; Kim, M.S. High-throughput Raman chemical imaging for rapid evaluation of food safety and quality. Trans. ASABE 2014, 57, 1783–1792. [Google Scholar]
  6. Kim, M.S.; Lefcourt, A.M.; Chen, Y.; Kim, I.; Chan, D.E.; Chao, K. Multispectral detection of fecal contamination on apples based on hyperspectral imagery. Part II. Application of hyperspectral fluorescence imaging. Trans. ASAE 2012, 45, 2039–2047. [Google Scholar]
  7. McCreery, R.L. Raman Spectroscopy for Chemical Analysis; John Wiley and Sons: New York, NY, USA, 2000. [Google Scholar]
  8. Dam, J.S.; Pedersen, C.B.; Dalgaard, T.; Fabricius, P.E.; Aruna, P.; Andersson-Engels, S. Fiber-optic probe for noninvasive real-time determination of tissue optical properties at multiple wavelengths. Appl. Opt. 2001, 40, 1155–1164. [Google Scholar] [CrossRef] [PubMed]
  9. Hyde, D.E.; Farrell, T.J.; Patterson, M.S.; Wilson, B.C. A diffusion theory model of spatially resolved fluorescence from depth-dependent fluorophore concentrations. Phys. Med. Biol. 2001, 46, 369–383. [Google Scholar] [CrossRef] [PubMed]
  10. Matousek, P.; Clark, I.P.; Draper, E.R.C.; Morris, M.D.; Goodship, A.E.; Everall, N.; Towrie, M.; Finney, W.F.; Parker, A.W. Subsurface probing in diffusely scattering media using spatially offset Raman spectroscopy. Appl. Spectrosc. 2005, 59, 393–400. [Google Scholar] [CrossRef] [PubMed]
  11. Qin, J.; Lu, R. Measurement of the optical properties of fruits and vegetables using spatially resolved hyperspectral diffuse reflectance imaging technique. Postharvest Biol. Technol. 2008, 49, 355–365. [Google Scholar] [CrossRef]
  12. Qin, J.; Kim, M.S.; Schmidt, W.F.; Cho, B.; Peng, Y.; Chao, K. A line-scan hyperspectral Raman system for spatially offset Raman spectroscopy. J. Raman Spectrosc. 2016, 47, 437–443. [Google Scholar] [CrossRef]
  13. Kim, M.S.; Delwiche, S.R.; Chao, K.; Garrido-Varo, A.; Pérez-Marín, D.; Lefcourt, A.M.; Chan, D.E. Visible to SWIR hyperspectral imaging for produce safety and quality evaluation. Sens. Instrum. Food Qual. Saf. 2011, 5, 155–164. [Google Scholar] [CrossRef]
  14. Qin, J.; Kim, M.S.; Chao, K.; Schmidt, W.F.; Cho, B.; Delwiche, S.R. Line-scan Raman imaging and spectroscopy platform for surface and subsurface evaluation of food safety and quality. J. Food Eng. 2017, 198, 17–27. [Google Scholar] [CrossRef]
  15. Qin, J.; Lu, R.; Peng, Y. Prediction of apple internal quality using spectral absorption and scattering properties. Trans. ASABE 2009, 52, 499–507. [Google Scholar] [CrossRef]
  16. Schulze, G.; Jirasek, A.; Yu, M.M.L.; Lim, A.; Turner, R.F.B.; Blades, M.W. Investigation of selected baseline removal techniques as candidates for automated implementation. Appl. Spectrosc. 2005, 59, 545–574. [Google Scholar] [CrossRef] [PubMed]
  17. Zhang, Z.; Chen, S.; Liang, Y. Baseline correction using adaptive iteratively reweighted penalized least squares. Analyst 2010, 135, 1138–1146. [Google Scholar] [CrossRef] [PubMed]
  18. Qin, J.; Chao, K.; Kim, M.S.; Kang, S.; Cho, B.; Jun, W. Detection of organic residues on poultry processing equipment surfaces by LED-induced fluorescence imaging. Appl. Eng. Agric. 2011, 27, 153–161. [Google Scholar] [CrossRef]
  19. Chang, C.I. An information theoretic-based approach to spectral variability, similarity and discriminability for hyperspectral image analysis. IEEE Trans. Inf. Theory 2000, 46, 1927–1932. [Google Scholar] [CrossRef]
  20. Windig, W.; Guilment, J. Interactive self-modeling mixture analysis. Anal. Chem. 1991, 63, 1425–1432. [Google Scholar] [CrossRef]
  21. Qin, J.; Kim, M.S.; Chao, K.; Schmidt, W.F.; Dhakal, S.; Cho, B.; Peng, Y.; Huang, M. Subsurface inspection of food safety and quality using line-scan spatially offset Raman spectroscopy technique. Food Control 2017, 75, 246–254. [Google Scholar] [CrossRef]
  22. Lee, W.S.; Alchanatis, V.; Yang, C.; Hirafuji, M.; Moshou, D.; Li, C. Sensing technologies for precision specialty crop production. Comput. Electron. Agric. 2010, 74, 2–33. [Google Scholar] [CrossRef]
  23. Li, L.; Zhang, Q.; Huang, D. A review of imaging techniques for plant phenotyping. Sensors 2014, 14, 20078–20111. [Google Scholar] [CrossRef] [PubMed]
  24. Lu, R. Detection of bruises on apples using near-infrared hyperspectral imaging. Trans. ASAE 2003, 46, 523–530. [Google Scholar]
  25. Qin, J.; Chao, K.; Kim, M.S.; Cho, B. Line-scan macro-scale Raman chemical imaging for authentication of powdered foods and ingredients. Food Bioprocess Technol. 2016, 9, 113–123. [Google Scholar] [CrossRef]
  26. Huang, M.; Wan, X.; Zhang, M.; Zhu, Q. Detection of insect-damaged vegetable soybeans using hyperspectral transmittance image. J. Food Eng. 2013, 116, 45–49. [Google Scholar] [CrossRef]
  27. Wold, J.; Kermit, M.; Segtnan, V. Chemical imaging of heterogeneous muscle foods using near-infrared hyperspectral imaging in transmission mode. Appl. Spectrosc. 2016, 70, 953–961. [Google Scholar] [CrossRef] [PubMed]
  28. Ariana, D.P.; Lu, R. Quality evaluation of pickling cucumbers using hyperspectral reflectance and transmittance imaging: Part I. Development of a prototype. Sens. Instrum. Food Qual. Saf. 2008, 2, 144–151. [Google Scholar] [CrossRef]
  29. Zhu, F.; Yao, H.; Hruska, Z.; Kincaid, R.; Brown, R.; Bhatnagar, D.; Cleveland, T. Integration of fluorescence and reflectance visible near-infrared (VNIR) hyperspectral images for detection of aflatoxins in corn kernels. Trans. ASABE 2016, 59, 785–794. [Google Scholar]
  30. Lu, R.; Peng, Y. Hyperspectral scattering for assessing peach fruit firmness. Biosyst. Eng. 2006, 93, 161–171. [Google Scholar] [CrossRef]
  31. Kim, M.S.; Chen, Y.; Cho, B.; Chao, K.; Yang, C.; Lefcourt, A.M.; Chan, D.E. Hyperspectral reflectance and fluorescence line-scan imaging for online defect and fecal contamination inspection of apples. Sens. Instrum. Food Qual. Saf. 2007, 1, 151–159. [Google Scholar] [CrossRef]
  32. Chao, K.; Yang, C.; Kim, M.S.; Chan, D.E. High throughput spectral imaging system for wholesomeness inspection of chicken. Appl. Eng. Agric. 2008, 24, 475–485. [Google Scholar] [CrossRef]
  33. Kim, M.S.; Lefcourt, A.M.; Chao, K.; Chen, Y.; Kim, I.; Chan, D.E. Multispectral detection of fecal contamination on apples based on hyperspectral imagery. Part I. Application of visible and near-infrared reflectance imaging. Trans. ASAE 2002, 45, 2027–2037. [Google Scholar]
  34. Park, B.; Lawrence, K.C.; Windham, W.R.; Buhr, R.J. Hyperspectral imaging for detecting fecal and ingesta contaminants on poultry carcasses. Trans. ASAE 2002, 45, 2017–2026. [Google Scholar] [CrossRef]
  35. Liu, Y.; Chen, Y.; Wang, C.; Chan, D.E.; Kim, M.S. Development of a simple algorithm for the detection of chilling injury in cucumbers from visible/near-infrared hyperspectral imaging. Appl. Spectrosc. 2005, 59, 78–85. [Google Scholar] [CrossRef] [PubMed]
  36. Qiao, J.; Ngadi, M.O.; Wang, N.; Gariepy, C.; Prasher, S.O. Pork quality and marbling level assessment using a hyperspectral imaging system. J. Food Eng. 2007, 83, 10–16. [Google Scholar] [CrossRef]
  37. ElMasry, G.; Wold, J.P. High-speed assessment of fat and water content distribution in fish fillets using online imaging spectroscopy. J. Agric. Food Chem. 2008, 56, 7672–7677. [Google Scholar] [CrossRef] [PubMed]
  38. Gowen, A.A.; O’Donnell, C.P.; Taghizadeh, M.; Cullen, P.J.; Frias, J.M.; Downey, G. Hyperspectral imaging combined with principal component analysis for bruise damage detection on white mushrooms (Agaricus bisporus). J. Chemom. 2008, 22, 259–267. [Google Scholar] [CrossRef]
  39. Naganathan, G.K.; Grimes, L.M.; Subbiah, J.; Calkins, C.R.; Samal, A.; Meyer, G.E. Visible/near-infrared hyperspectral imaging for beef tenderness prediction. Comput. Electron. Agric. 2008, 64, 225–233. [Google Scholar] [CrossRef]
  40. Qin, J.; Burks, T.F.; Ritenour, M.A.; Bonn, W.G. Detection of citrus canker using hyperspectral reflectance imaging with spectral information divergence. J. Food Eng. 2009, 93, 183–191. [Google Scholar] [CrossRef]
  41. Yoon, S.C.; Lawrence, K.C.; Siragusa, G.R.; Line, J.E.; Park, B.; Feldner, P.W. Hyperspectral reflectance imaging for detecting a foodborne pathogen: Campylobacter. Trans. ASABE 2009, 52, 651–662. [Google Scholar] [CrossRef]
  42. Zhao, J.; Chen, Q.; Cai, J.; Ouyang, Q. Automated tea quality classification by hyperspectral imaging. Appl. Opt. 2009, 48, 3557–3564. [Google Scholar] [CrossRef] [PubMed]
  43. Delwiche, S.R.; Kim, M.S.; Dong, Y. Fusarium damage assessment in wheat kernels by Vis/NIR hyperspectral imaging. Sens. Instrum. Food Qual. Saf. 2011, 5, 63–71. [Google Scholar] [CrossRef]
  44. Nguyen Do Trong, N.; Tsuta, M.; Nicolaï, B.M.; De Baerdemaeker, J.; Saeys, W. Prediction of optimal cooking time for boiled potatoes by hyperspectral imaging. J. Food Eng. 2011, 105, 617–624. [Google Scholar] [CrossRef]
  45. Baiano, A.; Terracone, C.; Peri, G.; Romaniello, R. Application of hyperspectral imaging for prediction of physico-chemical and sensory characteristics of table grapes. Comput. Electron. Agric. 2012, 87, 142–151. [Google Scholar] [CrossRef]
  46. Rajkumar, P.; Wang, N.; EImasry, G.; Raghavan, G.S.V.; Gariepy, Y. Studies on banana fruit quality and maturity stages using hyperspectral imaging. J. Food Eng. 2012, 108, 194–200. [Google Scholar] [CrossRef]
  47. Fu, X.; Kim, M.S.; Chao, K.; Qin, J.; Lim, J.; Lee, H.; Garrido-Varo, A.; Pérez-Marín, D.; Ying, Y. Detection of melamine in milk powders based on NIR hyperspectral imaging and spectral similarity analyses. J. Food Eng. 2014, 124, 97–104. [Google Scholar] [CrossRef]
  48. Kamruzzaman, M.; Makino, Y.; Oshita, S. Rapid and non-destructive detection of chicken adulteration in minced beef using visible near-infrared hyperspectral imaging and machine learning. J. Food Eng. 2016, 170, 8–15. [Google Scholar] [CrossRef]
  49. Qin, J.; Lu, R. Detection of pits in tart cherries by hyperspectral transmission imaging. Trans. ASAE 2005, 48, 1963–1970. [Google Scholar] [CrossRef]
  50. Coelho, P.A.; Soto, M.E.; Torres, S.N.; Sbarbaro, D.G.; Pezoa, J.E. Hyperspectral transmittance imaging of the shell-free cooked clam Mulinia edulis for parasite detection. J. Food Eng. 2013, 117, 408–416. [Google Scholar] [CrossRef]
  51. Song, D.; Song, L.; Sun, Y.; Hu, P.; Tu, K.; Pan, L.; Yang, H.; Huang, M. Black heart detection in white radish by hyperspectral transmittance imaging combined with chemometric analysis and a successive projections algorithm. Appl. Sci. 2016, 6, 249. [Google Scholar] [CrossRef]
  52. Kim, I.; Kim, M.S.; Chen, Y.; Kong, S.G. Detection of skin tumors on chicken carcasses using hyperspectral fluorescence imaging. Trans. ASAE 2004, 47, 1785–1792. [Google Scholar] [CrossRef]
  53. Noh, H.; Lu, R. Hyperspectral laser-induced fluorescence imaging for assessing apple fruit quality. Postharvest Biol. Technol. 2007, 43, 193–201. [Google Scholar] [CrossRef]
  54. Zhu, B.; Jiang, L.; Jin, F.; Qin, L.; Vogel, A.; Tao, Y. Walnut shell and meat differentiation using fluorescence hyperspectral imagery with ICA-kNN optimal wavelength selection. Sens. Instrum. Food Qual. Saf. 2007, 1, 123–131. [Google Scholar] [CrossRef]
  55. Jun, W.; Kim, M.S.; Lee, K.; Millner, P.; Chao, K. Assessment of bacterial biofilm on stainless steel by hyperspectral fluorescence imaging. Sens. Instrum. Food Qual. Saf. 2009, 3, 41–48. [Google Scholar] [CrossRef]
  56. Yao, H.; Hruska, Z.; Kincaid, R.; Brown, R.; Cleveland, T.; Bhatnagar, D. Correlation and classification of single kernel fluorescence hyperspectral data with aflatoxin concentration in corn kernels inoculated with Aspergillus flavus spores. Food Addit. Contam. Part A 2010, 27, 701–709. [Google Scholar] [CrossRef] [PubMed]
  57. Cho, B.; Kim, M.S.; Baek, I.; Kim, D.; Lee, W.; Kim, J.; Bae, H.; Kim, Y. Detection of cuticle defects on cherry tomatoes using hyperspectral fluorescence imagery. Postharvest Biol. Technol. 2013, 76, 40–49. [Google Scholar] [CrossRef]
  58. Mo, C.; Kim, M.S.; Lim, J.; Lee, K.; Kim, G.; Cho, B. Multispectral fluorescence imaging technique for discrimination of cucumber seed viability. Trans. ASABE 2015, 58, 959–968. [Google Scholar]
  59. Mustafic, A.; Jiang, Y.; Li, C. Cotton contamination detection and classification using hyperspectral fluorescence imaging. Text. Res. J. 2016, 86, 1574–1584. [Google Scholar] [CrossRef]
  60. Yoon, S.C.; Lawrence, K.C.; Smith, D.P.; Park, B.; Windham, W.R. Embedded bone fragment detection in chicken fillets using transmittance image enhancement and hyperspectral reflectance imaging. Sens. Instrum. Food Qual. Saf. 2008, 2, 197–207. [Google Scholar] [CrossRef]
  61. Wang, H.; Li, C.; Wang, M. Quantitative determination of onion internal quality using reflectance, interactance, and transmittance modes of hyperspectral imaging. Trans. ASABE 2013, 56, 1623–1635. [Google Scholar]
  62. Leiva-Valenzuela, G.A.; Lu, R.; Aguilera, J.M. Assessment of internal quality of blueberries using hyperspectral transmittance and reflectance images with whole spectra or selected wavelengths. Innov. Food Sci. Emerg. Technol. 2014, 24, 2–13. [Google Scholar] [CrossRef]
  63. Noh, H.; Peng, Y.; Lu, R. Integration of hyperspectral reflectance and fluorescence imaging for assessing apple maturity. Trans. ASAE 2007, 50, 963–971. [Google Scholar] [CrossRef]
  64. Qin, J.; Lu, R. Measurement of the absorption and scattering properties of turbid liquid foods using hyperspectral imaging. Appl. Spectrosc. 2007, 61, 388–396. [Google Scholar] [CrossRef] [PubMed]
  65. Peng, Y.; Zhang, J.; Wang, W.; Li, Y.; Wu, J.; Huang, H.; Gao, X.; Jiang, W. Potential prediction of the microbial spoilage of beef using spatially resolved hyperspectral scattering profiles. J. Food Eng. 2011, 102, 163–169. [Google Scholar] [CrossRef]
Figure 1. Line-scan hyperspectral measurement methods for (a) reflectance and transmittance imaging and (b) spatially resolved spectroscopy.
Applsci 07 00125 g001
Figure 2. Excitation sources for a line-scan hyperspectral Raman system: (a) a 785 nm line laser for Raman imaging measurement; and (b) a 785 nm point laser for spatially offset Raman spectroscopy measurement.
Applsci 07 00125 g002
Figure 3. Wavelength-dispersive imaging spectrographs: (a) prism-grating-prism (PGP) transmission imaging spectrograph; and (b) Offner reflection imaging spectrograph.
Applsci 07 00125 g003
Figure 4. Line-scan hyperspectral imaging systems working in (a) reflectance/fluorescence mode in visible and near-infrared (VNIR) region; and (b) reflectance mode in short-wavelength infrared (SWIR) region. Reproduced with permission from [13], Copyright Springer, 2011.
Applsci 07 00125 g004
Figure 5. Line-scan hyperspectral Raman system working in (a) line-laser Raman chemical imaging mode for surface evaluation; and (b) point-laser spatially offset Raman spectroscopy mode for subsurface evaluation. Reproduced with permission from [14], Copyright Elsevier, 2017.
Applsci 07 00125 g005
Figure 6. Spatial calibrations for a line-scan hyperspectral imaging system under settings of (a) high spatial resolution; and (b) large field of view.
Applsci 07 00125 g006
Figure 7. Line-scan hyperspectral reflectance imaging measurements of Golden Delicious apples: (a) reflectance images in the visible and near-infrared region for fruit surface inspection, reproduced with permission from [13]; Copyright Springer, 2011; and (b) scattering image for fruit internal quality evaluation based on absorption and scattering properties determined by spatially resolved diffuse reflectance.
Applsci 07 00125 g007
Figure 8. Line-scan hyperspectral Raman imaging measurement of a carrot slice: (a) color image; (b) original; and (c) fluorescence-corrected Raman images at 1513 cm−1; (d) carotenoid color map image based on pixel intensities of the 1513 cm−1 corrected image; and (e) original; and (f) fluorescence-corrected Raman spectra of the major carrot tissues. Reproduced with permission from [14], Copyright Elsevier, 2017.
Applsci 07 00125 g008aApplsci 07 00125 g008b
Figure 9. Line-scan hyperspectral fluorescence imaging for inspecting chicken residues on stainless steel sheets: (a) fluorescence emission spectra of organic residues and stainless steel excited by 400 nm blue LEDs; (b) correlation analysis for selection of two bands; and (c) detection of organic residues using band ratio images with wavelength pair selected by correlation analysis (F503/F666). Reproduced with permission from [18], Copyright ASABE, 2011.
Applsci 07 00125 g009
Figure 10. Line-scan spatially offset Raman spectroscopy for subsurface food inspection: (a) Raman scattering images of plastic sheet, cane sugar, and plastic-on-sugar sample, (b) spatially offset Raman spectra of the plastic-on-sugar sample at selected offset distances, and pure component spectra from self-modeling mixture analysis and reference spectra for (c) plastic sheet on cane sugar and (d) cane sugar under plastic sheet. Reproduced with permission from [21], Copyright Elsevier, 2017.
Applsci 07 00125 g010
Figure 11. Line-scan hyperspectral/multispectral reflectance imaging for online poultry carcass inspection: (a) a photograph of the system on a commercial chicken processing line operating at a speed of 140 birds per minute; and (b) compiled line-scan images of one wholesome chicken and one systemically diseased chicken at selected wavelengths. Reproduced with permission from [32], Copyright ASABE, 2008.
Applsci 07 00125 g011
Table 1. Representative food safety and quality applications using line-scan hyperspectral imaging.
TechniqueProductApplicationWavelengthReference
Reflectance imagingAppleFeces detection450–851 nm[33]
ChickenFeces and ingesta detection400–900 nm[34]
AppleBruise detection900–1700 nm[24]
CucumberChilling injury detection447–951 nm[35]
PorkQuality evaluation430–1000 nm[36]
ChickenWholesomeness inspection430–750 nm[32]
FishMoisture and fat evaluation460–1040 nm[37]
MushroomBruise detection400–1000 nm[38]
BeefTenderness evaluation400–1000 nm[39]
CitrusCanker disease detection450–930 nm[40]
PathogenCampylobacter detection400–900 nm[41]
TeaQuality classification408–1117 nm[42]
Wheat kernelFusarium damage detection400–1700 nm[43]
PotatoCooking time prediction400–1000 nm[44]
GrapeQuality evaluation400–1000 nm[45]
BananaQuality and maturity evaluation400–1000 nm[46]
Milk powderMelamine detection990–1700 nm[47]
BeefChicken adulterant detection400–1000 nm[48]
Transmittance imagingCherryPit detection450–1000 nm[49]
ClamParasite detection400–1000 nm[50]
SoybeanInsect damage detection400–1000 nm[26]
RadishBlack heart detection400–1000 nm[51]
Pork and salmonFat mapping760–1040 nm[27]
Fluorescence imagingAppleFeces detection425–775 nm[6]
ChickenSkin tumor detection425–710 nm[52]
AppleQuality evaluation500–1040 nm[53]
WalnutShell and meat differentiation425–775 nm[54]
Bacterial biofilmEquipment surface inspection416–700 nm[55]
Corn kernelAflatoxin detection400–600 nm[56]
Chicken residuesEquipment surface inspection500–700 nm[18]
Cherry tomatoCuticle defect detection400–700 nm[57]
Cucumber seedSeed viability identification425–700 nm[58]
CottonForeign matter detection425–700 nm[59]
Reflectance and transmittance imagingCucumberQuality evaluation400–1000 nm[28]
ChickenBone fragment detection364–1024 nm[60]
OnionInternal quality evaluation400–1000 nm[61]
BlueberryInternal quality evaluation400–1000 nm[62]
Reflectance and fluorescence imagingAppleDefect and feces detection400–1000 nm[31]
AppleMaturity and quality evaluation500–1000 nm[63]
Corn kernelAflatoxin detection400–878 nm[29]
Raman imagingFood powdersAdulterant detection102–2865 cm−1[25]
CarrotCarotenoid mapping102–2865 cm−1[14]
Spatially resolved spectroscopyPeachFirmness evaluation500–1000 nm[30]
MilkFat content evaluation530–900 nm[64]
AppleInternal quality evaluation500–1000 nm[15]
BeefMicrobial spoilage detection400–1100 nm[65]
SugarThrough-package detection102–2865 cm−1[21]

