
Design of Cold-Formed Steel Screw Connections with Gypsum Sheathing at Ambient and Elevated Temperatures

Abstract
:1. Introduction
2. Test Program
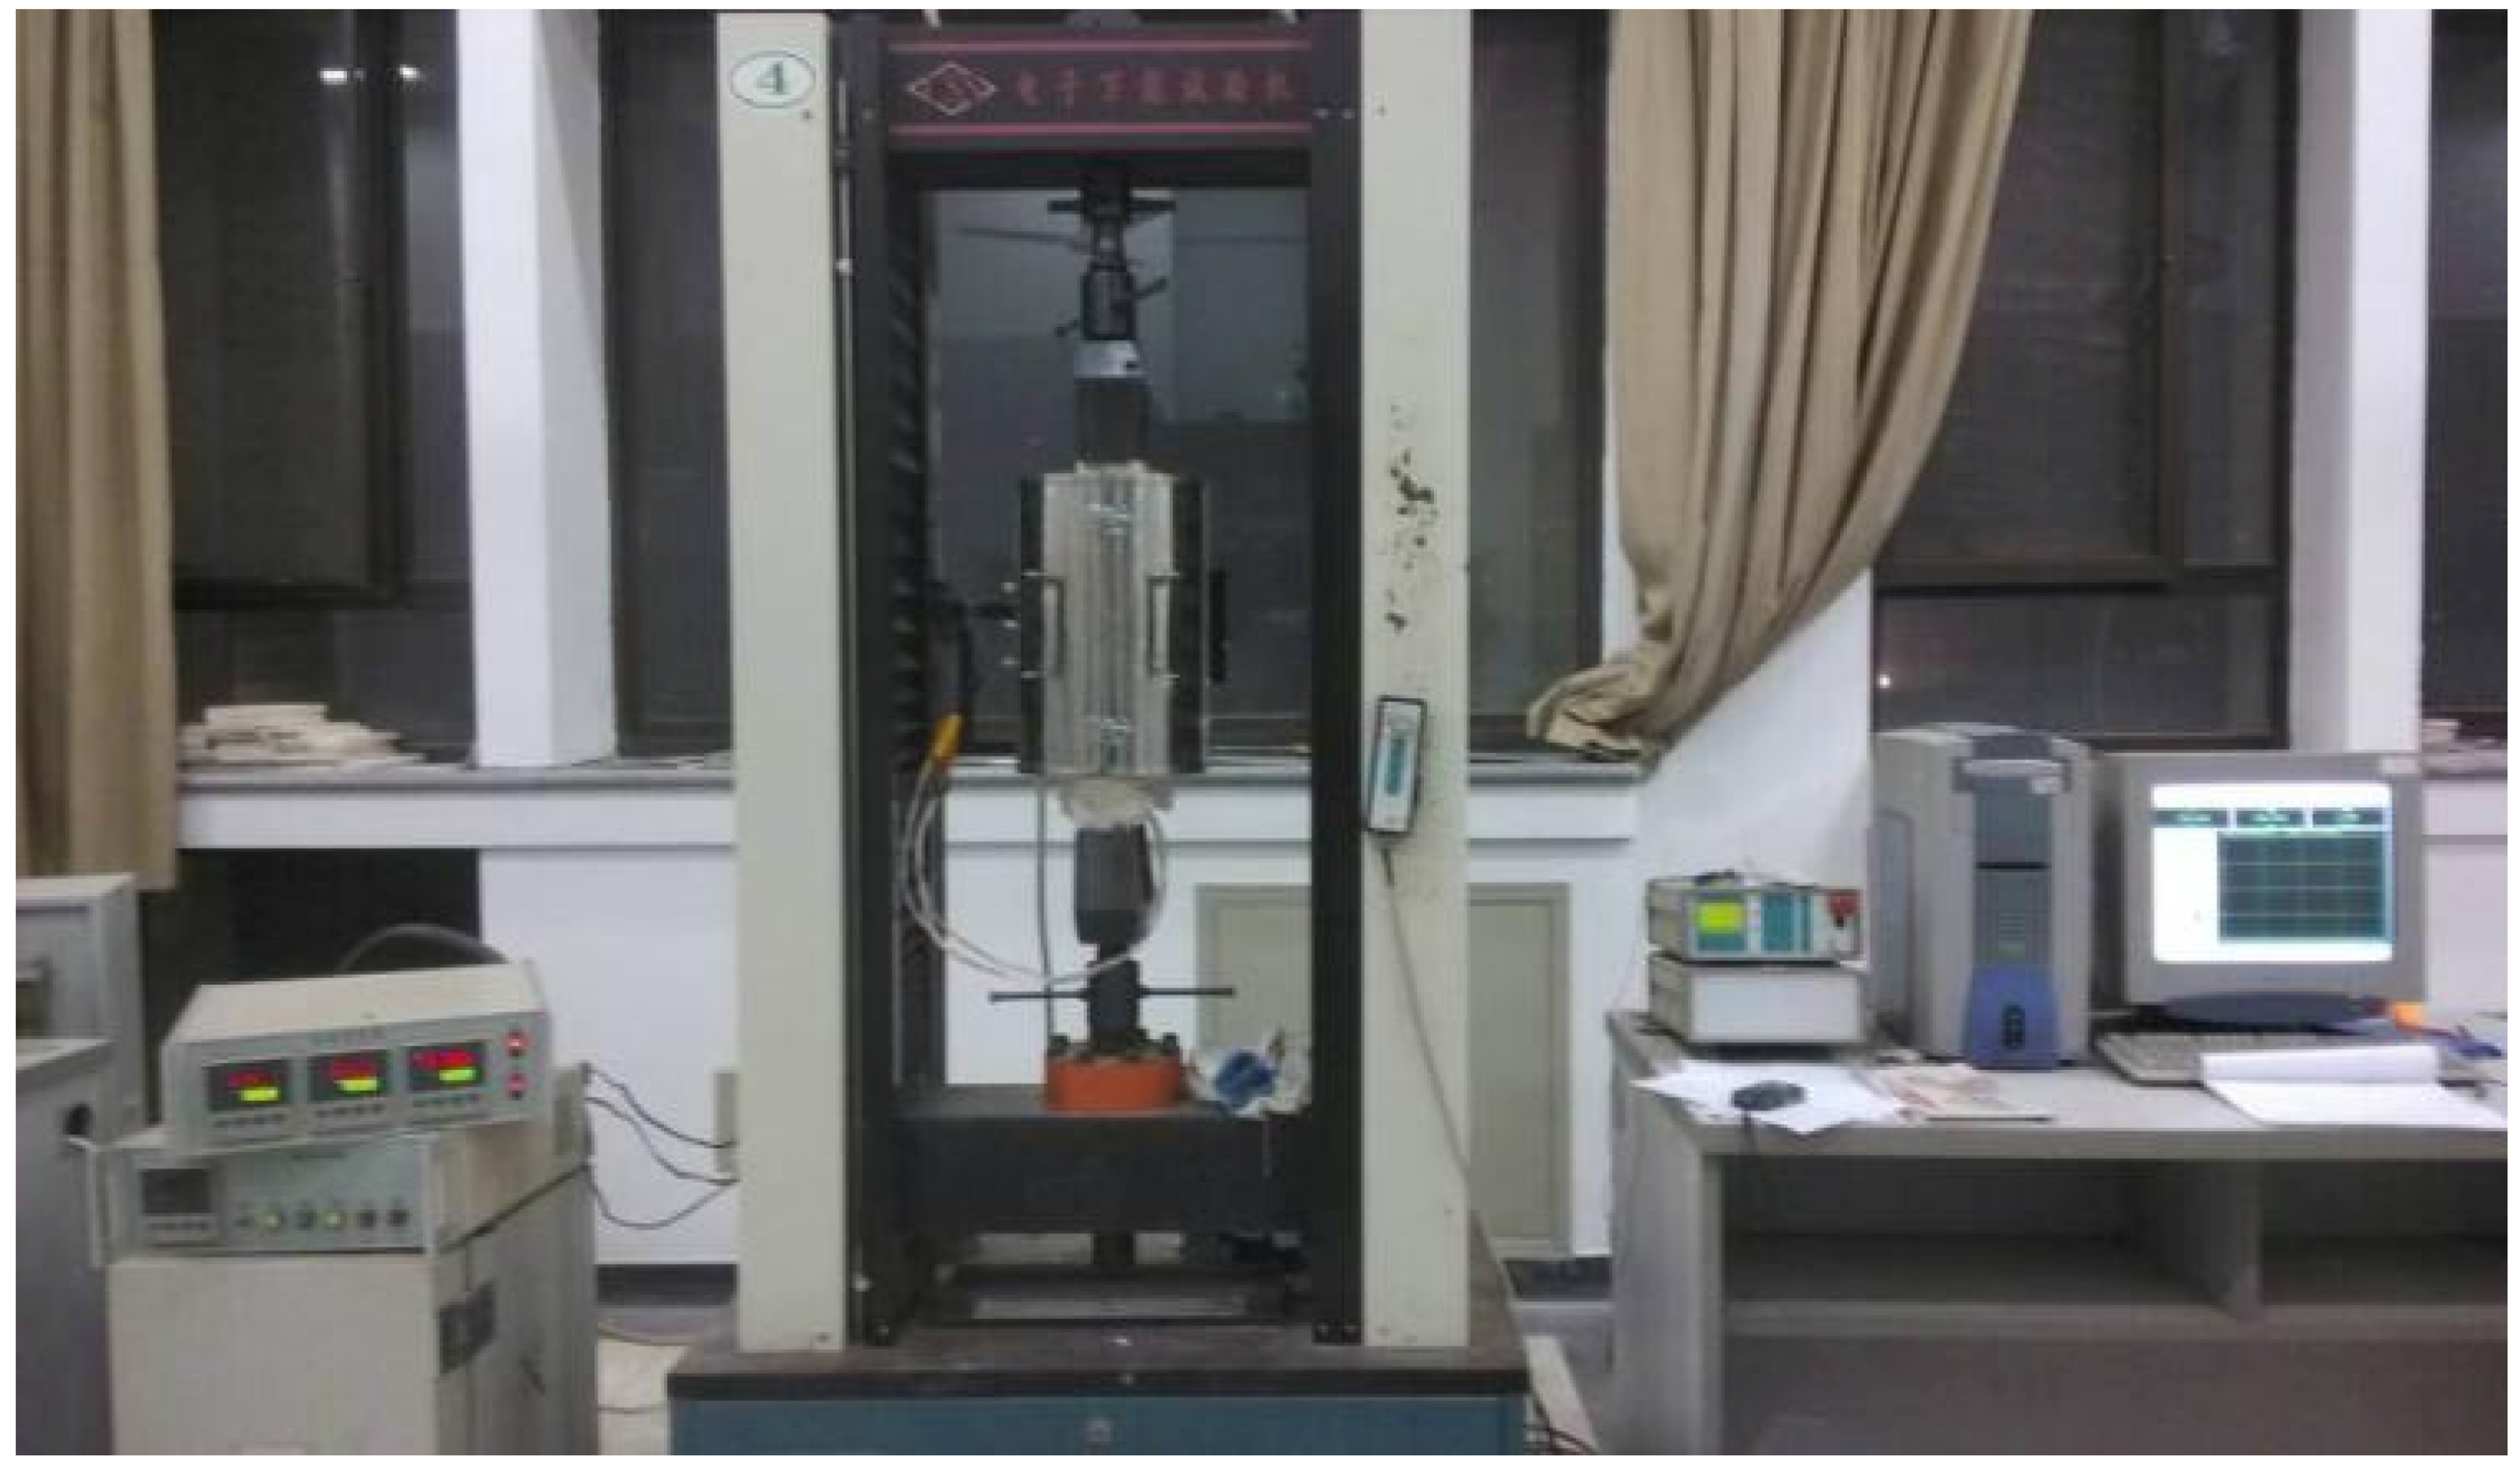
2.1. Test Device
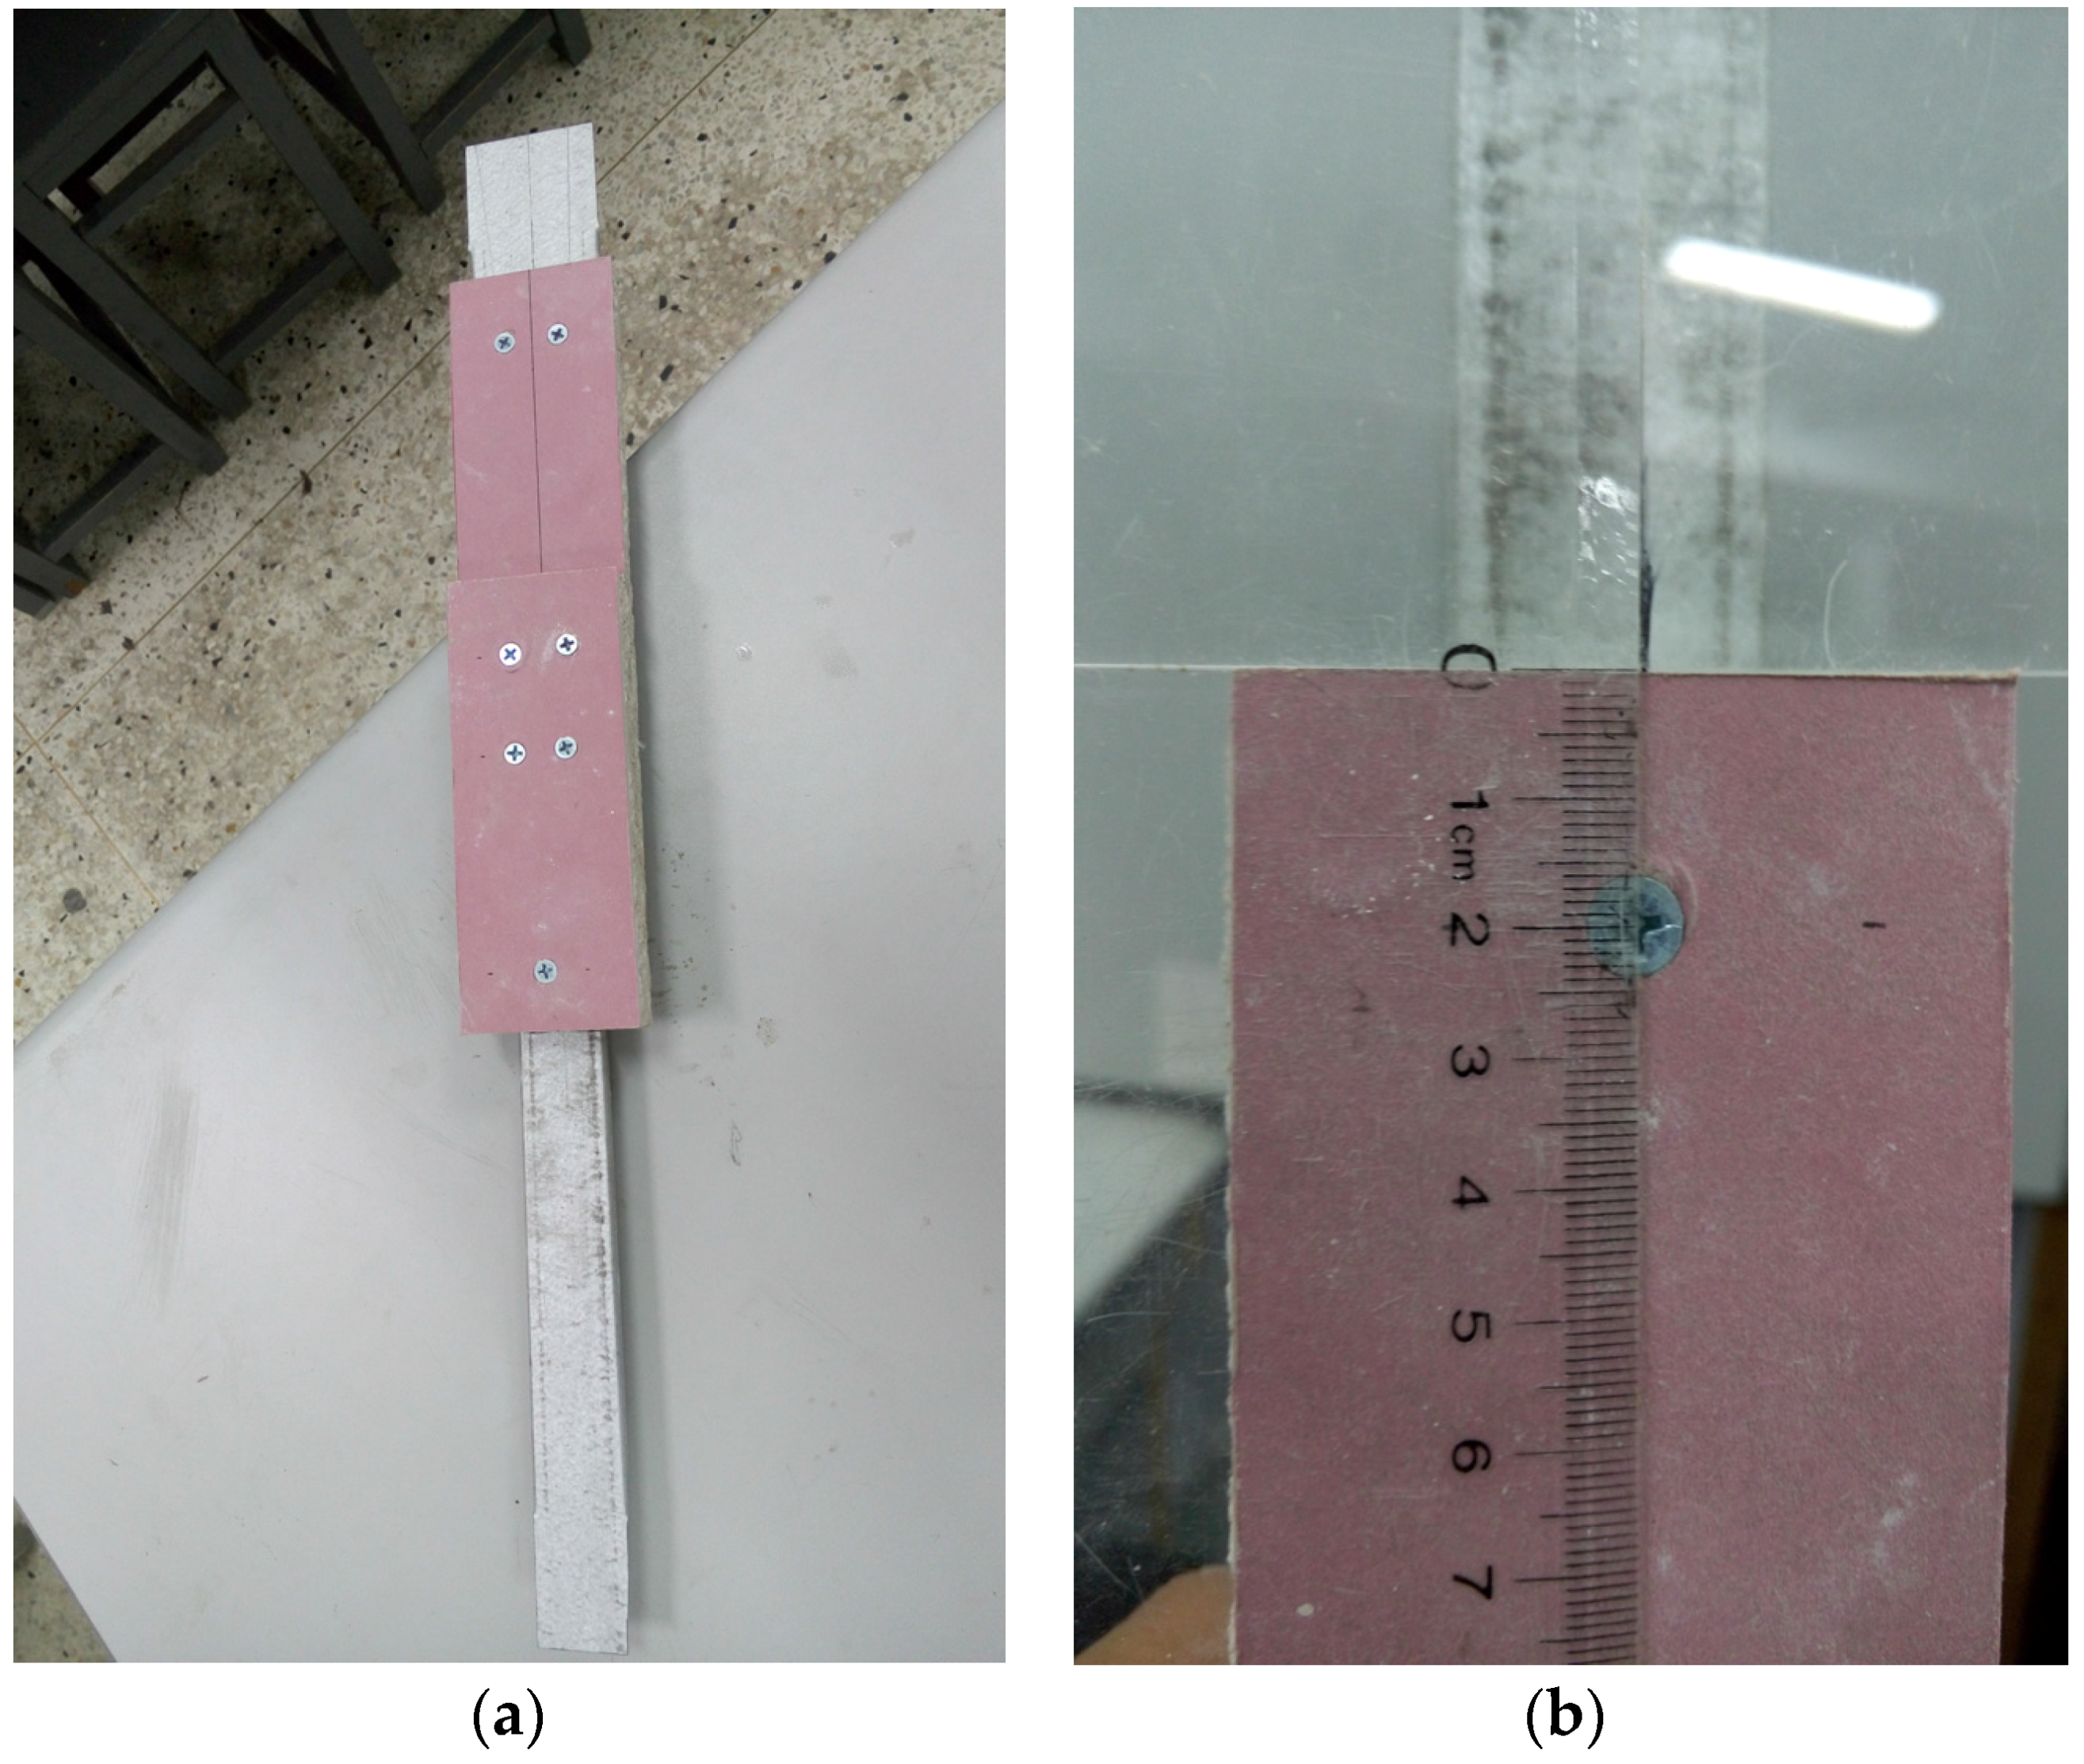
2.2. Specimen Design and Assembly
2.3. Test Procedure
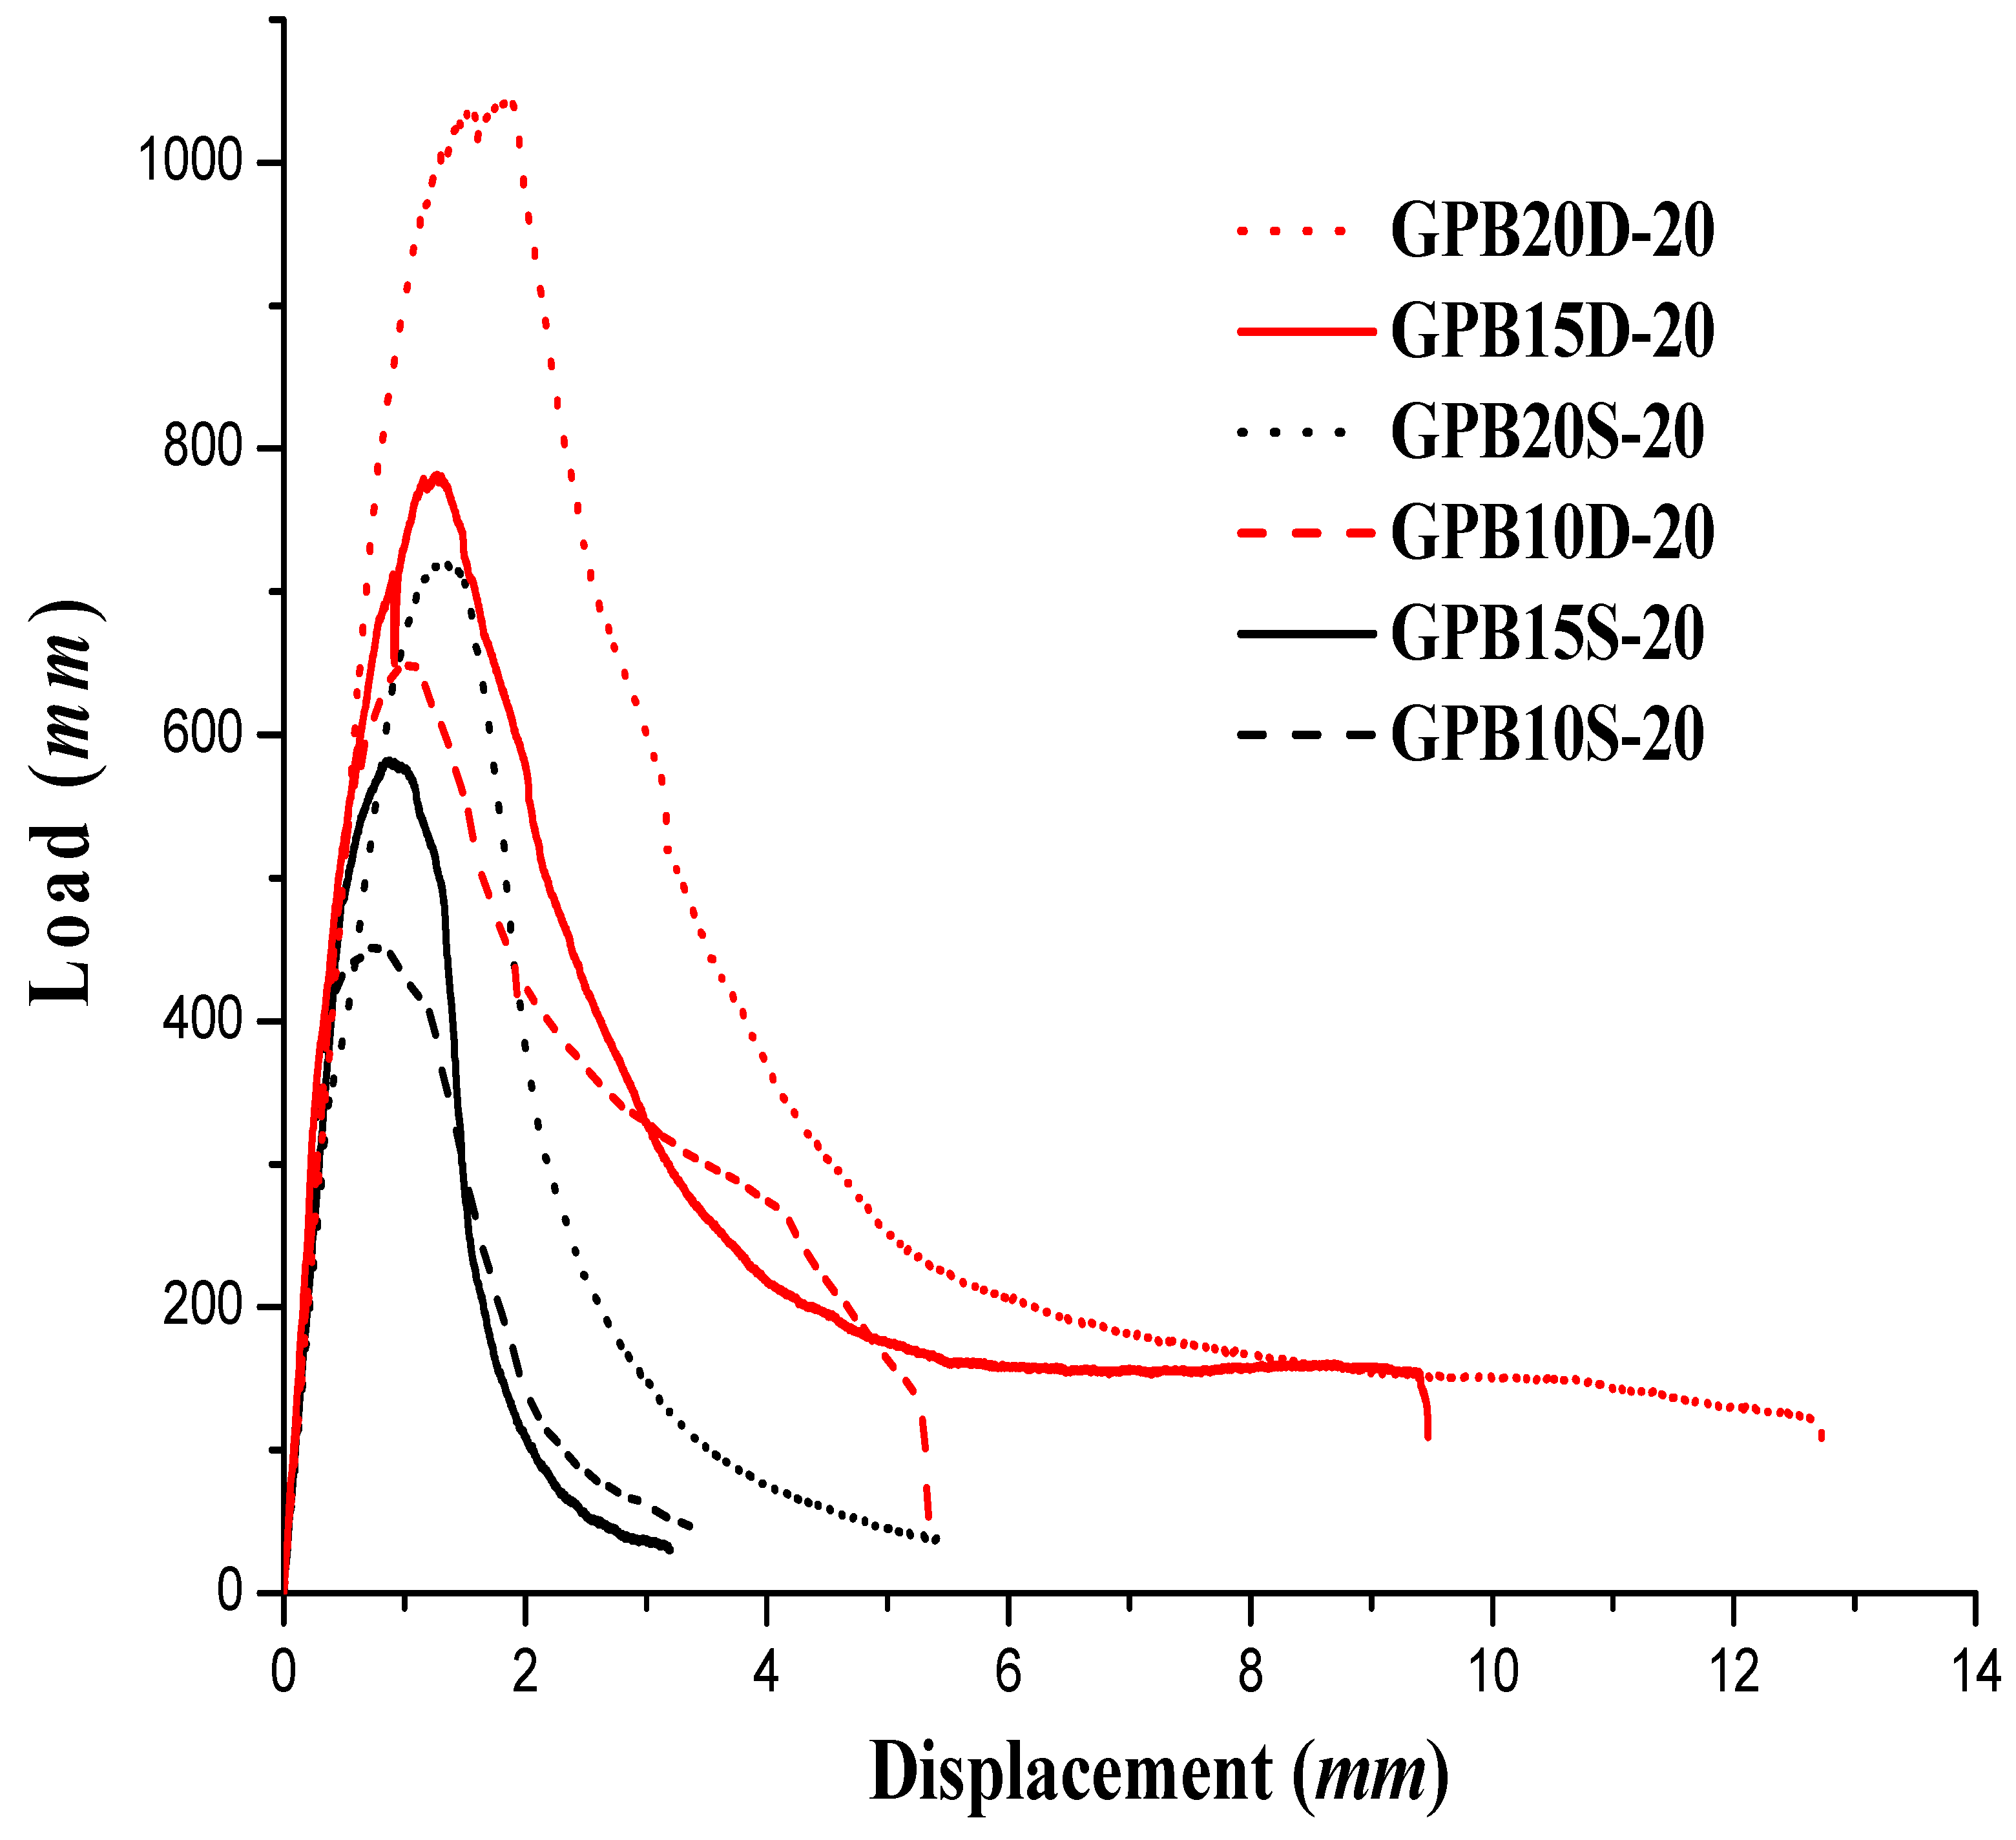
3. Test Results
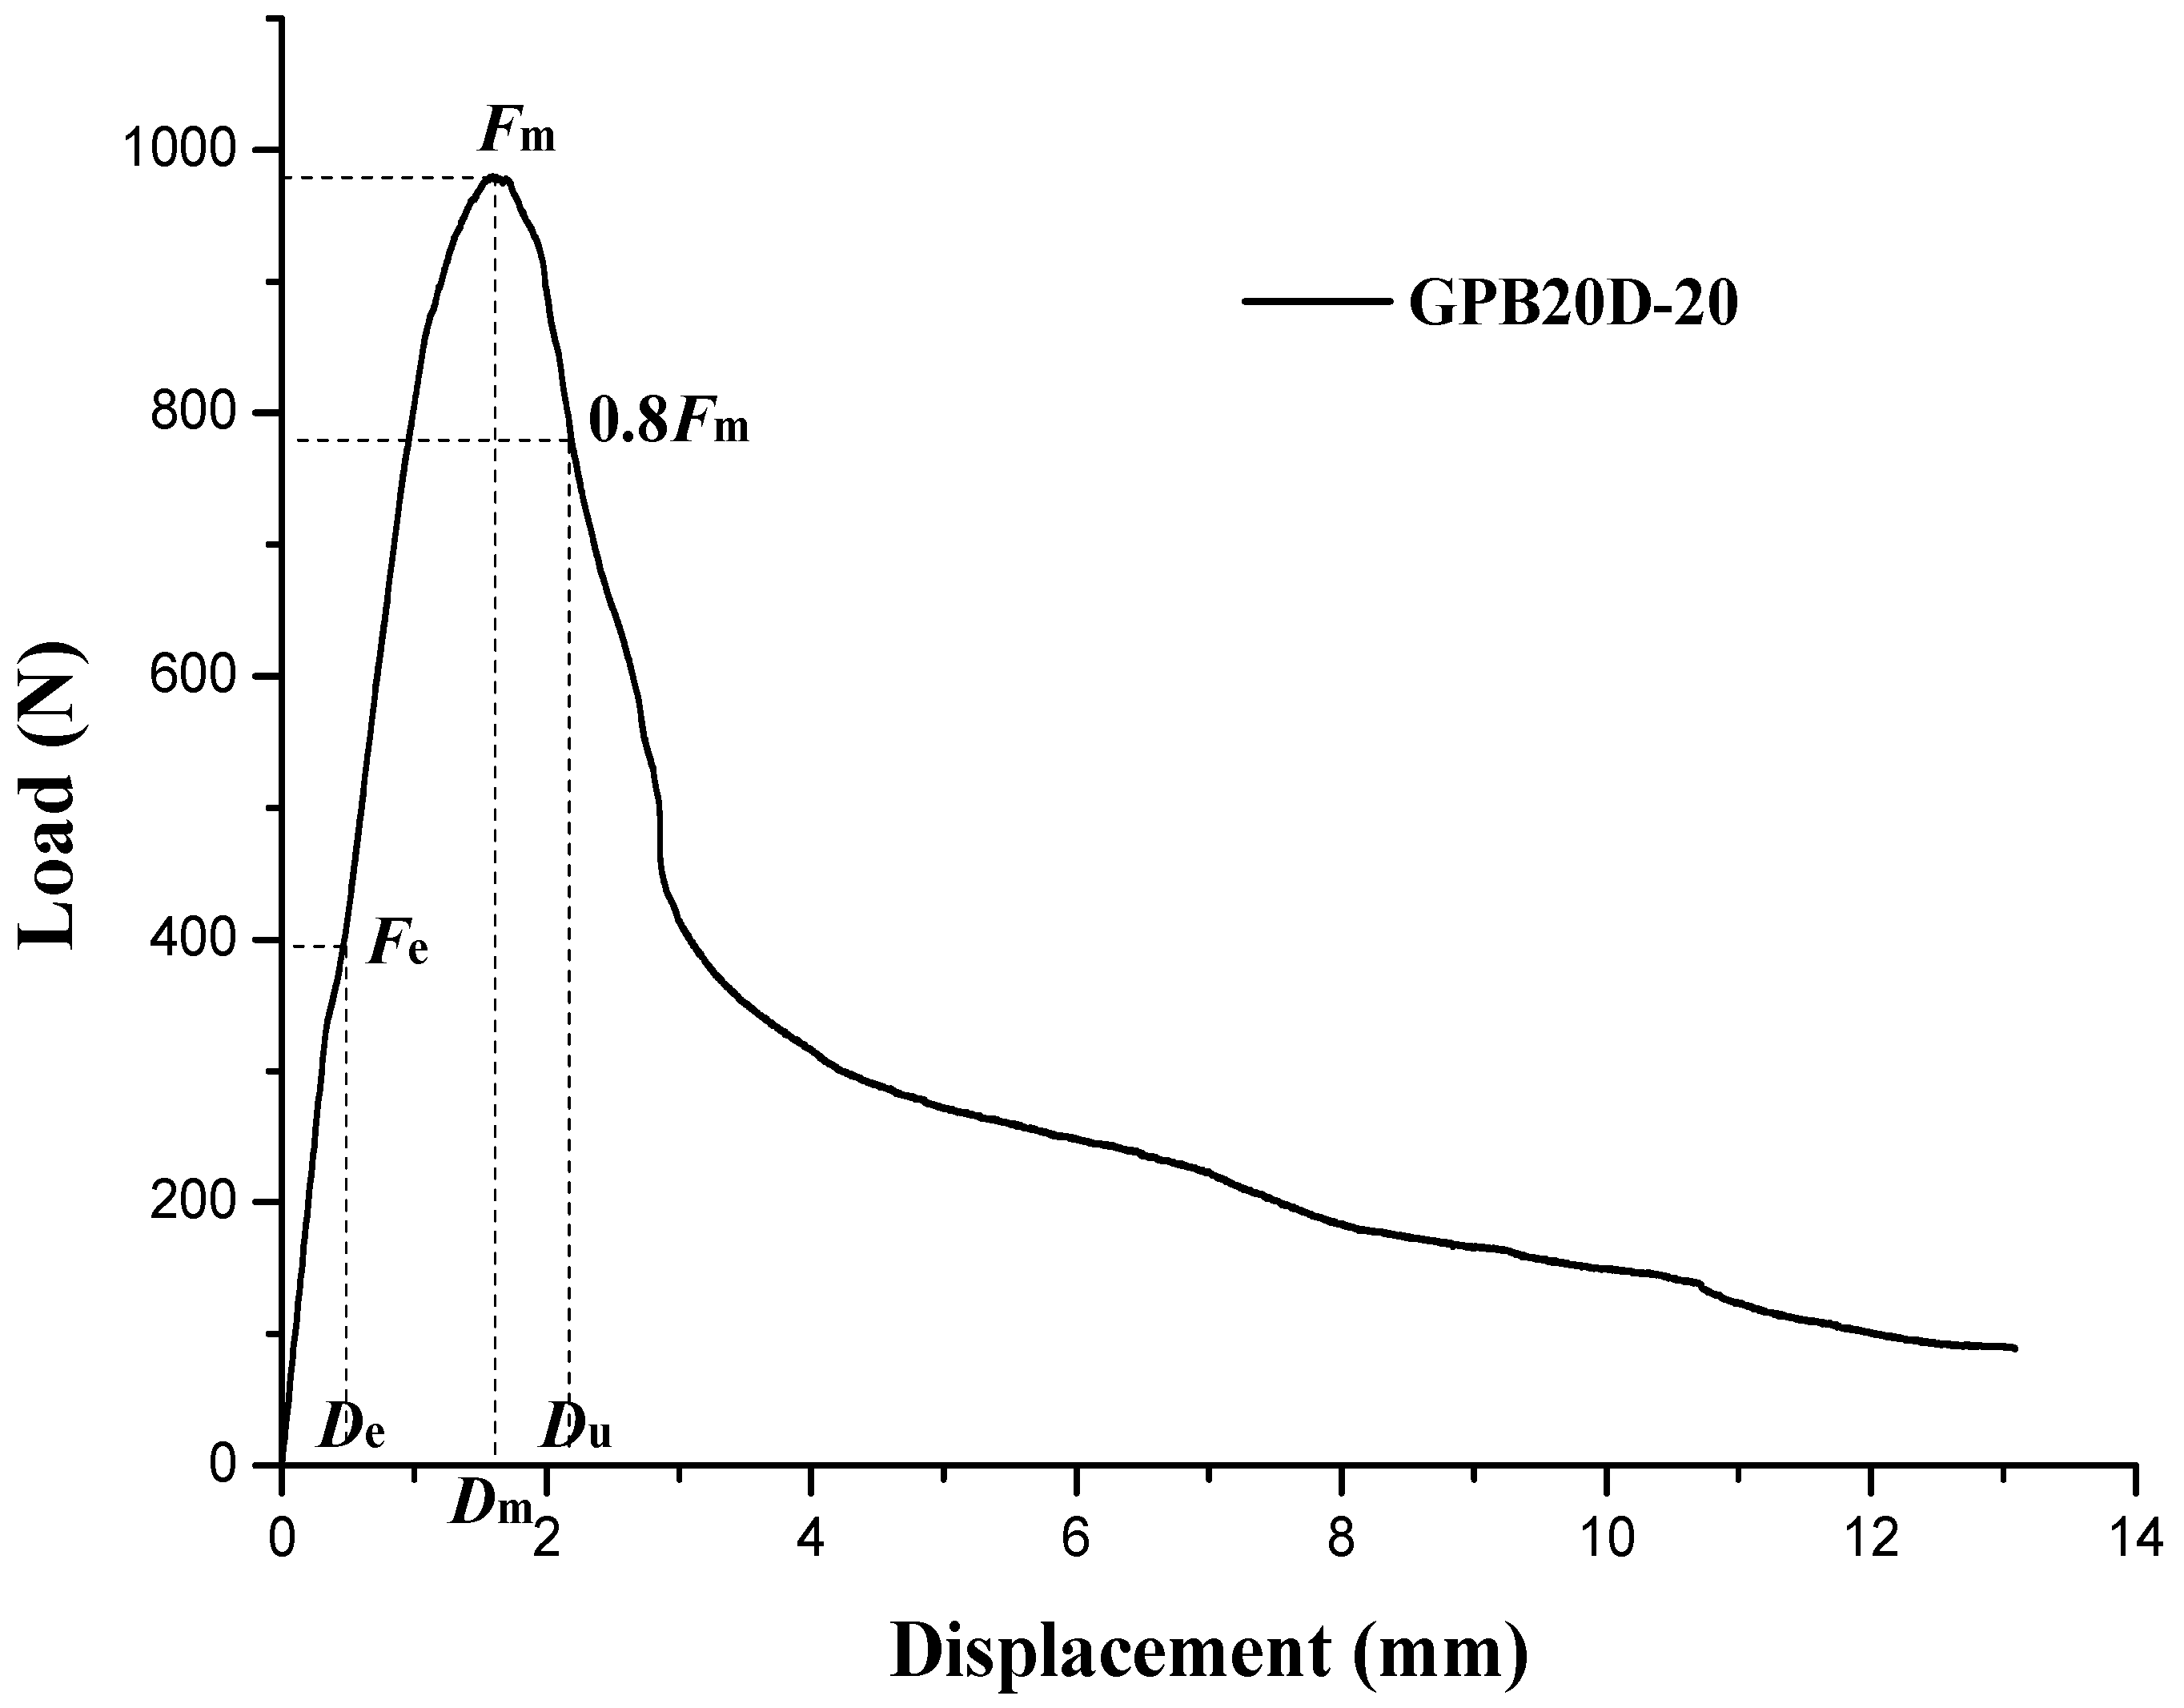
3.1. General
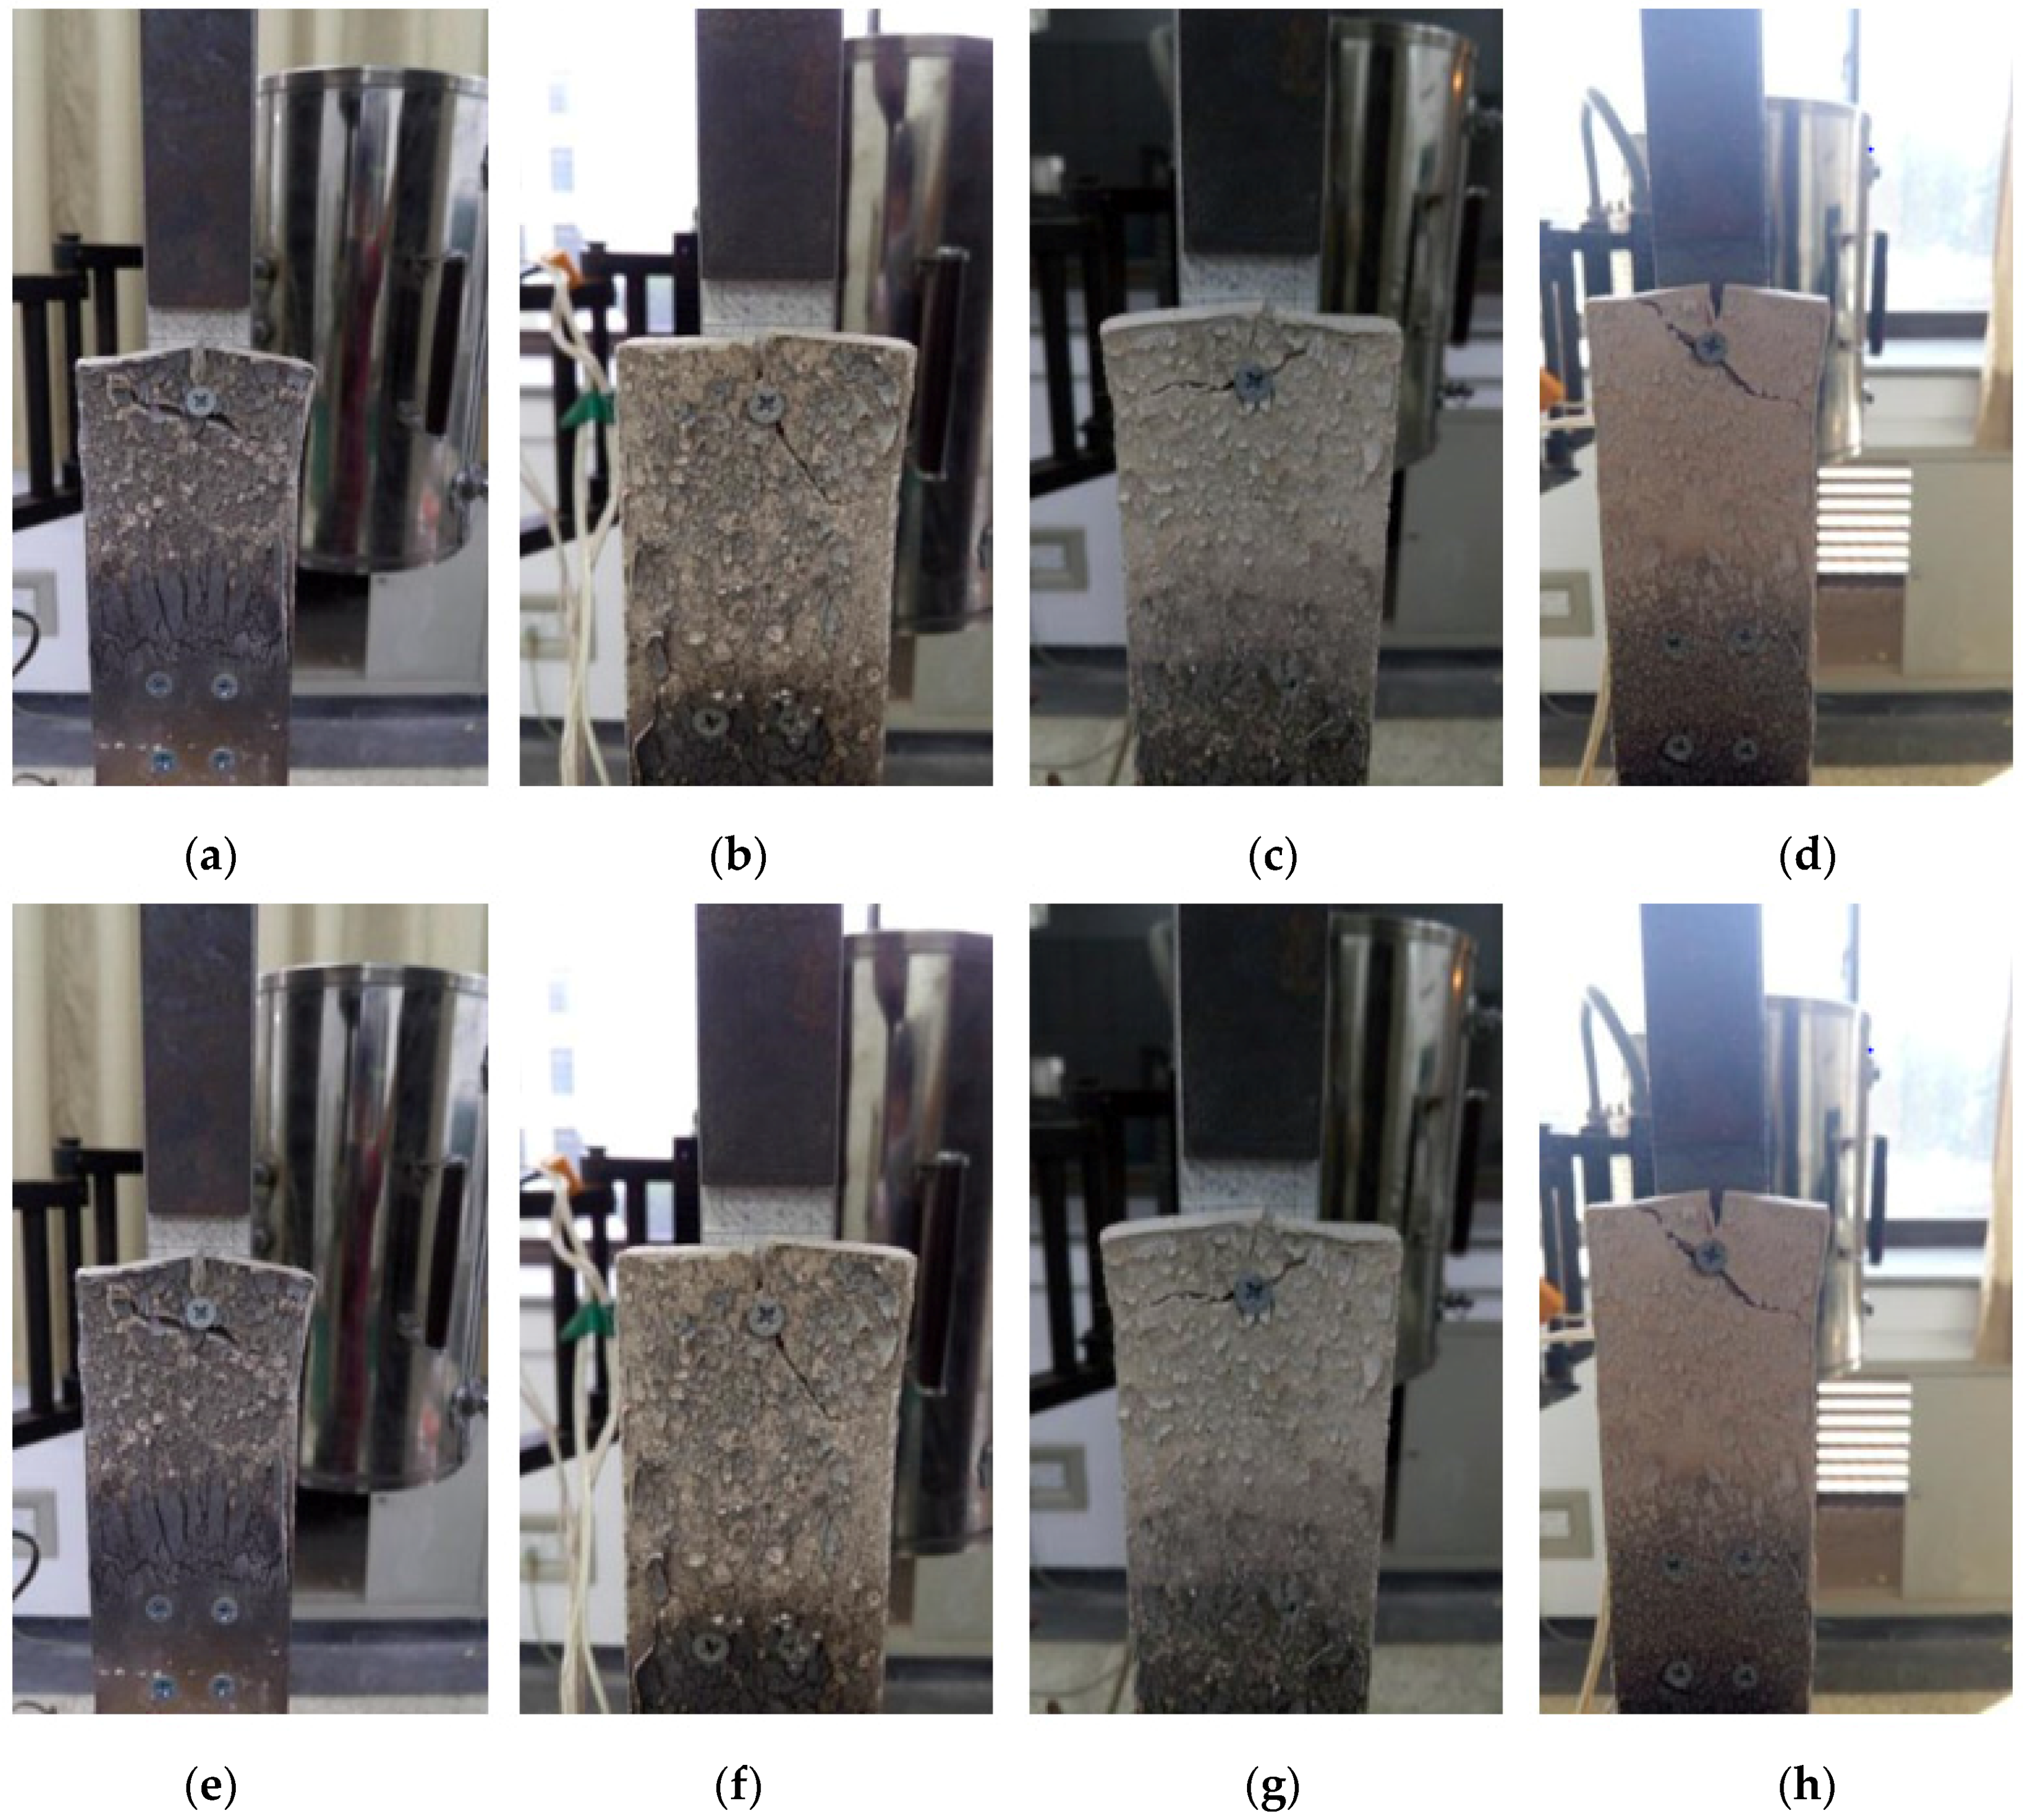
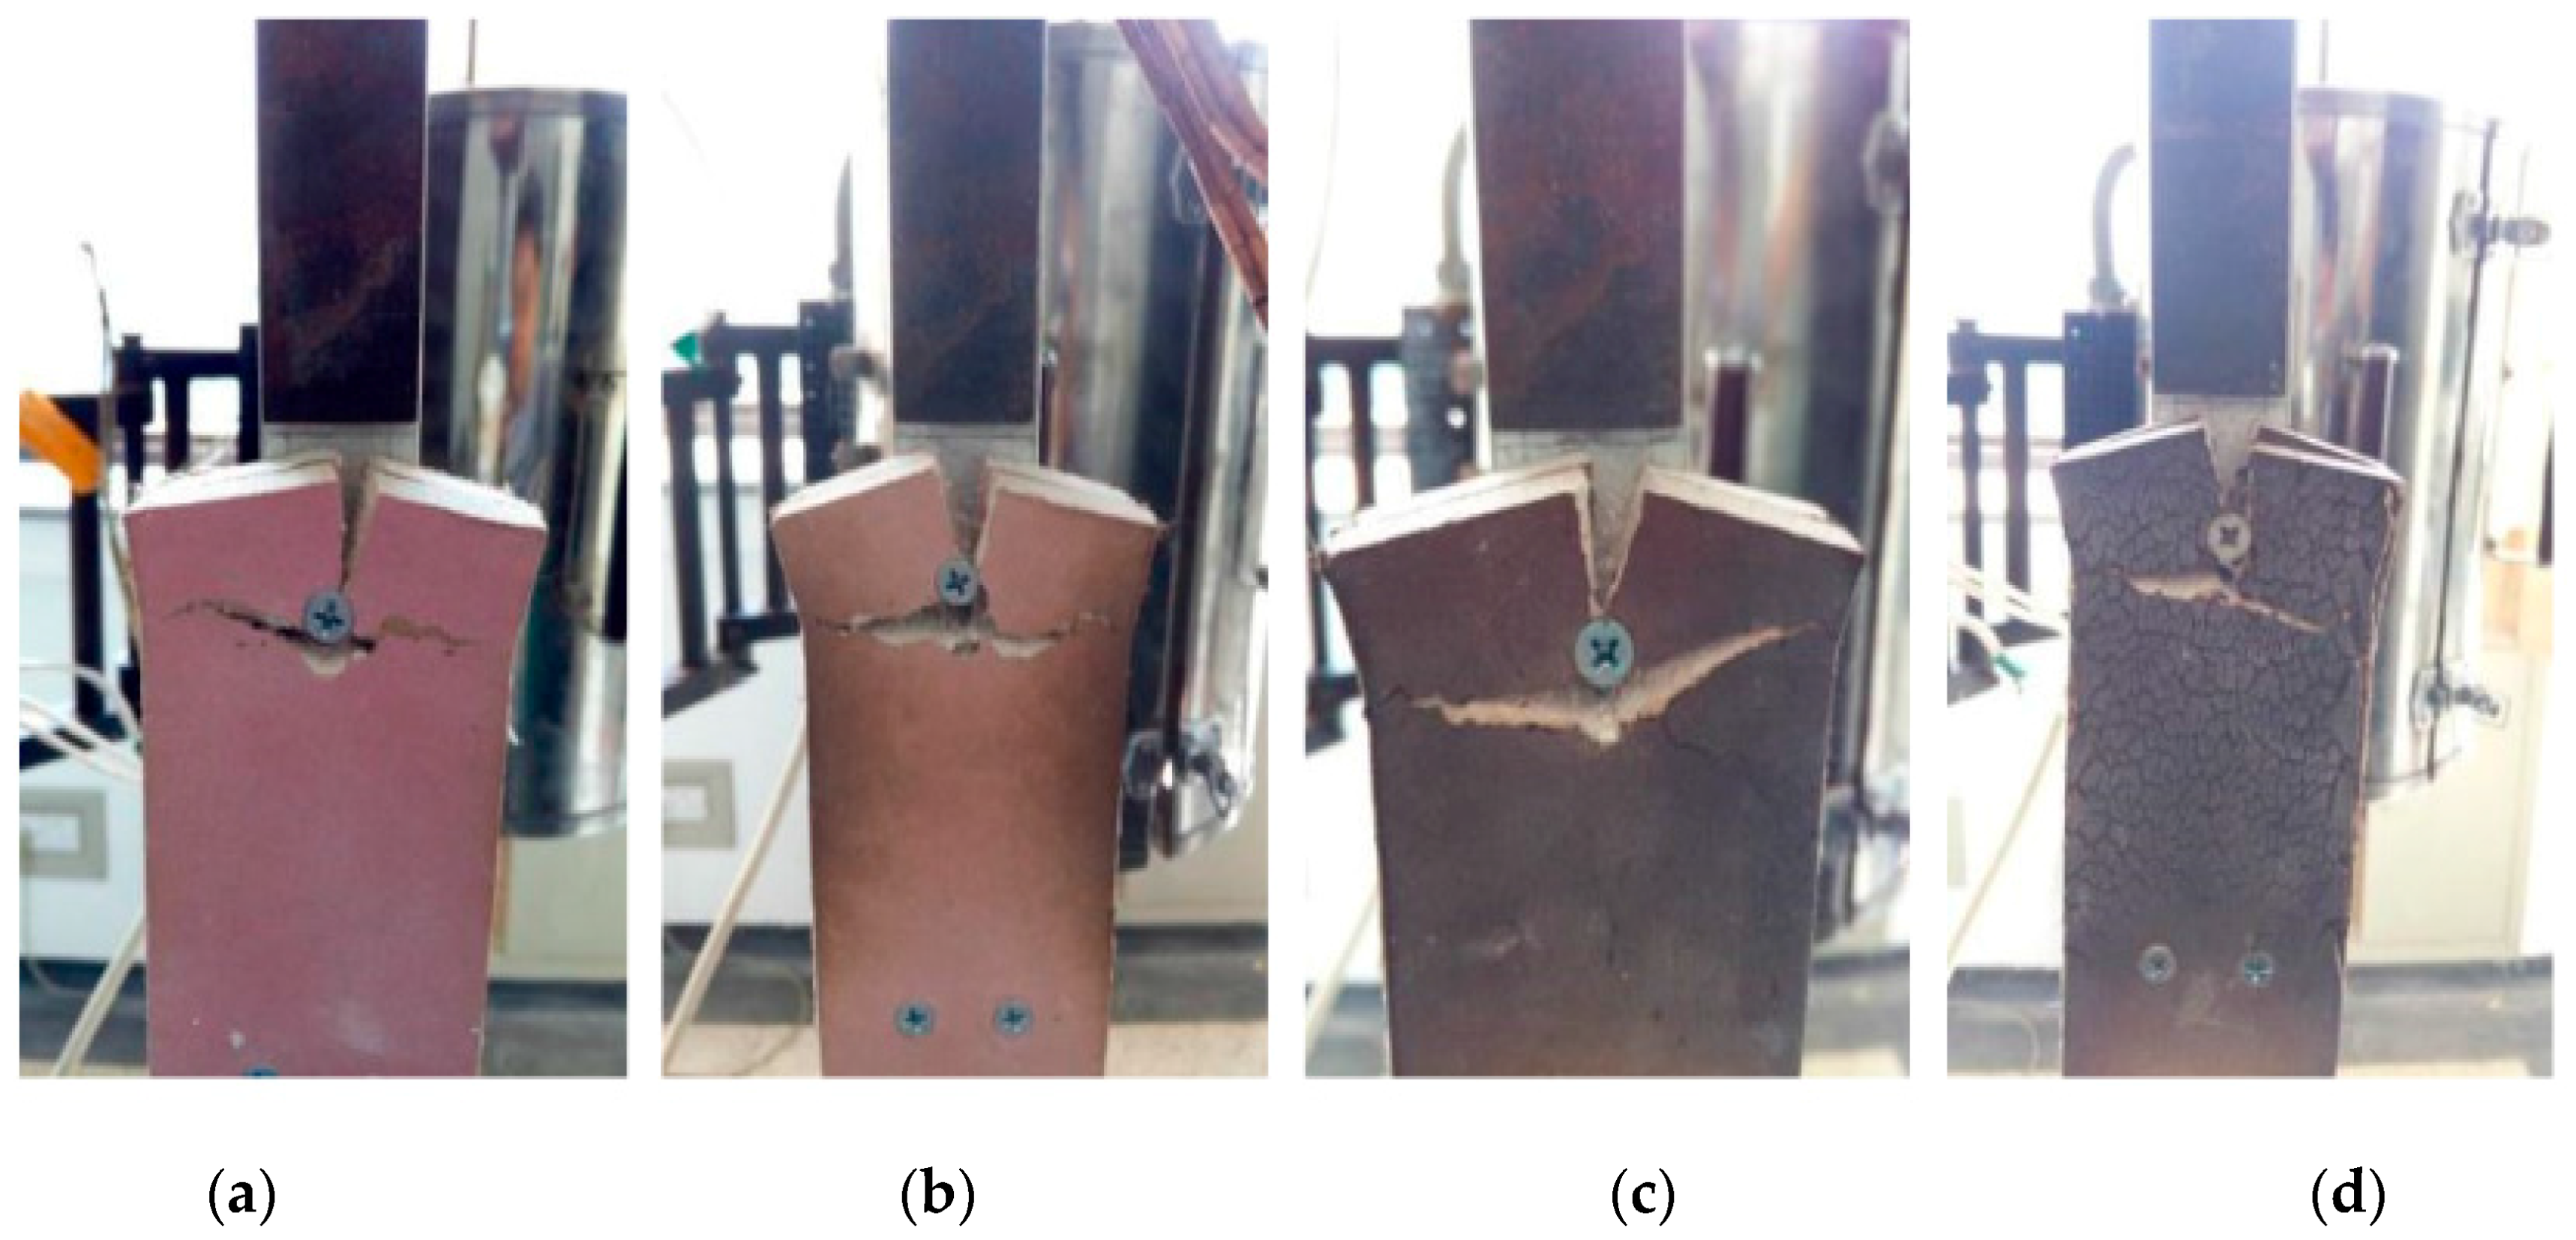
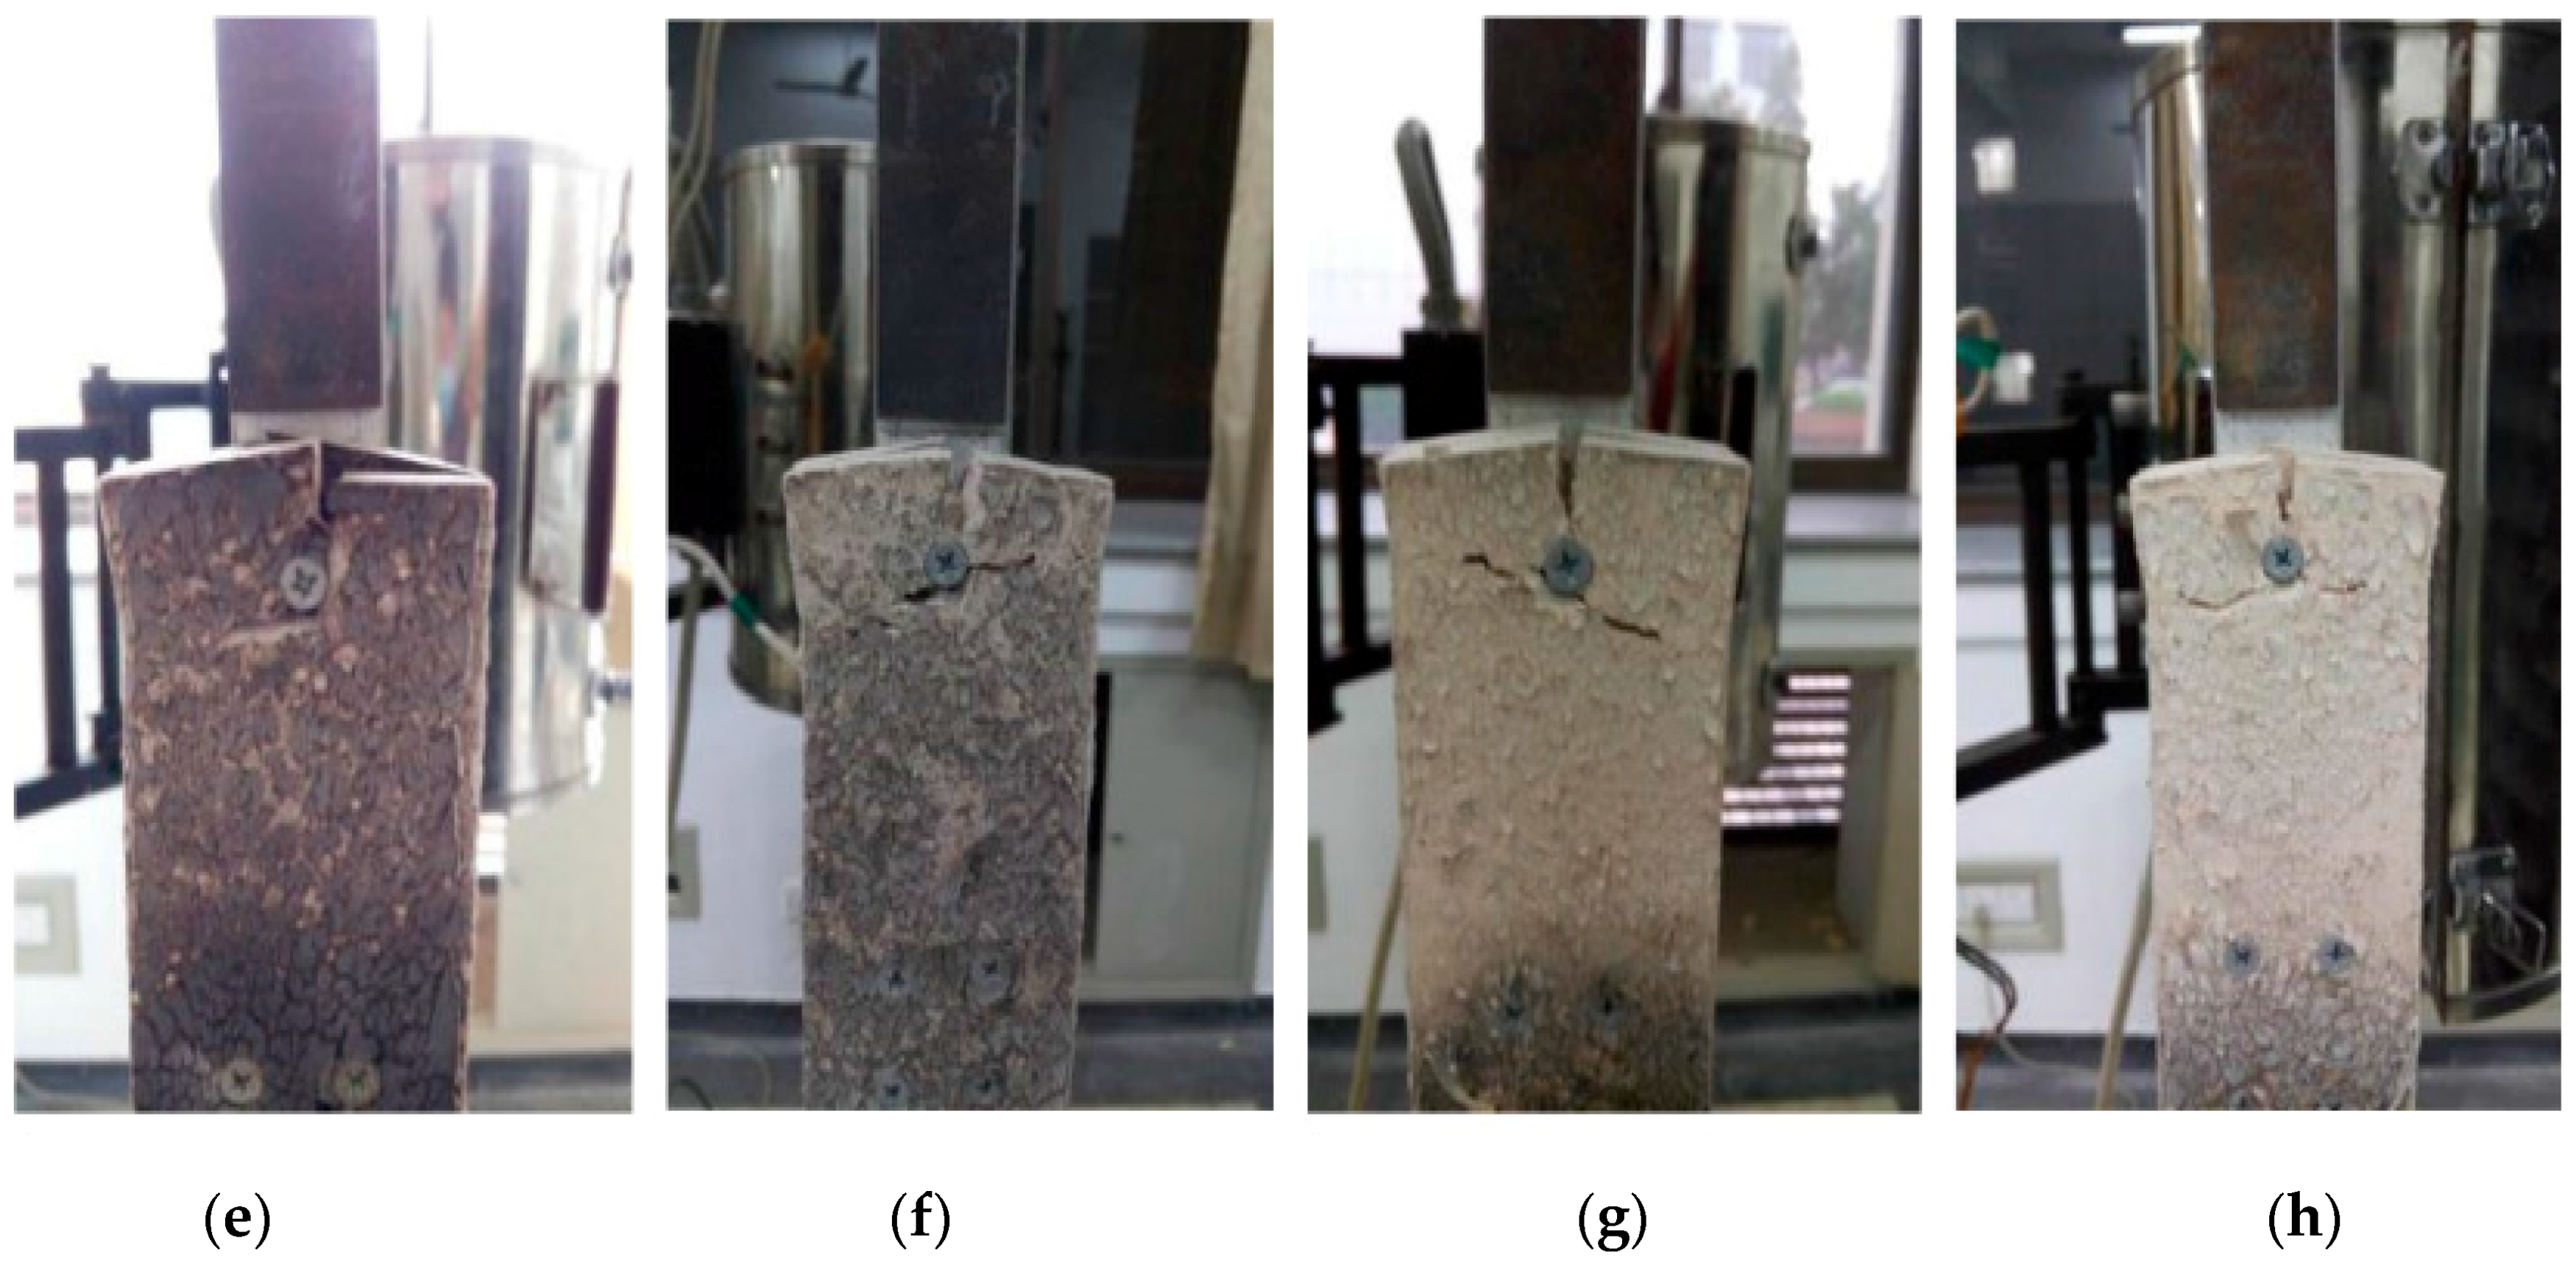
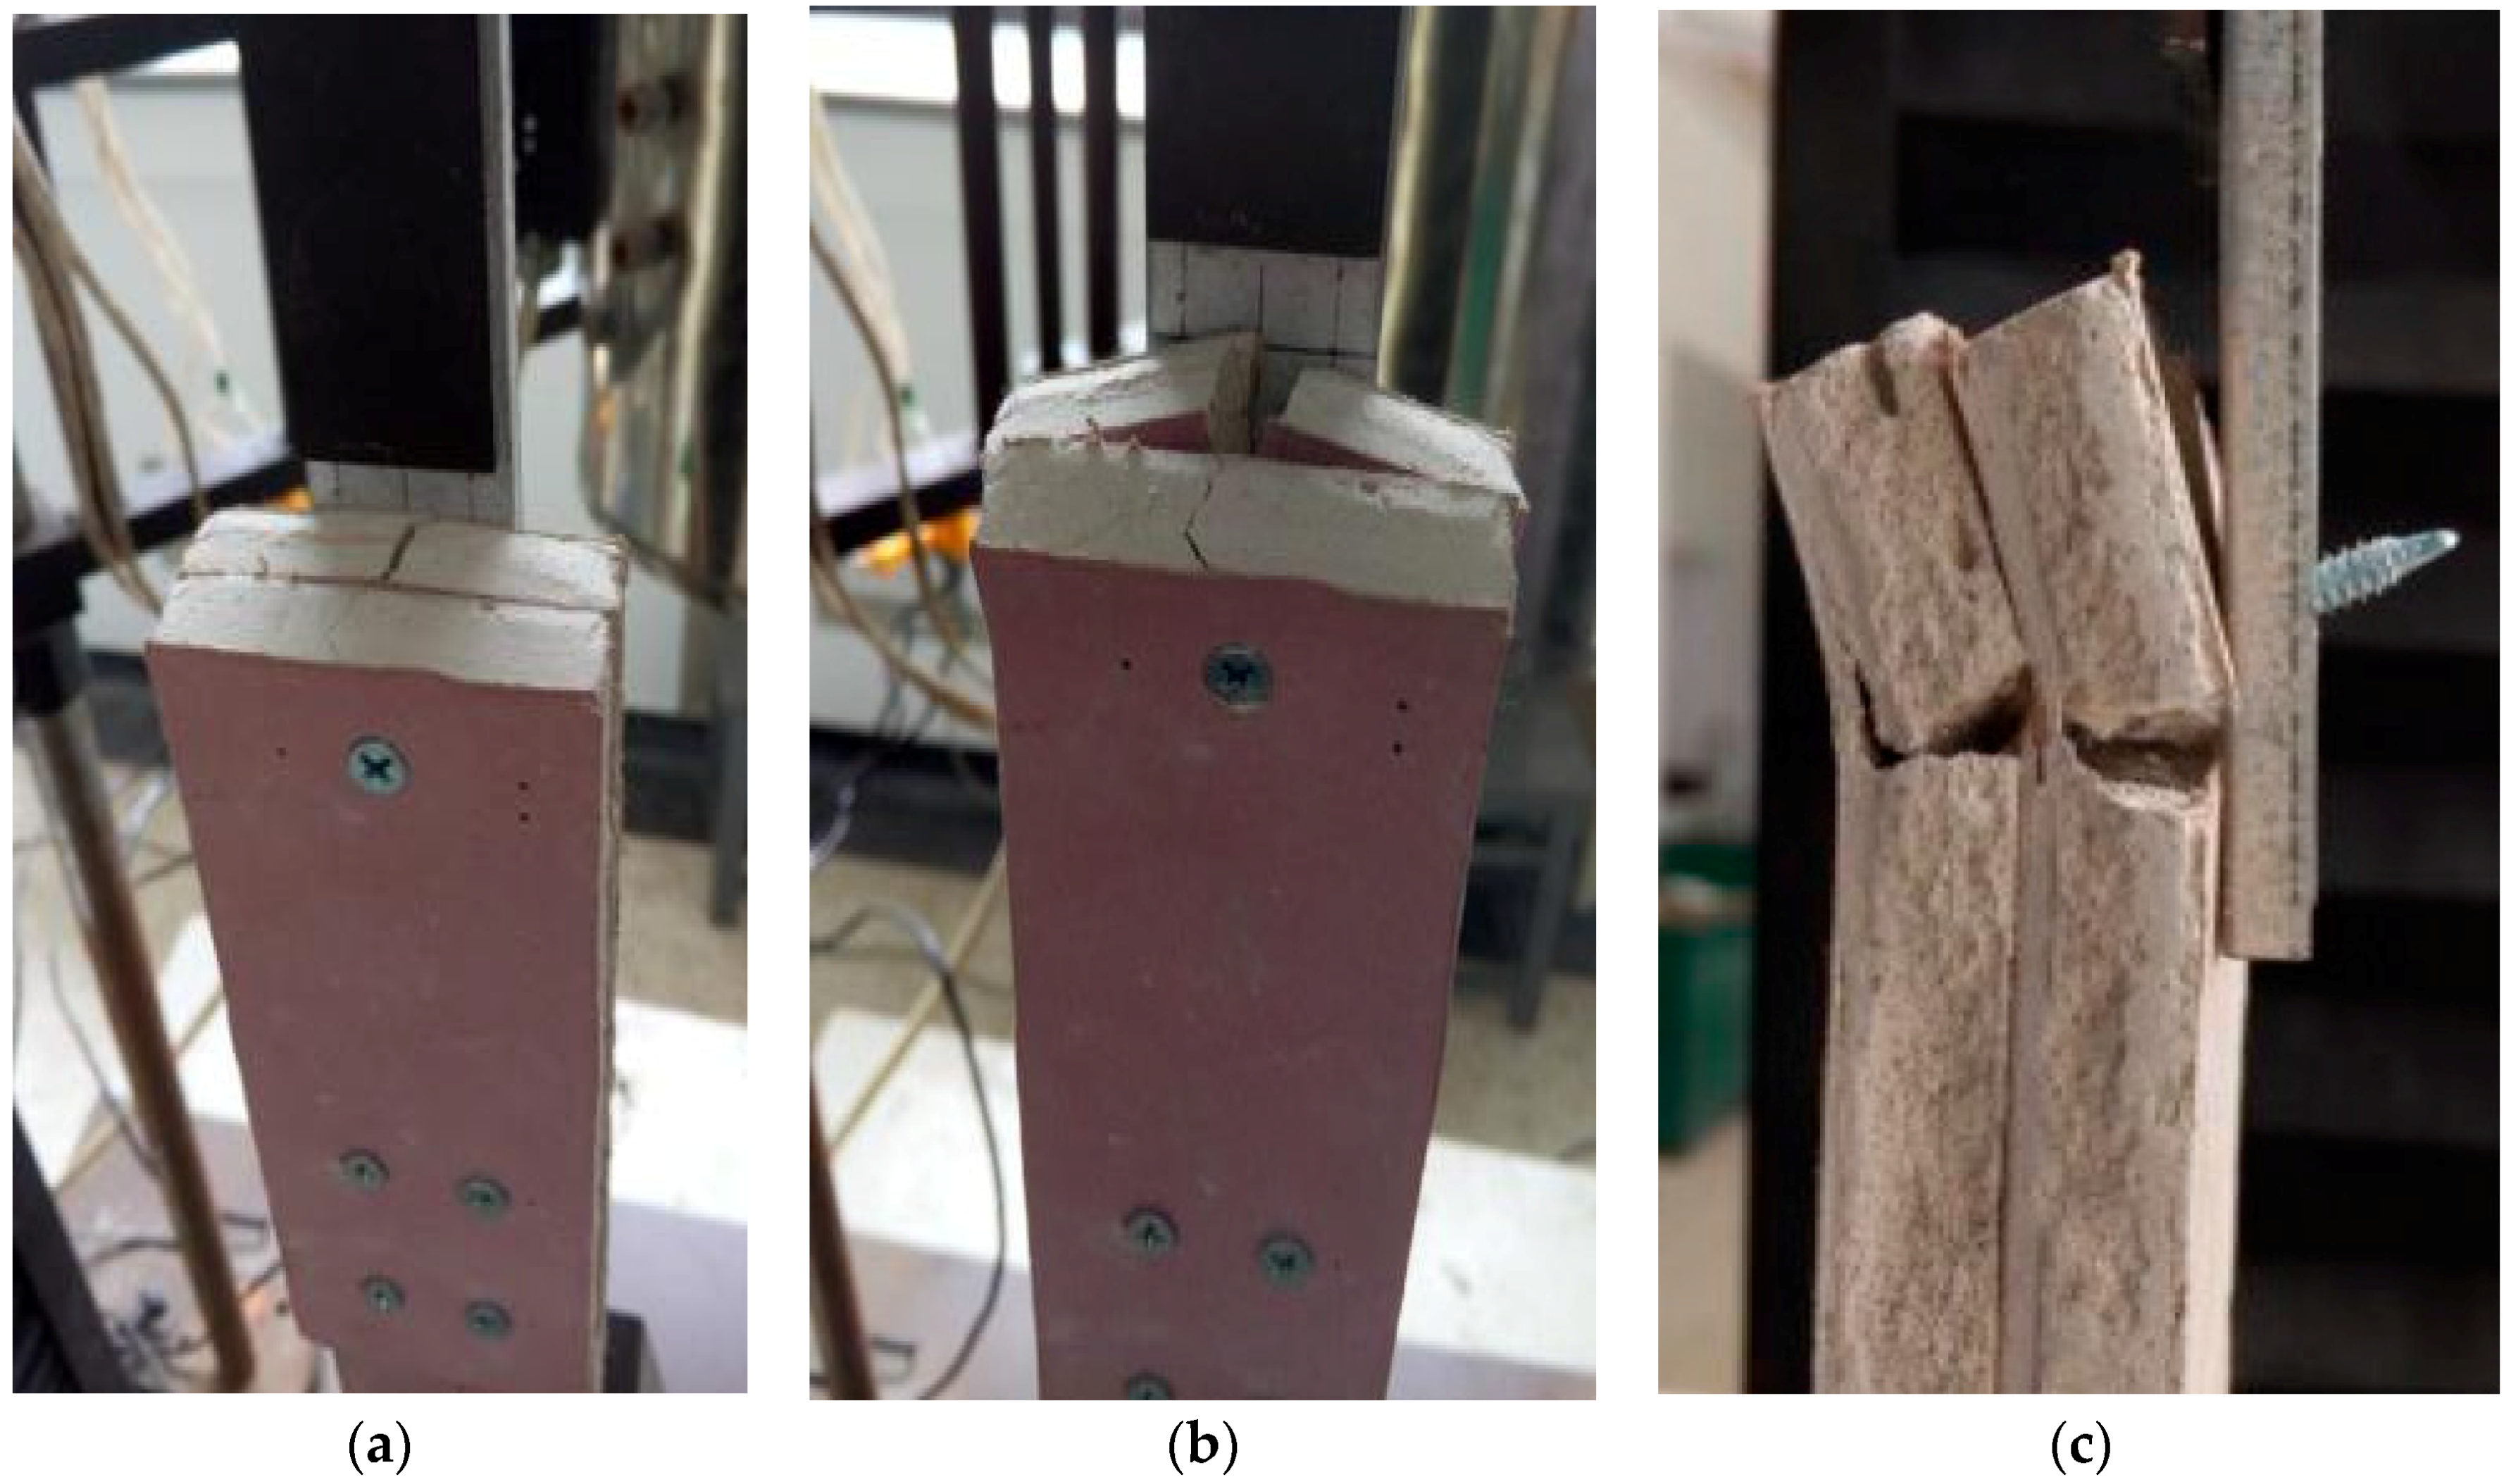
3.2. Visual Observation
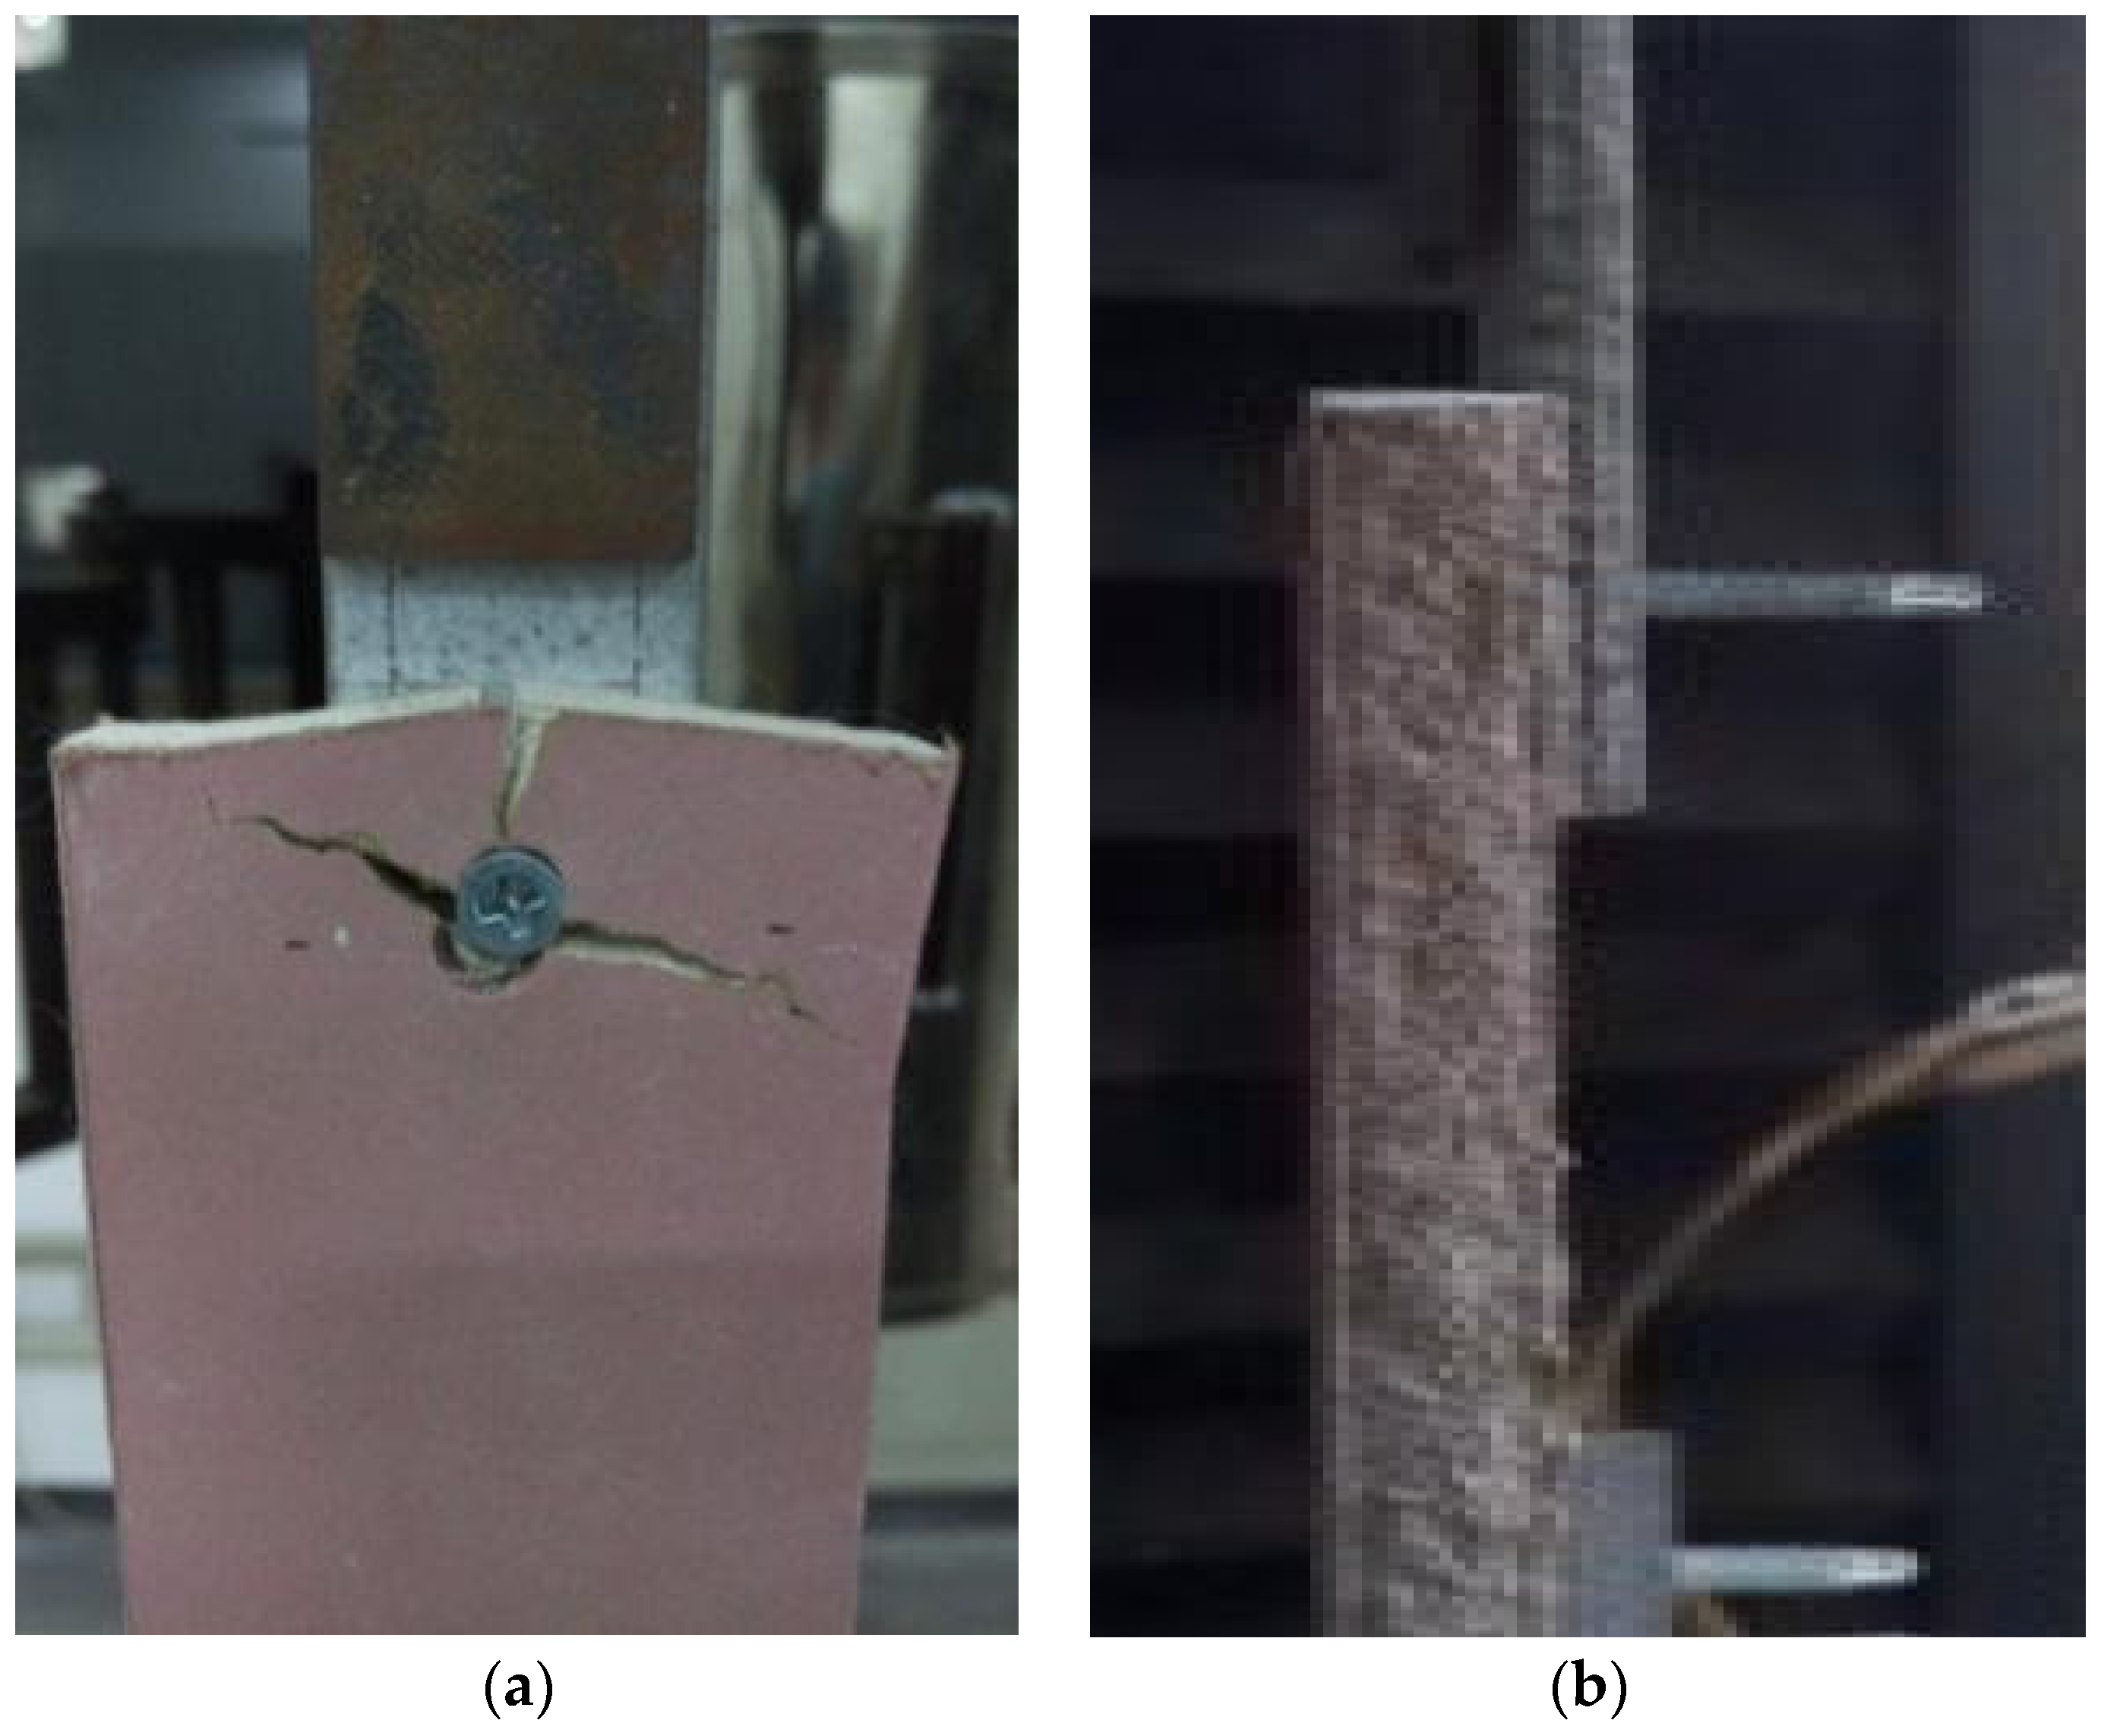
3.3. Failure Mechanisms
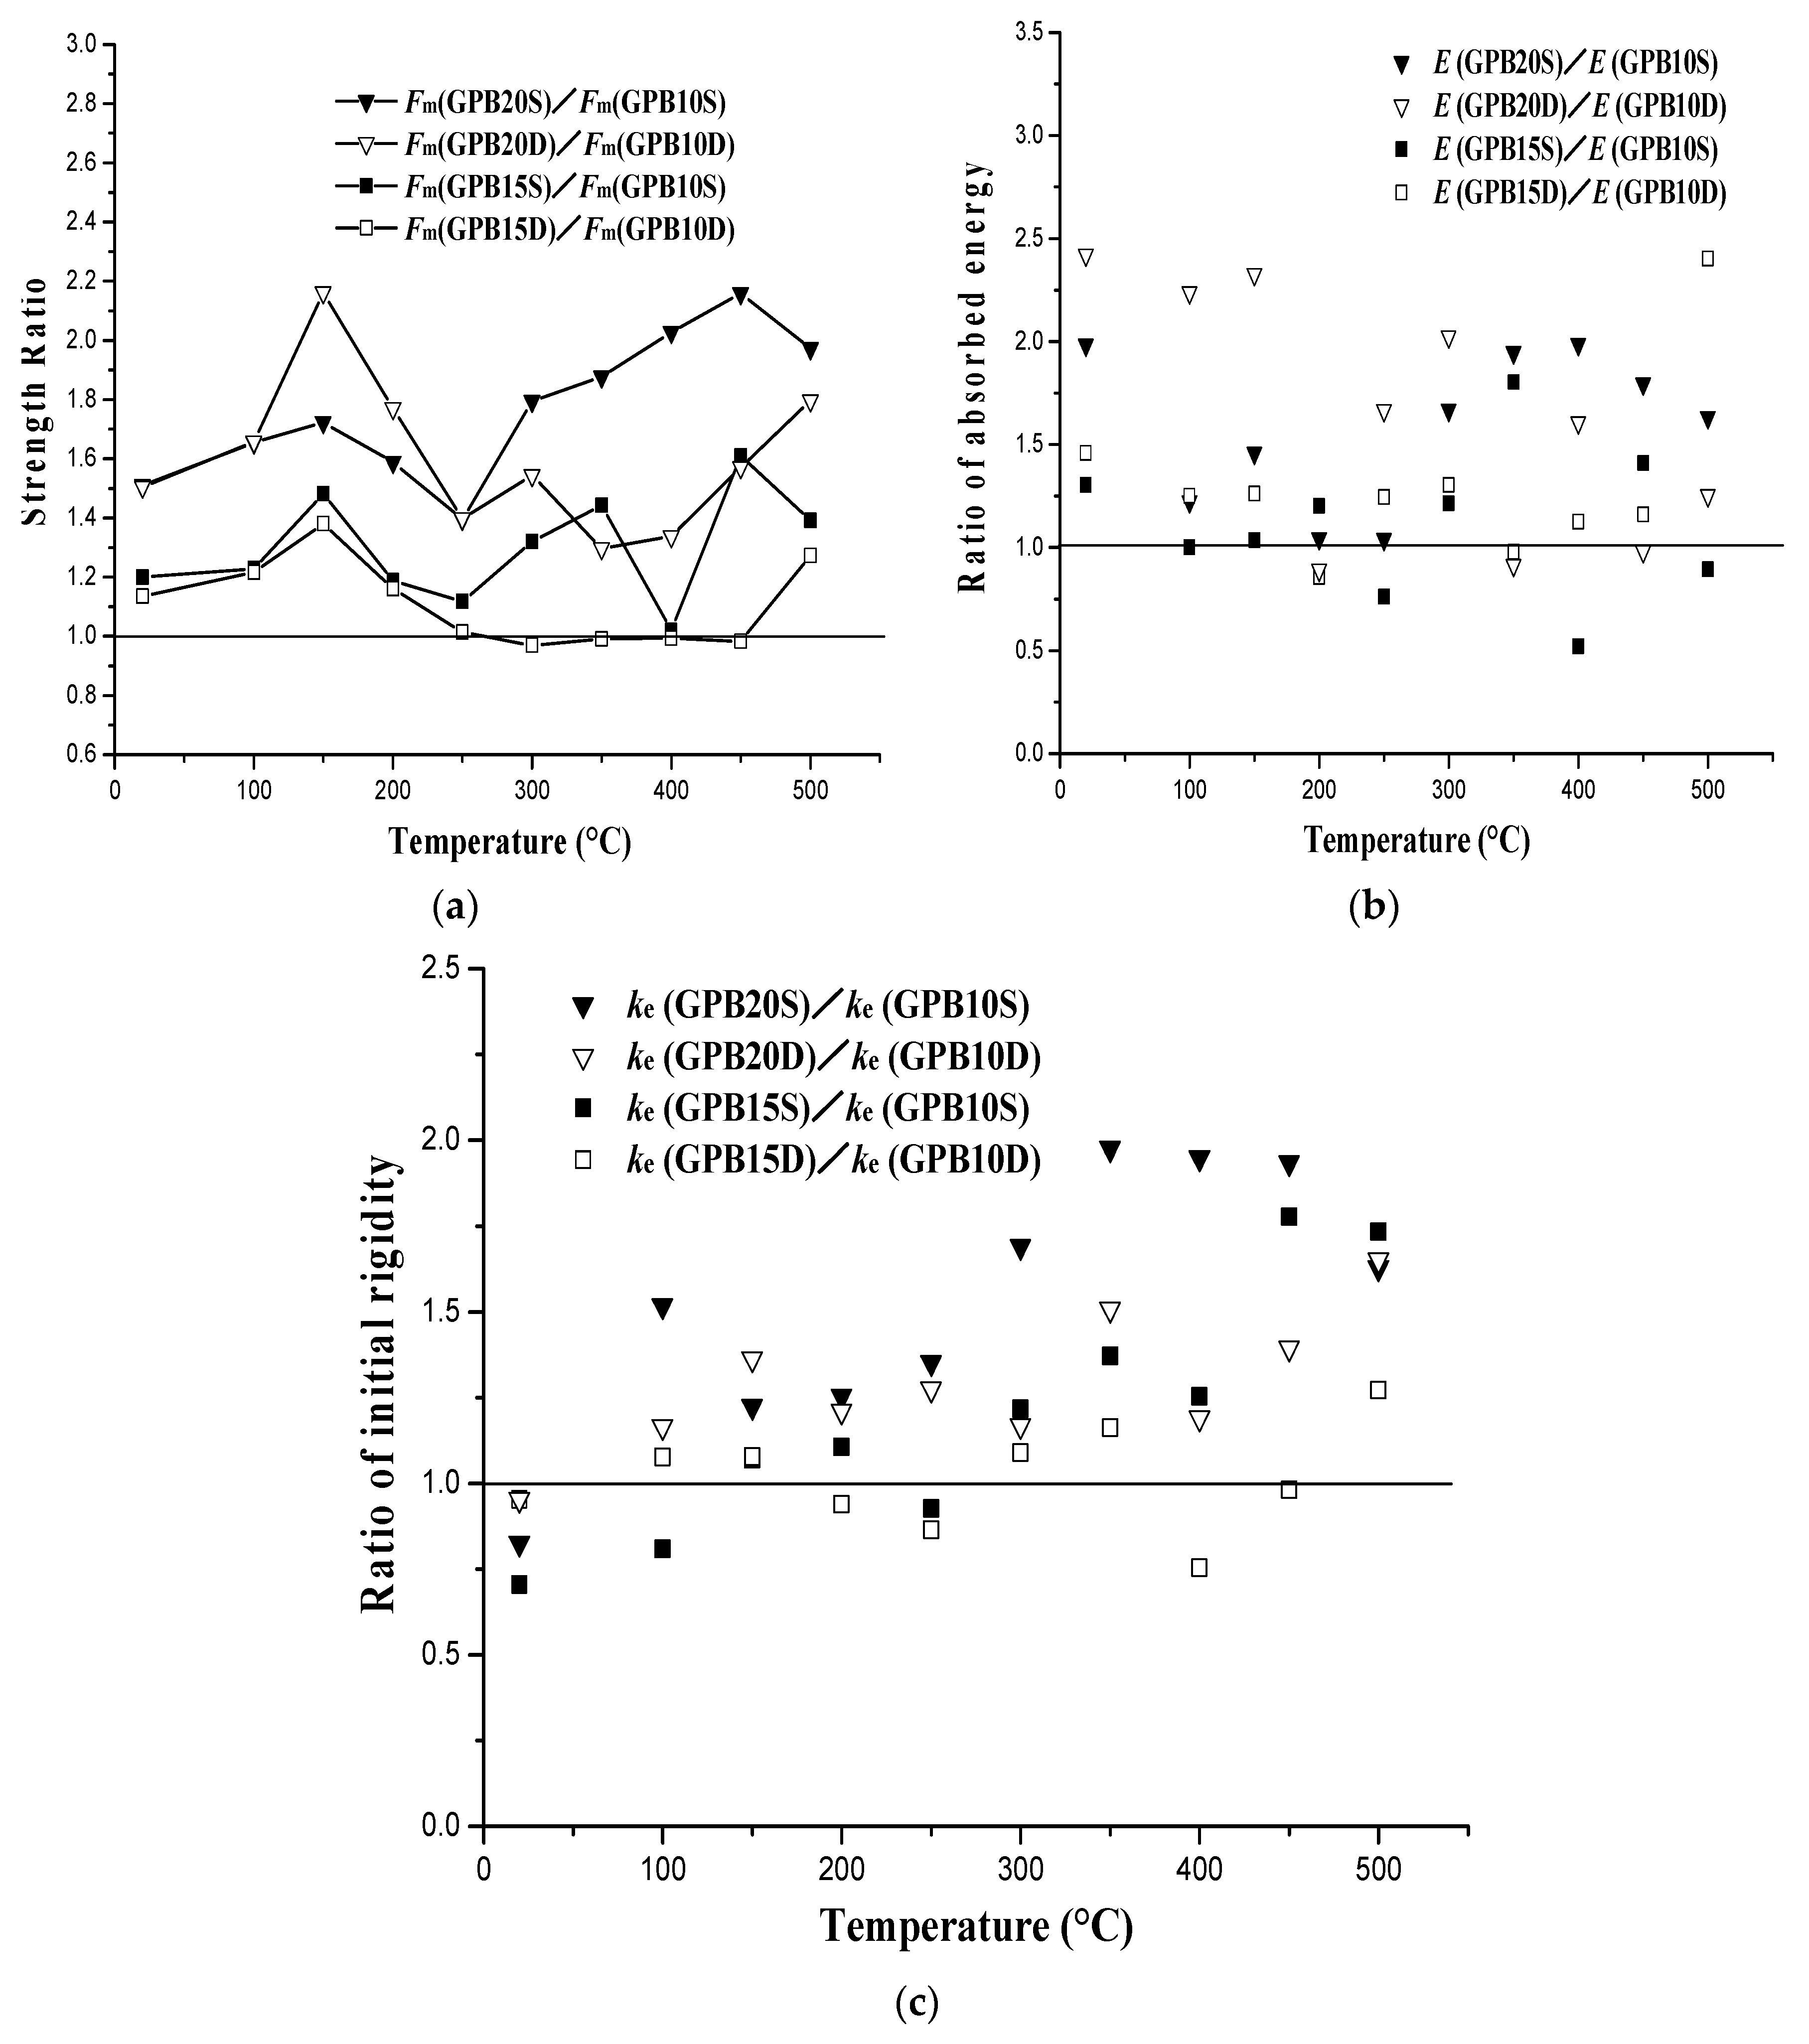
3.4. Effect of the Loaded Edge Distance
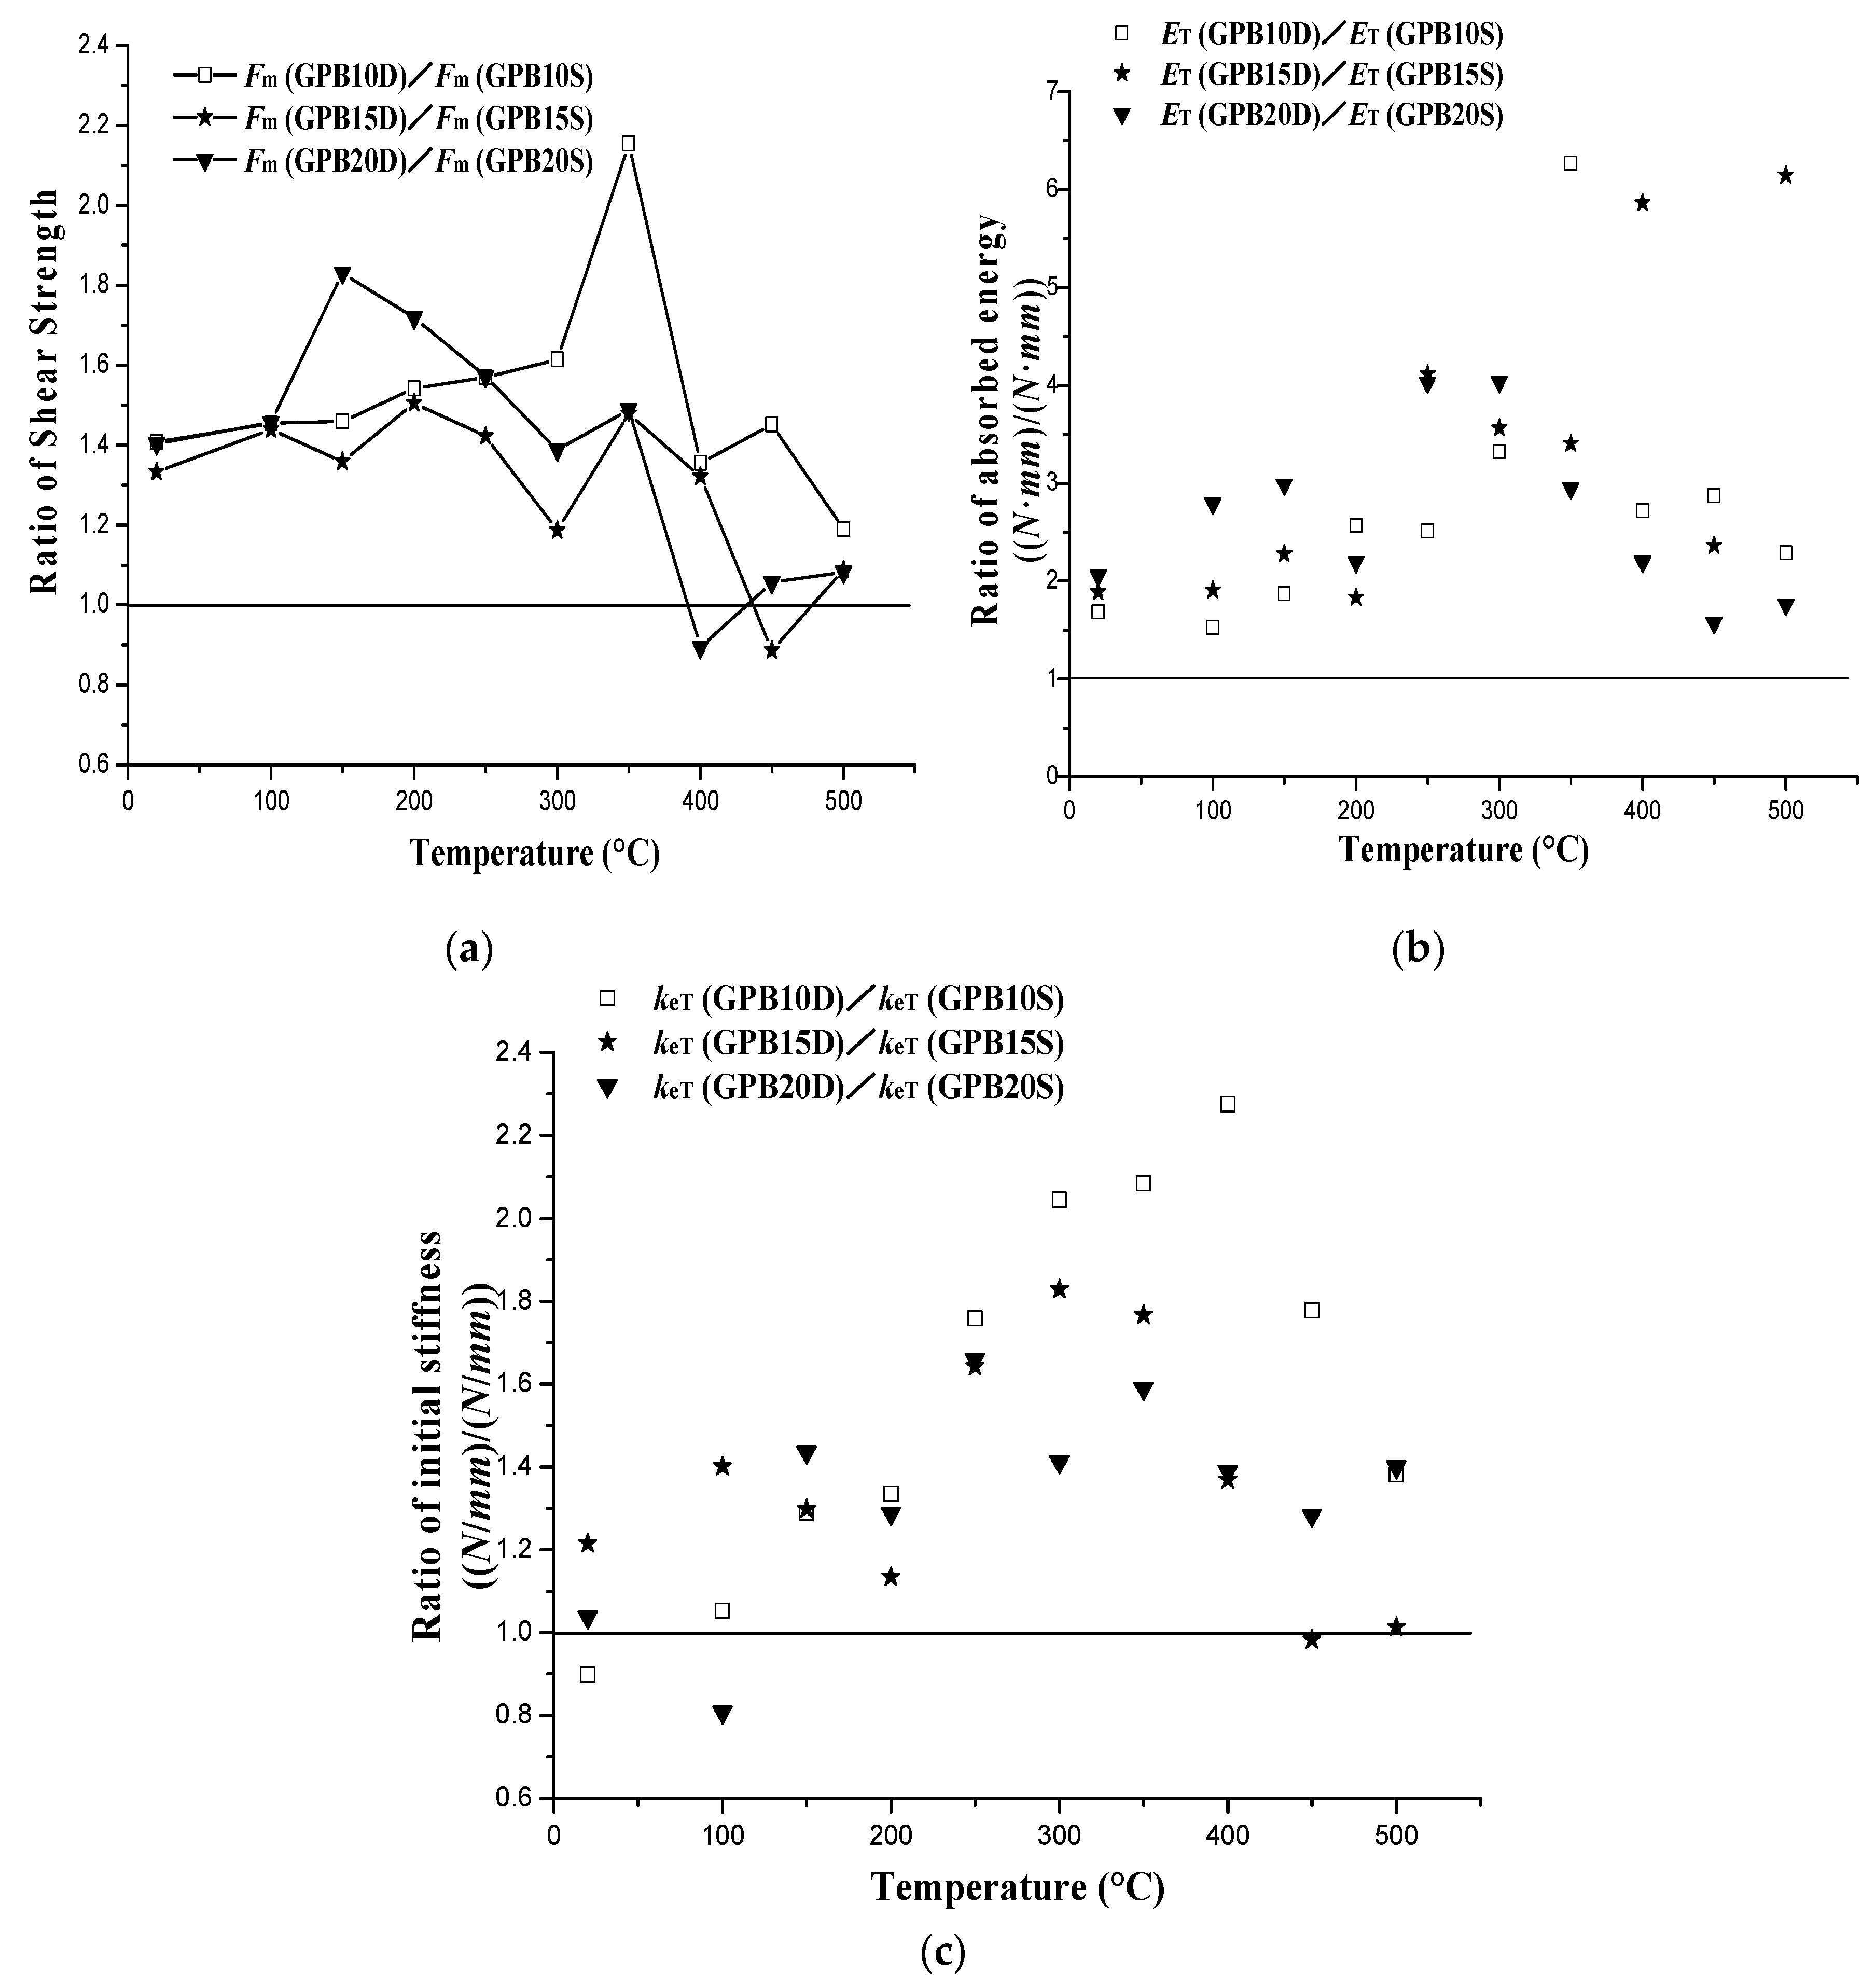
3.5. Effect of the Double-Layer Gypsum Sheathing
4. Design of CFS Screw Connection with Gypsum Sheathing
4.1. Shear Strength Design
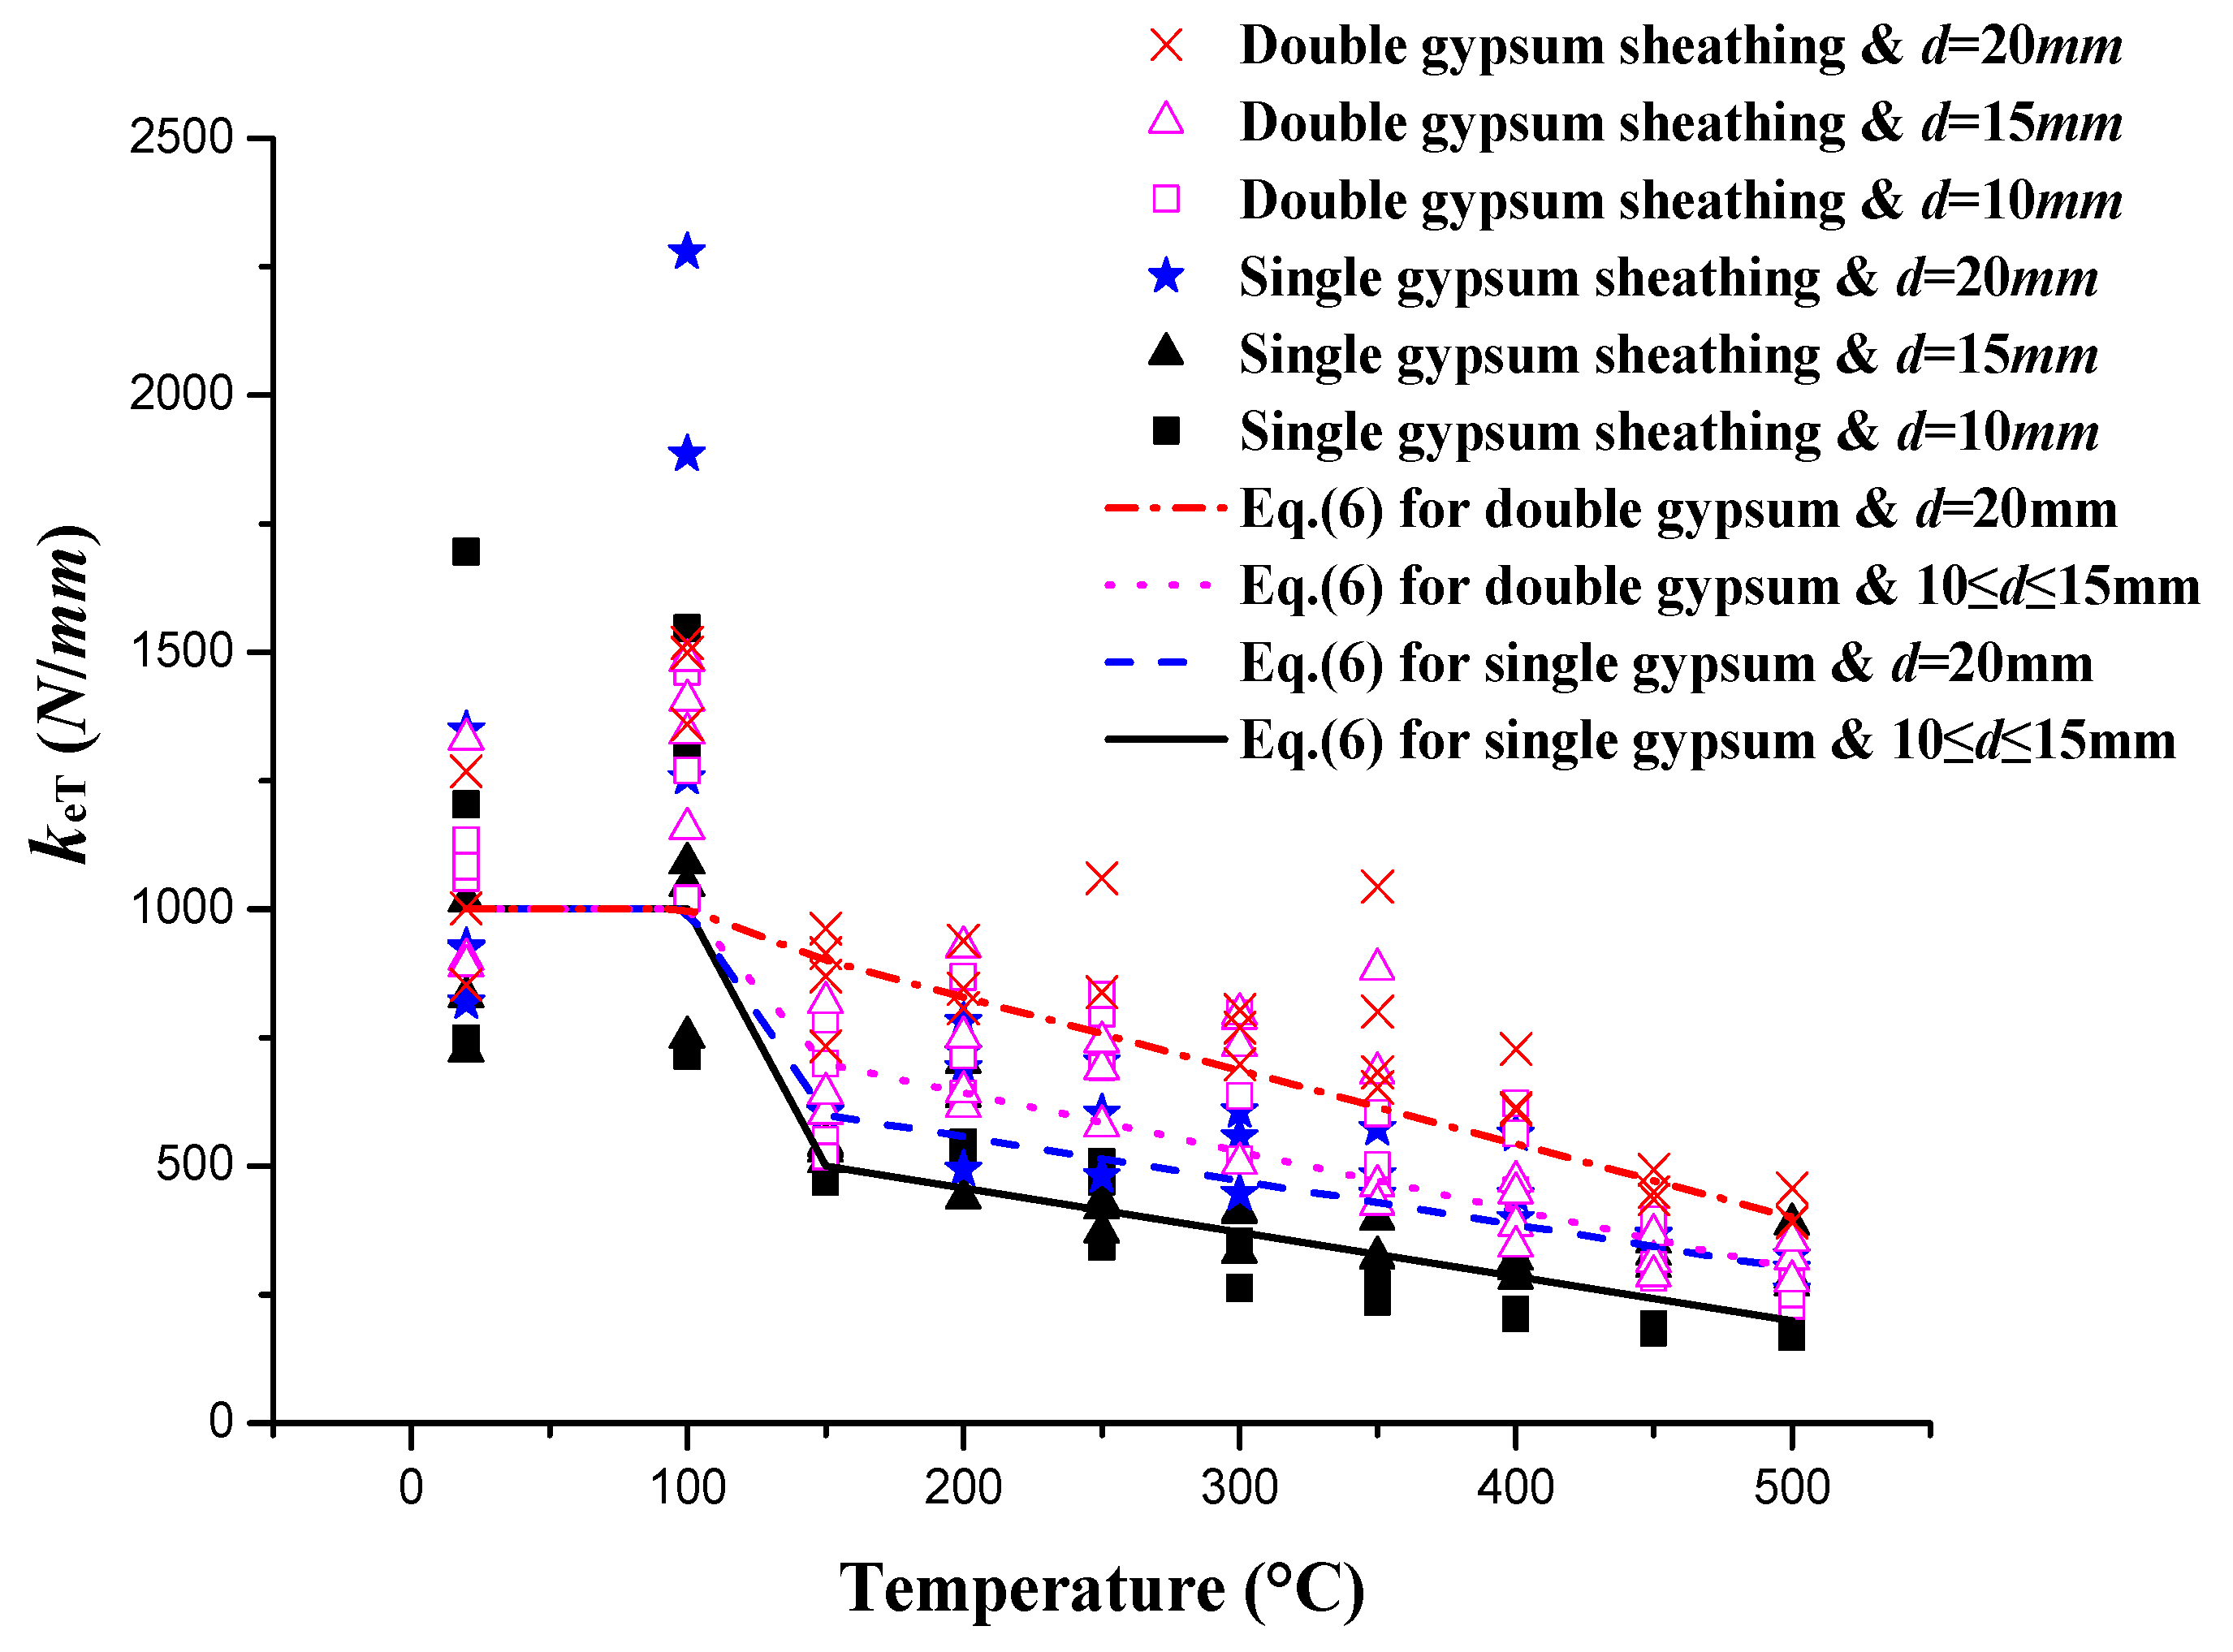
4.2. Other Parameters
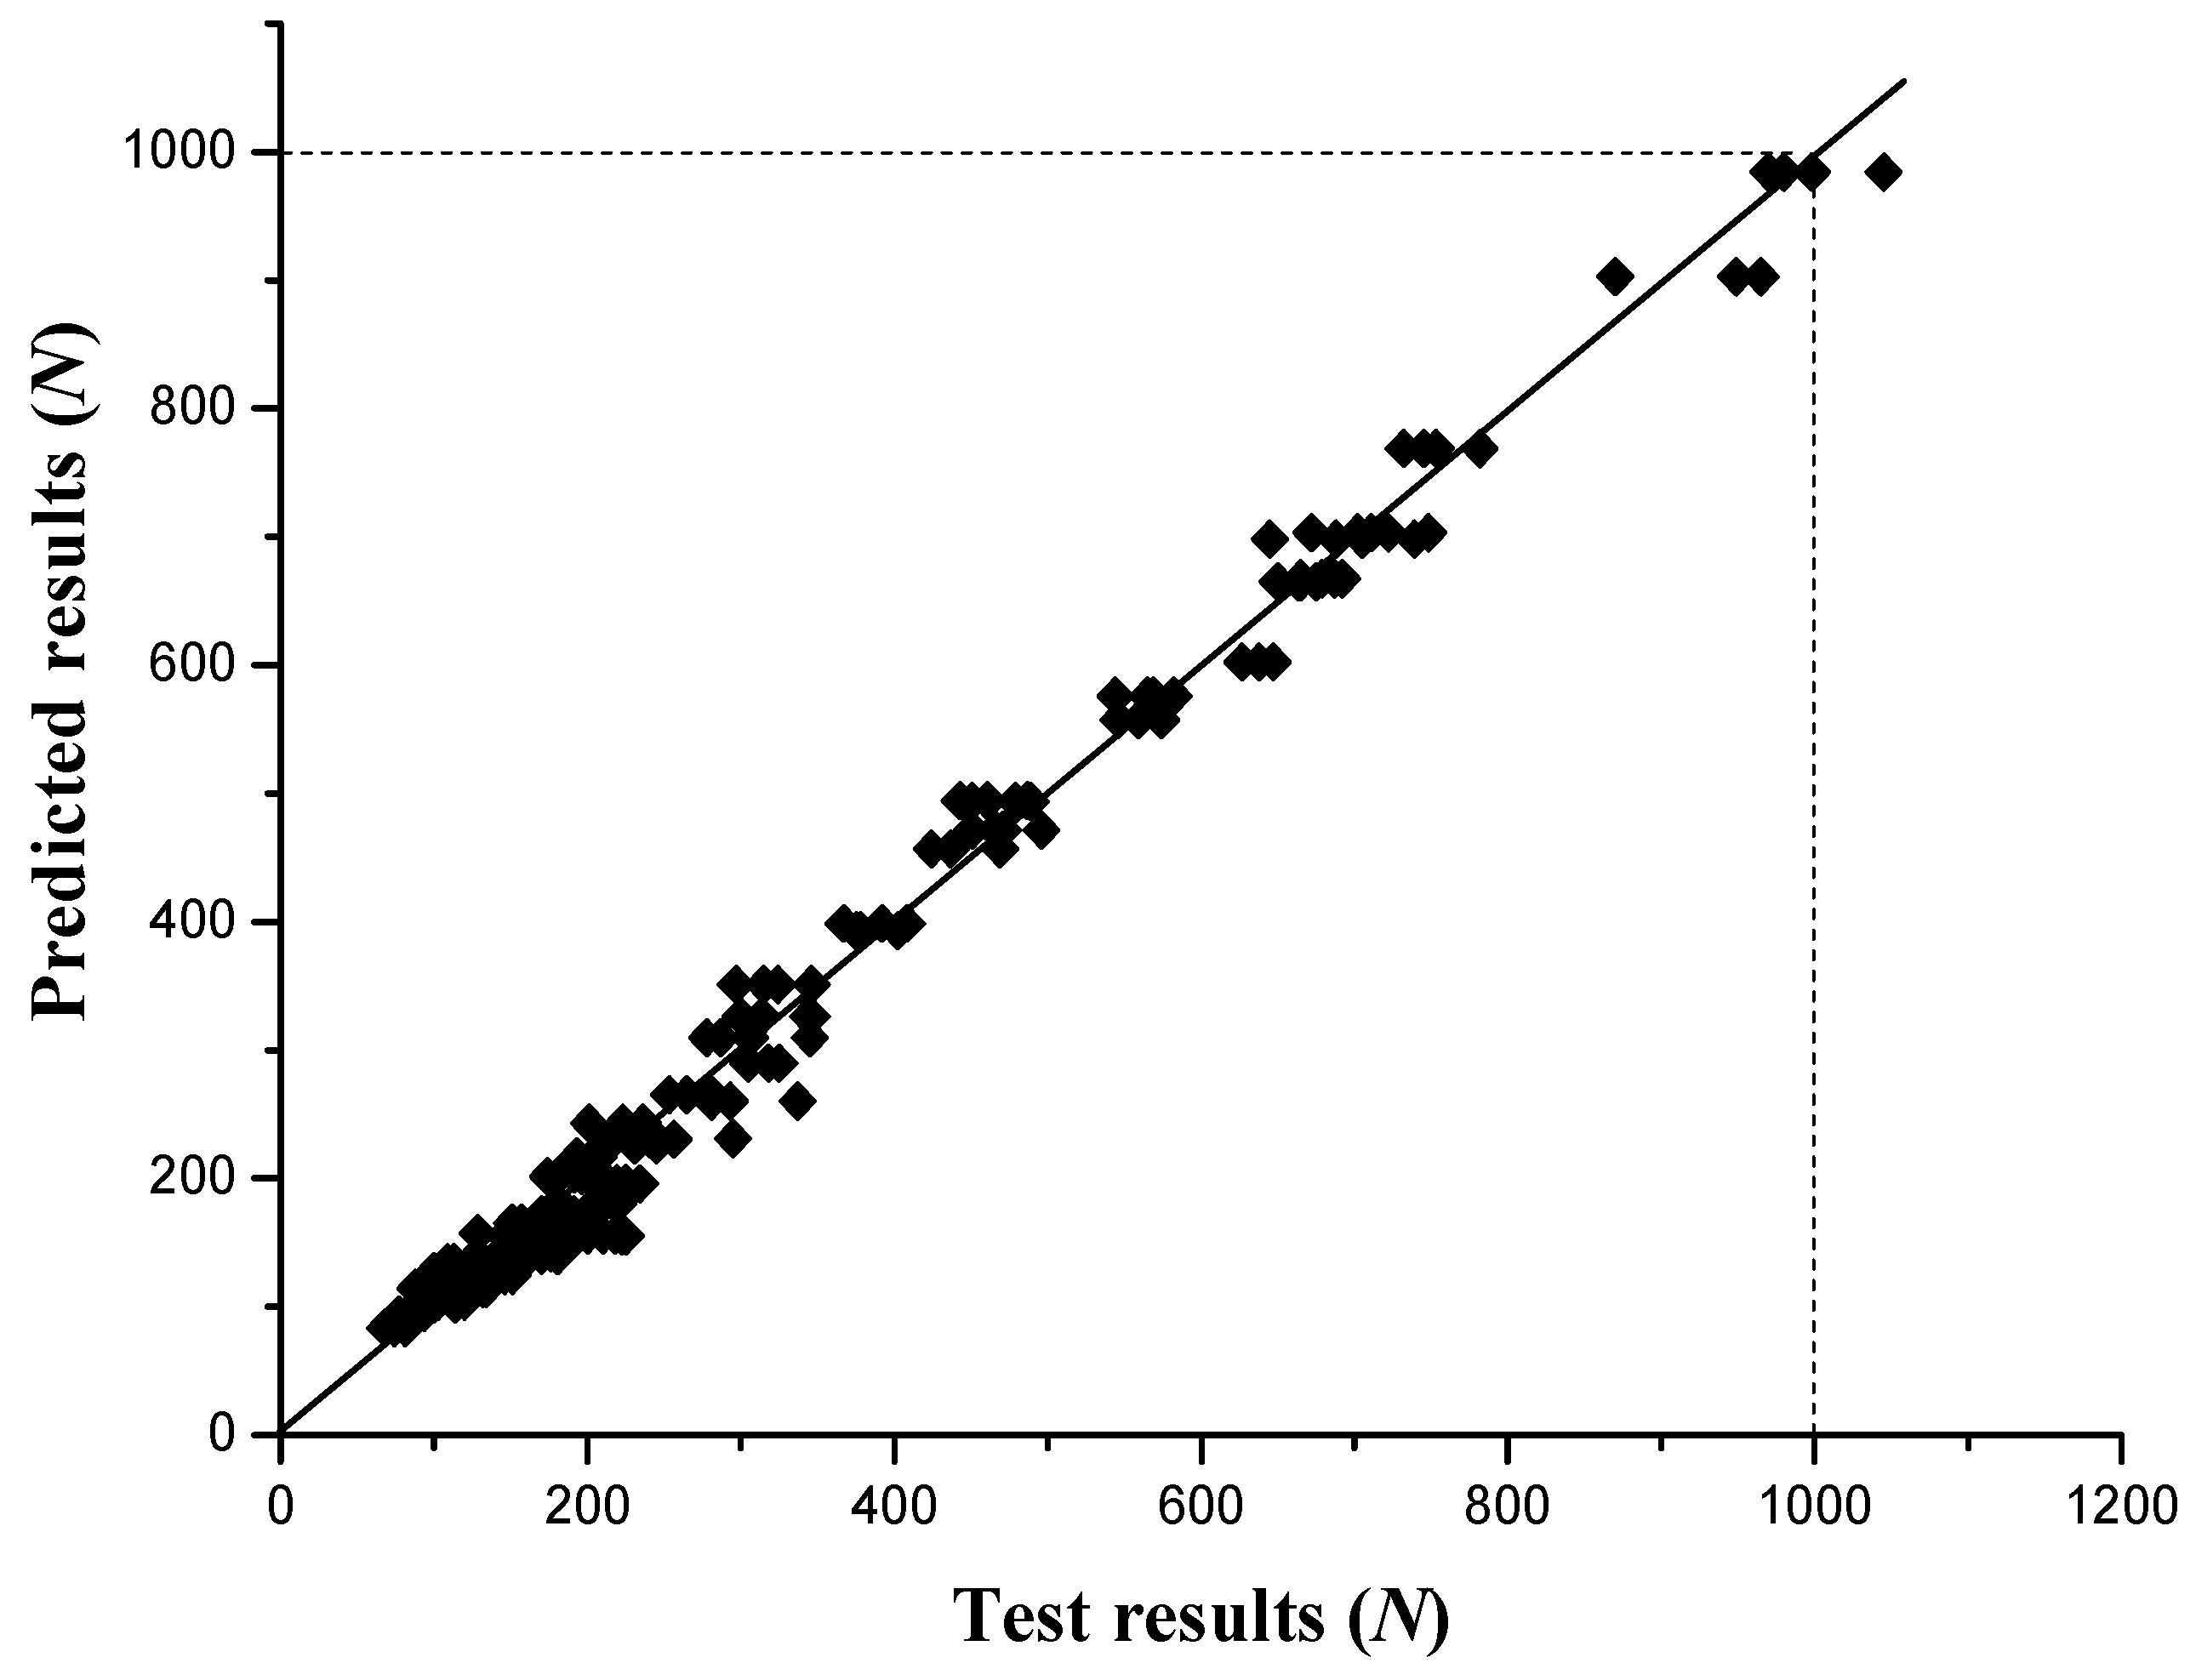
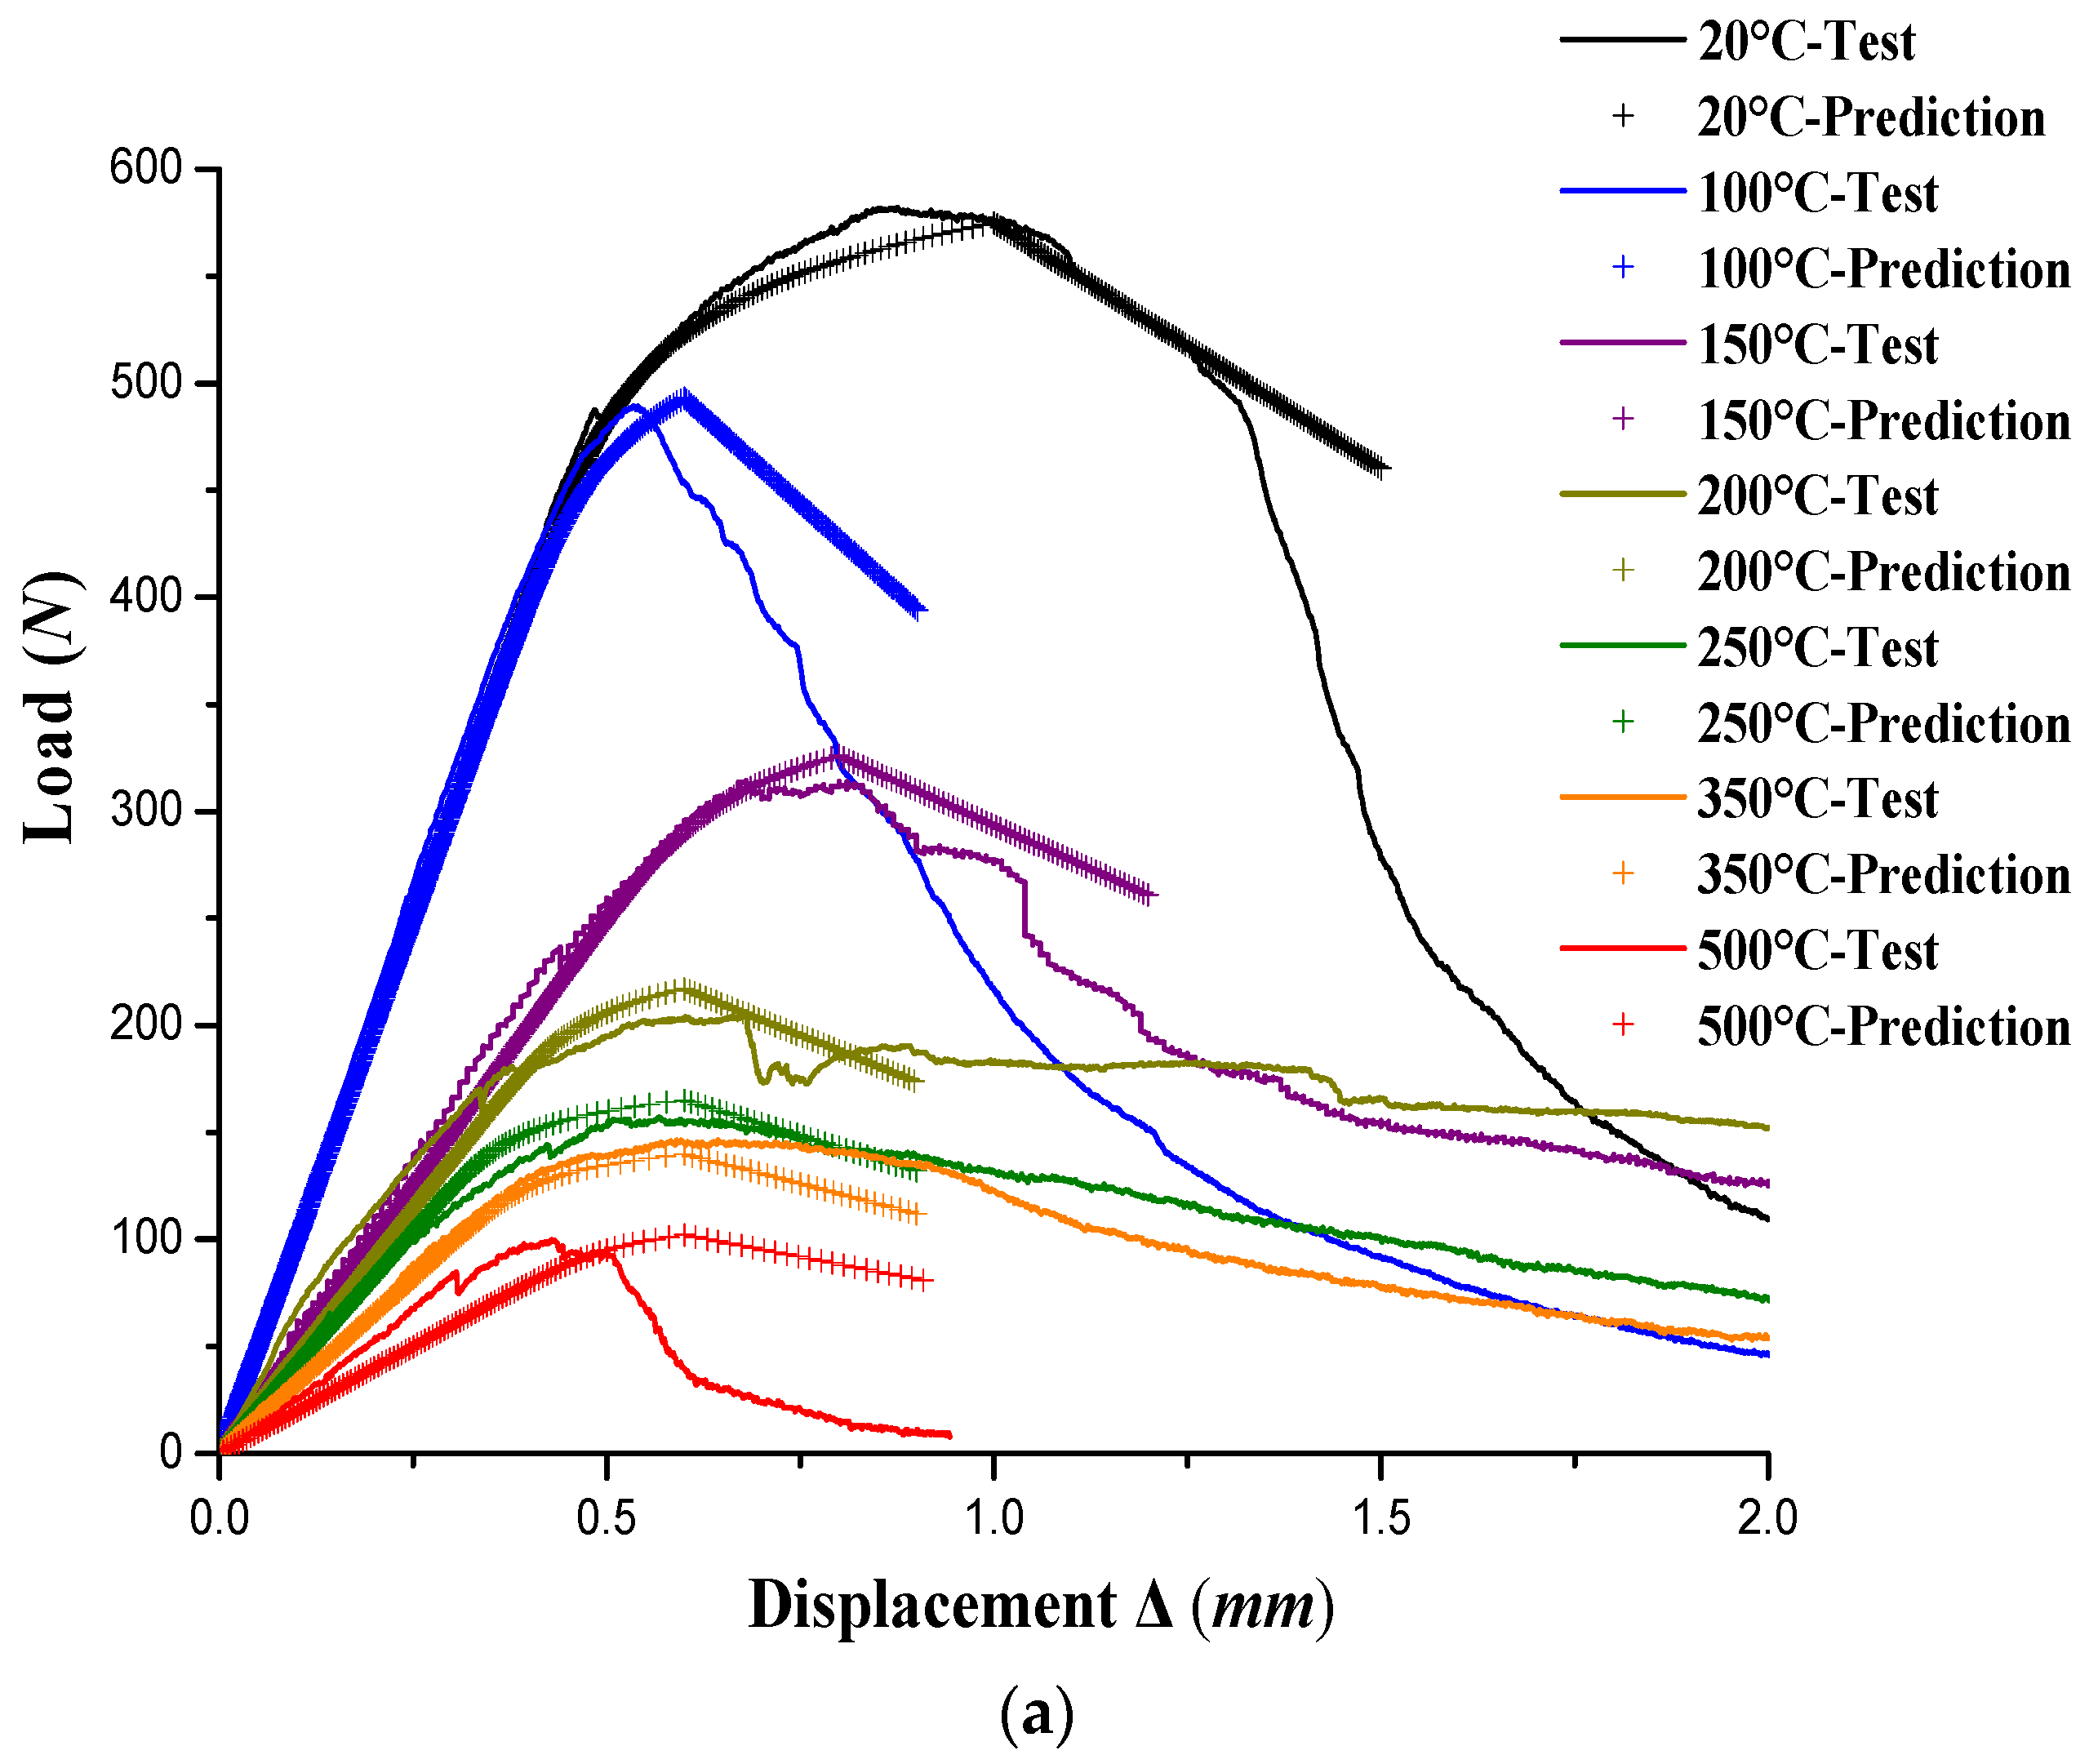
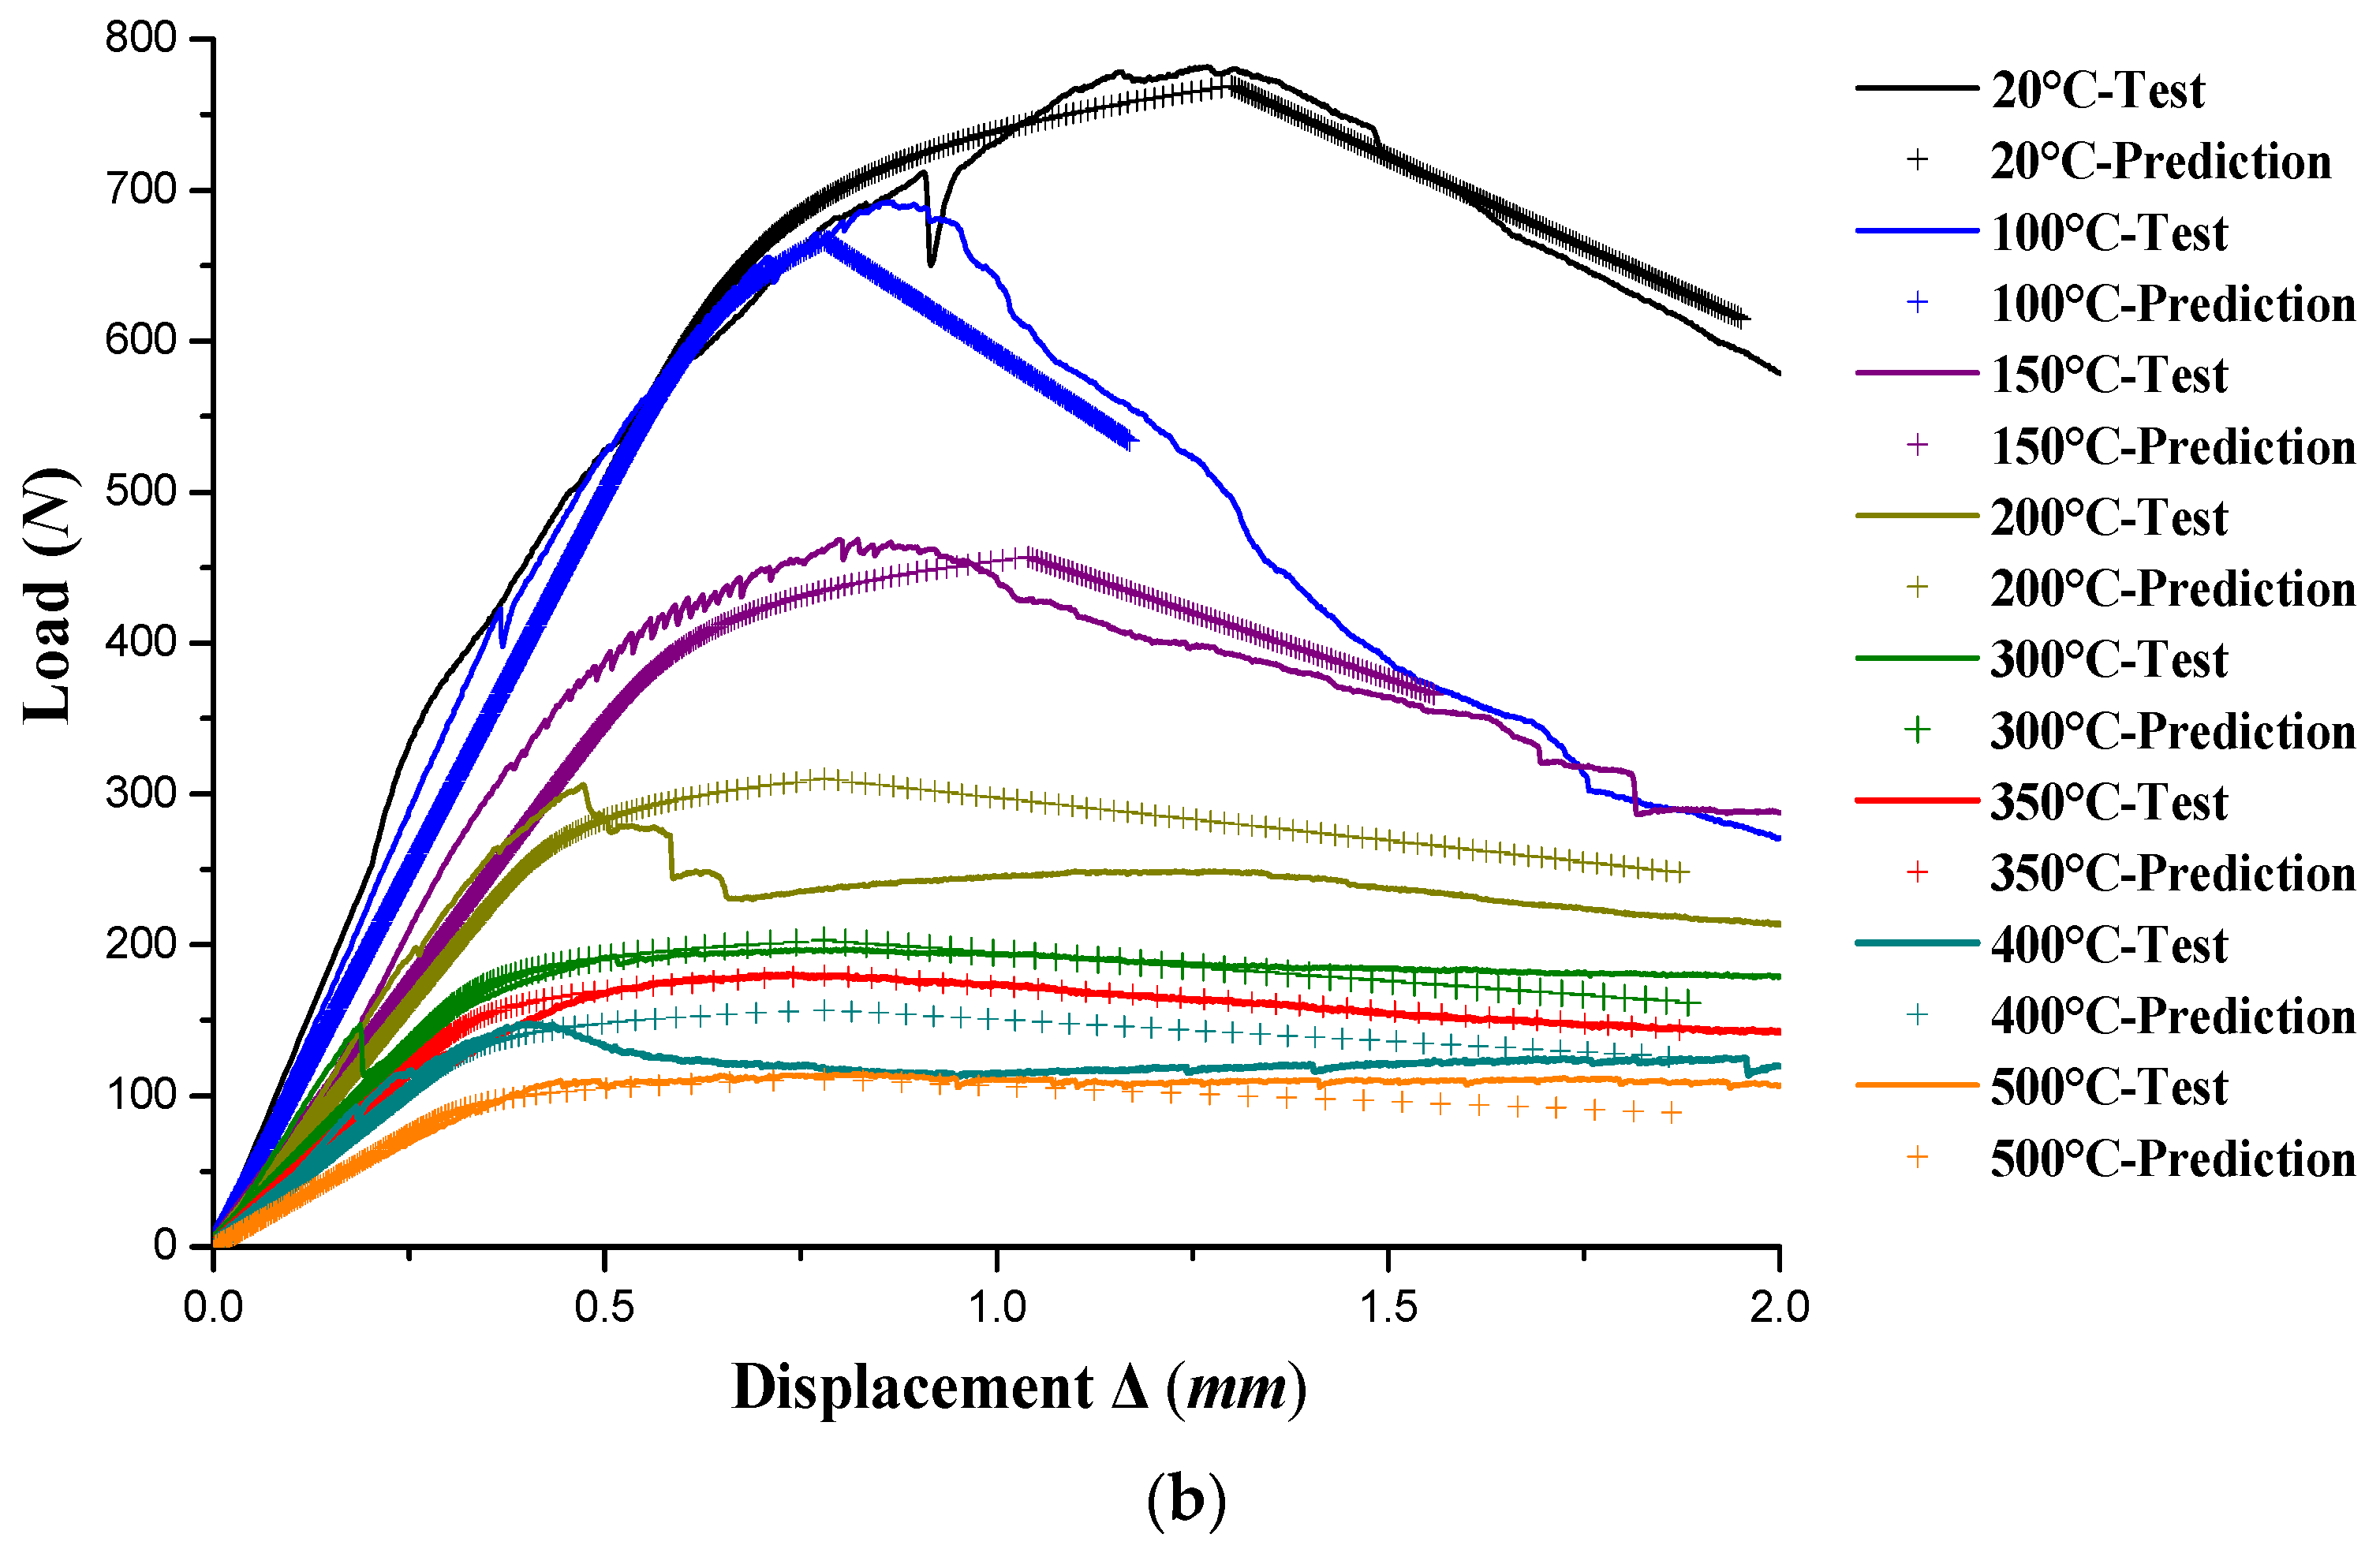
4.3. Load–Displacement Model of the Screw Connections
5. Conclusions
- (1)
- The failure characteristic of the screw connections with double-layer gypsum sheathing in shear was different from that of single-layer gypsum sheathing connections at ambient temperature, and it could be described as the breaking of the loaded sheathing edge combined with significant screw tilting and loaded sheathing edge flexing fracture. The screw tilting and loaded sheathing edge flexing fracture disappear gradually at elevated temperatures.
- (2)
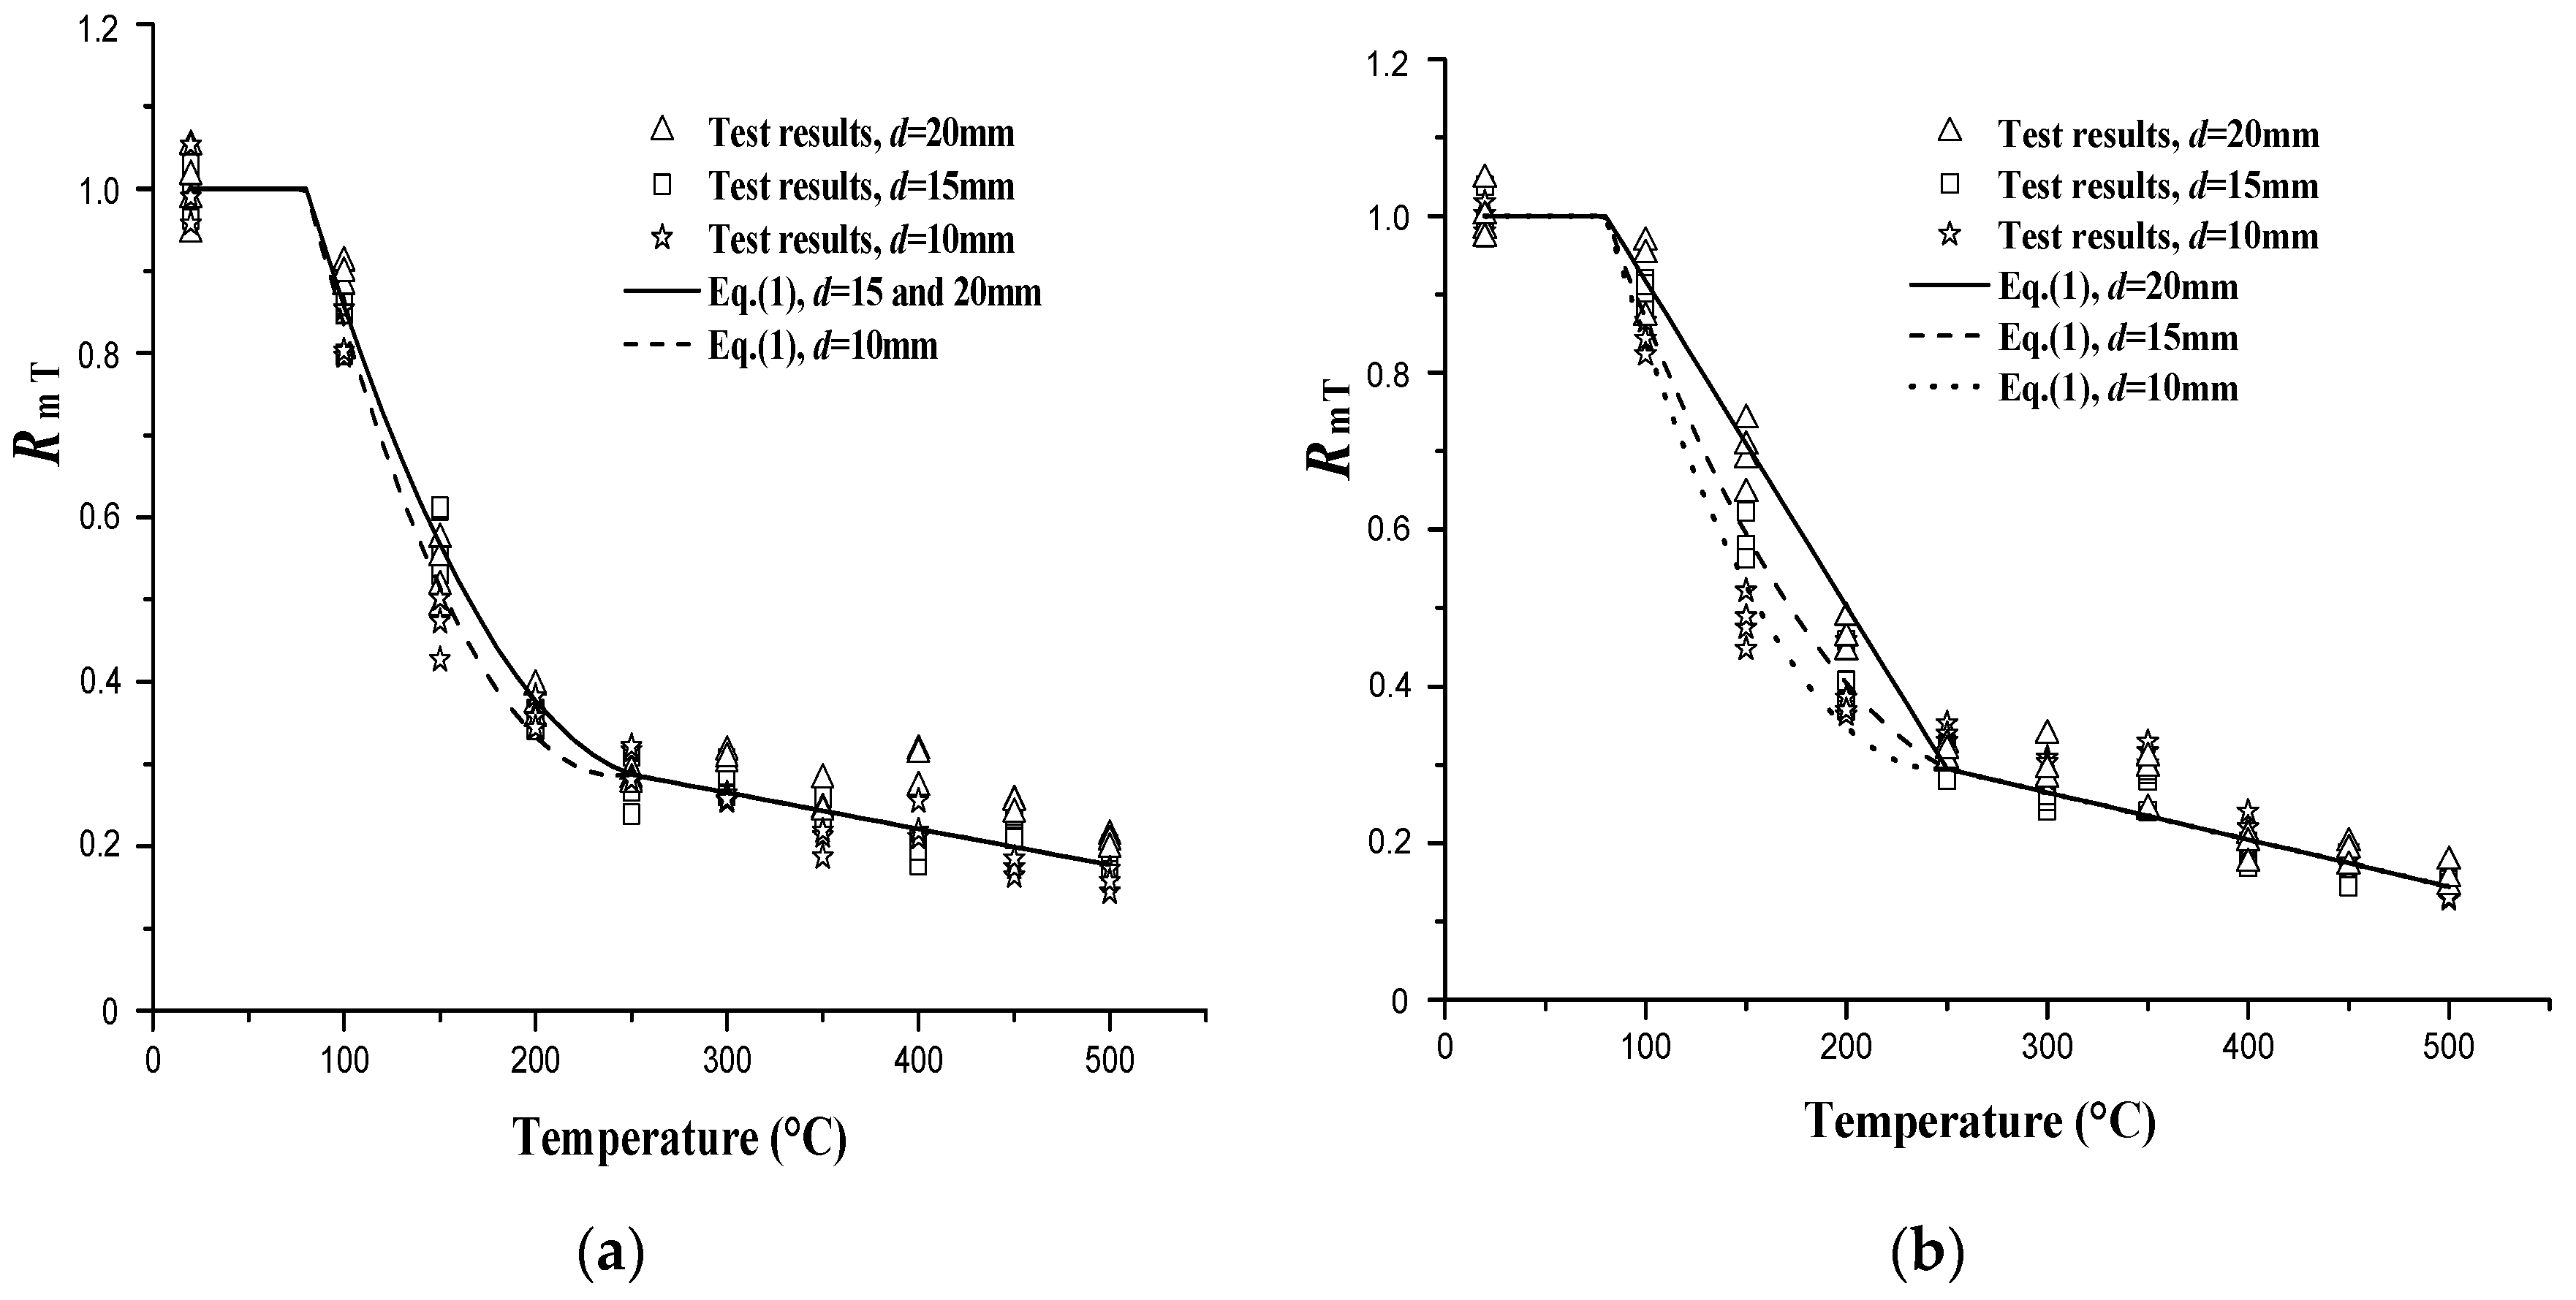
- Compared to the shear strength at ambient temperature, the shear strength of screw connection decreased sharply at 150 °C and 200 °C due to the gypsum dehydration and gradually declined from 250 °C to 500 °C.
- (3)
- The initial screw connection stiffness seems irrelevant to the loaded edge distance of more than 10 mm and single- or double-layer gypsum sheathing at ambient temperature. The shear strength and absorbed energy of the screw connection were significantly enhanced by increasing the loaded edge distance from 10 mm to 20 mm or replacing the single-layer gypsum sheathing with double-layer sheathing at both ambient and elevated temperatures.
- (4)
- The shear strength of screw connection could not be linearly superposed by the number of layers of gypsum sheathing because the shear strength of screw connection with double-layer gypsum sheathing is less than twice the screw connection strength with single-layer gypsum sheathing at ambient and elevated temperatures.
- (5)
- A unified design formula for the screw connection shear strength at ambient and elevated temperatures was proposed with sufficient accuracy, and it takes into account the effect of the loaded edge distance and double-layer gypsum sheathing. In addition, a simplified load–displacement model with the post-peak branch was developed to evaluate the load–displacement response of the screw connection with different loaded edge distances and single- or double-layer gypsum sheathing at ambient and elevated temperatures.
Acknowledgments
Author Contributions
Conflicts of Interest
References
- American Iron and Steel Institute. AISI-S100-12 (North American Specification for the Design of Cold-Formed Steel Structural Members); American Iron and Steel Institute: Washington, DC, USA, 2012. [Google Scholar]
- Yu, W.W.; LaBoube, R.A. Cold-Formed Steel Design, 4th ed.; John Wiley & Sons: Hoboken, NJ, USA, 2010. [Google Scholar]
- Serrette, R.L.; Encalada, J.; Juadines, M.; Nguyen, H. Static racking behavior of plywood, OSB, gypsum, and fiberboard walls with metal framing. J. Struct. Eng. ASCE 1997, 123, 1079–1086. [Google Scholar] [CrossRef]
- Fülöp, L.A.; Dubina, D. Design criteria for seam and sheeting to framing connections of cold-formed steel shear panels. J. Struct. Eng. 2006, 132, 582–590. [Google Scholar] [CrossRef]
- Nithyadharan, M.; Kalyanaraman, V. Experimental study of screw connections in CFS-calcium silicate board wall panels. Thin Walled Struct. 2011, 49, 724–731. [Google Scholar] [CrossRef]
- Fiorino, L.; Della Corte, G.; Landolfo, R. Experimental tests on typical screw connections for cold-formed steel housing. Eng. Struct. 2007, 29, 1761–1773. [Google Scholar] [CrossRef]
- Peterman, K.D.; Nakata, N.; Schafer, B.W. Hysteretic characterization of cold-formed steel stud-to-sheathing connections. J. Constr. Steel Res. 2014, 101, 254–264. [Google Scholar] [CrossRef]
- Swensen, S.; Deierlein G, G.; Miranda, E. Behavior of screw and adhesive connections to gypsum wallboard in wood and cold-formed steel-framed Wallettes. J. Struct. Eng. ASCE 2015, 142, E4015002-1–E4015002-11. [Google Scholar] [CrossRef]
- Ye, J.H.; Wang, X.X.; Zhao, M.Y. Experimental study on shear behavior of screw connections in CFS sheathing. J. Constr. Steel Res. 2016, 121, 1–12. [Google Scholar] [CrossRef]
- Foschi, R.O. Load-slip characteristics of nails. Wood Sci. 1974, 7, 69–76. [Google Scholar]
- Dowell, R.K.; Seibel, F.; Wilson, E.L. Pivot hysteresis model for reinforced concrete members. ACI Struct. J. 1998, 95, 607–617. [Google Scholar]
- Chen, W.; Ye, J.H.; Bai, Y.; Zhao, X.L. Improved fire resistant performance of load bearing cold-formed steel interior and exterior wall systems. Thin Walled Struct. 2013, 73, 145–157. [Google Scholar] [CrossRef]
- Chen, W.; Ye, J.H.; Bai, Y.; Zhao, X.L. Full-Scale fire experiments on load-bearing cold-formed steel walls lined with different panels. J. Constr. Steel Res. 2012, 79, 242–254. [Google Scholar] [CrossRef]
- Sakumoto, Y.; Hirakawa, T.; Masuda, H.; Nakamura, K. Fire resistance of walls and floors using light-gauge steel shapes. J. Struct. Eng. 2003, 129, 1522–1530. [Google Scholar] [CrossRef]
- Wang, X.X.; Ye, J.H. Cyclic testing of two- and three-story CFS shear-walls with reinforced end studs. J. Constr. Steel Res. 2016, 121, 13–28. [Google Scholar] [CrossRef]
- Ye, J.H.; Wang, X.X.; Jia, H.Y.; Zhao, M.Y. Cyclic performance of cold-formed steel shear walls sheathed with double-layer wallboards on both sides. Thin Walled Struct. 2015, 92, 146–159. [Google Scholar] [CrossRef]
- American Iron and Steel Institute. AISI-S400-15 (North American Standard for Seismic Design of Cold-Formed Steel Structural Systems); American Iron and Steel Institute: Washington, DC, USA, 2015. [Google Scholar]
- Lu, W.; Mäkeläinen, P.; Outinen, J.; Ma, Z. Design of screwed steel sheeting connection at ambient and elevated temperatures. Thin Walled Struct. 2011, 49, 1526–1533. [Google Scholar] [CrossRef]
- Yan, S.; Young, B. Screwed connections of thin sheet steels at elevated temperatures—Part I: Steady state tests. Eng. Struct. 2012, 35, 234–243. [Google Scholar] [CrossRef]
- Cai, Y.C.; Young, B. Behavior of cold-formed stainless steel single shear bolted connections at elevated temperatures. Thin Walled Struct. 2014, 75, 63–75. [Google Scholar] [CrossRef] [Green Version]
- Chen, W.; Ye, J.H.; Bai, Y.; Zhao, X.L. Thermal and mechanical modeling of load-bearing cold-formed steel wall systems in fire. J. Struct. Eng. 2014, 140, 1–13. [Google Scholar] [CrossRef]
- Gunalan, S.; Mahendran, M. Finite element modelling of load bearing cold-formed steel wall systems under fire conditions. Eng. Struct. 2013, 56, 1007–1027. [Google Scholar] [CrossRef] [Green Version]
- China Institute of Building Standard Design & Research. Technical Specification for Low-Rise Cold-Formed Thin-Walled Steel Buildings; China Architecture & Building Press: Beijing, China, 2012. (In Chinese) [Google Scholar]
- American Society for Testing and Materials. ASTM Standard E2126-11 (Standard Test Methods for Cyclic (Reversed) Load Test for Shear Resistance of Vertical Elements of the Lateral Force Resisting Systems for Buildings); American Society for Testing and Materials: West Conshohocken, PA, USA, 2011. [Google Scholar]
- American Iron and Steel Institute. AISI-S211-07 (North American Standard for Cold-Formed Steel Framing—Wall Stud Design); American Iron and Steel Institute: Washington, DC, USA, 2007. [Google Scholar]
- Ramberg, W.; Osgood, W.R. Description of Stress-Strain Curves by Three Parameters. Patent NACA-TN-902, 1 July 1943. [Google Scholar]


| Specimen | keT (N/mm) | FmT (N) | ΔeT (mm) | ΔmT (mm) | ΔuT (mm) | ET (N·mm) | Failure Mode | ||||||
|---|---|---|---|---|---|---|---|---|---|---|---|---|---|
| Mean | COV | Mean | COV | Mean | COV | Mean | COV | Mean | COV | Mean | COV | ||
| GPB10S-20 | 1215 | 39.0% | 471 | 4.9% | 0.175 | 46.0% | 0.720 | 20.2% | 1.274 | 3.4% | 439 | 10.3% | B |
| GPB10S-100 | 1189 | 36.0% | 385 | 3.8% | 0.143 | 40.8% | 0.457 | 37.4% | 0.877 | 31.5% | 251 | 28.5% | |
| GPB10S-150 | 495 | 6.7% | 220 | 8.0% | 0.179 | 13.7% | 0.810 | 25.1% | 1.305 | 16.0% | 218 | 20.7% | |
| GPB10S-200 | 535 | 2.2% | 170 | 5.4% | 0.127 | 7.6% | 0.452 | 36.3% | 1.052 | 24.8% | 139 | 32.7% | |
| GPB10S-250 | 440 | 19.6% | 144 | 7.3% | 0.133 | 13.8% | 0.607 | 7.8% | 1.282 | 8.2% | 150 | 12.9% | |
| GPB10S-300 | 317 | 15.3% | 122 | 1.7% | 0.156 | 18.3% | 0.603 | 7.2% | 1.095 | 6.4% | 102 | 9.3% | |
| GPB10S-350 | 253 | 10.1% | 97 | 8.2% | 0.150 | 18.9% | 0.500 | 4.5% | 0.813 | 5.9% | 56 | 12.7% | |
| GPB10S-400 | 240 | 20.6% | 107 | 10.4% | 0.181 | 11.4% | 0.657 | 19.4% | 0.918 | 22.6% | 71 | 35.7% | |
| GPB10S-450 | 185 | 6.5% | 82 | 6.1% | 0.173 | 10.6% | 0.581 | 20.0% | 0.728 | 18.3% | 39 | 24.6% | |
| GPB10S-500 | 181 | 7.3% | 74 | 8.8% | 0.158 | 4.5% | 0.492 | 16.7% | 0.765 | 25.7% | 38 | 25.0% | |
| GPB15S-20 | 857 | 17.3% | 565 | 3.4% | 0.268 | 13.4% | 0.958 | 18.1% | 1.406 | 7.7% | 572 | 4.8% | B |
| GPB15S-100 | 962 | 19.2% | 473 | 4.2% | 0.202 | 23.2% | 0.614 | 16.1% | 0.816 | 15.2% | 251 | 12.3% | |
| GPB15S-150 | 530 | 3.7% | 326 | 7.0% | 0.253 | 8.0% | 0.725 | 11.8% | 1.018 | 13.0% | 226 | 16.2% | |
| GPB15S-200 | 592 | 23.2% | 202 | 3.8% | 0.143 | 29.2% | 0.562 | 41.7% | 1.006 | 39.2% | 167 | 40.3% | |
| GPB15S-250 | 408 | 7.8% | 161 | 8.1% | 0.159 | 16.1% | 0.574 | 30.8% | 0.954 | 35.9% | 114 | 45.4% | |
| GPB15S-300 | 386 | 11.8% | 161 | 7.8% | 0.170 | 20.1% | 0.593 | 21.8% | 1.032 | 16.1% | 124 | 20.8% | |
| GPB15S-350 | 347 | 12.5% | 140 | 7.6% | 0.164 | 18.6% | 0.540 | 10.8% | 0.954 | 8.5% | 101 | 14.8% | |
| GPB15S-400 | 301 | 8.7% | 109 | 8.3% | 0.145 | 2.9% | 0.417 | 5.1% | 0.532 | 0.3% | 37 | 10.4% | |
| GPB15S-450 | 329 | 10.1% | 132 | 6.8% | 0.163 | 11.3% | 0.502 | 11.1% | 0.640 | 15.9% | 55 | 19.9% | |
| GPB15S-500 | 314 | 20.4% | 103 | 9.2% | 0.136 | 34.3% | 0.403 | 24.9% | 0.496 | 22.0% | 34 | 26.0% | |
| GPB20S-20 | 1004 | 23.4% | 711 | 4.5% | 0.292 | 17.6% | 1.243 | 17.8% | 1.672 | 14.5% | 871 | 11.1% | B/B + T |
| GPB20S-100 | 1806 | 28.5% | 637 | 1.6% | 0.150 | 32.8% | 0.511 | 18.0% | 0.705 | 18.7% | 307 | 20.2% | B |
| GPB20S-150 | 606 | 0.3% | 379 | 6.9% | 0.250 | 7.1% | 0.896 | 6.8% | 1.232 | 19.3% | 318 | 23.4% | |
| GPB20S-200 | 671 | 18.6% | 270 | 5.1% | 0.165 | 20.9% | 0.593 | 29.1% | 0.792 | 29.0% | 145 | 38.9% | |
| GPB20S-250 | 595 | 18.6% | 201 | 2.8% | 0.139 | 21.6% | 0.617 | 12.8% | 1.003 | 6.3% | 156 | 4.8% | |
| GPB20S-300 | 536 | 15.3% | 219 | 2.3% | 0.178 | 18.7% | 0.660 | 4.6% | 1.048 | 7.1% | 170 | 7.9% | |
| GPB20S-350 | 500 | 13.3% | 182 | 8.6% | 0.148 | 20.4% | 0.558 | 50.3% | 0.832 | 56.2% | 109 | 71.7% | |
| GPB20S-400 | 468 | 18.1% | 217 | 9.9% | 0.189 | 21.8% | 0.640 | 19.6% | 0.921 | 20.3% | 141 | 33.1% | |
| GPB20S-450 | 358 | 3.5% | 177 | 3.4% | 0.198 | 0.4% | 0.555 | 4.3% | 0.645 | 11.1% | 70 | 16.1% | |
| GPB20S-500 | 295 | 11.2% | 146 | 3.8% | 0.207 | 18.2% | 0.613 | 2.7% | 0.719 | 2.4% | 62 | 4.3% | |
| Specimen | keT (N/mm) | FmT (N) | ΔeT (mm) | ΔmT (mm) | ΔuT (mm) | ET (N·mm) | Failure Mode | ||||||
|---|---|---|---|---|---|---|---|---|---|---|---|---|---|
| Mean | COV | Mean | COV | Mean | COV | Mean | Mean | COV | mean | COV | Mean | ||
| GPB10D-20 | 1092 | 3.5% | 663 | 1.9% | 0.243 | 2.9% | 0.974 | 8.5% | 1.480 | 6.9% | 740 | 6.6% | B + T + F |
| GPB10D-100 | 1251 | 17.7% | 560 | 2.5% | 0.182 | 15.9% | 0.655 | 5.6% | 0.962 | 3.2% | 383 | 4.2% | B |
| GPB10D-150 | 638 | 19.7% | 321 | 6.4% | 0.207 | 22.2% | 1.122 | 13`.3% | 1.658 | 8.6% | 408 | 11.9% | |
| GPB10D-200 | 714 | 15.3% | 262 | 11.1% | 0.149 | 17.5% | 0.755 | 27.7% | 1.674 | 16.2% | 357 | 15.5% | |
| GPB10D-250 | 774 | 9.4% | 226 | 3.3% | 0.118 | 12.8% | 0.999 | 31.2% | 2.002 | 26.8% | 377 | 30.8% | |
| GPB10D-300 | 648 | 22.0% | 197 | 5.1% | 0.126 | 22.3% | 1.016 | 13.4% | 2.046 | 4.3% | 339 | 4.4% | |
| GPB10D-350 | 527 | 12.6% | 209 | 4.3% | 0.161 | 15.1% | 1.151 | 29.9% | 2.028 | 20.5% | 351 | 22.0% | |
| GPB10D-400 | 546 | 15.8% | 145 | 10.0% | 0.107 | 10.9% | 0.798 | 39.3% | 1.570 | 13.2% | 193 | 24.1% | |
| GPB10D-450 | 329 | 18.0% | 119 | 6.9% | 0.149 | 23.0% | 0.584 | 42.4% | 1.213 | 3.2% | 112 | 1.4% | |
| GPB10D-500 | 250 | 12.8% | 88 | 5.6% | 0.144 | 5.9% | 0.728 | 32.1% | 1.215 | 35.0% | 87 | 48.6% | |
| GPB15D-20 | 1041 | 24.1% | 753 | 3.5% | 0.298 | 18.3% | 1.327 | 8.7% | 1.908 | 4.0% | 1079 | 3.6% | B + T + F |
| GPB15D-100 | 1348 | 10.4% | 681 | 1.7% | 0.204 | 11.8% | 0.770 | 8.3% | 1.003 | 13.6% | 479 | 15.5% | B + T + F |
| GPB15D-150 | 688 | 16.8% | 443 | 5.2% | 0.261 | 11.9% | 0.849 | 15.3% | 1.636 | 30.9% | 515 | 28.2% | B |
| GPB15D-200 | 671 | 10.6% | 304 | 9.8% | 0.188 | 16.9% | 0.492 | 14.6% | 1.368 | 9.0% | 306 | 5.5% | |
| GPB15D-250 | 670 | 12.5% | 229 | 7.5% | 0.137 | 5.5% | 0.999 | 14.3% | 2.348 | 14.0% | 469 | 20.2% | |
| GPB15D-300 | 706 | 19.3% | 191 | 3.5% | 0.112 | 24.8% | 1.212 | 41.1% | 2.669 | 10.4% | 442 | 11.1% | |
| GPB15D-350 | 613 | 34.7% | 207 | 8.6% | 0.150 | 38.4% | 0.839 | 29.7% | 1.959 | 19.0% | 344 | 24.3% | |
| GPB15D-400 | 412 | 14.0% | 144 | 7.4% | 0.142 | 16.9% | 0.745 | 81.6% | 1.971 | 42.9% | 217 | 42.9% | |
| GPB15D-450 | 323 | 12.6% | 117 | 9.1% | 0.146 | 14.4% | 0.791 | 36.4% | 1.388 | 25.9% | 130 | 30.7% | |
| GPB15D-500 | 318 | 12.5% | 112 | 3.1% | 0.142 | 14.7% | 0.796 | 28.6% | 2.204 | 60.1% | 209 | 68.7% | |
| GPB20D-20 | 1041 | 20.2% | 998 | 3.3% | 0.394 | 20.2% | 1.653 | 10.8% | 2.382 | 12.0% | 1791 | 17.3% | B + T + F |
| GPB20D-100 | 1458 | 5.9% | 928 | 5.5% | 0.255 | 10.3% | 0.971 | 21.5% | 1.304 | 4.6% | 857 | 9.4% | B + T + F |
| GPB20D-150 | 870 | 13.9% | 694 | 5.6% | 0.326 | 20.5% | 1.573 | 17.5% | 1.938 | 10.0% | 949 | 15.9% | B + T + F |
| GPB20D-200 | 864 | 7.7% | 464 | 4.8% | 0.216 | 12.1% | 0.695 | 14.9% | 1.003 | 9.3% | 318 | 10.0% | B |
| GPB20D-250 | 987 | 13.0% | 316 | 3.2% | 0.130 | 16.8% | 0.508 | 23.8% | 2.444 | 15.1% | 628 | 10.8% | |
| GPB20D-300 | 757 | 7.1% | 304 | 9.7% | 0.162 | 16.8% | 0.545 | 35.2% | 2.693 | 16.0% | 686 | 20.3% | |
| GPB20D-350 | 795 | 22.4% | 271 | 13.0% | 0.139 | 13.0% | 0.628 | 5.5% | 1.420 | 17.4% | 321 | 18.2% | |
| GPB20D-400 | 650 | 10.2% | 194 | 9.4% | 0.120 | 12.3% | 0.570 | 17.3% | 1.873 | 11.3% | 310 | 11.2% | |
| GPB20D-450 | 459 | 6.6% | 187 | 8.2% | 0.164 | 14.4% | 0.440 | 17.4% | 0.846 | 27.7% | 110 | 31.4% | |
| GPB20D-500 | 413 | 9.2% | 158 | 10.4% | 0.154 | 17.6% | 0.405 | 12.3% | 0.955 | 26.3% | 109 | 23.7% | |
| Sheathing | Temperature (°C) | Edge Distance of 10 mm | Edge Distance of 15 mm | Edge Distance of 20 mm | ||||||
|---|---|---|---|---|---|---|---|---|---|---|
| a | b | c | a | b | c | a | b | c | ||
| Single-layer gypsum | 20 ≤ T ≤ 80 | 0 | 0 | 1 | 0 | 0 | 1 | 0 | 0 | 1 |
| 80 < T ≤ 250 | 2.73 × 10⁻⁵ | −1.32 × 10⁻² | 1.881 | 2 × 10⁻⁵ | −1.08 × 10⁻² | 1.737 | 2 × 10⁻⁵ | −1.08 × 10⁻² | 1.737 | |
| 250 < T ≤ 500 | 0 | −4.4 × 10⁻⁴ | 3.97 × 10⁻¹ | 0 | −4.4 × 10⁻⁴ | 3.97 × 10⁻¹ | 0 | −4.4 × 10⁻⁴ | 3.97 × 10⁻¹ | |
| Double-layer gypsum | 20 ≤ T ≤ 80 | 0 | 0 | 1 | 0 | 0 | 1 | 0 | 0 | 1 |
| 80 < T ≤ 250 | 2.58 × 10⁻⁵ | −1.266 × 10⁻² | 1.847 | 1.65 × 10⁻⁵ | −9.6 × 10⁻³ | 1.663 | 0 | −4.15 × 10⁻³ | 1.332 | |
| 250 < T ≤ 500 | 0 | −6 × 10⁻⁴ | 4.445 × 10⁻¹ | 0 | −6 × 10⁻⁴ | 4.445 × 10⁻¹ | 0 | −6 × 10⁻⁴ | 4.445 × 10⁻¹ | |
| Sheathing | Edge Distance (mm) | Temperature (°C) | ||
|---|---|---|---|---|
| ≤100 °C | 150 °C | 500 °C | ||
| Single-layer gypsum | 10 ≤ d ≤ 15 | 100% | 50% | 20% |
| d ≥ 20 | 100% | 60% | 30% | |
| Double-layer gypsum | 10 ≤ d ≤ 15 | 100% | 70% | 30% |
| d ≥ 20 | 100% | 90% | 40% | |
| Sheathing | Edge Distance (mm) | A |
|---|---|---|
| Single-layer gypsum | d = 10 | 4 |
| d ≥ 15 | 18 | |
| Double-layer gypsum | d = 10 | 10 |
| d ≥ 15 | 18 |
© 2016 by the authors; licensee MDPI, Basel, Switzerland. This article is an open access article distributed under the terms and conditions of the Creative Commons Attribution (CC-BY) license (http://creativecommons.org/licenses/by/4.0/).
Share and Cite
Chen, W.; Ye, J.; Chen, T. Design of Cold-Formed Steel Screw Connections with Gypsum Sheathing at Ambient and Elevated Temperatures. Appl. Sci. 2016, 6, 248. https://doi.org/10.3390/app6090248
Chen W, Ye J, Chen T. Design of Cold-Formed Steel Screw Connections with Gypsum Sheathing at Ambient and Elevated Temperatures. Applied Sciences. 2016; 6(9):248. https://doi.org/10.3390/app6090248
Chicago/Turabian StyleChen, Wei, Jihong Ye, and Tao Chen. 2016. "Design of Cold-Formed Steel Screw Connections with Gypsum Sheathing at Ambient and Elevated Temperatures" Applied Sciences 6, no. 9: 248. https://doi.org/10.3390/app6090248