Article

Metrics for Polyphonic Sound Event Detection

Department of Signal Processing, Tampere University of Technology, P.O. Box 553, Tampere FI-33101, Finland
*
Author to whom correspondence should be addressed.
Appl. Sci. 2016, 6(6), 162; https://doi.org/10.3390/app6060162
Submission received: 26 February 2016 / Revised: 22 April 2016 / Accepted: 18 May 2016 / Published: 25 May 2016
(This article belongs to the Special Issue Audio Signal Processing)

Abstract

:
This paper presents and discusses various metrics proposed for evaluation of polyphonic sound event detection systems used in realistic situations where there are typically multiple sound sources active simultaneously. The system output in this case contains overlapping events, marked as multiple sounds detected as being active at the same time. The polyphonic system output requires a suitable procedure for evaluation against a reference. Metrics from neighboring fields such as speech recognition and speaker diarization can be used, but they need to be partially redefined to deal with the overlapping events. We present a review of the most common metrics in the field and the way they are adapted and interpreted in the polyphonic case. We discuss segment-based and event-based definitions of each metric and explain the consequences of instance-based and class-based averaging using a case study. In parallel, we provide a toolbox containing implementations of presented metrics.

Graphical Abstract

1. Introduction

Sound event detection is a rapidly developing research field that deals with the complex problem of analyzing and recognizing sounds in general everyday audio environments. It has many applications in surveillance for security, healthcare and wildlife monitoring [1,2,3,4,5,6,7], and audio and video content based indexing and retrieval [8,9,10].
The task of sound event detection involves locating and classifying sounds in audio—estimating onset and offset for distinct sound event instances and providing a textual descriptor for each. In general, sound event detection deals with the problem of detecting multiple sounds in an audio example, in contrast to the typical classification problem that assigns an audio example to one or more classes. Complexity of sound event detection tasks varies, with the simplest one being detection of a sequence of temporally separated sounds [11,12,13,14]. A more complex situation deals with detecting sound events in audio with multiple overlapping sounds, as is usually the case in our everyday environment. In this case, it is possible to perform detection of the most prominent sound event from the number of concurrent sounds at each time [15], or detection of multiple overlapping sound events [16,17,18]. We use the term polyphonic sound event detection for the latter, in contrast to monophonic sound event detection in which the system output is a sequence of non-overlapping sound events.
Quantitative evaluation of the detection accuracy of automatic sound event analysis systems is done by comparing the system output with a reference available for the test data. The reference can be obtained for example by manually annotating audio data [19] or by creating synthetic data and corresponding annotations using isolated sounds [20]. The most common format for the annotations is a list of sound event instances with associated onset and offset. The set of unique event labels form the event classes relevant to the sound event detection task, and evaluation of results takes into account both class name and temporal information. We use the term polyphonic annotation to mark annotations containing sounds that overlap in time.
There is no universally accepted metric for evaluating polyphonic sound event detection performance. For a monophonic annotation and monophonic output of sound event detection system, the system output at a given time is either correct or incorrect if the predicted event class coincides or not with the reference class. In polyphonic sound event detection, the reference at a given time is not a single class, and there can be multiple correctly detected and multiple erroneously detected events at the same time, which must be individually counted. A similar situation is encountered in polyphonic music transcription [21], where at a given time there can be overlapping notes played by different instruments.
In this paper, we review the use of metrics for measuring performance of polyphonic sound event detection, based on adapting metrics from neighboring fields to cope with presence of multiple classes at the same time. Special sessions at recent conferences and the AASP Challenge on Detection and Classification of Acoustic Scenes and Events 2013 [20] and 2016 [22] underline the acute need for defining suitable evaluation metrics. We introduce and analyze the most commonly used metrics and discuss the way they are adapted and interpreted in the case of polyphonic sound event detection. We also discuss the different possibilities for calculating each metric, and their advantages and disadvantages.
This paper is organized as follows: Section 2 presents a background for sound event detection and classification, and the components of a sound event detection system. Section 3 presents definitions of intermediate statistics that are used for computing all metrics, and Section 4 reviews the metrics. Section 5 discusses the choice of metrics when evaluating a sound event detection system and comparing performance of different systems, using a case study example. Finally, Section 6 presents conclusions and future work.

2. Background

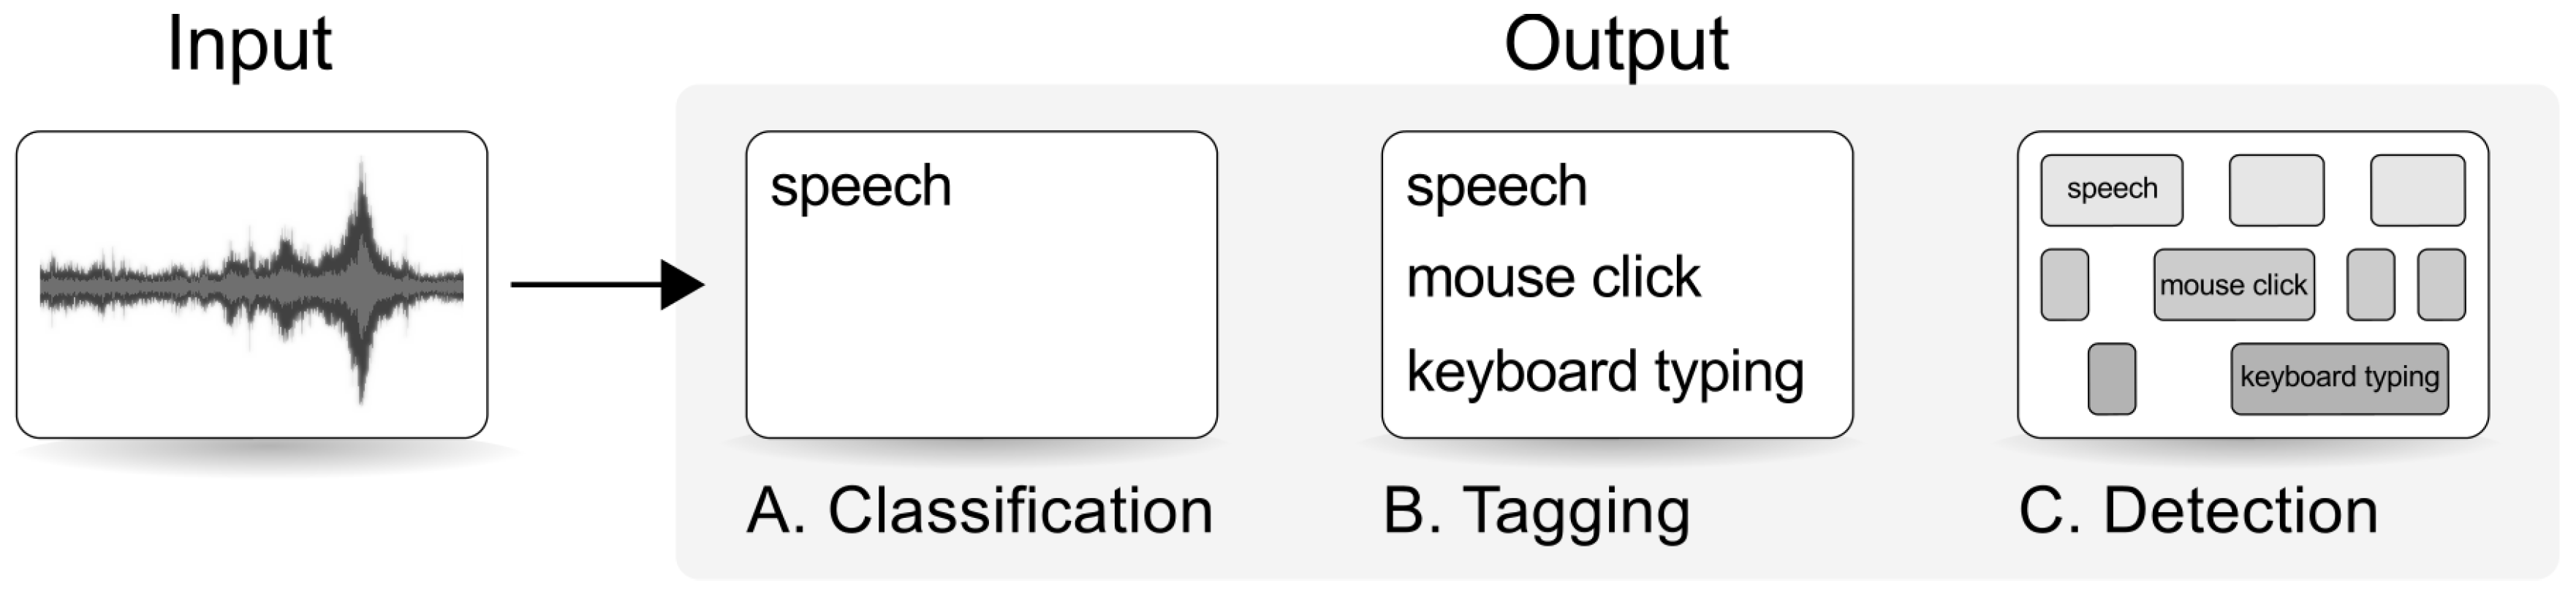
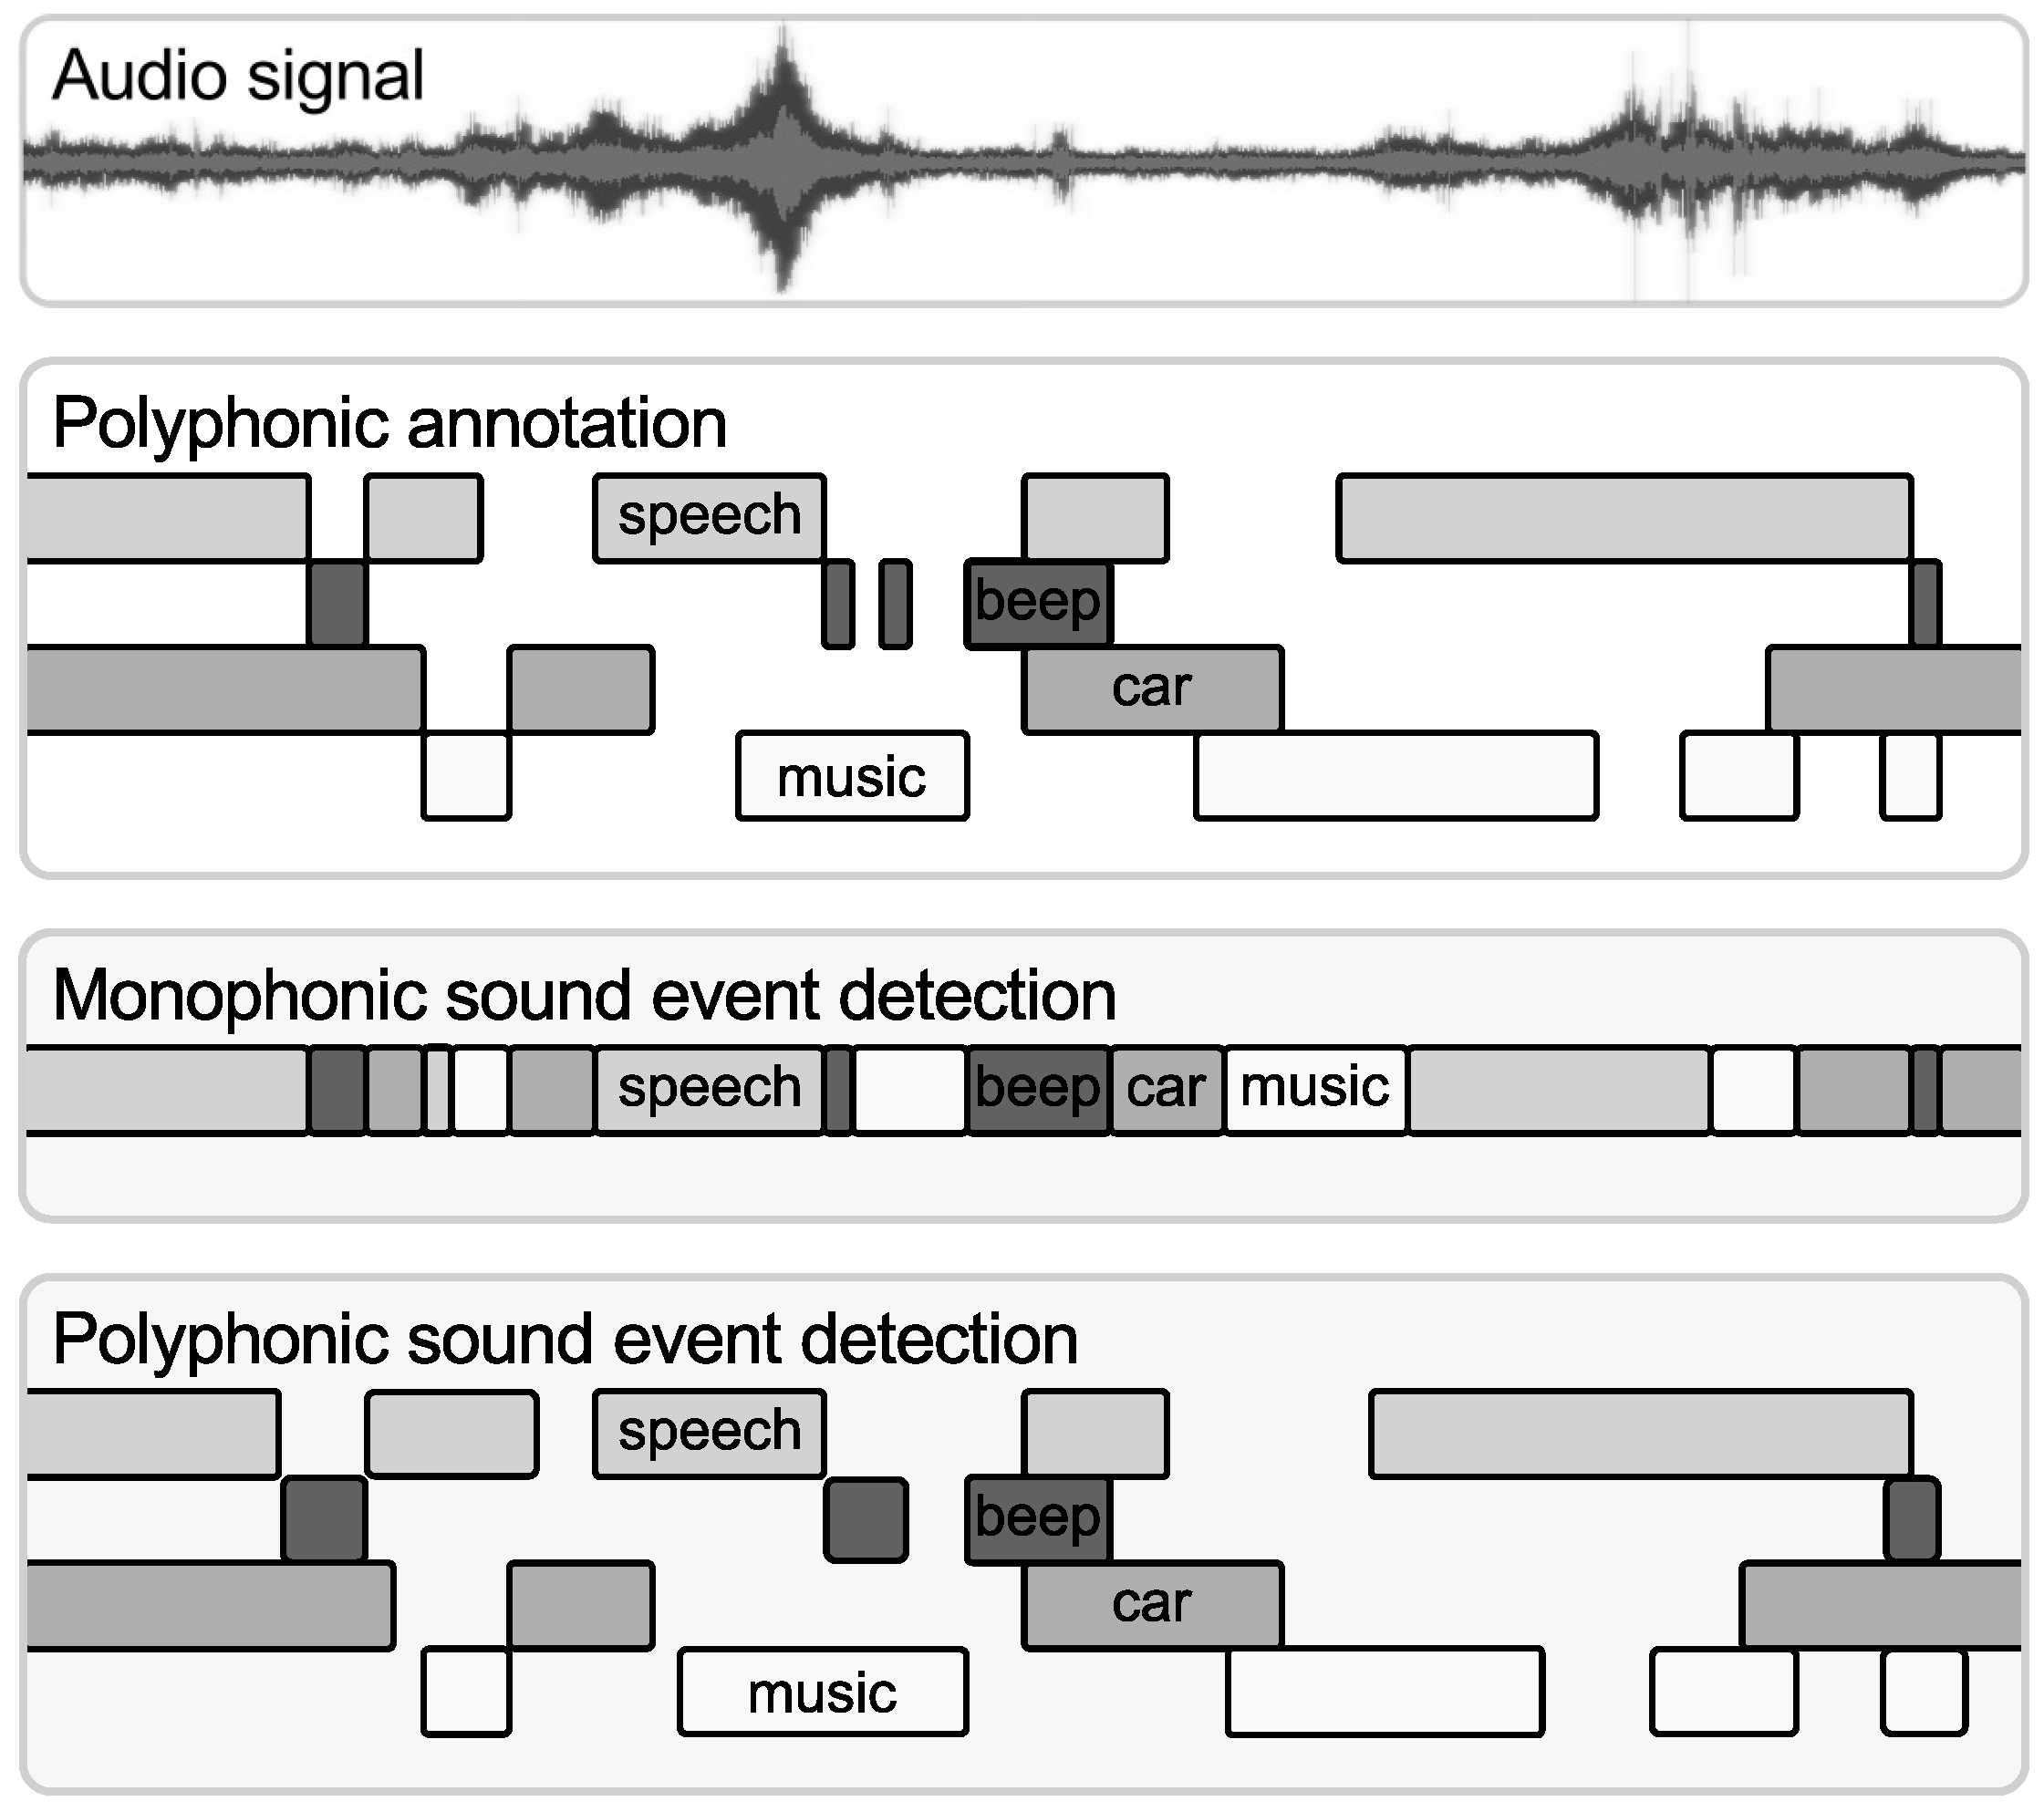
2.1. Classification and Detection of Sound Events

Sound event classification in its simplest form requires assigning an event class label to each test audio, as illustrated in Figure 1A. Classification is performed on audio containing isolated sound events [10,13,14] or containing a target sound event and additional overlapping sounds [23]. In classification, the system output is a class label, and there is no information provided about the temporal boundaries of the sounds. Audio containing multiple, possibly overlapping sounds can be classified into multiple classes—performing audio tagging, illustrated in Figure 1B. Tagging of audio with sound event labels is used for example for improving the tags of Freesound audio samples [24], and has been proposed as an approach for audio surveillance of home environments [25]. Single-label classification is equivalent with tagging, when a single tag is assigned per test file.
Sound event detection requires detection of onsets and offsets in addition to the assignment of class labels, and it usually involves detection of multiple sound events in a test audio. This results in assigning sound event labels to selected segments of the audio as illustrated in Figure 1C. For overlapping sounds these segments overlap, creating a multi-level segmentation of the audio based on the number and temporal location of recognized events. Sound event detection of the most prominent event at each time provides a monophonic output, which is a simplified representation of the polyphonic output. These cases are presented in Figure 2, together with the polyphonic annotation of the audio. Polyphonic sound event detection can be seen as a frame by frame multi-class and multi-label classification of the test audio. In this respect, polyphonic sound event detection is similar to polyphonic music transcription, with sound events equivalent to musical notes, and the polyphonic annotation similar to the piano roll representation of music.

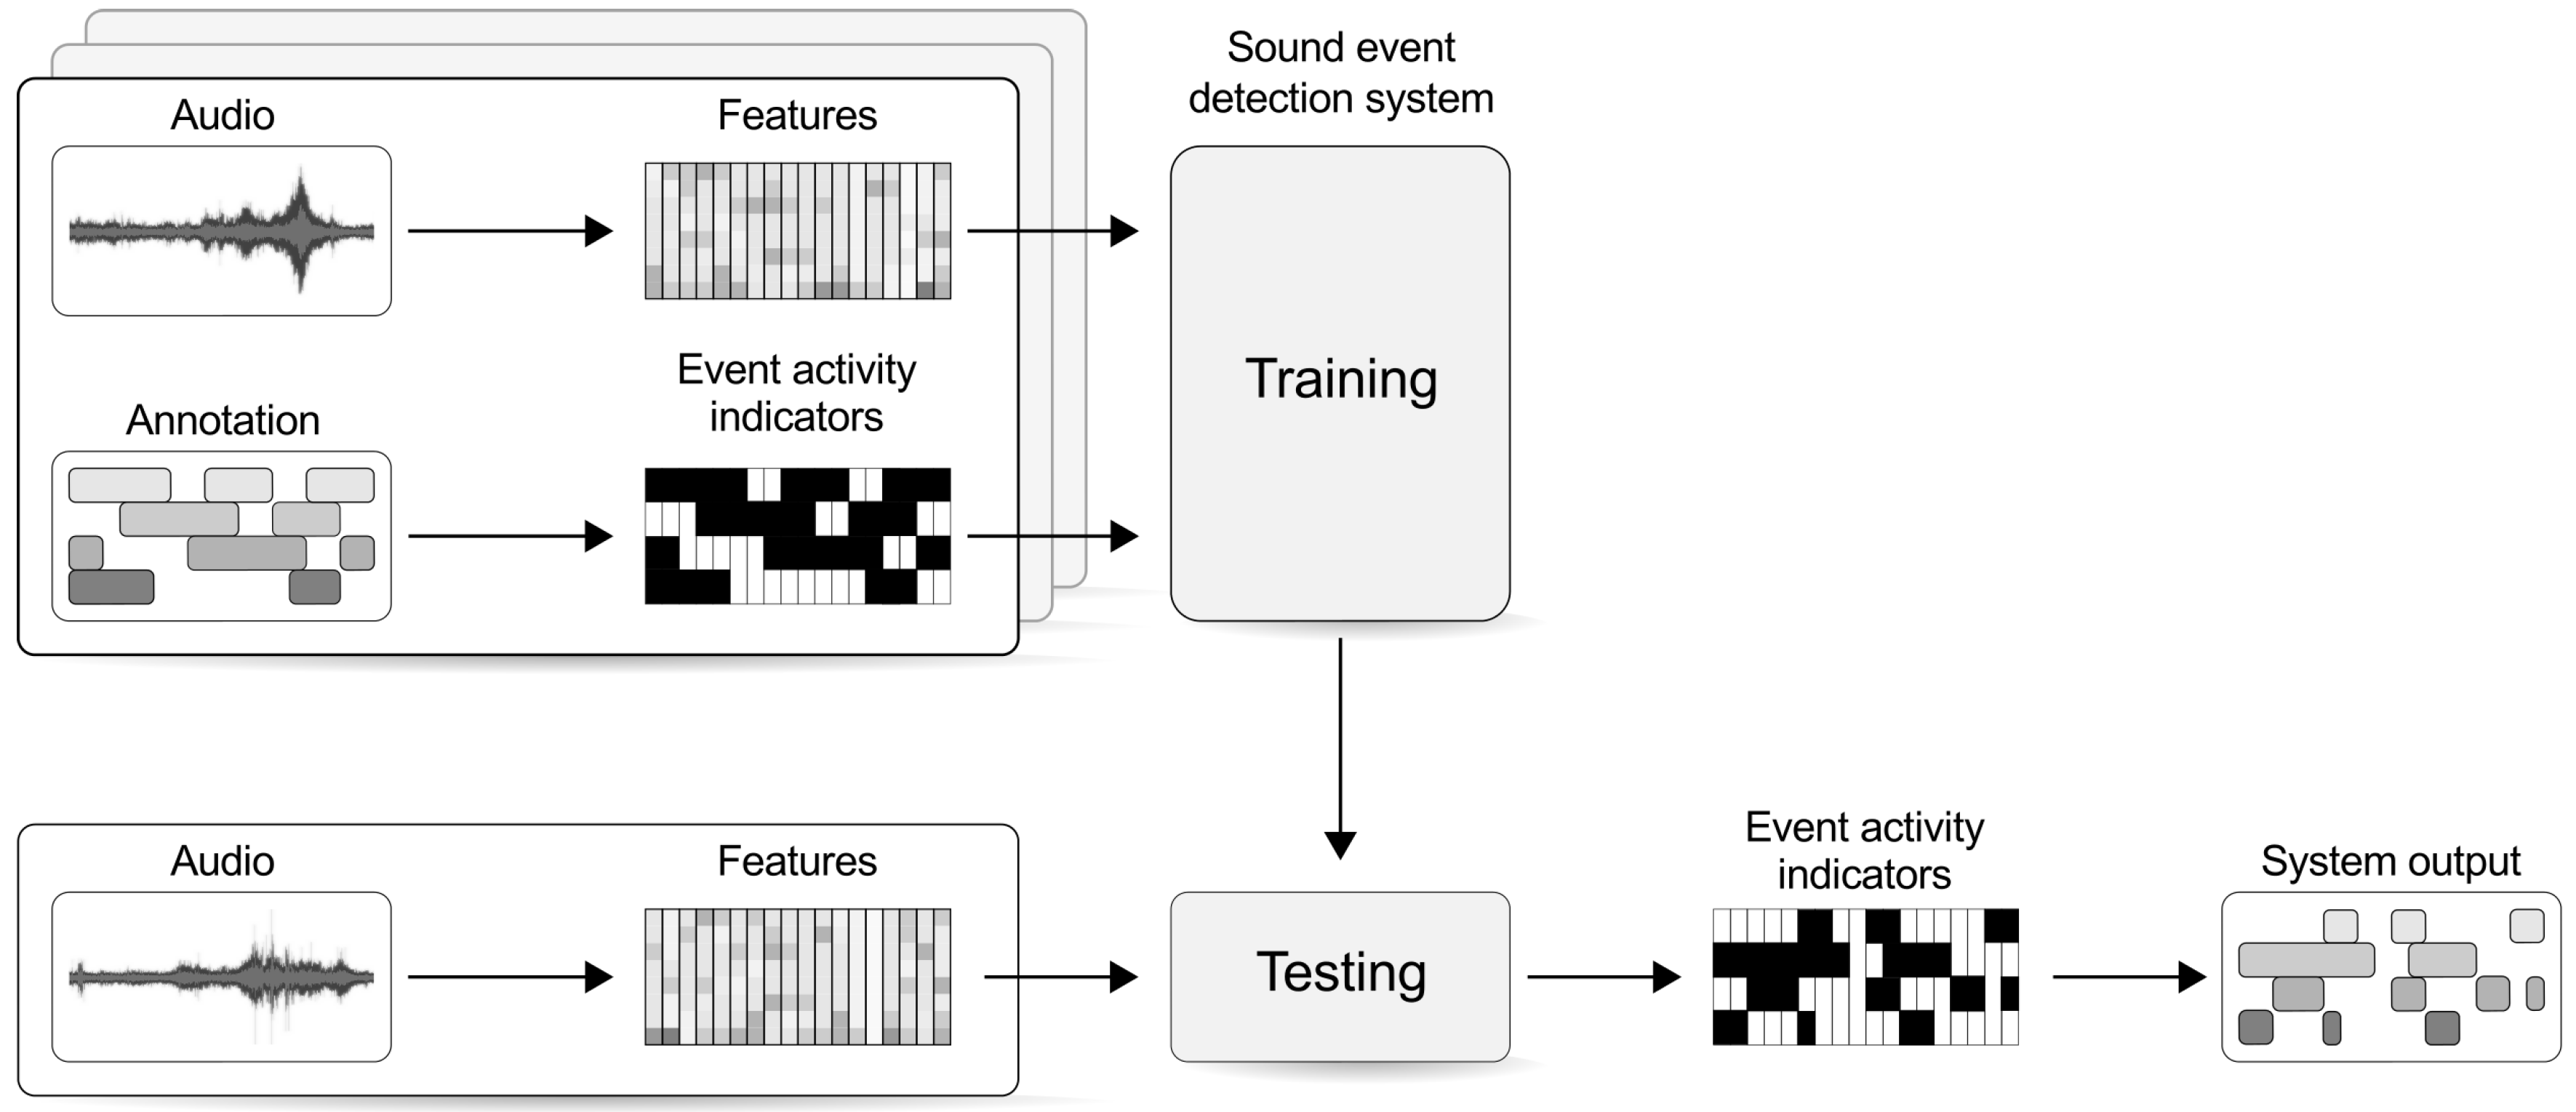
2.2. Building a Polyphonic Sound Event Detection System
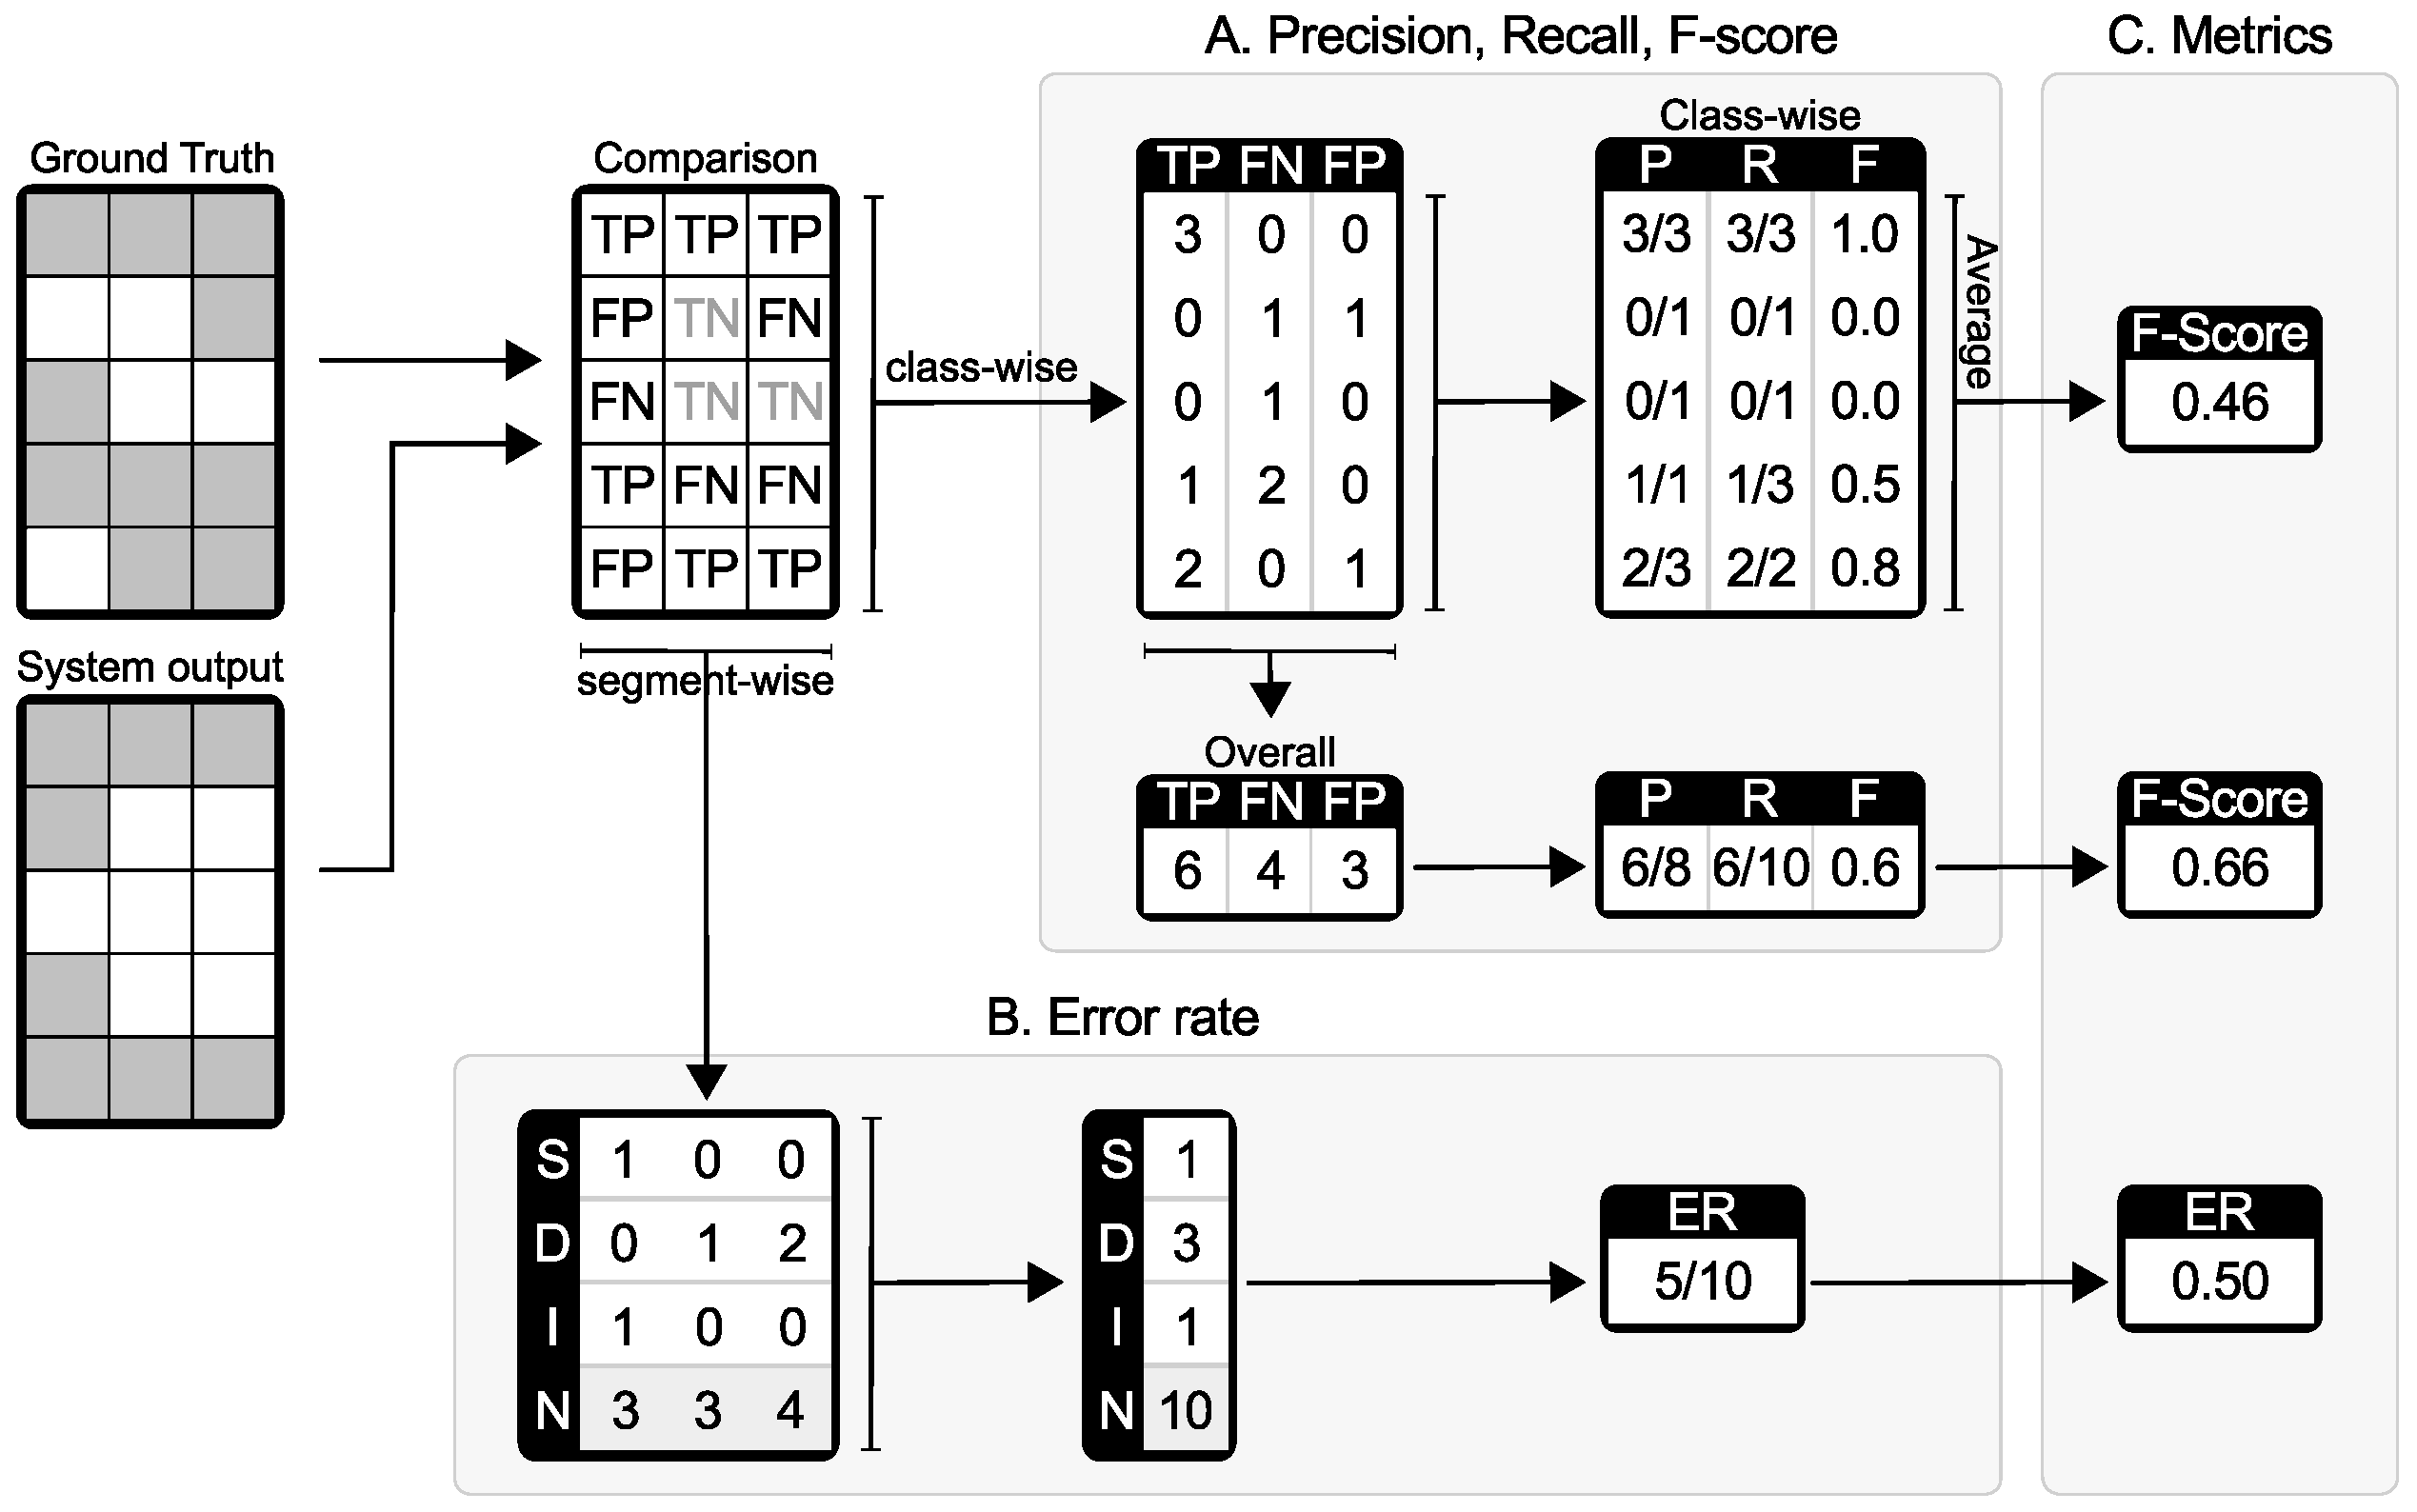
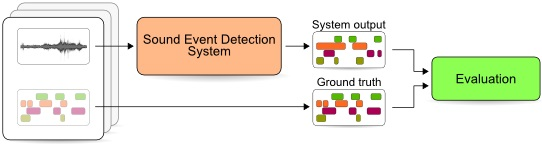
In a multisource environment such as our everyday acoustic environment, multiple different sound sources can be active at the same time. For such data, the annotation contains overlapping event instances as illustrated in Figure 2, with each event instance having an associated onset, offset and label. The label is a textual description of the sound, such as “speech”, “beep”, “music”. Sound event detection is treated as a supervised learning problem, with the event classes being defined in advance, and all the sound instances used in training belong to one of these event classes. The aim of sound event detection is to provide a description of the acoustic input that is as close as possible to the reference. In this case, the requirement is for the sound event detection system to output information consisting of detected sound event instances, having an associated onset, offset, and a textual label that belongs to one of the learned event classes.
The stages of a sound event detection system are illustrated in Figure 3. The training chain involves processing of audio and annotations, and the sound event detection system training. Acoustic features are extracted from audio, and the training stage finds the mapping between acoustic features and sound event activities given by the annotations. The testing chain involves processing of test audio in the same way as for training, the testing of the system, and, if needed, postprocessing of the system output for obtaining a representation similar to the annotations.
The audio is processed in short frames of typically 20–200 ms to extract the audio features of choice. Often used in sound event detection are representations of the signal spectrum, such as mel-frequency cepstral coefficients [25,26], mel energies [17,27], or simply the amplitude or power spectrum [18,28]. The audio processing chain may include simple preprocessing of audio such as normalization and pre-emphasis before feature extraction, or more complex preprocessing such as sound source separation and acoustic stream selection for reducing the complexity of audio mixtures used in training [16]. The annotations are processed to obtain a representation suitable for the training method. In the illustrated example, the annotations are processed to obtain a binary activity representation that provides the class activity information for each frame in the system training.
Training uses the obtained audio features and the corresponding target output given by the reference for supervised learning. Possible learning approaches for this step include Gaussian mixture models [25], hidden Markov models [26], non-negative dictionaries [17], deep neural networks [18], etc. For testing, an audio recording goes through the same preprocessing and feature extraction process as applied in the training stage. Afterwards, the trained system is used to map the audio features to event class likelihoods or direct decisions, according to the employed method. A further step for postprocessing the system output may be needed for smoothing the output and obtaining a binary activity representation for the estimated event classes. Smoothing methods used include median filtering [27], use of a set length decision making window, majority voting, etc., while binarization is usually obtained by using a threshold [17,27].

2.3. Evaluation

Evaluation is done by comparing the system output with a reference available for the test data. Systems performing sound event classification are usually evaluated in terms of accuracy [2,4,5,11,13,14]. Studies involving both monophonic and polyphonic sound event detection report results using a variety of metrics, for example Precision, Recall and F-score [6] or only F-score [7,26], recognition rate and false positive rate [3], or false positive and false negative rates [1]. One of the first evaluation campaigns for sound event detection (CLEAR 2007) used the acoustic event error rate as the evaluation metric, expressed as time percentage [29]. In this case, however, the system output was expected to be monophonic, while the ground truth was polyphonic. Later, acoustic event error rate was redefined for frame-based calculation, and used for example in DCASE 2013 [20], while a similarly defined error rate was used as a secondary metric in MIREX Multiple Fundamental Frequency Estimation and Tracking task [30].
These metrics are well established in different research areas, but the temporal overlap in polyphonic sound event detection leads to changes in their calculation or interpretation. Simple metrics that count numbers of correct predictions, used in classification and information retrieval, must be defined to consider multiple classes at the same time. The evaluation of systems from neighboring fields of speech recognition and diarization dynamically align the system output with the ground truth, and evaluate the degree of misalignment between them. Polyphonic annotation and system output cannot be aligned in a unique way, therefore the error rate defined based on this misalignment must be adapted to the situation. In a similar way, evaluation of polyphonic music transcription uses metrics with modified definitions to account for overlapping notes played by different instruments.
Obtaining the reference necessary for training and evaluation of sound event detection systems is not a trivial task. One way to obtain annotated data is to create synthetic mixtures using isolated sound events—possibly allowing control of signal-to-noise ratio and amount of overlapping sounds [31]. This method has the advantage of being efficient and providing a detailed and exact reference, close to a true ground truth. However, synthetic mixtures cannot model the variability encountered in real life, where there is no control over the number and type of sound sources and their degree of overlapping.
Real-life audio data is easy to collect, but very time consuming to annotate. Currently, there are only few, rather small, public datasets consisting of real-world recordings with polyphonic annotations. DARES data [19] is one such example, but ill-suited for sound event detection due to the high amount of classes compared to amount of examples (around 3200 sound event instances belonging to over 700 classes). CLEAR evaluation data [29] is commercially available and contains audio recorded in controlled conditions in a meeting environment. TUT Sound Events [32] has recently been published for DCASE 2016 and contains sound events annotated using freely chosen labels. Nouns were used to characterize each sound source, and verbs to characterize the sound production mechanism, whenever this was possible, while the onset and offset locations were marked to match the perceived temporal location of the sounds. As a consequence, the obtained manual annotations are highly subjective.
For this type of data, no annotator agreement studies are available. One recent study on inter-annotator agreement is presented in [25], for tagging of audio recorded in a home environment. Their annotation approach associated multiple labels to each 4-s segment from the audio recordings, based on a set of 7 labels associated with sound sources present. With three annotators, they obtained three sets of multi-label annotations per segment. The work does not address subjectivity of temporally delimiting the labeled sounds. The authors observed strong inter-annotator agreement about labels “child speech”, “male speech”, “female speech” and “video game/TV”, but relatively low agreement about “percussive sounds”, “broadband noise”, “other identifiable sounds” and “silence/background”. The results suggest that annotators have difficulty assigning labels to ambiguous sound sources. Considering the more general task of sound event detection with a large number of classes, there is no sufficient data generated by multiple annotators to facilitate inter-annotator agreement assessment. For the purpose of this study, we consider the subjective manual annotation or automatically generated synthetic annotation as correct, and use it as a reference to evaluate the system performance.
Evaluation of the system output can be done at different stages illustrated in the example in Figure 3. It is possible to compare the event activity matrix obtained after preprocessing the annotation and the system output in the same form. If the system output is further transformed into separate event instances as in the annotations, the comparison can be performed at the level of individual events.

3. Intermediate Statistics and Averaging Options

The comparison between the system output and reference can be done in fixed length intervals or at event-instance level, as explained in the previous section. This results in two different ways of measuring performance: segment-based metrics and event-based metrics. For each, we need to define what constitutes correct detection and what type of errors the system produces. We refer to these as intermediate statistics that count separately the correct and erroneous outputs of the system, and we define them based on the polyphonic nature of the problem.

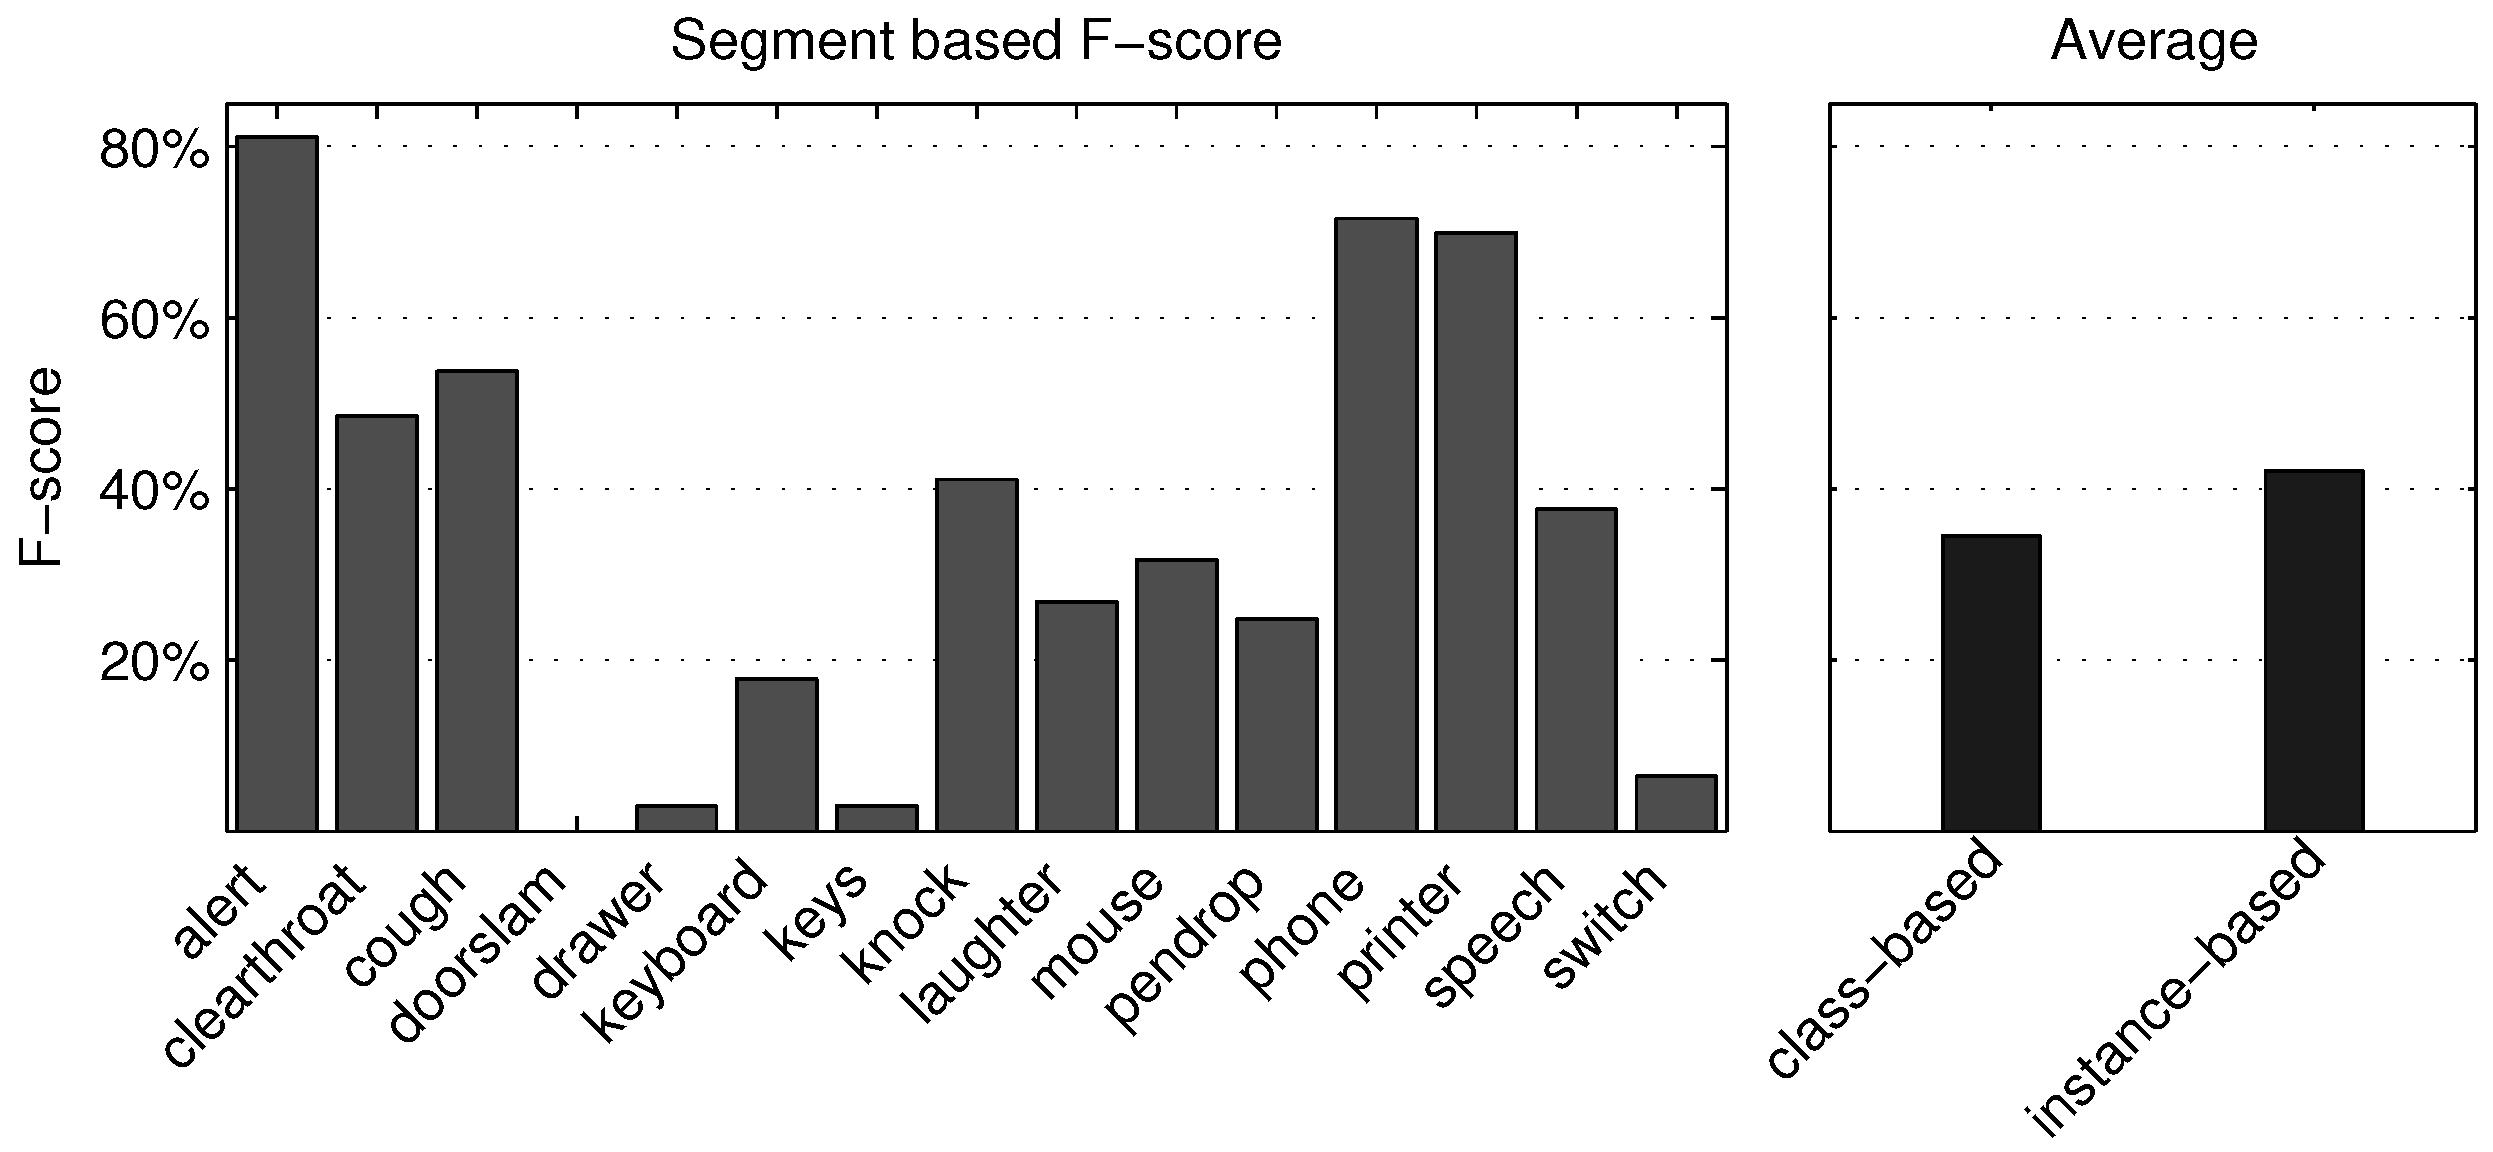
3.1. Segment-Based Metrics

Segment-based metrics compare system output and reference in short time segments. Active/inactive state for each event class is determined in a fixed length interval that represents a segment. Based on the activity representation, the following intermediate statistics are defined:
  • true positive: the reference and system output both indicate an event to be active in that segment;
  • false positive: the reference indicates an event to be inactive in that segment, but the system output indicates it as active;
  • false negative: the reference indicates an event to be active in that segment, but the system output indicates it as inactive.
Some metrics also count true negatives: when the reference and system output both indicate an event to be inactive. Total counts of true positives, false positives, false negatives and true negatives are denoted as TP, FP, FN, and TN, respectively.
The size of the time interval can be chosen based on the desired resolution needed for the application. For example, in [31] a segment of 100 ms was proposed, and the metric was referred to as frame-based. In [26] a length of one second was suggested, for calculating the metrics on longer time segments than the typical frame length used in analysis. By using a longer segment for evaluation, the activity indicator covers a longer chunk of audio, allowing a degree of misalignment between the reference and the system output. This alleviates issues related to annotator subjectivity in marking onset and offset of sound events.

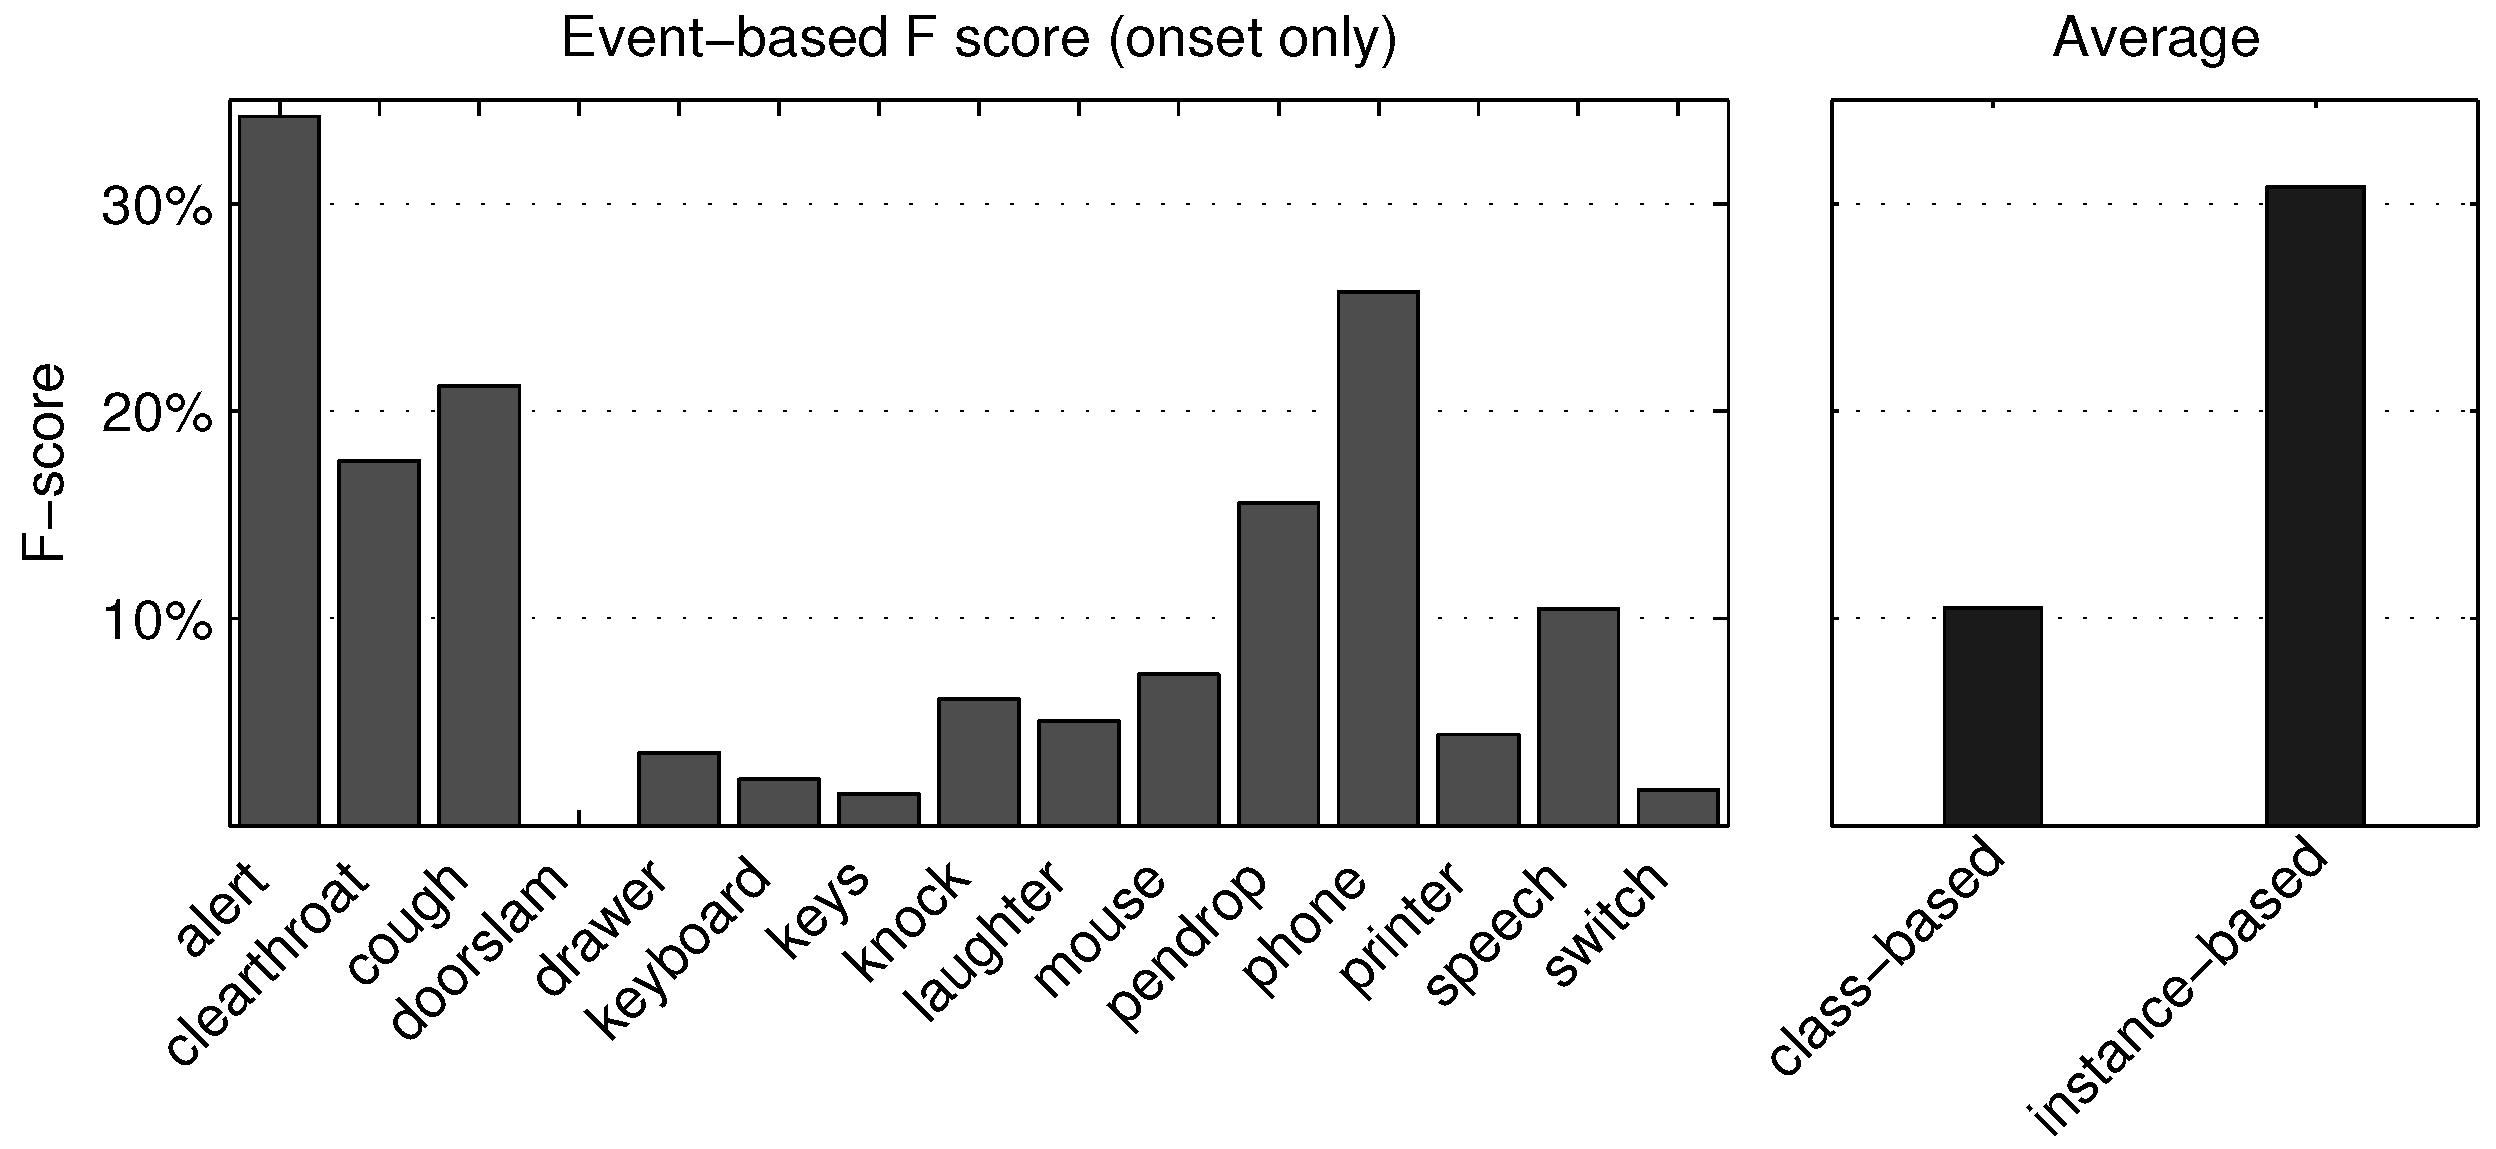
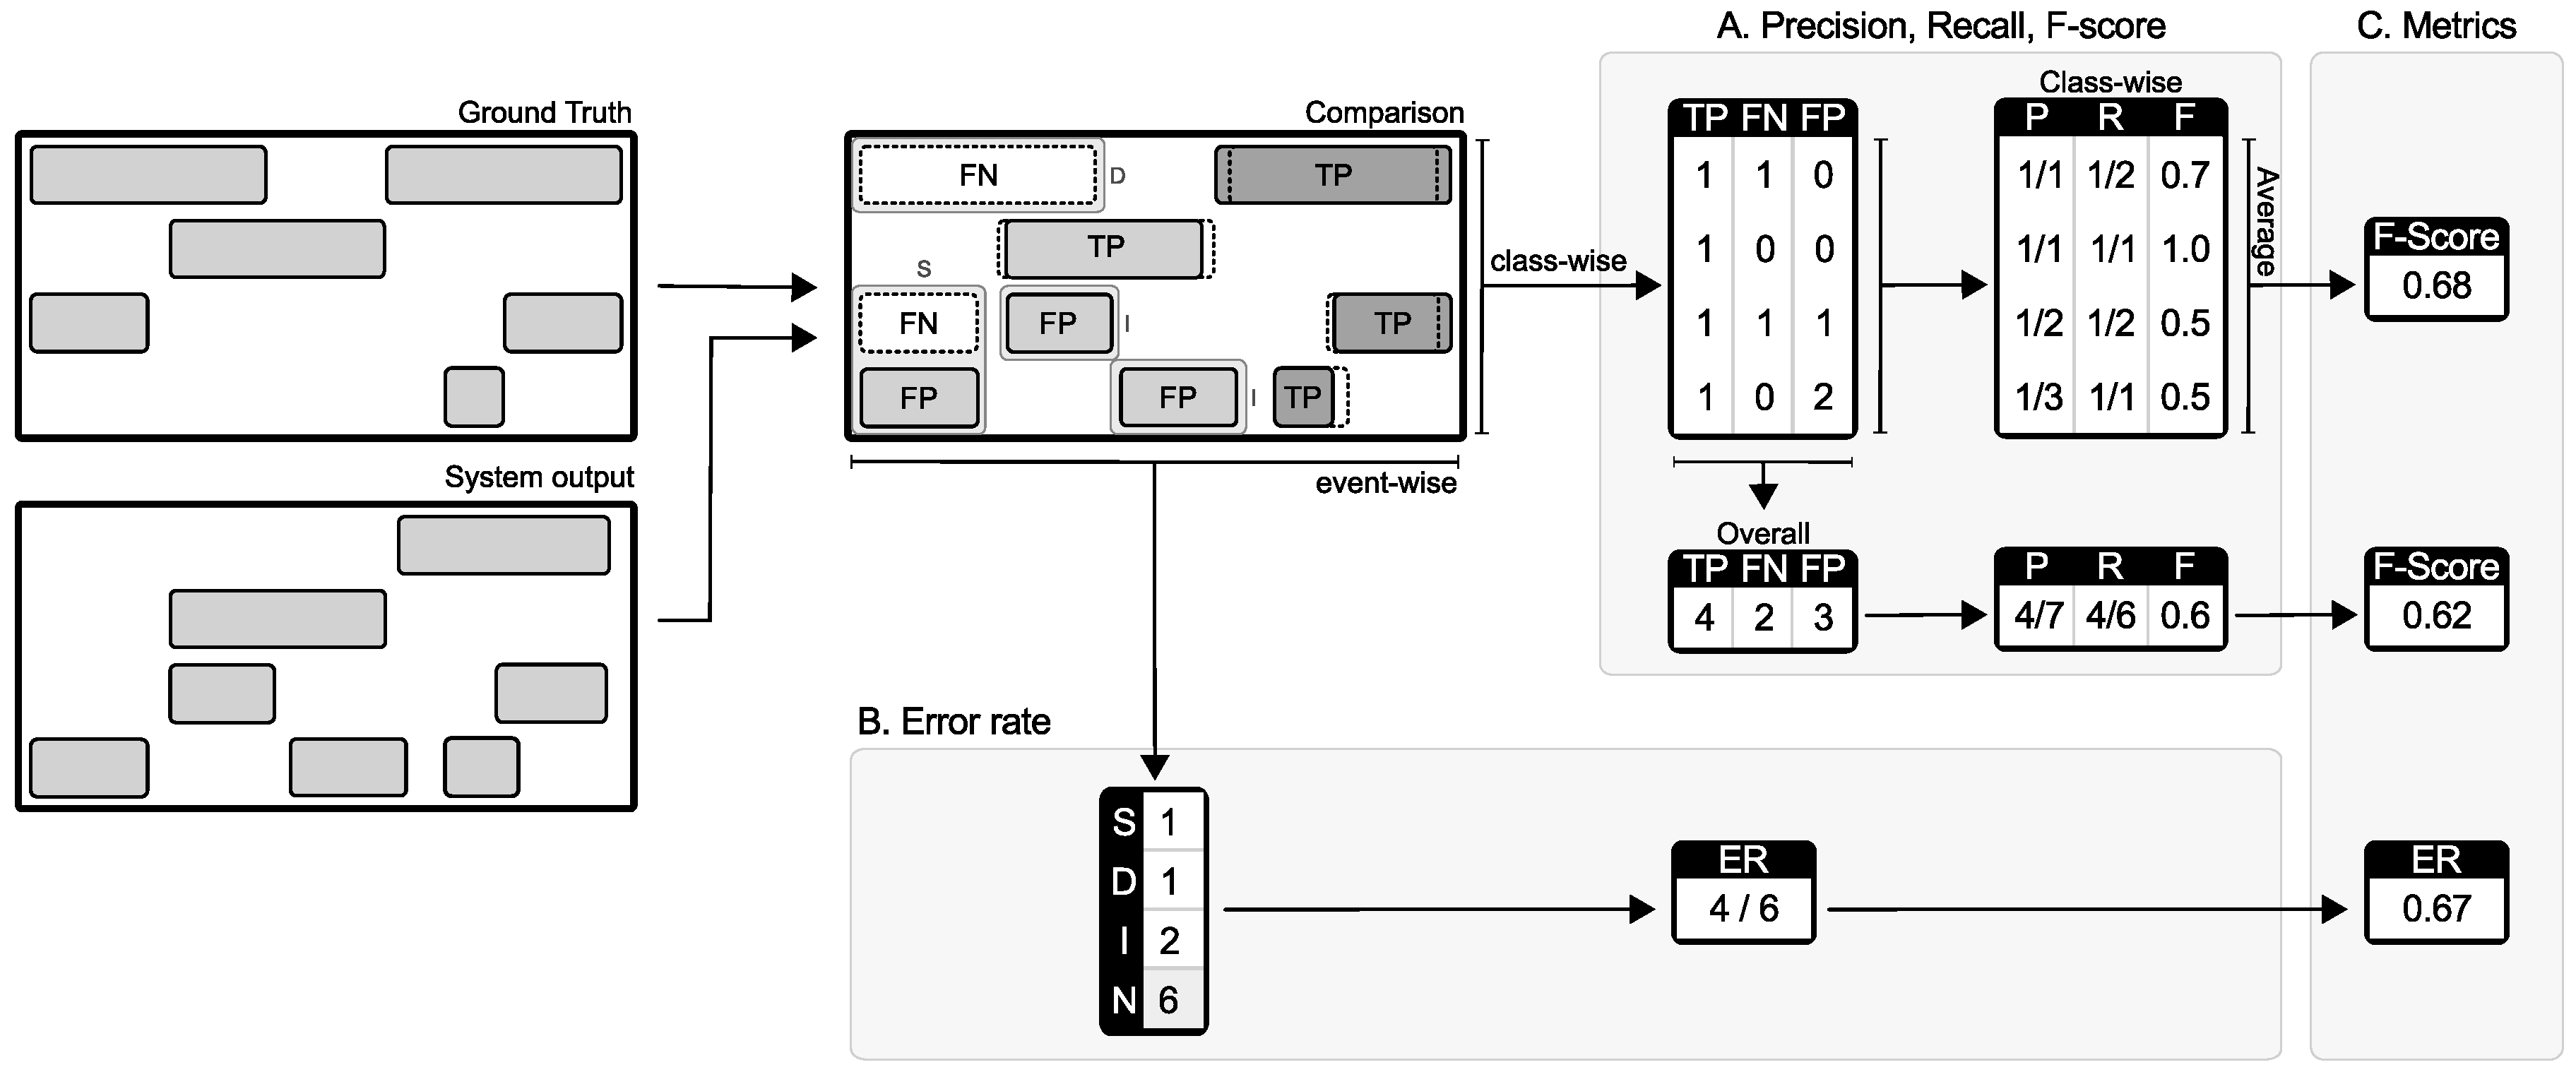
3.2. Event-Based Metrics

Event-based metrics compare system output and corresponding reference event by event. The intermediate statistics are defined as follows:
  • true positive: an event in the system output that has a temporal position overlapping with the temporal position of an event with the same label in the reference. A collar is usually allowed for the onset and offset, or a tolerance with respect to the reference event duration.
  • false positive: an event in the system output that has no correspondence to an event with same label in the reference within the allowed tolerance;
  • false negative: an event in the reference that has no correspondence to an event with same label in the system output within the allowed tolerance.
Event-based metrics have no meaningful true negatives, except in the case when measuring actual temporal errors in terms of length, in which case the total length of time segments where both system output and reference contain no active events is measured. The tolerance can be chosen depending on the desired resolution. For example in speaker diarization it was estimated that a ±250 ms collar is sufficient to account for inexact labeling of the data. In DCASE 2103 [31], the collar value was ±100 ms. The tolerance allowed for offset was the same ±100 ms collar or 50% of the reference event duration. The offset condition covers differences between very short and very long sound events, allowing long sound events to be considered correctly detected even if their offset is not within ±100 ms from the corresponding reference event.

3.3. Averaging Options in Calculating Metrics

Intermediate statistics can be aggregated in different ways: globally-irrespective of classes, or in two steps: first class-wise, then as an average over the results of the individual classes [33]. Highly unbalanced classes or individual class performance can result in very different overall performance when calculated with the two averaging methods.
Instance-based averaging or micro-averaging gives equal weight to each individual decision. In this case, each sound event instance (in event-based metrics) or active instance per segment (in segment-based metrics) has equal influence on the system performance. The number of true positives ( T P ), the number of false positives ( F P ) and the number of false negatives ( F N ) are aggregated over the entire test data, and the metrics are calculated based on the overall values. This results in performance values that are mostly affected by the performance on the larger classes in the considered problem.
Class-based averaging or macro-averaging gives equal weight to each class. Performance of the system on individual classes has equal influence on the overall system performance—in this case, the intermediate statistics are aggregated separately for each event class over the test data. Aggregated class-wise counts ( T P , F P , F N ) are used to calculate class-wise metrics. The overall performance is then calculated as the average of class-wise performance. This results in values that emphasize the system behavior on the smaller classes in the considered problem.

3.4. Cross-Validation

An important aspect of comparison and reproducibility of results is the experimental and cross-validation setup. Besides the measurement bias under high class imbalance, in multi-class problems it is not always possible to ensure that all classes are represented in every fold [34]. Missing classes will result in division by zero in calculations of some metrics. To avoid such situations, the recommendation is to count the total number of true positives and false positives over the folds, then compute the metrics [35]. This also avoids differences in the overall average values that arise from averaging over different subsets of the tested categories—such as differently splitting the data into train/test folds. In this respect, the cross-validation folds should be treated as a single experiment, with calculation of final metrics only after testing all folds. This ensures that the metrics are consistently calculated over the same data.

4. Metrics for Polyphonic Evaluation

4.1. Precision, Recall and F-Score

Precision (P) and Recall (R) were introduced in [36] for information retrieval purposes, together with the F-score derived as a measure of effectiveness of retrieval. They are defined as:
P = T P T P + F P , R = T P T P + F N
Precision and Recall are the preferred metrics in information retrieval, but are used also in classification under the names positive prediction value and sensitivity, respectively. Adapting these metrics to polyphonic data is straightforward based on the definitions of the intermediate statistics. F-score is calculated based on P and R:
F = 2 · P · R P + R
or, alternatively, based on the intermediate measures:
F = 2 · T P 2 · T P + F P + F N
Segment-based P, R and F are calculated based on the segment-based intermediate statistics, using instance-based averaging or class-based averaging. The calculation is illustrated in Figure 4, panel A. Event-based P, R and F are calculated the same way from the event-based intermediate statistics. The calculation is illustrated in Figure 5, panel A. Similarly defined event-based P, R, F are also used for evaluating polyphonic music transcription, with events being the musical notes [21].
The advantage of using F-score for evaluating sound event detection performance is that it is widely known and easy to understand. Its most important drawback is that the choice of averaging is especially important. Because the magnitude of F-score is mostly determined by the number of true positives, in instance-based averaging large classes dominate small classes. In class-based averaging it is necessary to ensure presence of all classes in the test data, to avoid cases when recall is undefined (when T P + F N = 0 ). Any dataset of real-world recordings will most likely have unbalanced event classes, so the choice of averaging will be always an important factor.

4.2. Error Rate

Error rate measures the amount of errors in terms of insertions (I), deletions (D) and substitutions (S). To calculate segment-based error rate, errors are counted segment by segment. In a segment k, the number of substitution errors S ( k ) is the number of reference events for which a correct event was not output, yet something else was. This is obtained by pairing false positives and false negatives, without designating which erroneous event substitutes which. The remaining events are insertions and deletions: D ( k ) —the number of reference events that were not correctly identified (false negatives after substitutions are accounted for) and I ( k ) —the number of events in system output that are not correct (false positives after substitutions are accounted for). This leads to the following formula:
S ( k ) = m i n ( F N ( k ) , F P ( k ) ) D ( k ) = m a x ( 0 , F N ( k ) - F P ( k ) ) I ( k ) = m a x ( 0 , F P ( k ) - F N ( k ) )
Total error rate is calculated by integrating segment-wise counts over the total number of segments K, with N ( k ) being the number of sound events marked as active in the reference in segment k:
E R = k = 1 K S ( k ) + k = 1 K D ( k ) + k = 1 K I ( k ) k = 1 K N ( k )
The calculation is illustrated in Figure 4, panel B. A similar calculation of error rate for polyphonic detection was used in evaluating multi-pitch transcription in MIREX [30] and sound event detection in DCASE 2013 [20].
The event-based error rate is defined with respect to the sound events, by taking into account temporal position and label of each sound event in system output compared to the ones in the reference. Sound events with correct temporal position but incorrect class label are counted as substitutions, while insertions and deletions are the sound events unaccounted for as correct or substituted in system output or reference, respectively. Overall error rate is calculated according to Equation (5) based on the error counts. This calculation is illustrated in Figure 5, panel B. Class-wise measures of error rate (segment or event based) aggregate error counts individually for each sound event class, therefore they cannot account for substitutions, but can count only insertions and deletions.
In other specific sound recognition areas, error rate is defined differently to reflect the target of the evaluation. In speech recognition, Word Error Rate is defined with respect to word sequences, defining an insertion as a word present in the output but not in the reference, a deletion as a word present in the reference but not in the output, and a substitution as a word in the reference erroneously recognized (different word in the output). In practice, one substitution represents one insertion and one deletion (one word is missed, another inserted). Because N is the number of words in the reference, the word error rate can be larger than 1.0.
In speaker diarization, the error rate measures the fraction of time that is not attributed correctly to a speaker or to non-speech. Temporal errors are: S—the percentage of scored time that a speaker ID is assigned to the wrong speaker, I—the percentage of scored time that a non-speech segment from the reference is assigned to a hypothesized speaker, and D—the percentage of scored time that a speaker segment from the reference is assigned to non-speech. The total error is measured as the fraction of temporal error with respect to the total time of reference speech. This error rate was used for evaluating sound event detection in [29], after the multi-label reference was projected to single label for comparison with single label system output. The temporal error was calculated as in speaker diarization, with event classes instead of speaker ID.
The advantage of using total error rate to measure performance in polyphonic sound event detection is the parallel to established metrics in speech recognition and speaker diarization evaluation. Its disadvantage is that, being a score rather than a percentage, it can be over 1 in cases when the system makes more errors than correct predictions. This makes interpretation difficult, considering that it is trivial to obtain an error rate of 1 by outputting no active events.

4.3. Other Metrics

Sensitivity and specificity represent the true positive rate and true negative rate, respectively. They are used as a pair, to illustrate the trade-off between the two measured components.
Sensitivity = T P T P + F N Specificity = T N T N + F P
A related measure is given by the Receiver Operating Characteristic (ROC) curve and Area Under the Curve (AUC). A ROC curve plots true positive rate vs. false positive rate, i.e., sensitivity vs (1-specificity) at various thresholds. AUC allows summarizing the ROC curve into a single number, and is often used for comparing performance of binary classifiers. AUC was used to evaluate sound classification performance in [25] for a multi-label task by using binary classifiers for each class and calculating the average of the class-wise AUC values.
Accuracy measures how often the classifier takes the correct decision, as the ratio between the number of correct system outputs and the total number of outputs.
A C C = T P + T N T P + T N + F P + F N
Accuracy does not characterize well the ability of the system to detect the true positives: when the events’ activity is sparse, the count of true negatives will dominate the accuracy value. It is possible to assign weights to T P and T N , obtaining the balanced accuracy:
B A C C = w · T P T P + F N + ( 1 - w ) · T N T N + F P
With equal weights ( w = 0 . 5 ), the balanced accuracy is the arithmetic mean of sensitivity and specificity. Specificity, accuracy and balanced accuracy are not defined in the event-based calculation, as there is no available count of true negatives.
Another definition for accuracy has been proposed in [37] for music transcription, and can be easily generalized for both segment-based and event-based sound event detection cases. It was defined as:
A C C M I R = T P T P + F P + F N
by discarding T N from Equation (7). A related metric is Mean Overlap Ratio [38] that was used to measure the average temporal overlap between correctly transcribed and reference notes. This is a temporal measure of accuracy as defined by Equation (9), as it measures the amount of overlap time—true positive duration—w.r.t. combined duration of the reference and output event—which for misaligned onsets and offsets consists of false negative, true positive and false positive durations. Mean overlap ratio for missed or inserted events is 0, leading to very low overall average for systems that output many errors, as is the case with polyphonic sound event detection systems at the moment.
Another accuracy measure is the Relative Correct Overlap used in chord transcription, measuring the proportion of the system output that matches the reference as relative frame count [39] or in seconds [40]. Because chords are combinations of individual notes, this metric measures frame-based accuracy of certain combinations of classes. In polyphonic sound event detection, this measure would represent the proportion of frames or time when the system detects correctly all events active in the reference. However, combinations of sound events have no specific meaning for the detection task, therefore such a measure is not conceptually meaningful for it.
Accuracy variants defined by Equations (7)–(9) have the advantage of being bounded between 0 and 1, with 1 in the case when the system makes no errors. The expressions in Equations (7) and (8) reach 0 when the system output contains only errors, while Equation (9) is 0 also when the system outputs nothing, as its value is not linked to the true negatives. Accuracy does not provide any information on the trade-off between the error types, which may be considered a disadvantage in certain situations. At the same time, it is capable of counting only insertions and deletions, while in some applications it is preferable to count substitutions.

4.4. Toolbox for Sound Event Detection Evaluation

Implementations of the presented metrics and variations for their calculation are provided as an open source software toolbox called sed_eval [41], implemented in Python. The toolbox aims to provide a transparent and uniform implementation of metrics. The toolbox contains segment-based calculation of precision, recall/sensitivity, F-score, specificity, error rate, accuracy, and balanced accuracy with chosen weight on the true positive rate and true negative rate, with instance-based and class-based averaging. Segment-based metrics can be calculated using the preferred segment length as a parameter. The toolbox also contains event-based calculation of precision, recall, F-score and error rate, with instance-based and class-based averaging. The event-based metrics can be calculated using the preferred collar size as a parameter, and using onset only comparison or onset and offset comparison.

5. Choosing a Metric

As a general issue of evaluating machine learning algorithms, the measure of performance would reflect the aim related to applicability of the proposed method. It is difficult to choose a measure without knowing the future usage of the system for example in terms of costs of missed events and false alarms, in which case using a single measure may provide an incomplete analysis of the results. One solution is to use a number of different metrics, in order to provide views of the multiple aspects. Often the different measures disagree, since each measure focuses on a different aspect of performance, in which case it may be impossible to draw a clear conclusion [42].

5.1. Measuring Performance of a System

We present an example illustrating how the different metrics and averaging options result in very different values, and discuss the meaning of each. The provided example is the output of the system presented in [28], using the development set of Office Synthetic task from DCASE 2013 in a leave-one out setup. The available data contains nine files at three different SNRs (−6 dB, 0 dB, 6 dB) and three different event densities (low, medium, high). The system uses coupled matrix factorization to learn dictionaries based on the spectral representation of the audio and the corresponding frame-based binary activity matrix. Based on the learned dictionaries, the system outputs an estimated activity of events classes. A complete description of the system can be found in [28].
The performance of the system is measured with evaluation parameters used in DCASE 2013 (10 ms segment for segment-based metrics, 100 ms collar for event-based metrics) and the ones proposed for DCASE 2016 (1 s segment for segment-based metrics, 250 ms collar for event-based metrics), to illustrate the differences in the choice of evaluation parameters.

5.1.1. Segment-Based Metrics

Segment-based metrics are presented in Table 1. Both instance-based and class-based averaging calculation methods are presented, to illustrate the effect of the averaging method on the metrics values. Detailed class-wise F-score is presented in Figure 6 for an evaluation segment of length 10 ms.
The averaging method influences the values of most metrics. The difference in F-score between instance-based and class-based averaging comes from the significantly different performance on different classes, as seen in Figure 6—there are few highly performing classes (F-score > 60%) and few low performing classes (F-score < 7%) which have equal weight on the class-based averaging value of F-score. An inspection of precision and recall values reveals that the system output contains mostly correctly detected events (high precision), but there is a large number of events undetected (low recall). This results in a small number of substitutions—hence the difference in error rate values when counting substitutions (instance-based averaging) or counting insertions and deletions separately (class-based averaging) is not very large. ACC is not influenced by the averaging type, due to the total number of evaluated segments being the same for all classes.
The evaluation segment length also influences the values. A longer segment allows the system to produce a temporally less accurate output while still being considered correct. This is reflected in the measures that represent the amount of true positives—such as the F-score ( T P being involved in calculation of both precision and recall) and sensitivity (which is the true positive rate). At the same time, the larger segment produces more false positives by marking an event active for the entire one second segment even if it was only active for a fraction of its length—resulting in lower accuracy and specificity values.
The choice between a short or a large segment in evaluation is dictated by the application—for applications that need precise detection of events’ presence, a small evaluation segment should be used. However, this also depends on the quality of annotations, as sometimes annotations cannot be produced in the most objective way, and a 10 ms resolution is impossible to achieve. With a longer segment, the metric is more permissive on both the system output and subjectivity in onset/offset annotation.

5.1.2. Event-Based Metrics

Event-based F-score and error rate were calculated in two ways, first using the onset condition only, and second using both onset and offset conditions. The onset condition imposed the specific collar between the reference and system output events. The offset condition imposed either the same collar or a maximum difference between offsets of 50% of the reference event duration. The results are presented in Table 2.
First of all, it can be noticed that the performance of the system measured using the event-based metrics is much lower than when using segment-based metrics. The event-based metrics measure the ability of the system of detecting the correct event in the correct temporal position, acting as a measure of onset/offset detection capability.
Considering only the onset condition, the system is evaluated as having much better performance when the collar is larger. A larger collar behaves the same way as the longer segment in segment-based evaluation, allowing the system to produce a less exact output while still being considered correct. Figure 7 shows the class-wise F-score with 250 ms collar evaluated using onset only. It can be seen that for few event classes, the system is somewhat capable of detecting the onset within the allowed tolerance, while for other classes the system performs very poorly.
The offset condition allows a misalignment between the system output and ground truth event offsets. The permitted maximum misalignment is the collar length or 50% of the ground truth event length, whichever is higher. For very short events, this means that mostly the collar will be used, while long events benefit from the length condition. From Table 2 we can also notice that it is much easier to detect only onset of sound events compared to detecting both onset and offset. Similar behavior has been observed for algorithms used for note tracking in music transcription [30].
The choice between a small and a large collar, and the use of onset only condition or onset/offset is dictated by the application—in applications that need a precise detection of the sound event boundaries, a short collar and both onset and offset conditions should be used. For applications where it is more important to detect the presence of certain sound events rather than their exact temporal position and duration, evaluation with a large collar is suitable, and the offset condition can be omitted. A larger collar is also more permissive on the subjectivity in onset/offset annotation.

5.1.3. Discussion

The results from Table 1 and Table 2 show the difficulty of characterizing the system performance through a single metric. It is important to know that there is always a trade off between measured aspects, and make a choice of metric based on what the requirements for the system are.
F-score is the first choice metric in many cases due to its widespread use in other research areas. From Table 1 we can conclude that when measured in one second segments, half of the activity of sound events has been correctly detected by the presented system. However, the system still makes many errors, indicated by ER. Error rate gives the measure of how much the system is wrong. In the provided example, the system makes a number of errors that is 75% of the number of events to be detected, which is relatively high.
Accuracy gives a measure of how well the system output matches the reference in both true positives and true negatives. The example system outputs a very small amount of false positives, which results in a very good rate of true negatives. Combining this with the fact that the used data has relatively sparse events’ activity and in fact there are not too many positives to be detected, the system has an accuracy close to 100%. The ability to correctly output true negatives is important in applications where false positives are highly undesired. For example in an automatic alert system in an environment with sparse events, false positives will have immediate negative effect on user satisfaction. For such applications, specificity is a more appropriate measure, or true negative rate. On the other hand, there are monitoring applications in which it is more important to have very low rate of false negatives, such as gun shot detection or car crash detection. In this case the best choice of measure would be recall (sensitivity). However, if general accuracy is of interest for the application, balanced accuracy is a better choice for metric, because the true negatives have less weight in it.
Event-based metrics illustrate better the ability to correctly locate and label longer blocks of audio. For application where detection of correct onsets (and offsets) of sounds is important, the metric of choice should be event-based. The event-based error rate of the example system as seen in Table 2 is over 1, which means that the system makes much more errors than correct outputs. According to Equation (5), it is always possible to obtain an error rate of 1 by using a system that does not output anything. However, even with an error rate over 1, there are obviously many events correctly detected, according to F-score being 30.8%.

5.2. Comparing Performance of Different Systems

For comparing performance of different systems for sound event detection, the metric should be chosen depending on the application and the cost associated to different types of errors. We give an example in Table 3. System A is the one presented in the previous subsection. System B is the baseline system provided in DCASE 2016 [22]—it uses mel-frequency cepstral coefficients and Gaussian mixture models in a binary classification setup, and is trained using the polyphonic audio. System C is the submission to DCASE 2103 [43]—it uses mel-frequency cepstral coefficients and hidden Markov models with multiple Viterbi passes for detection, and is trained using isolated examples of sounds for all the classes. For a complete comparison, performance of the systems is also compared to a zero-output system (frame-wise activity matrix containing only zeros), all-active-output system (frame-wise activity matrix containing only ones) and random-output system. The random-output system generates in each frame for each event an activity level (0 or 1) based on the average sparseness of the dataset (priors 0.95 and 0.05 for 0 and 1, respectively). The random-output system was simulated 1000 times and the average calculated values over all runs are presented. The results in Table 3 are obtained using the same data as in Section 5, with one second evaluation segment and 250 ms collar.
Faced with a choice between these systems, if we want a system that finds best the regions where certain event classes are active, we would choose system B for the 68.5% segment-based F-score. The system also makes less errors in the evaluated segments than both systems A and C, and is therefore a good choice for detecting most regions with active events. However, if we want a system that detects best the position in time of event instances, we would choose system A based on its 30.8% event-based F-score. This system makes approximately 1.5 times more mistakes than the number of events to be detected, while correctly detecting approximately one third of them. The event-based performance of system C is comparable with the performance of system A when using only the onset condition, but system C is much better at detecting the sound event offsets, with a 20.8% F-score. A choice of system based on ER would indicate system B as the best, making the smallest amount of errors in both segment-based and event-based calculation.
The zero output system has an F-score of 0 and ER of 1, as expected. The all-active output system achieves a nonzero segment-based F-score by finding all the true positives. It is however penalized by introducing false positives on all other instances in the event activity matrix. In event-based evaluation, this system outputs one long event active for the whole duration of the test audio, which counts as an insertion, with no correct output. The random-output system obtains a performance between the two extremes—but still very low in comparison with all the systems based on learning.

6. Conclusions

In this paper, we reviewed and illustrated calculation of the most common metrics as segment-based and event-based metrics, and the influence of the averaging method on the final result. The metrics were calculated on a case study example, and the results were analyzed from the perspective of choosing a metric to evaluate performance of sound event detection systems. We also provide a toolbox containing implementations of all presented metrics.
Evaluation of sound event detection systems performing polyphonic detection needs adaptation of the metrics used for other classification or detection problems. Polyphonic sound event detection brings and extra dimension to the problem through the presence of multiple outputs at the same time, and all existing metrics must be modified to account for this. Definitions of true/false positives and true/false negatives are modified to refer to the temporal position rather than the set of events output by the system, and subsequently the metrics measure the ability of the system to provide the target output in the target time frame. Segment-based metrics characterize the performance in finding most of the regions where a sound event is present, while event-based metrics characterize the performance in event onset and offset detection within a small tolerance. The two measuring methods represent different aspects and serve different needs, therefore different sound event detection approaches will be best suited for maximizing one or the other.
The importance of rigorous definitions for evaluation metrics cannot be overstated. Comparison of algorithms and reproducibility of results are dependent as much on benchmark databases as on uniform procedure for evaluation. This study and the associated toolbox are part of our effort to provide a reference point for better understanding and definition of metrics for the specific task of polyphonic sound event detection.

Acknowledgments

The research leading to these results has received funding from the European Research Council under the ERC Grant Agreement 637422 EVERYSOUND.

Author Contributions

Annamaria Mesaros drafted the main manuscript and planned the experiments. Toni Heittola assisted in the organization of the manuscript and implemented the associated metrics toolbox. Tuomas Virtanen helped in the preparation of the manuscript.

Conflicts of Interest

The authors declare no conflict of interest.

References

  1. Clavel, C.; Ehrette, T.; Richard, G. Events Detection for an Audio-Based Surveillance System. In Proceedings of the IEEE International Conference on Multimedia and Expo, Amsterdam, The Netherlands, 6 July 2005; IEEE Computer Society: Los Alamitos, CA, USA, 2005; pp. 1306–1309. [Google Scholar]
  2. Härmä, A.; McKinney, M.F.; Skowronek, J. Automatic surveillance of the acoustic activity in our living environment. In Proceedings of the IEEE International Conference on Multimedia and Expo (ICME), Amsterdam, The Netherlands, 6 July 2005; IEEE Computer Society: Los Alamitos, CA, USA, 2005; pp. 634–637. [Google Scholar]
  3. Foggia, P.; Petkov, N.; Saggese, A.; Strisciuglio, N.; Vento, M. Reliable detection of audio events in highly noisy environments. Pattern Recognit. Lett. 2015, 65, 22–28. [Google Scholar] [CrossRef]
  4. Peng, Y.T.; Lin, C.Y.; Sun, M.T.; Tsai, K.C. Healthcare audio event classification using Hidden Markov Models and Hierarchical Hidden Markov Models. In Proceedings of the IEEE International Conference on Multimedia and Expo, New York, NY, USA, 28 June–3 July 2009; pp. 1218–1221.
  5. Goetze, S.; Schröder, J.; Gerlach, S.; Hollosi, D.; Appell, J.; Wallhoff, F. Acoustic Monitoring and Localization for Social Care. J. Comput. Sci. Eng. 2012, 6, 40–50. [Google Scholar] [CrossRef]
  6. Guyot, P.; Pinquier, J.; Valero, X.; Alias, F. Two-step detection of water sound events for the diagnostic and monitoring of dementia. In Proceedings of the IEEE International Conference on Multimedia and Expo (ICME), San Jose, CA, USA, 15–19 July 2013; pp. 1–6.
  7. Stowell, D.; Clayton, D. Acoustic Event Detection for Multiple Overlapping Similar Sources. In Proceedings of the IEEE Workshop on Applications of Signal Processing to Audio and Acoustics (WASPAA), New Paltz, NY, USA, 18–21 October 2015.
  8. Cai, R.; Lu, L.; Hanjalic, A.; Zhang, H.J.; Cai, L.H. A flexible framework for key audio effects detection and auditory context inference. IEEE Trans. Audio Speech Lang. Process. 2006, 14, 1026–1039. [Google Scholar] [CrossRef]
  9. Xu, M.; Xu, C.; Duan, L.; Jin, J.S.; Luo, S. Audio Keywords Generation for Sports Video Analysis. ACM Trans. Multimedia Comput. Commun. Appl. 2008, 4, 1–23. [Google Scholar] [CrossRef]
  10. Bugalho, M.; Portelo, J.; Trancoso, I.; Pellegrini, T.; Abad, A. Detecting audio events for semantic video search. In Proceedings of the 10th Annual Conference of the International Speech Communication Association, Brighton, UK, 6–10 September 2009; pp. 1151–1154.
  11. Chu, S.; Narayanan, S.; Kuo, C.C. Environmental Sound Recognition With Time-Frequency Audio Features. IEEE Trans. Audio Speech Lang. Process. 2009, 17, 1142–1158. [Google Scholar] [CrossRef]
  12. Tran, H.D.; Li, H. Sound Event Recognition With Probabilistic Distance SVMs. IEEE Trans. Audio Speech Lang. Process. 2011, 19, 1556–1568. [Google Scholar] [CrossRef]
  13. Dennis, J.; Tran, H.D.; Li, H. Combining robust spike coding with spiking neural networks for sound event classification. In Proceedings of the IEEE International Conference on Acoustics, Speech and Signal Processing (ICASSP), Brisbane, QLD, Australia, 19–24 April 2015; pp. 176–180.
  14. Zhang, H.; McLoughlin, I.; Song, Y. Robust Sound Event Recognition Using Convolutional Neural Networks. In Proceedings of the IEEE International Conference on Acoustics, Speech and Signal Processing (ICASSP), Brisbane, QLD, Australia, 19–24 April 2015.
  15. Zhuang, X.; Zhou, X.; Hasegawa-Johnson, M.A.; Huang, T.S. Real-world Acoustic Event Detection. Pattern Recognit. Lett. 2010, 31, 1543–1551. [Google Scholar] [CrossRef]
  16. Heittola, T.; Mesaros, A.; Virtanen, T.; Gabbouj, M. Supervised Model Training for Overlapping Sound Events based on Unsupervised Source Separation. In Proceedings of the 38th International Conference on Acoustics Speech, and Signal Processing (ICASSP 2013), Vancouver, BC, Canada, 26–31 May 2013; pp. 8677–8681.
  17. Mesaros, A.; Dikmen, O.; Heittola, T.; Virtanen, T. Sound event detection in real life recordings using coupled matrix factorization of spectral representations and class activity annotations. In Proceedings of the IEEE International Conference on Acoustics, Speech and Signal Processing (ICASSP), Brisbane, QLD, Australia, 19–24 April 2015; pp. 151–155.
  18. Espi, M.; Fujimoto, M.; Kinoshita, K.; Nakatani, T. Exploiting spectro-temporal locality in deep learning based acoustic event detection. EURASIP J. Audio Speech Music Process. 2015, 2015. [Google Scholar] [CrossRef]
  19. Grootel, M.; Andringa, T.; Krijnders, J. DARES-G1: Database of Annotated Real-world Everyday Sounds. In Proceedings of the NAG/DAGA Meeting, Rotterdam, The Netherlands, 23–26 March 2009.
  20. Stowell, D.; Giannoulis, D.; Benetos, E.; Lagrange, M.; Plumbley, M. Detection and Classification of Acoustic Scenes and Events. IEEE Trans. Multimedia 2015, 17, 1733–1746. [Google Scholar] [CrossRef]
  21. Poliner, G.E.; Ellis, D.P. A Discriminative Model for Polyphonic Piano Transcription. EURASIP J. Adv. Signal Process. 2007, 2007, 048317. [Google Scholar] [CrossRef]
  22. Detection and Classification of Acoustic Scenes and Events 2016, IEEE AASP Challenge. Available online: http://www.cs.tut.fi/sgn/arg/dcase2016/ (accessed on 5 January 2016).
  23. Mesaros, A.; Heittola, T.; Eronen, A.; Virtanen, T. Acoustic Event Detection in Real-life Recordings. In Proceedings of the 18th European Signal Processing Conference (EUSIPCO 2010), Aalborg, Denmark, 23–27 August 2010; pp. 1267–1271.
  24. Martinez, E.; Celma, O.; Sordo, M.; Jong, B.D.; Serra, X. Extending the folksonomies of freesound.org using contentbased audio analysis. In Proceedings of the Sound and Music Computing Conference, Porto, Portugal, 23–25 July 2009.
  25. Foster, P.; Sigtia, S.; Krstulovic, S.; Barker, J. CHiME-Home: A Dataset for Sound Source Recognition in a Domestic Environment. In Proceedings of the Worshop on Applications of Signal Processing to Audio and Acoustics (WASPAA), New Paltz, NY, USA, 18–21 October 2015.
  26. Heittola, T.; Mesaros, A.; Eronen, A.; Virtanen, T. Context-Dependent Sound Event Detection. EURASIP J. Audio Speech Music Process. 2013, 2013. [Google Scholar] [CrossRef]
  27. Cakir, E.; Heittola, T.; Huttunen, H.; Virtanen, T. Polyphonic Sound Event Detection Using Multi Label Deep Neural Networks. In Proceedings of the International Joint Conference on Neural Networks 2015 (IJCNN 2015), Montreal, QC, Canada, 31 July–4 August 2015.
  28. Dikmen, O.; Mesaros, A. Sound event detection using non-negative dictionaries learned from annotated overlapping events. In Proceedings of the IEEE Workshop on Applications of Signal Processing to Audio and Acoustics (WASPAA), New Paltz, NY, USA, 20–23 October 2013; pp. 1–4.
  29. Temko, A.; Nadeu, C.; Macho, D.; Malkin, R.; Zieger, C.; Omologo, M. Acoustic Event Detection and Classification. In Computers in the Human Interaction Loop; Waibel, A.H., Stiefelhagen, R., Eds.; Springer: London, UK, 2009; pp. 61–73. [Google Scholar]
  30. Music Information Retrieval Evaluation eXchange (MIREX 2016): Multiple Fundamental Frequency Estimation & Tracking. Available online: http://www.music-ir.org/mirex/wiki/2016:Multiple_Fundamental_Frequency_Estimation_&_Tracking (accessed on 18 April 2016).
  31. Giannoulis, D.; Benetos, E.; Stowell, D.; Rossignol, M.; Lagrange, M.; Plumbley, M. Detection and classification of acoustic scenes and events: An IEEE AASP challenge. In Proceedings of the IEEE Workshop on Applications of Signal Processing to Audio and Acoustics (WASPAA), New Paltz, NY, USA, 20–23 October 2013; pp. 1–4.
  32. Mesaros, A.; Heittola, T.; Virtanen, T. TUT Sound Events 2016. Available online: https://zenodo.org/record/45759 (accessed on 22 May 2016).
  33. Sebastiani, F. Machine Learning in Automated Text Categorization. ACM Comput. Surv. 2002, 34, 1–47. [Google Scholar] [CrossRef]
  34. Sechidis, K.; Tsoumakas, G.; Vlahavas, I. On the Stratification of Multi-label Data. In Machine Learning and Knowledge Discovery in Databases; Lecture Notes in Computer Science; Springer: Berlin/Heidelberg, Geramny, 2011; Volume 6913, pp. 145–158. [Google Scholar]
  35. Forman, G.; Scholz, M. Apples-to-apples in Cross-validation Studies: Pitfalls in Classifier Performance Measurement. SIGKDD Explor. Newsl. 2010, 12, 49–57. [Google Scholar] [CrossRef]
  36. Rijsbergen, C.J.V. Information Retrieval, 2nd ed.; Butterworth-Heinemann: Newton, MA, USA, 1979. [Google Scholar]
  37. Dixon, S. On the computer recognition of solo piano music. In Proceedings of the Australasian Computer Music Conference, Brisbane, Australia, 10–12 July 2000; pp. 31–37.
  38. Ryynanen, M.P.; Klapuri, A. Polyphonic music transcription using note event modeling. In Proceedings of the IEEE Workshop on Applications of Signal Processing to Audio and Acoustics, New Platz, NY, USA, 16–19 October 2005; pp. 319–322.
  39. Sheh, A.; Ellis, D. Chord Segmentation and Recognition using EM-Trained Hidden Markov Models. In Proceedings of the 4th International Conference on Music Information Retrieval ISMIR, Baltimore, MD, USA, 27–30 October 2003.
  40. Mauch, M.; Dixon, S. Simultaneous Estimation of Chords and Musical Context From Audio. IEEE Trans. Audio Speech Lang. Process. 2010, 18, 1280–1289. [Google Scholar] [CrossRef]
  41. Heittola, T.; Mesaros, A. sed_eval - Evaluation toolbox for Sound Event Detection. Available online: https://github.com/TUT-ARG/sed_eval (accessed on 22 May 2016).
  42. Japkowicz, N.; Shah, M. Evaluating Learning Algorithms; Cambridge University Press: Cambridge, UK, 2011. [Google Scholar]
  43. Diment, A.; Heittola, T.; Virtanen, T. Sound Event Detection for Office Live and Office Synthetic AASP Challenge; Technical Report; Tampere University of Technology: Tampere, Finland, 2013. [Google Scholar]
Figure 1. Illustration of sound event classification, tagging and detection.
Applsci 06 00162 g001
Figure 2. Illustration of the output of monophonic and polyphonic sound event detection systems, compared to the polyphonic annotation.
Applsci 06 00162 g002
Figure 3. Sound event detection system overview.
Applsci 06 00162 g003
Figure 4. Calculation of segment-based metrics.
Applsci 06 00162 g004
Figure 5. Calculation of event-based metrics.
Applsci 06 00162 g005
Figure 6. Segment-based F-score for the case study system, 10 ms evaluation segment.
Applsci 06 00162 g006
Figure 7. Event-based F-score for the case study system, 250 ms collar, onset only.
Applsci 06 00162 g007
Table 1. Segment-based metrics calculated on the case study system.
Segment Length FERSensitivitySpecificityACCBACC
10 msclass-based average34.50.8727.399.596.763.4
instance-based average42.00.7629.799.596.764.6
1 sclass-based average44.90.8943.297.192.470.1
instance-based average50.90.7544.697.092.470.8
Table 2. Event-based F-score and ER calculated on the case study system.
Onset OnlyOnset + Offset
Collar FERFER
100 msclass-based average7.52.104.72.10
instance-based average20.71.748.22.11
250 msclass-based average10.52.254.12.10
instance-based average30.81.4910.12.06
Table 3. Comparing systems using different metrics calculated using instance-based averaging, 1 s segment, 250 ms collar.
Compared SystemsSegment-BasedEvent-BasedEvent-Based
Onset OnlyOnset + Offset
FERFERFER
system A (NMF [28])42.00.7630.81.4910.12.06
system B (GMM [22])68.50.4910.71.424.41.62
system C (HMM [43])46.90.8730.01.4720.81.76
zero-output system0.01.000.01.000.01.00
all-active-output system15.410.930.01.440.01.44
random-output system9.01.531.62.591.12.67

