Article

Development of Analytical Impact Force Models for Floor Impact Vibration and Acoustic Numerical Analysis

Building and Urban Research Institute, Korea Institute of Civil Engineering and Building Technology, 283, Goyang-daero, Ilsanseo-gu, Goyang-si, Gyeonggi-do 10223, Korea
*
Author to whom correspondence should be addressed.
Appl. Sci. 2016, 6(5), 120; https://doi.org/10.3390/app6050120
Submission received: 2 March 2016 / Revised: 15 April 2016 / Accepted: 18 April 2016 / Published: 26 April 2016
(This article belongs to the Section Acoustics and Vibrations)

Abstract

:
Apartment houses have been continuously constructed in Korea to solve overcrowding in large cities. The interlayer noise arising from these apartment houses has now become a critical social problem which requires an urgent solution. In recent years, studies applying numerical analysis techniques with respect to the structural type and floor plane have been carried out to effectively reduce the heavy weight impact noise, which is a cause for the interlayer noise. This study proposes analytical impact force models based on the actual measurement data regarding the heavy weight impact noise, which is mandatory input data for performing a numerical analysis. Additionally, the appropriateness of the proposed models has been verified through a comparative review with Korean standards. With the use of the proposed model, a numerical analysis has been conducted using a wall-type specimen, and a comparative analysis has been also performed with respect to the field measurement data. The applicability of the proposed model to the numerical analysis shows the possibility to resolve the interlayer noise problems numerically posing difficulties due to both the limited costs and time. Finally, it is expected that more information can be provided to resolve the interlayer noise problem based on the numerical analysis of various boundary conditions.

1. Introduction

In Korea, the construction of apartment houses began with industrialization and urbanization, and the demand for the construction of apartment houses has steadily increased in order to promote the effective utilization of limited land area and solve overcrowding in large cities. The word “apartment house” here refers to houses with a structure in which each household that shares the use of some or all of walls, hallways, stairs, and where other facilities of one building lead an independent residential life within the building—its type and scope includes apartments, townhouses, and multi-family homes defined in the regulations on the types of buildings by use in Article 3 (4) of the Enforcement Decree of the Building Act [1]. According to the results of the statistical data from the 2015 national census, the total population that resides in apartment houses accounted for 57.2% (including 47.1% living in apartments) of entire households [2].
The interlayer noise inside apartments has become a critical social problem, and is mainly caused by the impact arising from children rapidly walking or running, and adults walking in adjacent houses. This causes discomfort to the residents and has become a major cause of conflicts between neighbors, which can sometimes lead to murder or assault. The impact noise arising from the apartment houses is mainly divided into light weight impact noise and heavy weight impact noise according to the impact cause and duration time.
Of these, light weight impact noise is created by the falling of light weight objects or the movement of household goods. Kim et al. [3] found that a floating floor method using resilient materials ensures fairly good performance against light weight impact noise, but has rather negative side effects due to the resonance on the heavy weight impact noise caused by the falling of heavy objects or children walking/running. Many studies have been conducted regarding the development of resilient materials with excellent performance that can effectively reduce the heavy weight impact noise. Taken together, these findings reveal that a study on the structural type and floor plane should be conducted together with resilient materials in order to effectively control the heavy weight impact noise [4]. Branco and Godinho [5] proposed the use of various types of lightweight mortars, which are cement mortars containing expanded polystyrene, expanded cork, and expanded clay granulates, to minimize impact sound transmission. Laboratory experiments using a small-size acoustic chamber were carried out to evaluate the acoustic characteristics of lightweight mortars. Finally, it was concluded that the presence of the resilient underlay has a dominant influence on the global acoustic performance of the system.
The systematic analysis on the impact source, transmission path of the impact vibration inside the apartment house resulting from the impact source and response of the structure to the impact source is needed in order to fundamentally resolve the interlayer noise problem. In a related move, recent studies have been actively conducted to solve the interlayer noise problem by using numerical analysis techniques of finite element methods (FEM) and boundary element methods (BEM), experimental approaches such as experimental impact analysis depending on the ceiling structure and support structure [6], and performance analysis of impact noise depending on the configuration of the resilient materials [7,8,9,10].
Pereira et al. proposed a strategy to determine the noise reduction provided by floor coverings following the ISO/CD 16251-1 technical document. Experiments including resilient coverings, floating floors, and floating slabs were carried out and compared with those obtained using the procedures described in the standards EN ISO 140-8 and EN ISO 717-2 [11]. Davis et al. [12] proposed an experimental procedure to estimate the dynamic properties of the floor and calibrated the model using finite element analysis. The proposed method illustrated by a case study of an in-service floor was shown to be economical, convenient, and effective when comparing full experimental modal analysis. Sousa and Gibbs carried out a systematic investigation of measurement and prediction uncertainty associated with impact sound transmission at low frequencies. Several factors, such as location of the impact, type of floor, edge conditions, floor and room dimensions, room absorption, and position of the receiver were considered in his study [13]. Robinson and Hopkins studied the use of Transient Statistical Energy Analysis (TSEA) to predict impact sounds and to measure heavy/soft impacts in buildings in terms of the sound pressure level. The rubber ball and human footsteps with three different kinds of footwear were considered as impact sources [14].
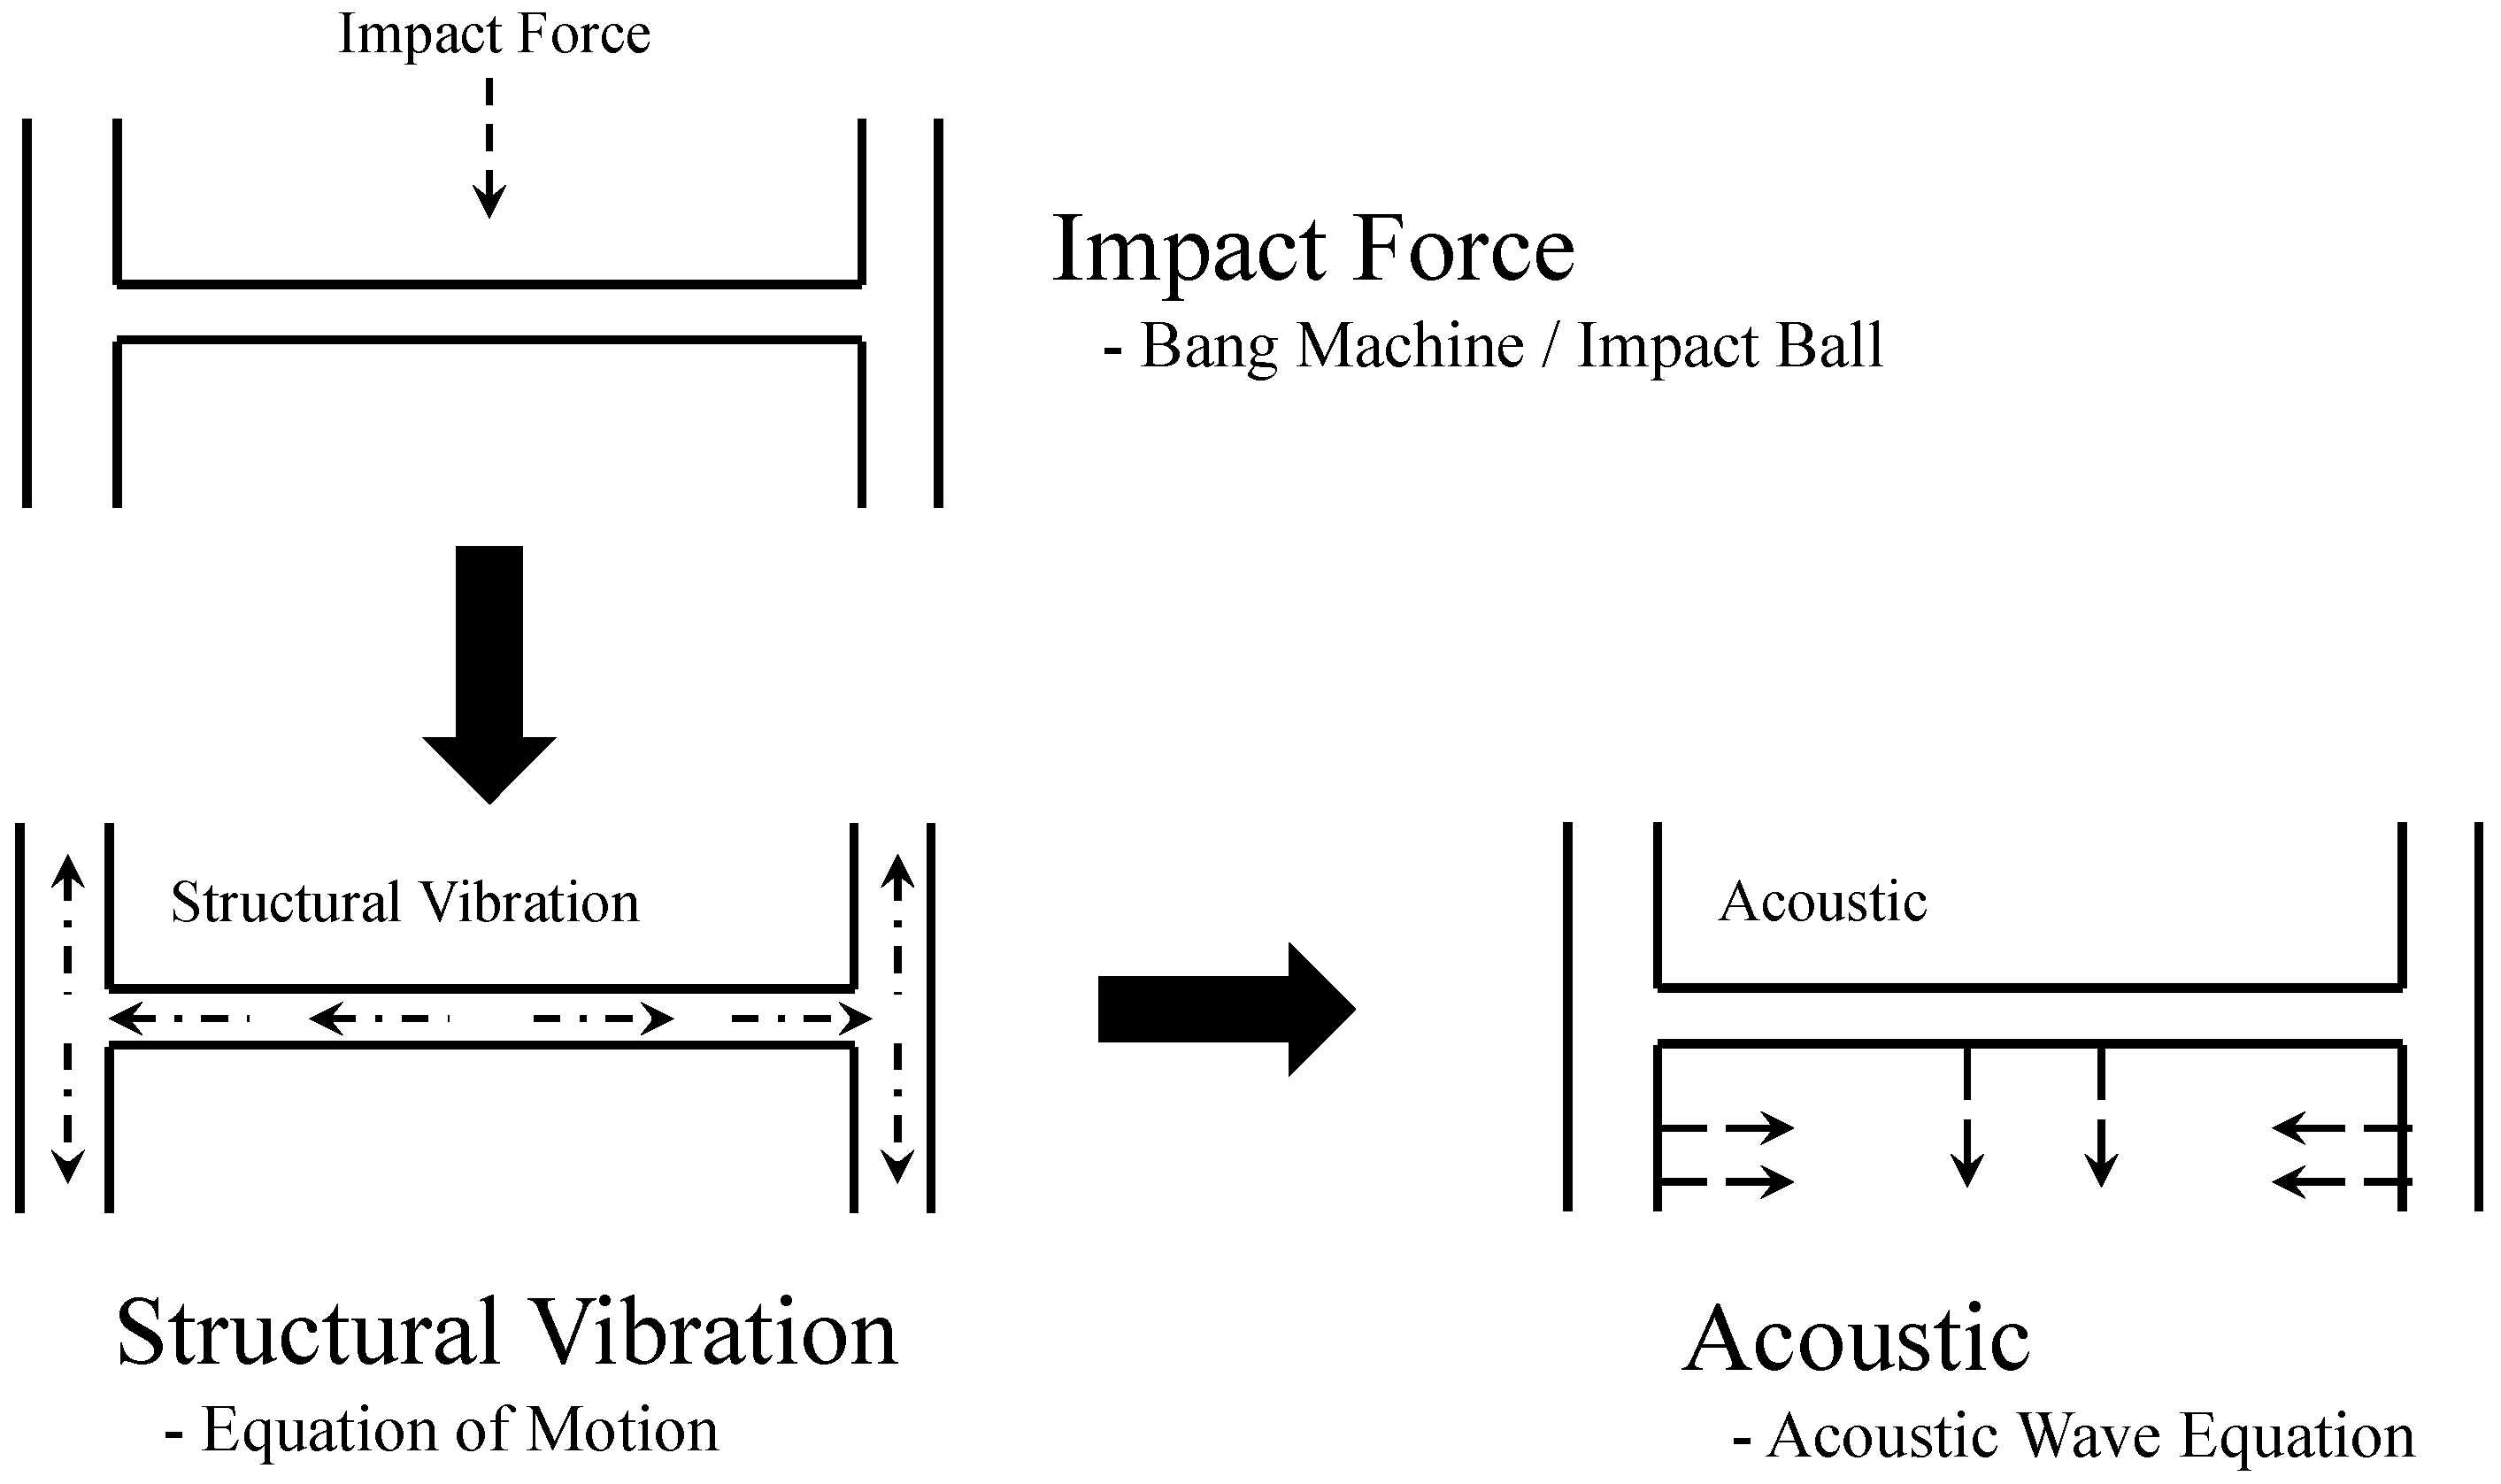
This study aims to develop analytical impact force models on the standard heavy weight impact source required for vibration and noise analysis using numerical analysis techniques to resolve the problem of interlayer noise inside apartment houses. In this case, the standard heavy weight impact sources include impact ball and bang machine impact sources specified in the KS (Korean industrial standards) F 2810 [15], ISO 10140 [16], ISO 16283 [17], and JIS A 1418 [18]. As of 2015, the impact ball was excluded from the interlayer noise measurements of apartment houses, and the relevant details are specified in the revised notice (Ministry of Land, Infrastructure and Transport Notice No. 2015-727: Criteria for structure recognition and management on the floor impact sound insulation in multi-family residential housing [19]). However, in this study, impact ball and bang machine impact sources were all taken into consideration. The verification of the developed analytical impact force models were implemented through a comparative analysis on the impact exposure level of the standard heavy weight impact source presented in KS F 2810 [15]. Lastly, a FEM numerical analysis on the vibration and noise of wall-type specimen was conducted using the analytical impact force models developed in this study, and a comparison with the actual measurement data was also performed.

2. Theoretical Background and Mathematical Formulation

2.1. Standard Heavy Weight Impact Sources

The Ministry of Construction and Transportation (now the Ministry of Land, Infrastructure, and Transport) released a document on the heavy weight impact noise of apartment houses [20] in order to resolve the interlayer noise problem in 2015 and announced the revised notice “Structural standards for interlayer floor impact noise insulation to prevent noise” [21]. Figure 1 shows standard heavy weight impact sources, including the bang machine (FI-02, RION Co., Ltd., Tokyo, Japan) and impact ball (YI-01, RION Co., Ltd., Tokyo, Japan), used for field measurements of interlayer noise in apartment houses and experimental testing devices, such as the impact force measuring instrument (PF-10, RION Co., Ltd., Tokyo, Japan) and data transmission device. The standard specifications for the bang machine and impact ball are summarized in Table 1 [15].
KS presents the statistical characteristics such as the mean and standard deviation of impact force levels (LFE, Impact Exposure Level, dB) of the standard heavy weight impact noise based on a 1/1 octave band as summarized in Table 2. The impact exposure level of the standard heavy weight impact noise can be calculated using the following Equation (1):
L F E = 10 l o g 10 ( 1 T 0 t 1 t 2 F 2 ( t ) F 0 2 d t )
where F(t) is the impact force (N), F0 is the reference power (1 N), t2 ~ t1 is the time including the impact time by the impact source (s), and T0 is reference time (1 s).
The impact exposure level can be calculated by applying Equation (1) with respect to each octave band center frequency, and the computing process is depicted in Figure 2. First, the entire impact force, as in Figure 2a, is divided into each 1/1 octave band center frequency, as shown in Figure 2b, and then the impact exposure level for each frequency is computed using Equation (1). KS presents a total of five 1/1 octave band center frequencies, which are 31.5 Hz, 63 Hz, 125 Hz, 250 Hz, and 500 Hz. The impact exposure level calculated by frequency can be represented as in Figure 2c. In order to develop a numerical model on the standard heavy weight impact source, the measurement was conducted 10 times, respectively, with respect to both the bang machine and impact ball.

2.2. Development of Analytical Impact Force Models Using Optimization

A numerical model for impact force has been developed based on 10 experimental test data results. The optimization technique is selected to seek an optimum analytical impact force model. Typically, an optimization problem with constraints can be expressed as:
Minimize f(x)
Subjected to   { g i ( x ) 0 : i = 1 , 2 , .. q h i ( x ) = 0 : j = q + 1 ,   q + 2 ,   m
where f(x) is an objective function, g(x) are the inequality constraints, q is the number of inequality constraints, h(x) are the equality constraints, and mq provides the number of equality constraints [14].
During the optimization procedure, a sum of squares of the difference between the experimental test data and the numerical data was taken as the objective function, expressed in Equation (4), in this study. Therefore, the optimum model must minimize the objective function. The Nelder-Mead sequential simplex algorithm, i.e., the fminsearch function in MATLAB (R2015b, The MathWorks Inc., Natick, MA, USA, 2015) [22], was applied to solve the problem.
f ( x ) = ( x e x p x n u m ) 2
where f(x) is the objective function, xexp is an experimental test data, and xnum is generated data using the proposed impact force model.
With respect to the developed analytical impact force model, the impact exposure level was calculated using Equation (1), and the analytical impact force model was verified through a comparison with an allowable range presented in KS.

2.3. Analytical Impact Force Model for Bang Machine

Figure 3 shows the mean value and data obtained from 10 field measurements for the bang machine. The maximum value of the measurements ranged from 3865 to 3903 N, and the mean value was 3890 N. According to the study of Inoue et al. [23] as well as Japanese standards JIS A 1418-2 [23], the maximum load was 3900 N for the bang machine.
However, 4500 N was presented in the commentary of the KS F 2810 [15]. The impact time subjected to the impact load was measured at 21.24 ms, and is deemed to be appropriate when compared with the impact time presented in KS (20 ± 2 ms). With respect to the measurement value, the impact exposure level was calculated and compared with KS. As shown in Figure 3b, there was an excess of 4 dB and 3.8 dB in comparison with the standard value with respect to 250 Hz and 500 Hz, respectively.
For the development of the analytical impact force model, the optimization was performed using Equations (2)–(4). The analytical impact force model for the bang machine is expressed in Equation (5), and the coefficients are summarized in Table 3.
M B M I F ( x ) = C 0 × x 6 + C 1 × x 5 + C 2 × x 4 + C 3 × x 3 + C 4 × x 2 + C 5 × x + C 6
where MBM-IF(x) is the proposed impact force model for the bang machine, x is the input variable, (i.e., time), and C0 ~ C6 are coefficients for the model.
Figure 4a shows the impact load for the bang machine which is artificially generated using Equation (1), and the impact time was 20.874 ms (Δt = 1/8192). The impact exposure level for both the mean of experimental test and the proposed model is summarized in Table 4. The impact exposure level, shown in Figure 4b, was found to adhere well to KS.

2.4. Analytical Impact Force Model for Impact Ball

As with the case of the bang machine, the analytical impact force model was developed with respect to the impact ball. The mean value and data obtained from 10 field measurements are shown in Figure 5. The maximum value of the measurements ranged from 1498.48 to 1544.31 N, and the mean value was 1517.91 N.
According to the study of Inoue et al. [23], as well as KS, the maximum load was 1500 N for the impact ball. The impact time subjected to the impact load was measured at 19.294 ms, and is deemed to be appropriate when compared with the impact time presented in KS (20 ± 2 ms). With respect to the mean value of data obtained from the 10 measurements, the impact exposure level was calculated and depicted in Figure 5b and summarized in Table 5.
As shown in Table 5, there was an excess of 1.25 dB in comparison with the KS with respect to 250 Hz. With the use of the same method as in the bang machine, the analytical impact force model on the impact ball was developed. As in Equation (5), the analytical impact force model for the impact ball is an equation model, and the coefficients are summarized in Table 6.
Figure 6 shows the impact load of the impact ball which was artificially generated using the proposed analytical impact force model. The maximum value of the generated impact source was 1484.73 N, and the impact time was 19.41 ms (Δt = 1/8192), which is deemed to be appropriate when compared with the impact time presented in KS (20 ± 2 ms). Figure 6b shows the impact exposure level of the analytical impact force model and the comparison results showed that the impact exposure level was 2.7 dB lower than KS at 500 Hz.
A comparison between the results calculated based on the mean value, as in Figure 5, and that calculated using the analytical impact force model, as in Figure 6, revealed that the impact force level was low at 500 Hz. The reason is that the curved sections, indicated in red as shown in Figure 6, were not taken into account when comparing the analytical impact force model consisting of only the actual measurement data and a polynomial expression. Accordingly, the accuracy was improved by adding a sine function to compensate for the analytical impact force model. The improved analytical impact force model is as follows.
M I B I F ( x ) = C 0 × x 6 + C 1   × x 5 + C 2 × x 4 + C 3 × x 3 + C 4 × x 2 + C 5 × x + C 6 + C 7 sin ( C 8 × x )
where MIB-IF(x) is the proposed impact force model for the impact ball, x is the input variable (i.e., time), and C0C8 are coefficients for the model.
The coefficient C7 of the sine function used in the analytical impact force model for the impact ball is 100, and C8 is 1000π value, which turned out to be effective only in consideration of the 0 ~ 3.9063 s range. It should be commented that the optimum solutions for the values of C7 and C8 related to the sine function are numerous. In this study, the value of C8 was taken into account for consideration of the 500 Hz region, and, the value of C7 was determined through a comparison with KS with respect to the impact exposure level by means of a trial and error method after the value of C8 was fixed. The results on the improved model are summarized in Figure 7. The calculated impact exposure levels for impact ball’s numerical model with KS are summarized in Table 7. The analytical impact force model improved in consideration of the sine function was found to comply with the KS.

2.5. Theroretical Backgroud of Vibration and Acoustic Analysis

The interlayer noise inside apartment houses is created by floor impact noise transmitted downstairs and caused by impact sources such, as children running and adults walking upstairs. In this case, the medium through which sound is transmitted is the room air downstairs, and the noise source that causes the noise is vibrations transmitted through the walls and ceiling (slab). If slabs or walls vibrate, air particles that come in contact with the slabs or walls vibrate, which causes noise. Therefore, the velocity of the air particles caused by the transmission vibration, which is a boundary condition of the acoustic analysis, should be obtained to analyze the noise arising from the floor impact sound. Through a structural vibration analysis, the exact vibration velocity of structures, such as slabs or walls, should be calculated, and an accurate acoustic analysis can be performed from the calculated vibration velocity. As shown in Figure 8, vibration and acoustic analysis procedures can be divided into a structural vibration analysis dealing with the vibration that occurs inside the structure due to an external impact, and an acoustic analysis that deals with sound radiation arising from the vibration of the structure [24,25]. Generally, for the structural vibration analysis, vibrations caused by the external force (F) are obtained using an equation of motion as in Equation (7):
m x ¨ + c x ˙ + k x = F
where x is displacement, x ˙ is velocity, x ¨ means acceleration, m, c, k mean the mass, damping, and stiffness values of the structure, respectively, and F represents the external force applied to the structure.
Based on the location, member elements, connection relationship, and geometric information of the target structure, as well as the modulus of elasticity, density, Poisson’s ratio, and material properties, a numerical model for the structural analysis was produced. This structural analysis was performed using a bang machine or impact ball to calculate the vibration response of the target structure. An understanding on the generation of noise due to the vibration of the structure is needed to perform the noise analysis using the calculated vibration response of the target structure. The structural vibration that occurs in walls or slabs in apartment houses vibrates the indoor air particles that come in contact with the walls or slabs, causing noise. This indoor air vibration allows the sound source that causes a sound wave to change the pressure in a medium, move the particles of the medium, and in turn change the density of the medium. Then, the change in the density leads to a change in the pressure, and thereby causes sound. As shown in Figure 9, on the basis of this relationship, an acoustic wave equation can be induced by utilizing an equation of state that represents a relationship between the density and the pressure, an equation of motion representing a relationship between the pressure and the displacement, and an equation of continuity that shows a relationship between the displacement and the density.
The acoustic wave equation is represented below [24]:
2 p 1 c 2 2 p t 2 = 0
where p represents the sound pressure, c represents the air velocity, and t represents the time.
In this study, the structural vibration was analyzed using NX.NASTRAN (V10.0, SIEMENS Software, Plano TX, USA, 2015) [26] from SIEMENS Software, a commercial finite element analysis program with respect to the previously described Equations (7) and (8), and a sound field analysis was performed numerically using VIRTUAL.LAB (R13.4, SIEMENS Software, Plano TX, USA., 2015) [27] from SIEMENS Software.

3. Illustrative Example for Structure-Acoustic Analysis

3.1. Wall-Type Structure Specimen

With the use of the proposed analytical impact force model for the bang machine and impact ball, a numerical analysis on the wall-type structure specimen was carried out. The size of the test specimen was 2.6 m × 4.0 m × 2.9 m (B × W × H). In the front, a door was built using a lightweight EPS wall panel (Total PC Co., Gwangju-si, Korea), and in order to take into consideration living-room conditions of apartment houses, the structure was produced under the assumption that three sides were walls, and the front an open space (see Figure 10).
As shown in Figure 10, the thickness of the wall on three sides was 180 mm, and that of the slab 210 mm. The dead weight of the bottom plate was 62.8 kN, and the fully-loaded weight 183.8 kN. The material properties of the test specimen are summarized in Table 8 [28,29,30,31]. Meanwhile, the light weight EPS (expanded polystyrene) wall panel is a non-structural element, and relevant studies have continuously been conducted regarding the material properties such as the modulus of elasticity, density, and Poisson’s ratio [29,30,31].

3.2. Field Measurements

With respect to the wall-type structure specimen, a field measurement of vibration and noise was performed using the bang machine and impact ball, and a numerical analysis was conducted. For storage of the measurement data, a laptop and sensor signal acquisition device (Front-End SIEMENS SCADAS Mobile) (SIEMENS, Plano, TX, USA), microphone (4188, Brüel and Kjær, Nærum, Denmark), and preamplifier (2671, Brüel and Kjær , Nærum, Denmark) were used. In general, the noise measurement was performed using the bang machine and impact ball in accordance with the provision that says, “the impact locations of the standard heavy weight impact source shall be 3 to 5 points, including 1 point around the central point, which are averagely distributed in the bottom plane over 0.5 m away from the wall around the room” presented in KS as shown in Figure 11. However, since this study aims not to evaluate the noise of the target structure, but to develop an analytical impact force model through a comparison between experimental measurement values and numerical analysis results of the artificially produced analytical impact force model, only the measurement result of one location in the central point of the upper part of the specimen (location 3 in Figure 11a) was considered based on the noise measurement standards presented in KS.
In relation to the microphone installation locations for indoor noise measurements, the provision which says, “the measurement points of more than 4 points which are more than 0.7 m away from each other within the space over 0.5 m away from the ceiling, surrounding wall and bottom plane shall be evenly distributed in space” presented in KS was adhered to. Accordingly, five microphones for noise measurements were installed in accordance with KS, and indoor noises were measured as shown in Figure 12.
Figure 13 shows field measurement results (excitation at central point) of the bang machine and impact ball with respect to a 1/3 octave band and a 1/1 octave band, respectively. As shown in Figure 13, the response of the microphone at the central point was somewhat lower in the region prior to 100 Hz based on 100 Hz but found to be slightly higher than that of other microphones in the region after 100 Hz. With respect to the mean value for each case, a single number quantity (SNQ) was calculated, and the results were 57 dB and 59 dB, respectively.
As represented in Figure 13, the SNQ for the impact ball was slightly higher than that of the bang machine at 250 Hz and, therefore, the impact ball was found to be rather higher than the bang machine in the SNQ (See Table 9). It should be noted that KS F 2863 [32] is adopted to compute a SNQ for the standard heavy weight impact sources, i.e., bang machine and impact ball. The method of KS F 2863 is the same as that of ISO 717 [33], that is for the standard light weight impact source, such as a tapping machine, except the difference in the considered frequency range for calculation. Detailed information related to the computation can be found in KS F 2863 and ISO 717.

3.3. Numerical Analysis Uinsg Analytical Impact Force Models

As shown in Figure 14, a numerical analysis was performed using the wall-type structure specimen. The excitation location of the impact source and the location of the indoor microphone for noise measurements were the same as the locations used in the field experiment.
As previously described, a structural analysis was conducted using NASTRAN, and a sound field analysis was performed with the use of VIRTUAL.LAB. As with the field measurements, the numerical analysis was performed using an artificial impact force model presented in this study with respect to two heavy weight impact sources (the bang machine and impact ball). Figure 15 and Figure 16 show the numerical analysis results of the two impact sources.

3.4. Comparison and Anlaysis

As shown in Figure 17, a comparison with the field measurement results with regard to the 1/1 octave band revealed that the case of the numerical analysis using the impact source model proposed in this study is more similar to the field measurement results than the case of using the mean of 10 impact forces.
The SNQs for each case are summarized in Table 10. As identified in Table 10, the SNQ turned out to be the same in the case of the bang machine, and the difference between the field measurement results and the numerical analysis results was about 5 dB when the mean force of 10 measurement values was used.
For the impact ball, there was a difference of about 5 dB with the field measurement values when an artificial impact source was used, but the mean force of 10 measurement values was about 7 dB higher. Therefore, it was found that the accuracy of the numerical analysis results using the artificial impact force was high for both the bang machine and the impact ball.

4. Summary and Conclusions

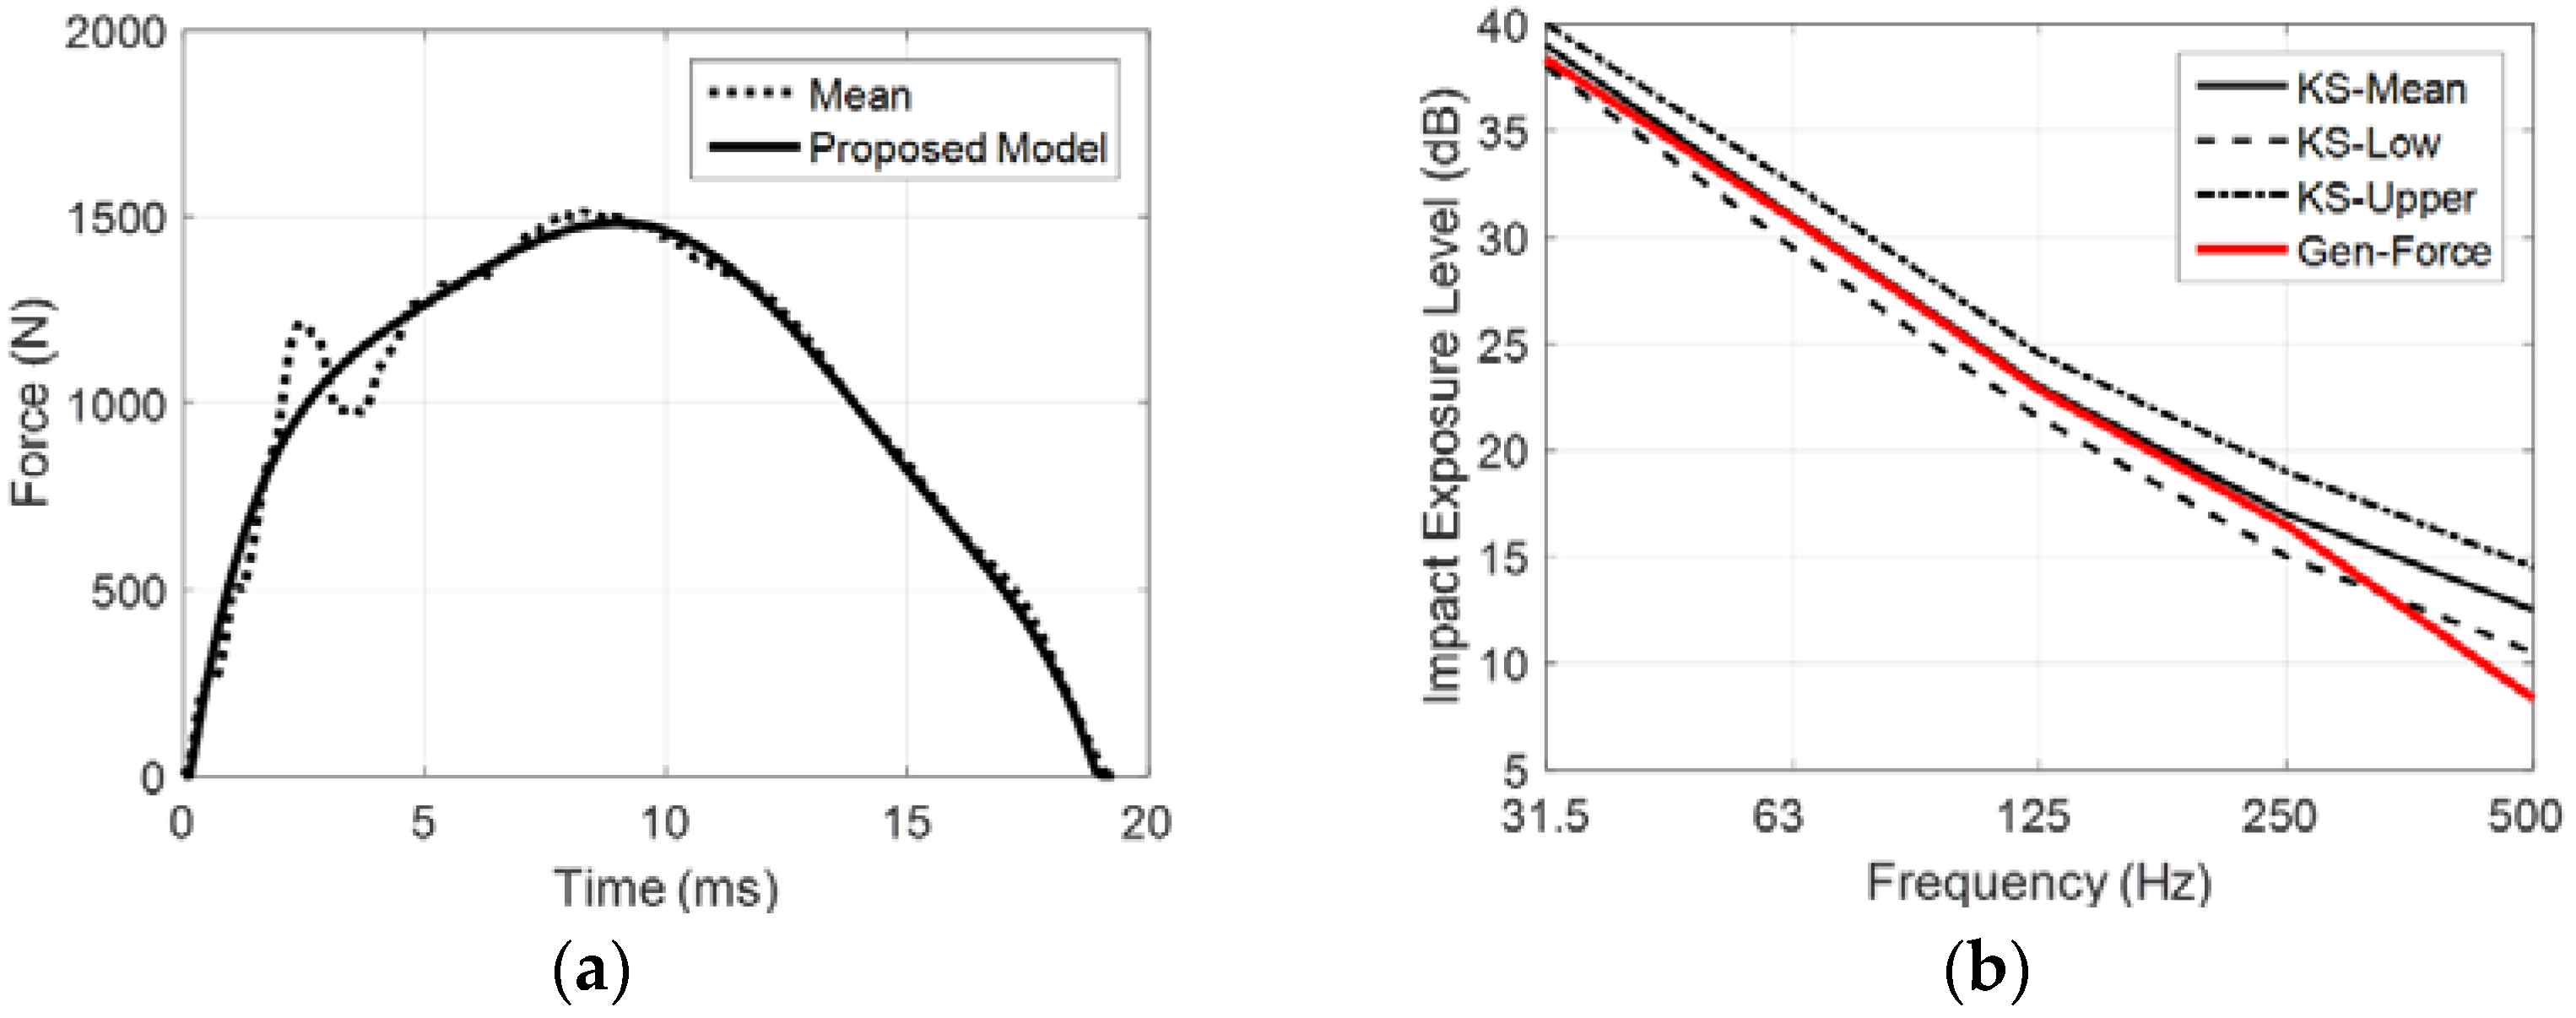
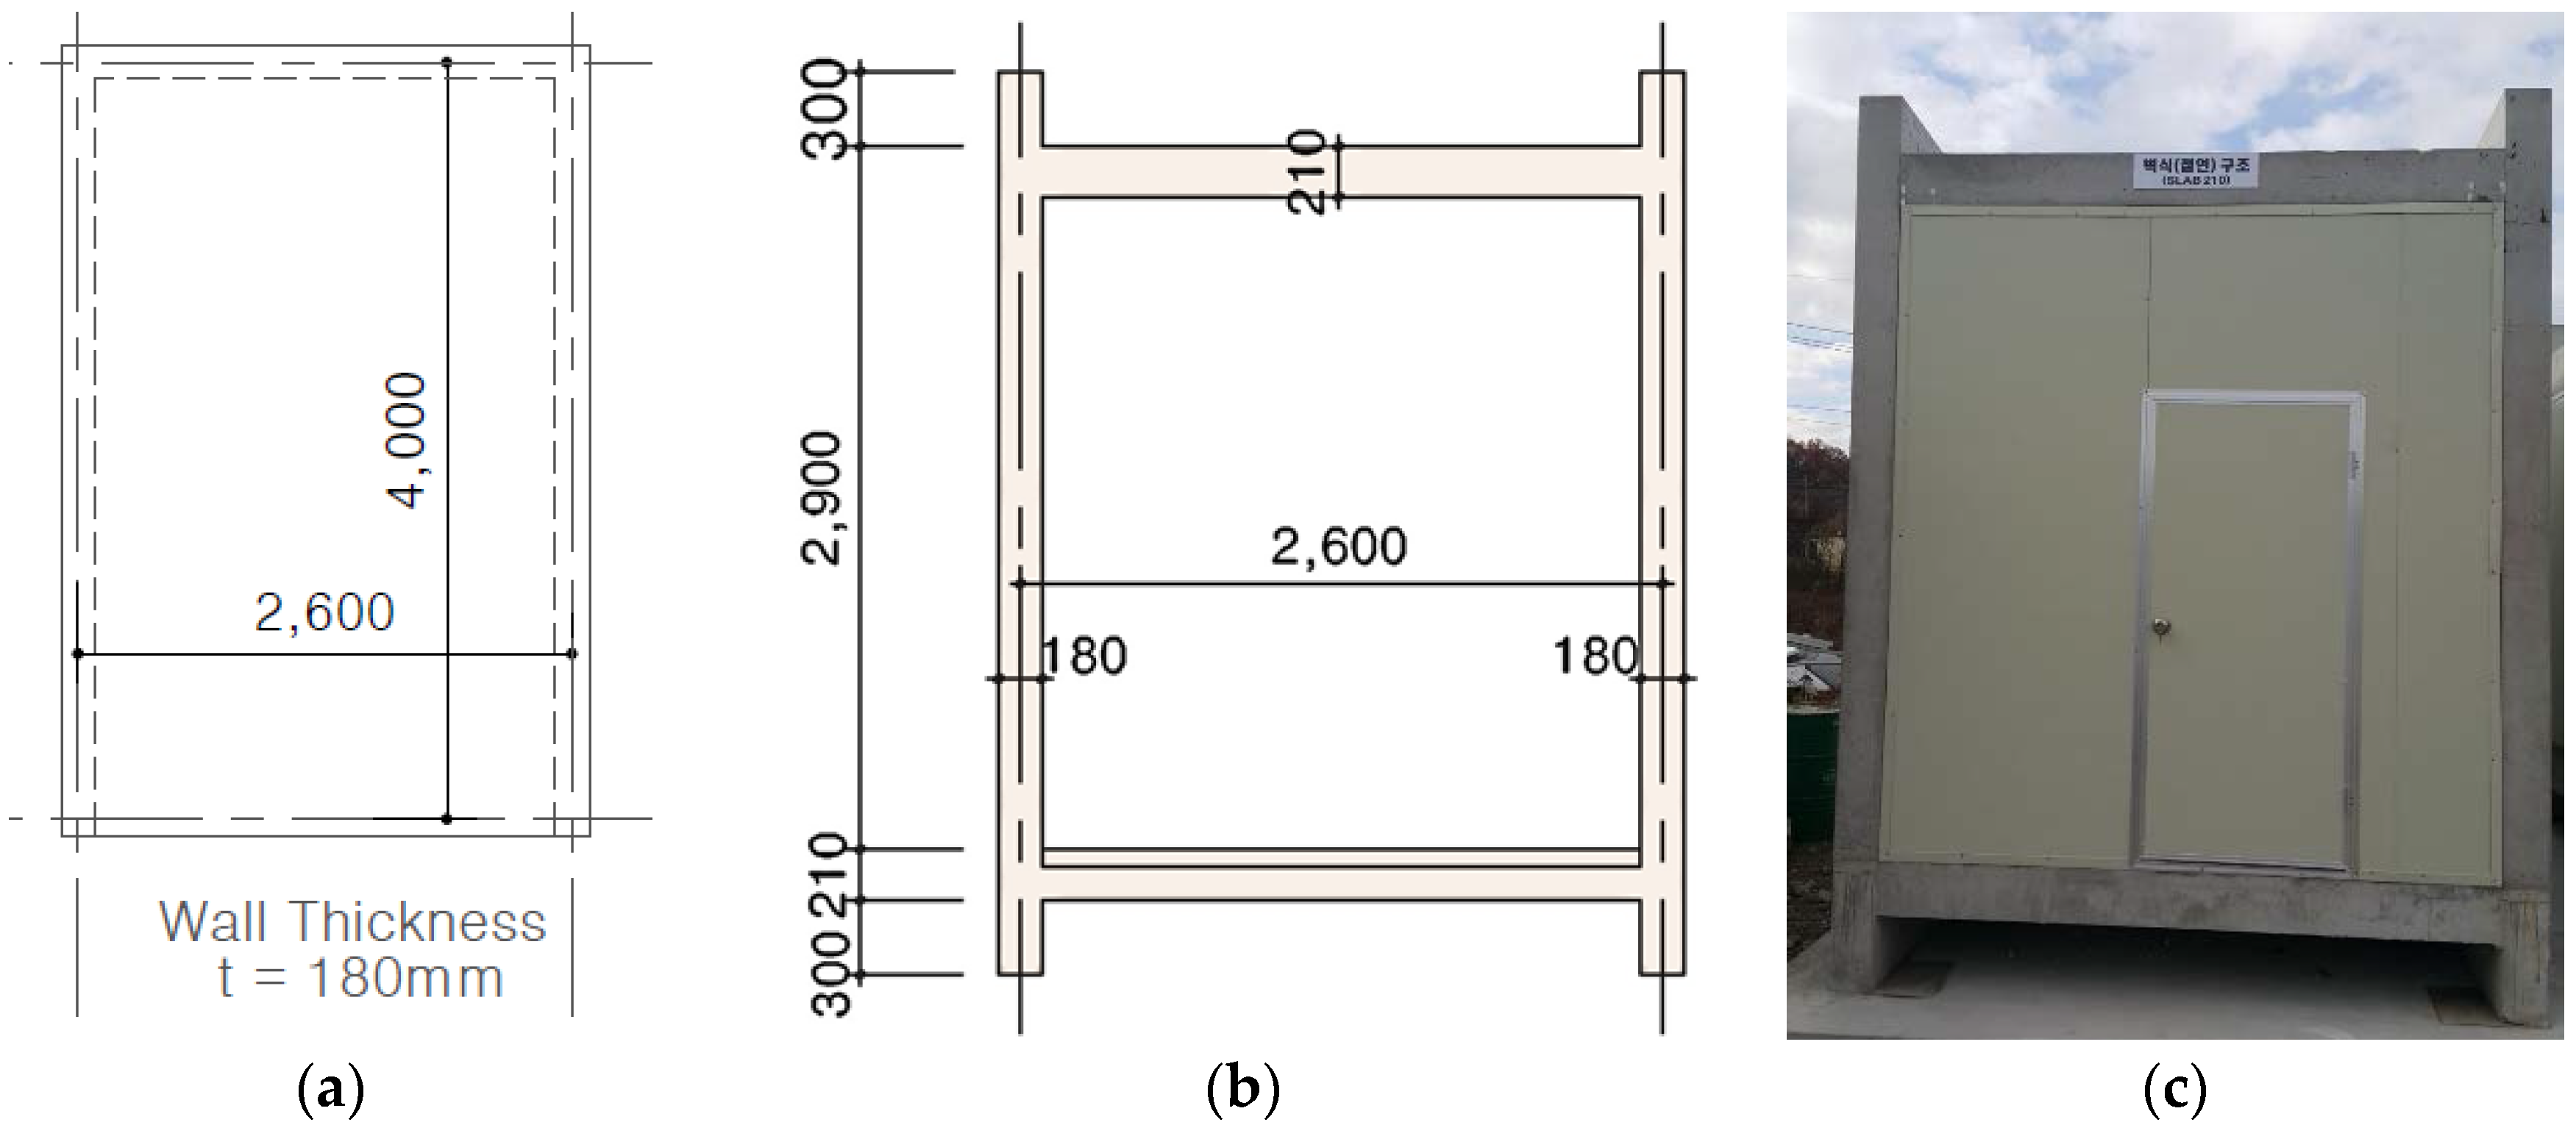
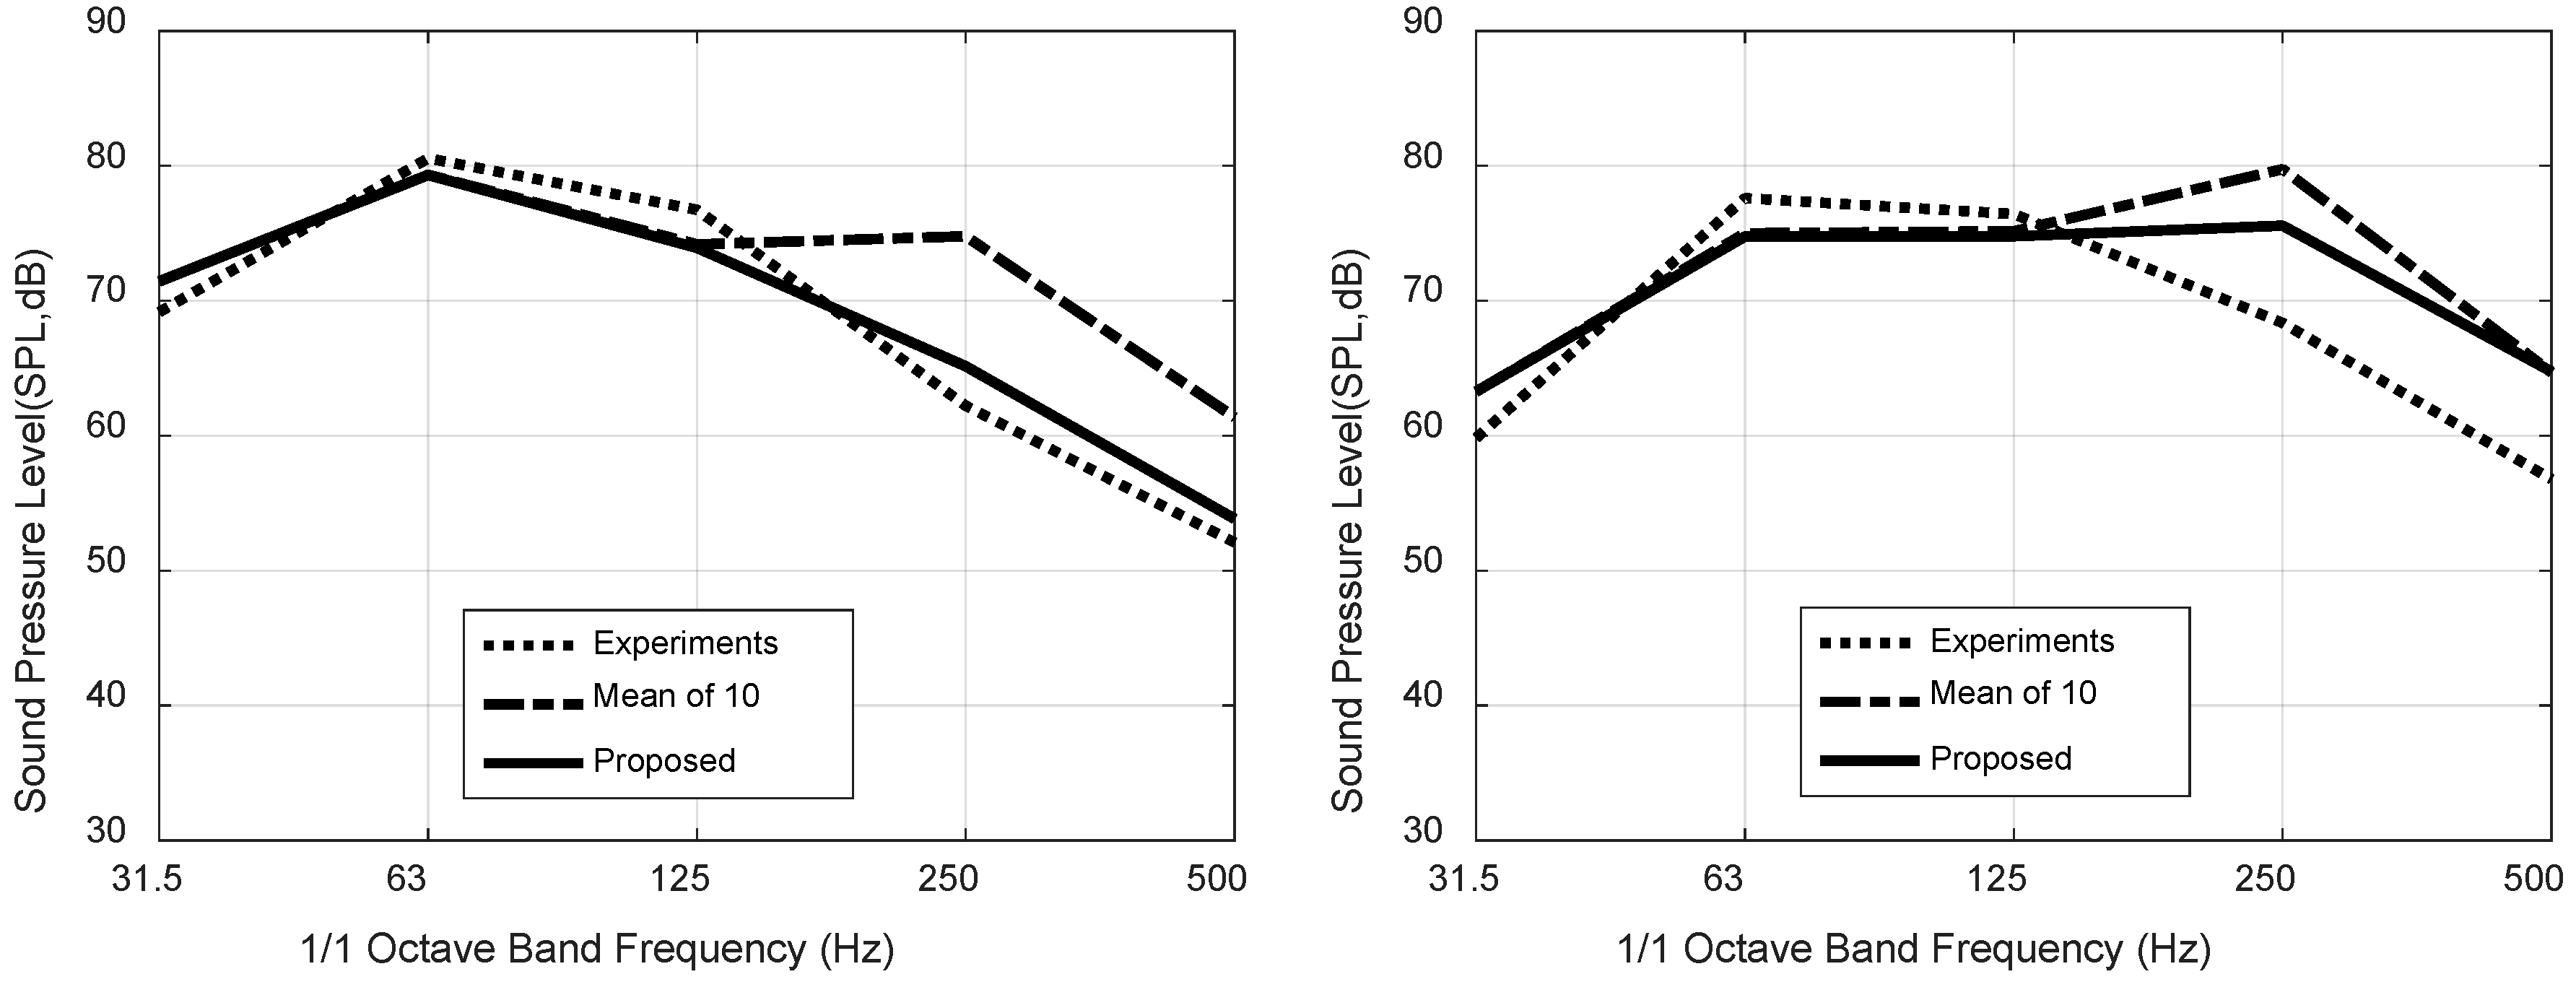
The main purpose of this study is to propose a numerical model on the impact source required to use a numerical analysis method with respect to the interlayer noise problem. Ten measurements were performed for each impact source, and an analytical impact force model was proposed using the mean value. With regard to the proposed model, a verification was conducted through the impact exposure level value presented by KS in relation to the proposed analytical impact force model. With the use of the verified analytical impact force model and the mean force of the 10 impact force measurement values, a numerical analysis on the wall-type structure was conducted. For verification of the analysis results, field noise measurements were performed, and a comparison with the numerical analysis results was carried out. According to the comparison results, the results of the numerical analysis using the analytical impact force model proposed in this study exhibited a relatively higher accuracy than the utilization of the mean force of 10 impact force measurement values.
Therefore, the analytical impact force model of the bang machine and impact ball proposed in this study demonstrated the possibility of approaches to numerical analysis along with research through existing experiments and is predicted to be used in a variety of studies attempting to resolve interlayer noise problems—such as numerical analytical research on the shape of new bottom plates and the characteristics of resilient materials, as well as variable research on the various boundary conditions (structural support and connection conditions, material properties, shape of the structure, etc.) which pose difficulties due to the problem of both limited costs and time in resolving interlayer noise problems. In addition, it is expected that the numerical analysis approaches of various conditions will help to resolve interlayer noise problems based on a fundamental understanding of the causes for the interlayer noise and transmission paths through the bottom plate and walls.

Acknowledgments

The authors acknowledge Minki Jeong and Yonggeun Yi of VEtech for their invaluable comments and technical support on the numerical analysis and experimental tests during this study. Additionally, this research was supported by a grant from the Strategic Research Project (A study on noise reduction solution for adjacent households in apartment houses) funded by the Korea Institute of Civil Engineering and Building Technology.

Author Contributions

Sangki Park and Haseog Kim conceived and designed the experiments; Haseog Kim performed the experiments; Sangki Park analyzed the statistical data; Sangki Park and Haseog Kim contributed reagents/materials/analysis tools; Sangki Park and Haseog Kim wrote the paper.

Conflicts of Interest

The authors declare no conflict of interest.

Abbreviations

The following abbreviations are used in this manuscript:
FEMFinite Element Method
BEMBoundary Element Method
ISOInternational Organization for Standardization
JISJapanese Industrial Standards
KSKorean Industrial Standards
EPSExpanded Polystyrene
SPLSound Pressure Level
SNQSingle Number Quantity

References

  1. The Ministry of Land Infrastructure and Transport. Article 3 (4) of the Enforcement Decree of the Building Act: Kinds of Buildings by Use; The Ministry of Land Infrastructure and Transport: Seoul, Korea, 2015.
  2. Statistics Korea. The Population and Housing Census. Available online: http://www.census.go.kr (accessed on 23 November 2015).
  3. Kim, K.-W.; Jeong, G.-C.; Sohn, J.-Y. Correlation between dynamic stiffness of resilient materials and lightweight floor impact sound reduction level. Trans. Korean Soc. Noise Vib. Eng. 2008, 18, 886–895. [Google Scholar]
  4. Housing and Urban Research Institute (HURI). A Study on the Development Orientation of Heavy Weight Impact Noise Reduction for Multi-Dwelling Houses; Housing and Urban Research Institute: Daejeon, Korea, 2013. [Google Scholar]
  5. Branco, F.G.; Godinho, L. On the use of lightweight mortars for the minimization of impact sound transmission. Constr. Build. Mater. 2013, 45, 184–191. [Google Scholar] [CrossRef]
  6. Yeon, J.; Kim, K.; Choi, H.; Yang, K.; Kim, K. Experiment evaluation for the heavy-weight impact sound of dry double-floor system—Effect of rubber hardness and ceiling structure. Trans. Korean Soc. Noise Vib. Eng. 2013, 23, 34–40. [Google Scholar] [CrossRef]
  7. Kim, K.-W.; Jeong, G.-C.; Sohn, J.-Y. Evaluation of the dynamic stiffness and heavy-weight floor impact sound reduction by composition of resilient materials. Trans. Korean Soc. Noise Vib. Eng. 2008, 18, 247–254. [Google Scholar]
  8. Seo, S.-H.; Jeon, J.-Y. 2-dimensional floor impact vibration analysis in bare reinforced concrete slab using finite element method. Trans. Korean Soc. Noise Vib. Eng. 2005, 15, 604–611. [Google Scholar]
  9. Jeon, J.-Y.; Yoo, S.-Y.; Jeong, Y.; Jeong, J.-H. The effect of the design elements of reinforced concrete slab on heavy-weight floor impact noise. J. Archit. Inst. Korea Plan. Des. 2006, 22, 329–336. [Google Scholar]
  10. Hwang, J.-S.; Moon, D.-H.; Park, H.-G.; Hong, S.-G.; Hong, G.-H. The numerical analysis of heavy weight impact noise for an apartment house. Trans. Korean Soc. Noise Vib. Eng. 2009, 19, 162–168. [Google Scholar]
  11. Pereira, A.; Godinho, L.; Mateus, D.; Ramis, J.; Branco, F.G. Assessment of a simplified experimental procedure to evaluate impact sound reduction of floor coverings. Appl. Acoust. 2014, 79, 92–103. [Google Scholar] [CrossRef]
  12. Davis, B.; Liu, D.; Murray, T.M. Simplified experimental evaluation of floors subject to walking-induced vibration. J. Perform. Constr. Facil. 2014, 28. [Google Scholar] [CrossRef]
  13. Neves e Sousa, A.; Gibbs, B.M. Parameters influencing low frequency impact sound transmission in dwellings. Appl. Acoust. 2014, 78, 77–88. [Google Scholar] [CrossRef]
  14. Robinson, M.; Hopkins, C. Prediction of maximum fast time-weighted sound pressure levels due to transient excitation from the rubber ball and human footsteps. Build. Environ. 2015, 94(Pt. 2), 810–820. [Google Scholar] [CrossRef]
  15. Korean Standards Committee. KS F 2810: Field Measurements of Impact Sound Insulation of Floors—Part 2: Method Using Standard Heavy Impact Sources; Korean Standards Committee: Seoul, Korea, 2012. [Google Scholar]
  16. International Organization for Standardization. ISO 10140: Acoustics—Laboratory Measurement of Sound Insulation of Building Elements. Part 3: Measurement of Impact Sound Insulation; International Organization for Standardization: Geneva, Switzerland, 2010. [Google Scholar]
  17. International Organization for Standardization. ISO 16283: Acoustics—Field Measurement of Sound Insulation in Buildings and of Building Elements—Part 2: Impact Sound Insulation; International Organization for Standardization: Geneva, Switzerland, 2015. [Google Scholar]
  18. Japan Standards Association. JIS A 1418: Acoustics—Measurement of Floor Impact Sound Insulation of Buildings. Part 2: Method Using Standard Heavy Impact Source; Japan Standards Association: Tokyo, Japan, 2000. [Google Scholar]
  19. The Ministry of Land Infrastructure and Transport. Notification on 2015-319: Criteria for Structure Recognition on the Interlayer Floor Impact Sound Insulation for the Prevention of Noise; The Ministry of Land Infrastructure and Transport: Seoul, Korea, 2015.
  20. The Ministry of Construction and Transportation. Notification on 2005-189: Criteria for Structure Recognition and Management on the Floor Impact Sound Insulation in Multi-Family Residential Housing; The Ministry of Construction and Transportation: Seoul, Korea, 2005.
  21. The Ministry of Land Infrastructure and Transport. Notification on 2015–727: Criteria for Structure Recognition and Management on the Floor Impact Sound Insulation in Multi-Family Residential Housing; The Ministry of Land Infrastructure and Transport: Seoul, Korea, 2015.
  22. MATLAB Version 8.6.0 (R2015b), The MathWorks Inc.: Natick, Massachusetts, USA, 2015.
  23. Inoue, K.; Yasuoka, M.; Tachibana, H. New heavy impact source for the measurement of floor impact sound insulation of buildings. In Proceedings of the 29th International Congress and Exhibition on Noise Control Engineering, Nice, France, 27–30 August 2000; pp. 27–30.
  24. Morse, P.M.C. Vibration and Sound, 2nd ed.; International Series in Pure and applied Physics; McGraw-Hill Book Company: New York, NY, USA, 1948. [Google Scholar]
  25. Rienstra, S.W.; Hirschberg, A. An Introduction to Acoustics; Eindhoven University of Technology: Eindhoven, The Netherlands, 2009. [Google Scholar]
  26. SIEMENS Software NX NASTRAN V10.0, version 10.0; SIEMENS Software: Plano, TX, USA, 2015.
  27. SIEMENS Software LMS Virtual.Lab R13.4, version R13.4; SIEMENS Software: Plano, TX, USA, 2015.
  28. The Ministry of Land Affairs Transport and Maritime. Structural Concrete Code (KCI Code 2012); The Ministry of Land Affairs Transport and Maritime: Seoul, Korea, 2012.
  29. Kilar, V.; Azinović, B.; Koren, D. Energy efficient construction and the seismic resistance of passive houses. Int. J. Civil Environ. Struct. Constr. Archit. Eng. 2014, 8, 365–371. [Google Scholar]
  30. Chen, W.; Hao, H.; Hughes, D.; Shi, Y.; Cui, J.; Li, Z.-X. Static and dynamic mechanical properties of expanded polystyrene. Mater. Des. 2015, 69, 170–180. [Google Scholar] [CrossRef]
  31. ONDA Tables of Acoustic Properties of Materials. Available online: http://www.ondacorp.com/tecref_acoustictable.shtml (accessed on 29 December 2015).
  32. Korean Standards Committee. KS F 2863: Rating of Floor Impact Sound Insulation for Impact Source in Buildings and of Building Elements—Part 2—Floor Impact Sound Insulation against standard Heavy Impact Source; Korean Standards Committee: Seoul, Korea, 2007. [Google Scholar]
  33. International Organization for Standardization. ISO 717-2:2013: Acoustics—Rating of sound Insulation in Buildings and of Building Elements—Part 2: Impact Sound Insulation; International Organization for Standardization: Geneva, Switzerland, 2013. [Google Scholar]
Figure 1. Impact sources and experimental testing devices: (a) bang machine; (b) impact ball; and (c) impact force source tester.
Applsci 06 00120 g001
Figure 2. Overall procedure of computing Impact Exposure Level: (a) time series data; (b) dividing into and converting to 1/1 octave band center frequency; and (c) computed impact exposure level.
Applsci 06 00120 g002
Figure 3. Ten experimental test data results of the bang machine: (a) time series data; and (b) impact exposure level.
Applsci 06 00120 g003
Figure 4. Analytical impact force model for the bang machine: (a) time series data; and (b) computed impact exposure level.
Applsci 06 00120 g004
Figure 5. Ten experimental test data of the impact ball: (a) time series data; and (b) computed impact exposure level.
Applsci 06 00120 g005
Figure 6. Analytical impact force model for the impact ball: (a) time series data; and (b) computed impact exposure level.
Applsci 06 00120 g006
Figure 7. Improved analytical impact force model for the impact ball: (a) Time series data; and (b) computed impact exposure level.
Applsci 06 00120 g007
Figure 8. Overall procedure of structural vibration and acoustic analysis.
Applsci 06 00120 g008
Figure 9. Relationship among density, pressure, and displacement.
Applsci 06 00120 g009
Figure 10. Drawing and details of the test specimen: (a) top view; (b) front view; and (c) wall-type structure specimen.
Applsci 06 00120 g010
Figure 11. Details of experimental testing: (a) impact source locations; (b) bang machine; and (c) impact ball.
Applsci 06 00120 g011
Figure 12. Microphone locations for noise measurements: (a) microphone locations in KS (Korean industrial standards); and (b) microphone setting for experimental testing.
Applsci 06 00120 g012
Figure 13. Acoustic response of experimental test for five microphones and its mean value: (a) bang machine; and (b) impact ball.
Applsci 06 00120 g013
Figure 14. Graphical representation of the numerical model for the test specimen: (a) wall-type specimen; and (b) the computational model for numerical analysis.
Applsci 06 00120 g014
Figure 15. Acoustic response of numerical analysis for the bang machine: (a) The mean of ten experiments force model; (b) The proposed impact force model.
Applsci 06 00120 g015
Figure 16. Acoustic response of numerical analysis for the impact ball: (a) the mean of ten force model experiments; and (b) the proposed impact force model.
Applsci 06 00120 g016
Figure 17. Comparison of test results and numerical results.
Applsci 06 00120 g017
Table 1. The characteristics of two impact sources in Korean industrial standards (KS).
ItemBang MachineImpact Ball
Effective Mass (kg)7.32.5
Air Pressure (Pa)2.5 × 10⁵-
Drop Height (m)0.851.0
Rebound Coefficient0.80.8
Shape (mm)-80
Impact Time (ms)20 ± 220 ± 2
Table 2. Impact exposure level in KS.
1/1 Octave Band Center Frequency (Hz)1/1 Octave Band Impact Exposure Level (dB)Allowable Variation (dB)
Bang MachineImpact Ball
31.547.039.0± 1.0
6340.031.0± 1.5
12522.023.0± 1.5
25011.517.0± 2.0
5005.512.5± 2.0
Table 3. The coefficients for the proposed bang machine impact force model.
CoefficientValue
C0−0.001054
C10.062730
C2−1.175034
C35.420442
C48.873756
C5411.677662
C6−12.918740
Table 4. Impact exposure level for the bang machine case.
Center Frequency (Hz)Korean industrial Standards (KS) Level (dB)Mean Case (dB)Proposed (dB)
LowMiddleUpper
31.546.047.048.046.30646.305
63.038.540.041.539.35539.360
125.020.522.023.521.78721.722
250.09.511.513.517.564 113.330
500.03.55.57.511.288 14.174
1 Violation of KS.
Table 5. Impact exposure level for the mean value of the impact ball’s test data.
Center Frequency (Hz)KS Level (dB)Current (dB)
LowMiddleUpper
31.538.039.040.038.382
63.029.531.032.530.836
125.021.523.024.522.928
250.015.017.019.020.251 1
500.010.512.514.513.746
1 Violation of KS.
Table 6. The coefficients for the proposed impact ball impact force model.
CoefficientValue
C0−0.002691
C10.164272
C2−3.850763
C343.537537
C4−258.213331
C5862.686073
C6−105.837420
Table 7. Impact exposure level for impact ball’s numerical model.
Center Frequency (Hz)KS Level (dB)Proposed (dB)Improved (dB)
LowMiddleUpper
31.538.039.040.038.37638.364
63.029.531.032.530.86130.845
125.021.523.024.522.82022.580
250.015.017.019.016.47316.180
500.010.512.514.58.330 112.530
1 Violation of KS.
Table 8. Material property of the test specimen.
NameConcreteExpanded Polystyrene (EPS)
Modulus of Elasticity (GPa)24.8340.005
Density (ρ, kg/m3)2400.015.0
Poisson’s Ratio (ν)0.1670.05
Acoustic Impedance (Z, MRayl)8.02.5
Table 9. Sound pressure level (SPL) and single number quantity (SNQ) for two impact sources.
1/1 Octave Band (Hz)Bang Machine (dB)Impact Ball (dB)
31.569.1759.83
6380.5677.61
12576.7576.44
25062.2268.36
50052.0856.77
SNQ5759
Table 10. Comparison of SNQ.
CaseBang Machine (dB)Impact Ball (dB)
Experimental Test 5759
Numerical AnalysisMean of 10 test6266
Proposed Model5764

