Article

Identification of a Critical Time with Acoustic Emission Monitoring during Static Fatigue Tests on Ceramic Matrix Composites: Towards Lifetime Prediction †

INSA de Lyon, MATEIS (UMR CNRS 5510), 7 avenue Jean Capelle, 69621 Villeurbanne Cedex, France
*
Author to whom correspondence should be addressed.
This paper is an extended version of paper presented in the 6th International Conference on Emerging Technologies in Non-destructive Testing (ETNDT6), Brussels, Belgium, 27–29 May 2015.
Appl. Sci. 2016, 6(2), 43; https://doi.org/10.3390/app6020043
Submission received: 15 December 2015 / Revised: 19 January 2016 / Accepted: 21 January 2016 / Published: 3 February 2016
(This article belongs to the Special Issue Acoustic and Elastic Waves: Recent Trends in Science and Engineering)

Abstract

:
Non-oxide fiber-reinforced ceramic-matrix composites are promising candidates for some aeronautic applications that require good thermomechanical behavior over long periods of time. This study focuses on the behavior of a SiCf/[Si-B-C] composite with a self-healing matrix at intermediate temperature under air. Static fatigue experiments were performed below 600 °C and a lifetime diagram is presented. Damage is monitored both by strain measurement and acoustic emission during the static fatigue experiments. Two methods of real-time analysis of associated energy release have been developed. They allow for the identification of a characteristic time that was found to be close to 55% of the measured rupture time. This critical time reflects a critical local energy release assessed by the applicability of the Benioff law. This critical aspect is linked to a damage phase where slow crack growth in fibers is prevailing leading to ultimate fracture of the composite.

1. Introduction

Ceramic Matrix Composites (CMCs), and more particularly SiC/SiC composites are very attractive candidates for many high-temperature structural applications, because of their excellent creep resistance, high-temperature strength and light weight. Damage tolerance is achieved through the use of low shear strength fiber coatings that deflect cracks along the interfaces [1,2,3,4,5,6,7]. The multi-layered matrix was introduced in the new generations of SiCf/[Si-B-C] composites in order to improve the lifetime under medium and high temperatures thanks to the formation of sealant glasses [8,9].
Future engine applications in civil aircrafts are foreseen for such composites. These applications require that the material can resist both severe conditions (temperatures up to 1200 °C under air) and very long static loadings at intermediate temperatures (400–700 °C during tens of thousands of hours). Various authors have studied the mechanical behavior of SiCf/SiC composites and the damage mechanisms occurring at high temperatures [1,2,3,4,5,6,7]. Now more information is needed at intermediate temperatures: the oxidation kinetics of the different constituents are complex, and the effect of matrix sealing on the lifetime of the composite has to be examined. Expected lifetimes in use conditions are several thousands of hours, which can hardly be reached by laboratory tests for practical reasons. Therefore, a real-time prediction of the remaining lifetime during tests is necessary. It requires the monitoring of damage evolution for which AE measurement is a suitable technique. In fact, the AE technique consists in the recording and analysis of elastic waves created during material damage. It provides real-time data on initiation and evolution of damage in terms of location and mode.
Common analysis of AE is based on diagrams of cumulative hits or counts or histograms of amplitudes. Nevertheless, in the case of composite material, this approach is inadequate in order to identify the acoustic emission signature of several damage mechanisms. It was improved by grouping signals of similar shapes into clusters using classifier parameters [10]. Many works [11,12,13,14,15,16] have shown that AE techniques and multivariable classification techniques are the basis of pattern recognition tools. Kostopoulos [12], Godin [13,14], Moevus [15,16] have identified different classes of AE signals which were attributed to damage modes in oxide/oxide, glass/polyester and SiCf/[Si-B-C] composites. Moevus [16] analyzed the AE data using an unsupervised multi-variable clustering technique. This analysis showed that several types of signals may be distinguished, and that the obtained clusters were consistent with the expected damage modes in 3D SiC/SiC composites. In this way, a careful analysis of acoustic emission signals can lead to the discrimination of the different damage mechanisms occurring in a composite material. It is a possible solution for identification of damage during service with a view to component lifetime control.
A second analysis is based on a global AE analysis, on the investigation of liberated energy, with a view to identify a critical point. Many researchers investigated the elastic energy release during the failure process of materials [17,18,19,20,21,22,23,24]. They all observed that the energy release accelerated following a power law. These models are representative of an avalanche behavior very similar to that observed in seismicity.
This study focuses on static fatigue experiments realized at intermediate temperature under air on a SiCf/[Si-B-C] composite with a self-healing matrix. A lifetime diagram is presented, and the evolution of several damage indicators is discussed. The objective of this approach is to propose a method based on acoustic energy in order to evaluate the remaining lifetime during long-term mechanical tests. This approach is based on the determination of energy released and identification of a critical point, in energy release during mechanical test. Therefore, two criteria have been defined which allow predicting the end of a static fatigue test knowing the AE activity emitted during the first half of the test. Therefore, beyond this characteristic point the criticality can be described by a power-law in order to evaluate time to failure. Moreover, a supervised classification method was used to differentiate the signals generated during fatigue tests performed on composites at intermediate temperature and build a specific library [16]. This library was used to identify the damage modes generated during fatigue tests performed at various temperatures, in order to establish a link between this critical time and the damage mechanisms.

2. Experimental Procedure
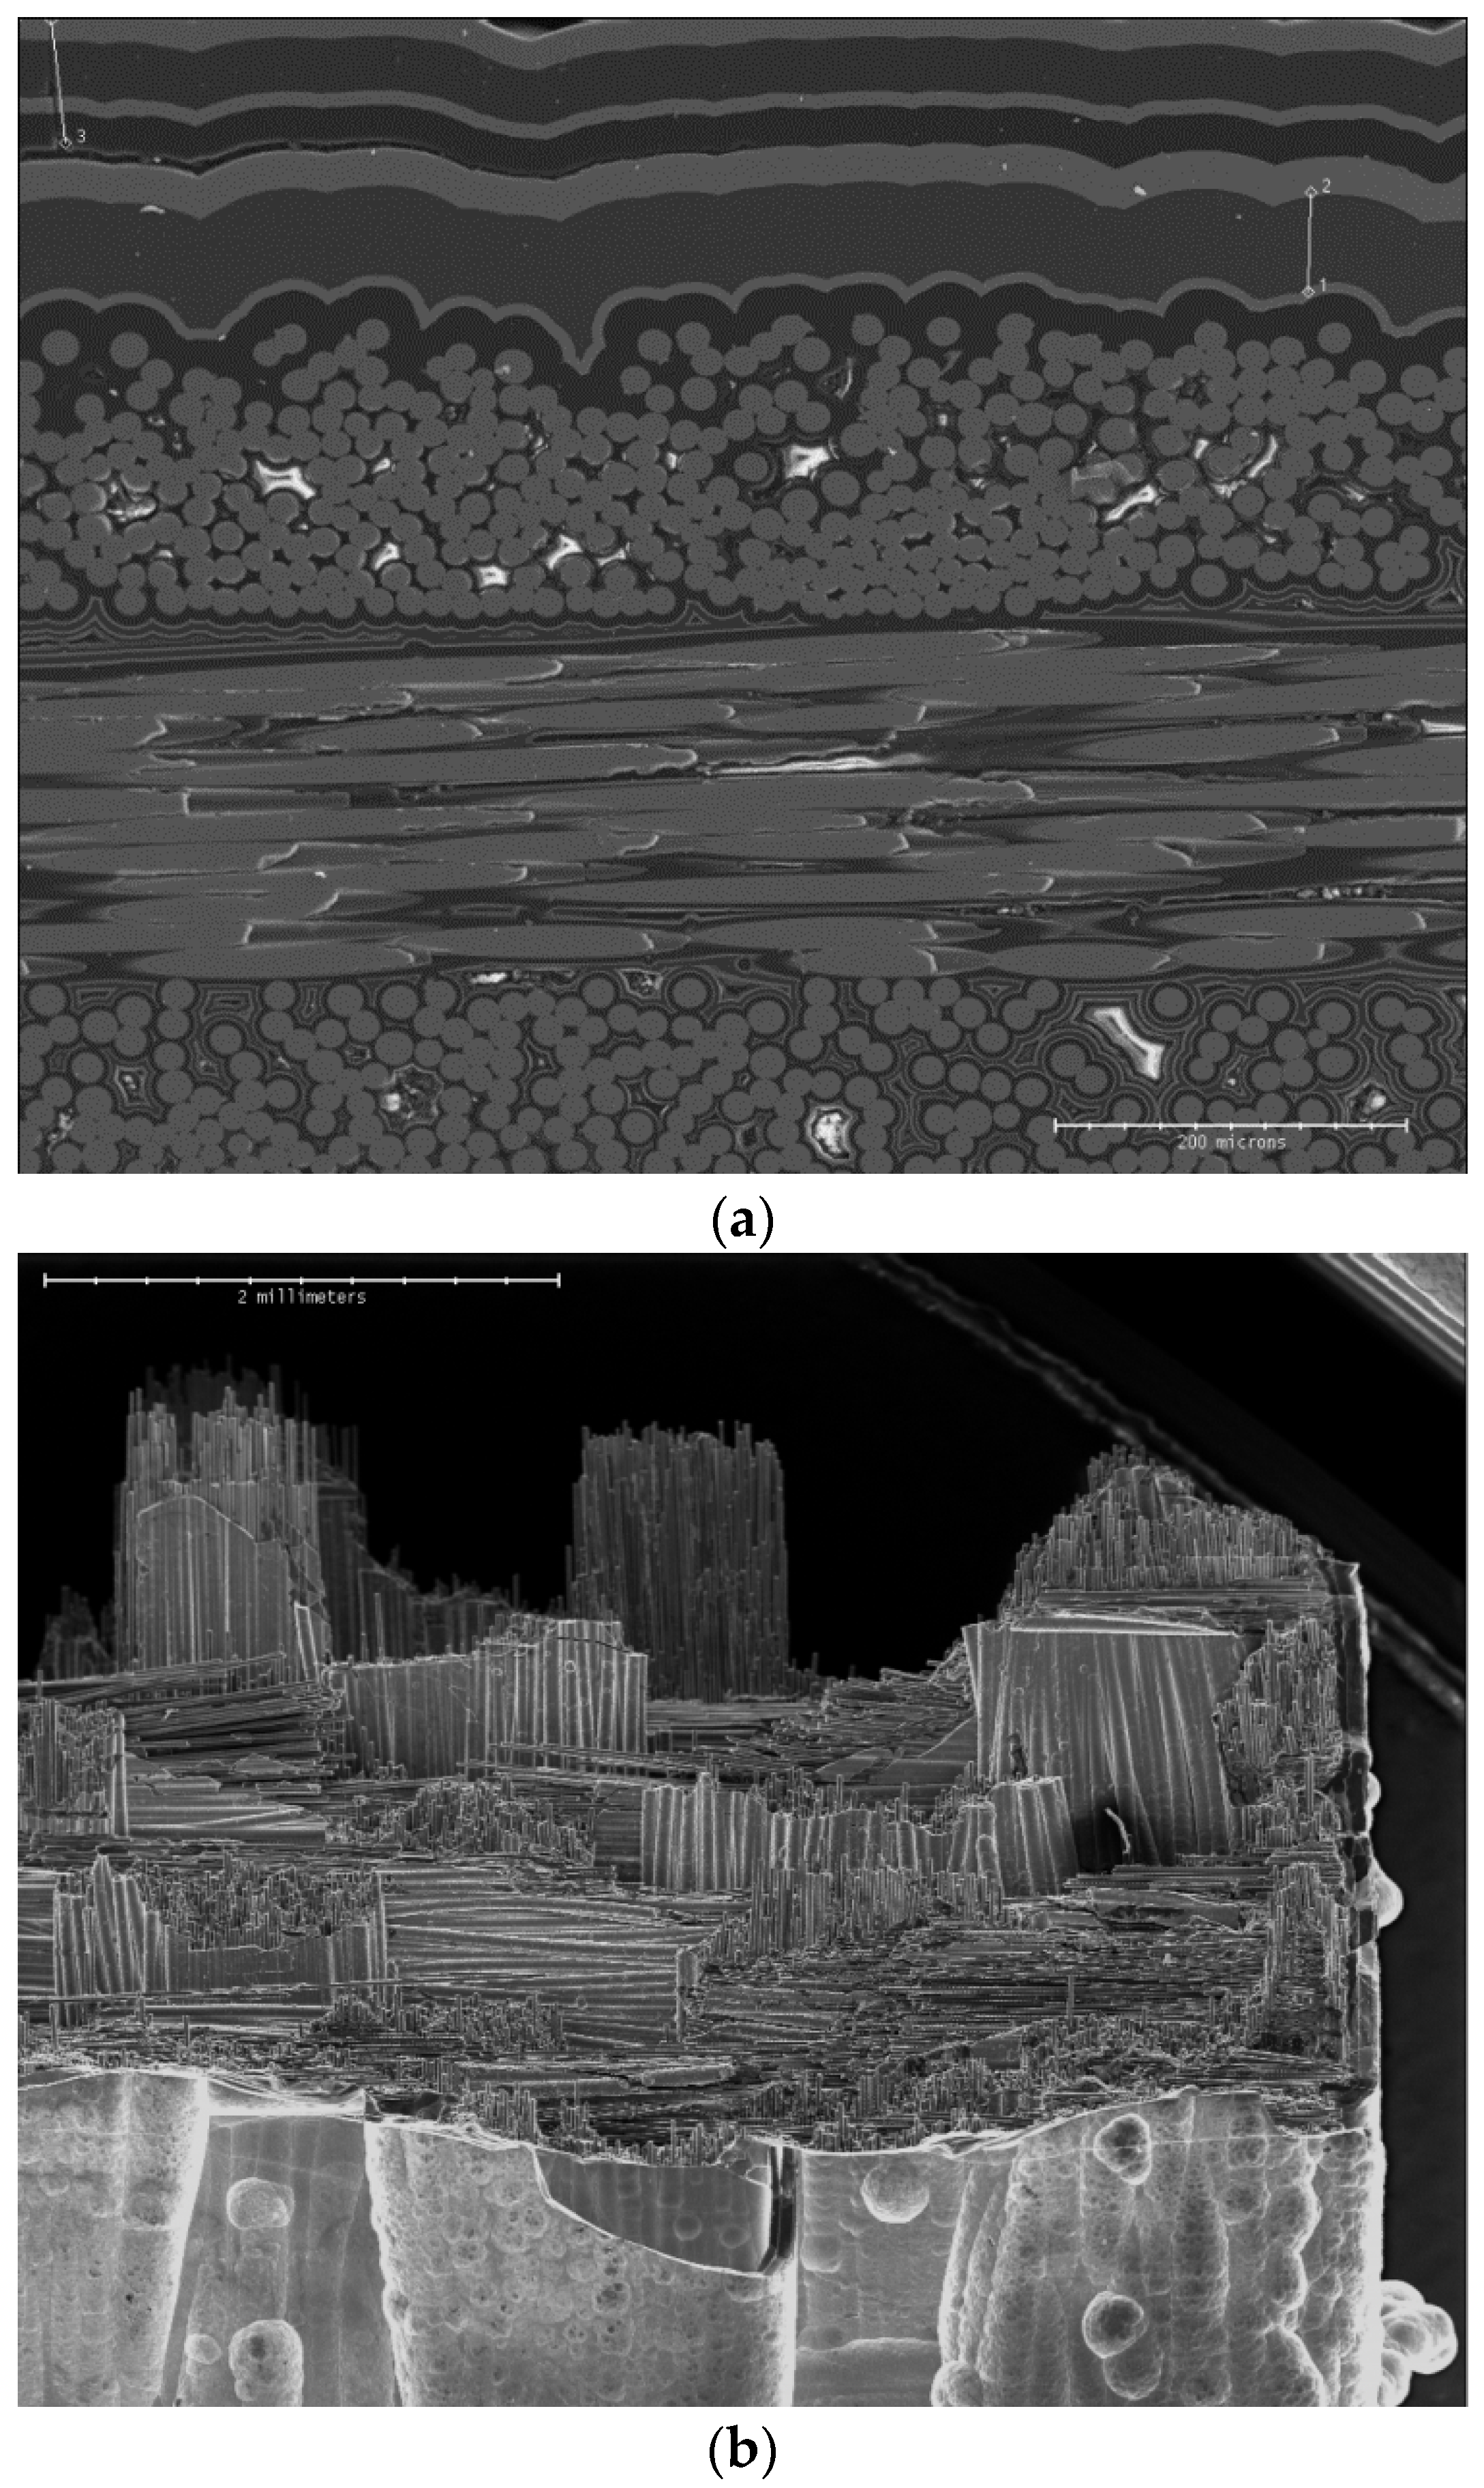
2.1. Material

The material, manufactured by SAFRAN-HERAKLES Group (Bordeaux, France), had a multilayered [Si-B-C] reinforced matrix obtained by chemical vapor infiltration on SiC fibers and a PyC interface layer (Figure 1). This 2.5D woven composite is composed of Hi-Nicalon fibers, a pyro-carbon interphase layer and a self-healing matrix. This matrix has been processed by means of several chemical vapor infiltrations with various compositions, based on the ternary Si-B-C system. The external surface is protected by a seal-coat. The composite contains a volumic fraction of fibers equal to 35 vol.% and 20 vol.% of porosity. Dog-bone shaped specimens were used with the following dimensions: thickness 4 mm, width 16 mm, working length 40 mm with a constant cross section of 64 mm2.
Figure 1. (a) SEM micrograph of the cross-section of SiCf/[Si-B-C] composites; (b) Typical fracture surface of SiCf/[Si-B-C] composite.
Applsci 06 00043 g001

2.2. Static Fatigue Tests

Static fatigue tests were performed under uniaxial tensile loading with one direction of fibers parallel to the loading axis. Tests were carried out at 450 °C, 500 °C and 560 °C under air, on a pneumatic testing machine. Before loading, specimens were heated up to the testing temperature at a rate of 50 °C/min and held during 30 min to get a uniform temperature distribution in the gauge section. Specimens were loaded at a constant rate of 600 N/min up to a constant stress chosen in the range of 44% to 95% of the rupture stress. Specimen elongation was measured using a high temperature extensometer.
Seldom unload-reload cycles were applied every twelve hours in order to measure the secant elastic modulus changes during static fatigue and to evaluate the damage parameter D (Figure 2). E0 is the elastic modulus in the undamaged state.
Figure 2. Schematic hysteresis loop and measure of the hysteresis loops modulus, E0 is the initial Young’s modulus, Ei is the secant elastic modulus for the unloading-reloading cycle i.
Applsci 06 00043 g002

2.3. Acoustic Emission Monitoring

To detect acoustic emission, two MICRO-80 sensors (MISTRAS Group, Sucy en Brie, France) were put on the specimen inside the grips with vacuum grease as a coupling agent. Acquisition parameters were set as follows: preamplification 40 dB, threshold 32 dB, peak definition time 50 μs, hit definition time 100 μs, hit lockout time 1000 μs. AE signal descriptors such as amplitude, energy, duration, counts, average frequency, rise time and location as well as time, load and strain were recorded in real time by a MISTRAS 2001 data acquisition system.
For AE sources localization, AE wave velocity Ce0 was determined before tests using a pencil lead break procedure on as received composites. This velocity was measured equal to 10,000 m/s. Since the elastic modulus decreases as damage occurs in the material, it is important to take into account the evolution of Ce during the mechanical test in order to better evaluate the location of the AE sources. As proposed by Morsher [25], the elastic secant modulus during unloading Ei(ε) was measured during a cycled tensile test, where hysteresis loops were obtained at different strains. The velocity Ce(ε) was then determined by using the Equation (1):
C e ( ε ) C e 0 = E i ( ε ) E 0
where Ce0 and E0 are respectively the velocity and the elastic modulus in the undamaged state and Ce(ε), Ei(ε) respectively the velocity and the elastic modulus under a maximum strain ε. At the end of the tensile test, the velocity on SiC/SiC composite was found to be equal to 6480 m/s, instead of 10,000 m/s on the undamaged state. This decrease of wave velocity is thus not negligible. The location of sources has been calculated using the difference in times of arrival on each sensor. Only the signals coming from the working length of the specimens are then analyzed.

3. Acoustic Emission Analysis

3.1. Definition of the Acoustic Energy

Energy of an AE signal includes the energy released by the source at crack initiation and is affected by various parameters: wave propagation distance, damage attenuation, sensor/material surface coupling and sensor frequency response. Wave theory states that the energy of an acoustic wave decreases exponentially with the increase of propagation distance. Therefore, the following equation was proposed to describe the energy of recorded AE signals (for instance, at sensor 1) received from the source n [26,27]:
E 1 ( n ) = E s ( n ) A 1 e - B ( L + x ( n ) )
Es(n) is the energy released at source n in the form of elastic waves. Due to differences in coupling between sensors and material surface or in sensors frequency responses, for a source at equal distance, the sensors may record significantly different amounts of energy. Thus, A1 is the proportion of source energy that is recorded by sensor 1. It is a constant characteristic of sensor. L + x(n) is the propagation distance from source n to the sensor 1 (2L is the distance between two sensors). The attenuation coefficient B is linked to the propagation medium, which may change with damage evolution. Similarly, AE signal energy received at sensor 2 is expressed as:
E 2 ( n ) = E s ( n ) A 2 e - B ( L - x ( n ) )
The source energy is then defined as the square root of the product of the amounts of energy received at both sensors for each source:
E ( n ) = E 1 ( n ) E 2 ( n )

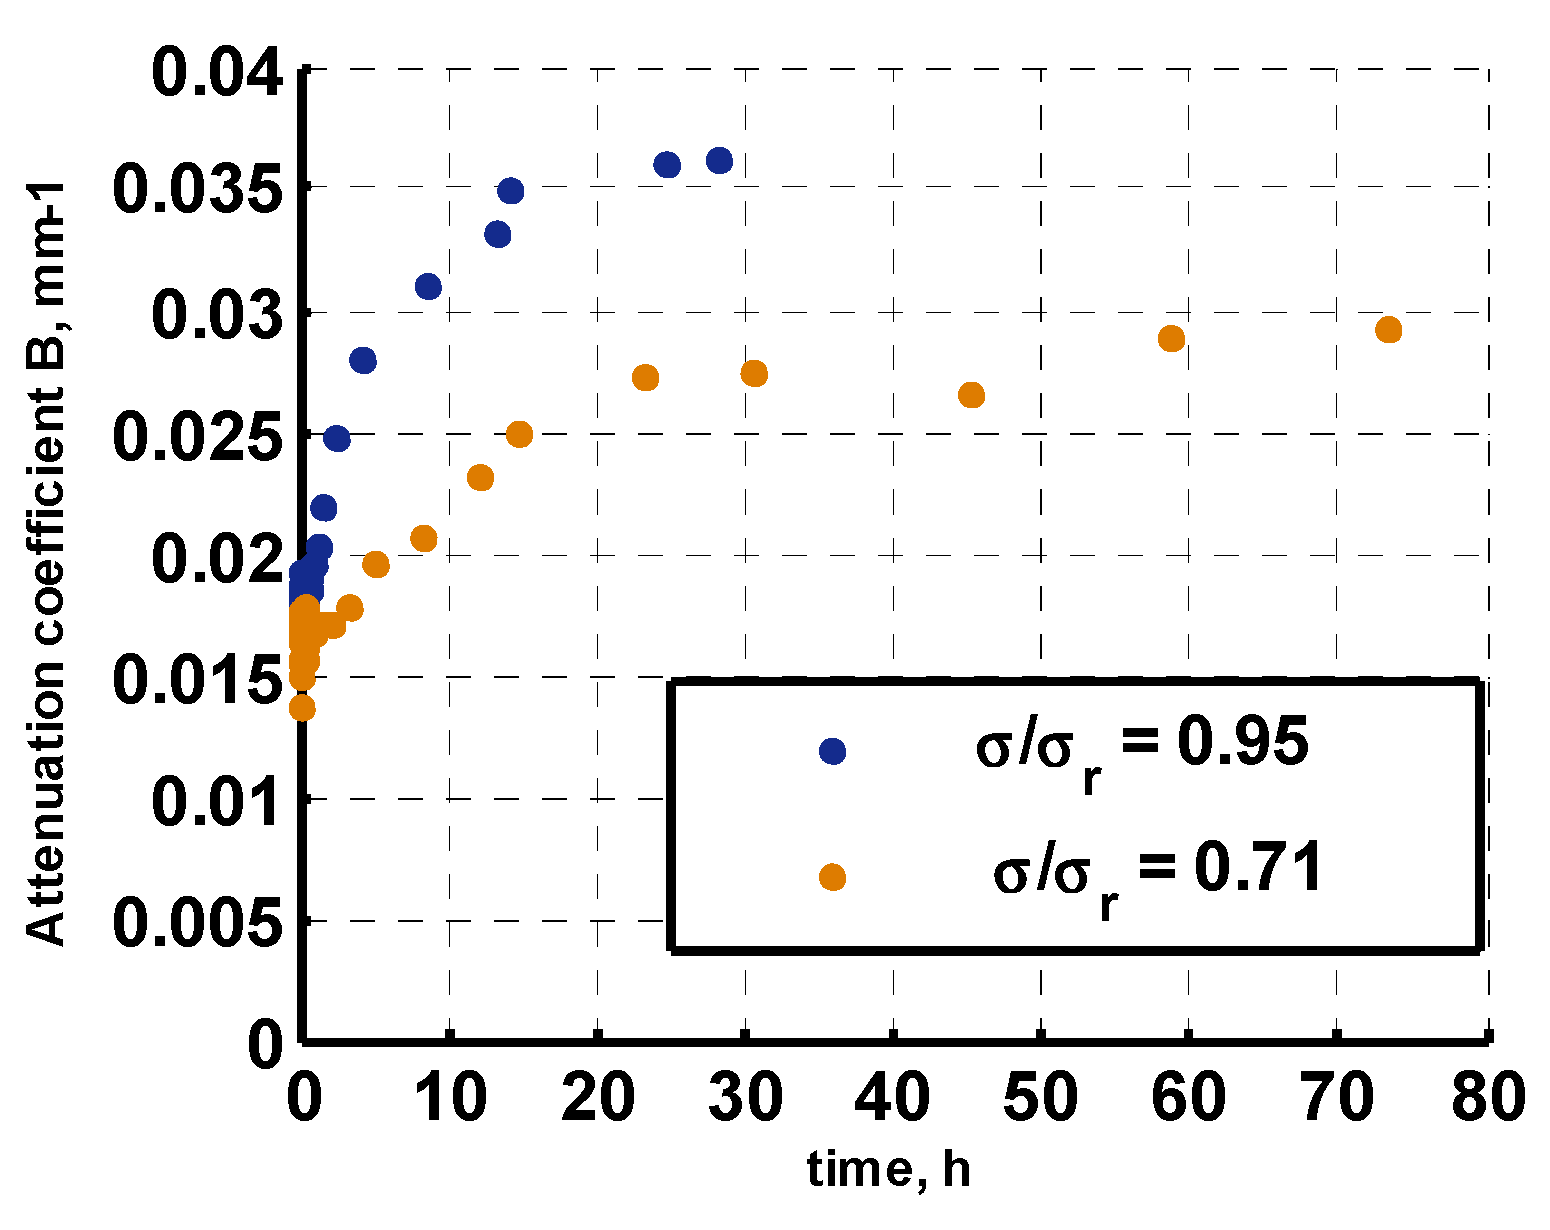
3.2. Attenuation Coefficient B

In order to evaluate energy attenuation [28], the ratio of AE signal energies recorded at both sensors is calculated for each source n. For an easier identification of attenuation coefficient B, x(n) is defined as the natural logarithm of this ratio. From Equations (2) and (3), it comes:
X ( n ) = log E 1 ( n ) E 2 ( n ) = log A 1 A 2 - 2 B x ( n )
The second term corresponds to the effect of propagation, related to source location x(n) and to attenuation coefficient B. Both parameters can be estimated from x(n) for various sources (1,2,..., n,...) since x(n) is a linear function of x. The coefficient of attenuation B can be determined from the slope of the linear fit.
Because attenuation varies with damage, parameters estimation is done at successive time intervals. For a given time interval, values of x(n) are analyzed in many space intervals in order to consider uncertainties in localization of AE sources. Estimation of attenuation constants was performed as follows. Attenuation is evaluated for each time interval with the median values of x(n) in all space interval (width: 10 mm, overlapping: 5 mm). Each time interval is defined by 2000 AE successive sources. Each median value of x(n) corresponds to a few hundred AE sources located in the same space-time interval. The linear approximation is repeated in consecutive time intervals. At every increment of 500 sources, a new time interval is considered. The overlapping is set in order to accurately monitor evolution of both attenuation parameters.

3.3. Coefficient of Emission RAE

The coefficient of emission R A E is defined [29], as the increment of energy ΔE recorded during a time increment Δt, divided by the total energy emitted during the initial loading of the sample:
R A E ( t ) = 1 E l o a d i n g Δ E Δ t
where Eloading is the cumulative AE energy for all the signals recorded during the initial loading up to the nominal load of the test, Δ E is the cumulative AE energy for all signals recorded during the interval [t; t + Δ t ].

3.4. Power Law

Benioff law [30], suggested initially for precursory phenomena of earthquakes, has been applied originally on composites [29]. Based on Equation (7), the increase of AE during fatigue is analyzed.
Ω ( t ) = i = 1 N ( t ) E i = Ω R + B ( t R t ) 1 γ
where Ei is the energy of the ith AE signal detected and N(t) is the number of AE signals recorded and located along the gauge length until time t.
Ω R is the value of Ω ( t ) = i = 1 N ( t ) E i when t = tR, tR is the failure time. B = ϕ 1 γ is negative, 1 γ is an exponent and φ is a constant.
The optimum circle method (OCM) [31], also developed in seismology, is used here to assess the relevance of the Benioff law. In addition, it determines which AE sources should be considered in order to achieve the best approximation. The OCM method was used to evaluate the time tstart when the AE energy is well simulated by the Benioff law. Two approximations are carried out on the energy release resulting from each time interval [tstart; tr]: a power-law approximation using the Benioff law and a linear approximation (Ω(t) = αt + β) used as reference. The c-value is defined by the ratio of the root mean square error of the approximation by the Benioff law over that of the linear fit. When the c-value is lower than 1, there is a positive contribution of the Benioff law since the approximation error is lower than that of a linear fit. It is a relative validation of the relevance of the approximation by the Benioff law. Therefore, to ensure quality of the approximation, only c-values lower than 0.5 are considered to be relevant.

3.5. Identification of Damage Mechanisms with Supervised Clustering

In such CMCs, matrix cracking occurs in several modes of cracking [16]. First, cracks initiate in the external seal-coat and in macropores inside the composite, then propagate through the inter-yarn matrix. Afterwards cracks propagate inside the transverse yarns through fiber/matrix interfaces. Multiple matrix cracking finally occurs inside the axial yarns. These cracks are deviated by the fiber/matrix interphase layer, yielding to fiber debonding and overloading. Some fiber breaks occur under high stresses. They rapidly lead to unstable fracture of entire yarns and of the composite. Hence, the sources of AE are the various matrix cracks, fiber/matrix interfacial debonding, individual fiber fractures and yarn ruptures.
The supervised classification technique requires a data base of signals that have been labelled: the training set. This training set was created by merging data collected during tensile test [16]. As described in the previous paper [16], the analysis of AE signals, observation of microstructures and analysis of the mechanical behavior of the composite led to the identification of 4 types of AE signals and to the following labelling of classes:
Class A: Signals of cluster A are assigned to two damage mechanisms which are chronologically separated: seal coat cracking and tow breaks.
Class B: cluster B contains also signals from two damage mechanisms which are chronologically well separated: longitudinal matrix cracking and individual fiber breaks in the fracture zone just before failure.
Class C: Cluster C contains signals with relatively short duration, short rise time and low amplitude when compared to the others: transversal matrix cracking.
Class D: this cluster is the last one to be activated and it becomes more active as strain increases and the d-type signals have a longer rise time when compared to other signals: sliding at fiber/matrix interfaces, fiber/matrix debonding.
In order to establish the training set of labelled signals for the supervised analysis, the same amount of signals (500 signals) in each class (A, B, C and D) was used. This training set included all the damage modes that may operate in this composite.
The supervised method consists in comparing each detected signal to those of the library and to assign it to the class of the K nearest neighbors [32] in the library. First, it is necessary to determine the number K of nearest neighbors required to obtain the best classification. For this purpose, a self-validating procedure was used which consists in comparing each signal of the training set to all the others. The classification error rate was estimated for all the values of K using the “leave-one-out” method [33]. The optimal value of K corresponded to the lowest value of error, and in the present study K = 11, and error = 2.5%. Then, for each AE signal of a given test, the Euclidean distance to all signals of the training set was calculated and the signal was labelled according to the class the most frequent class among its 11 nearest neighbors. The supervised clustering procedure was carried out on the different fatigue static tests.

4. Results and Discussion

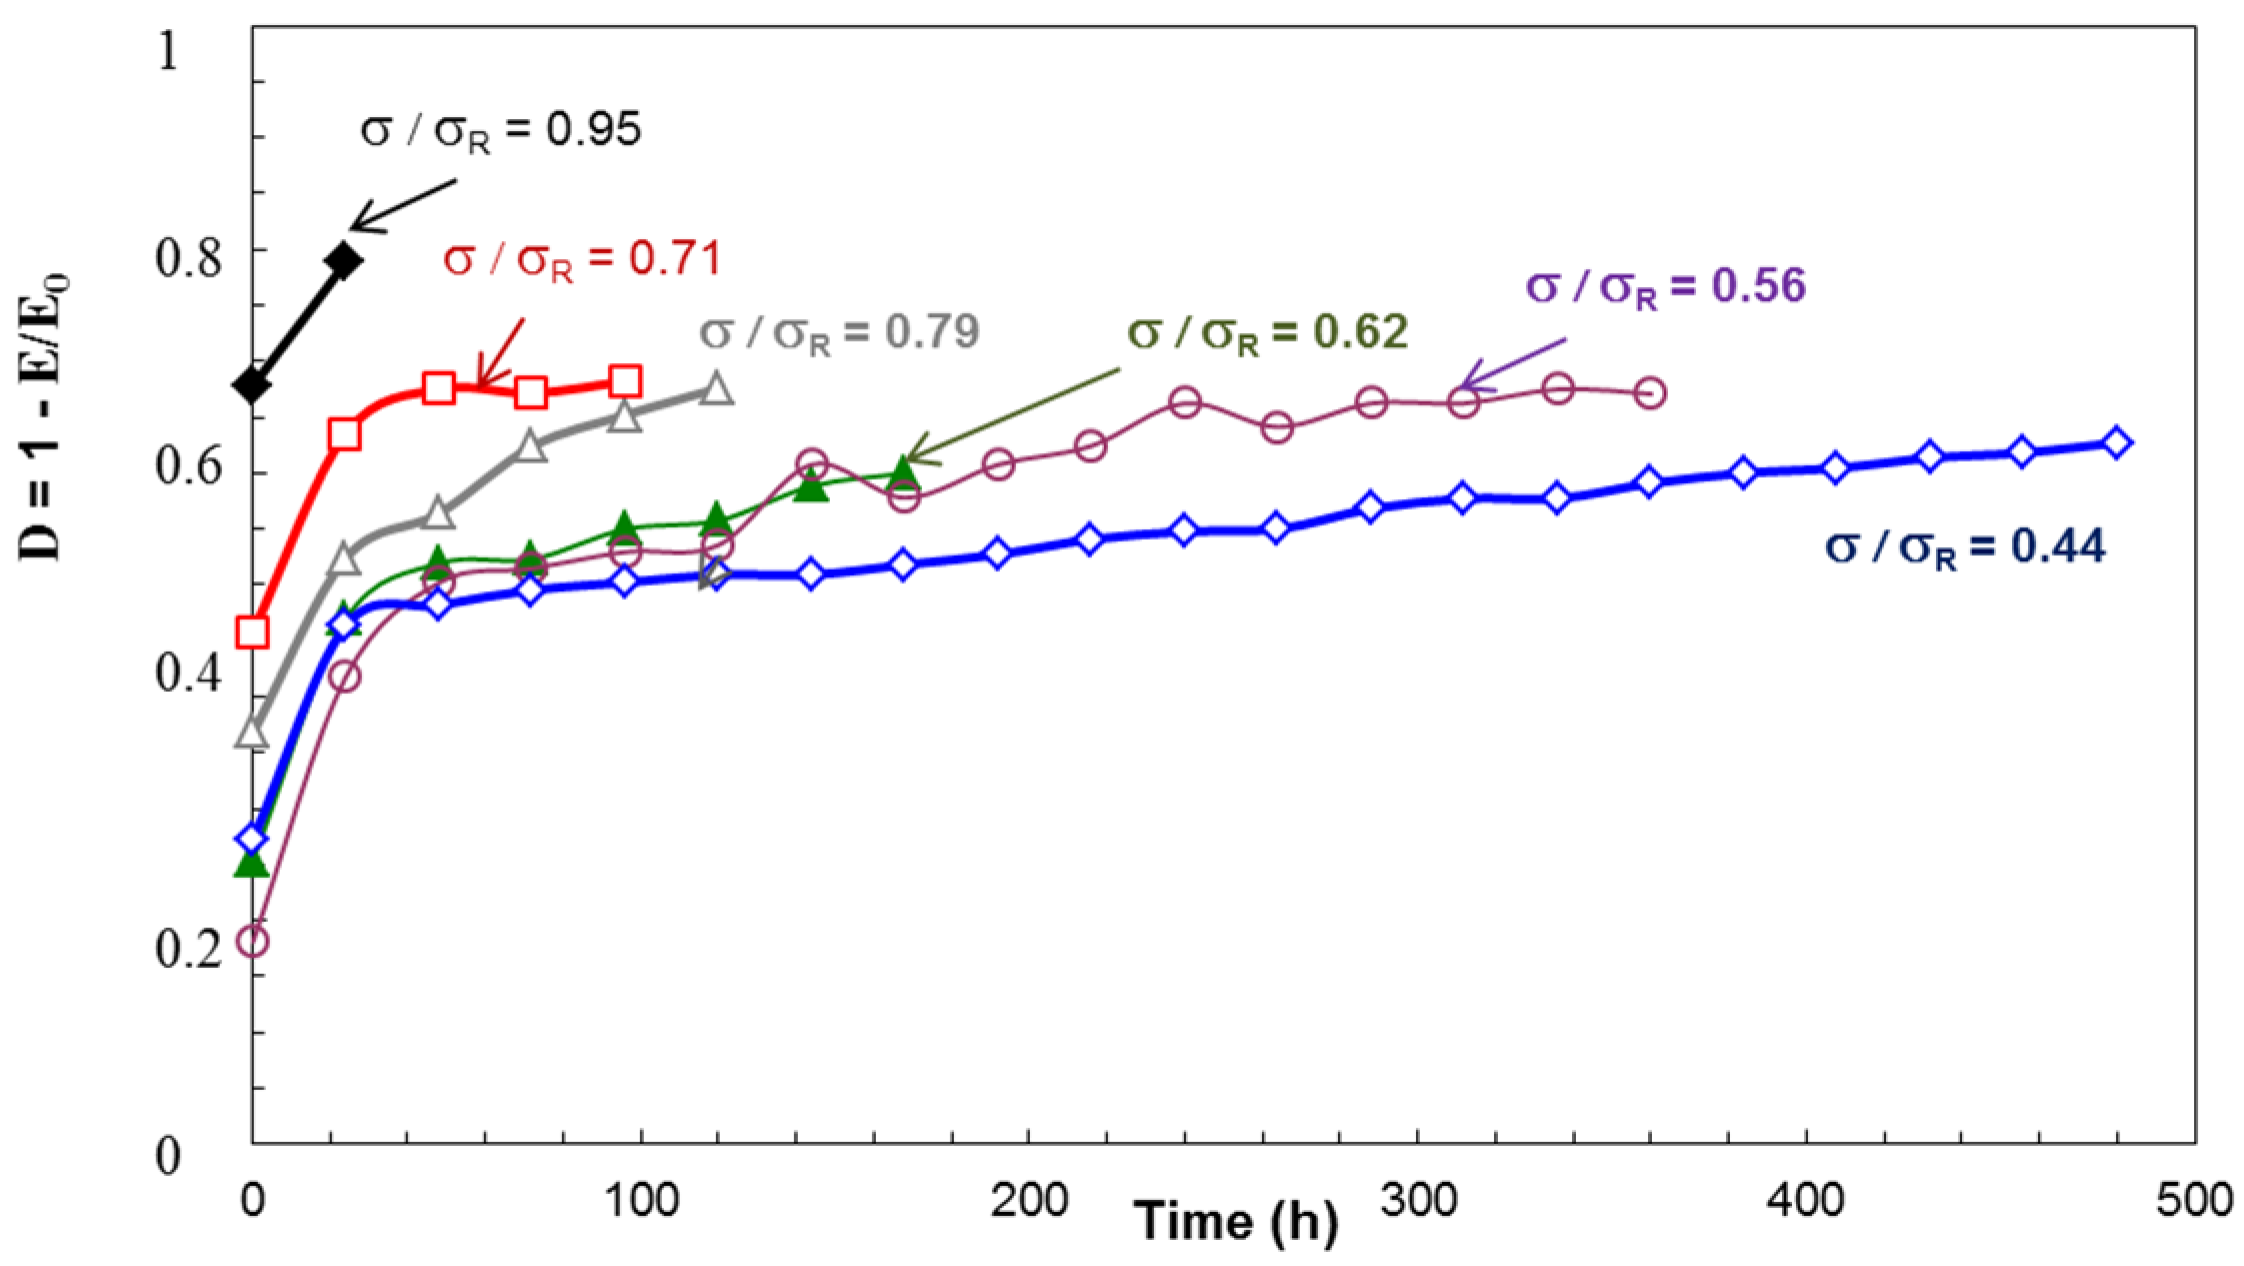
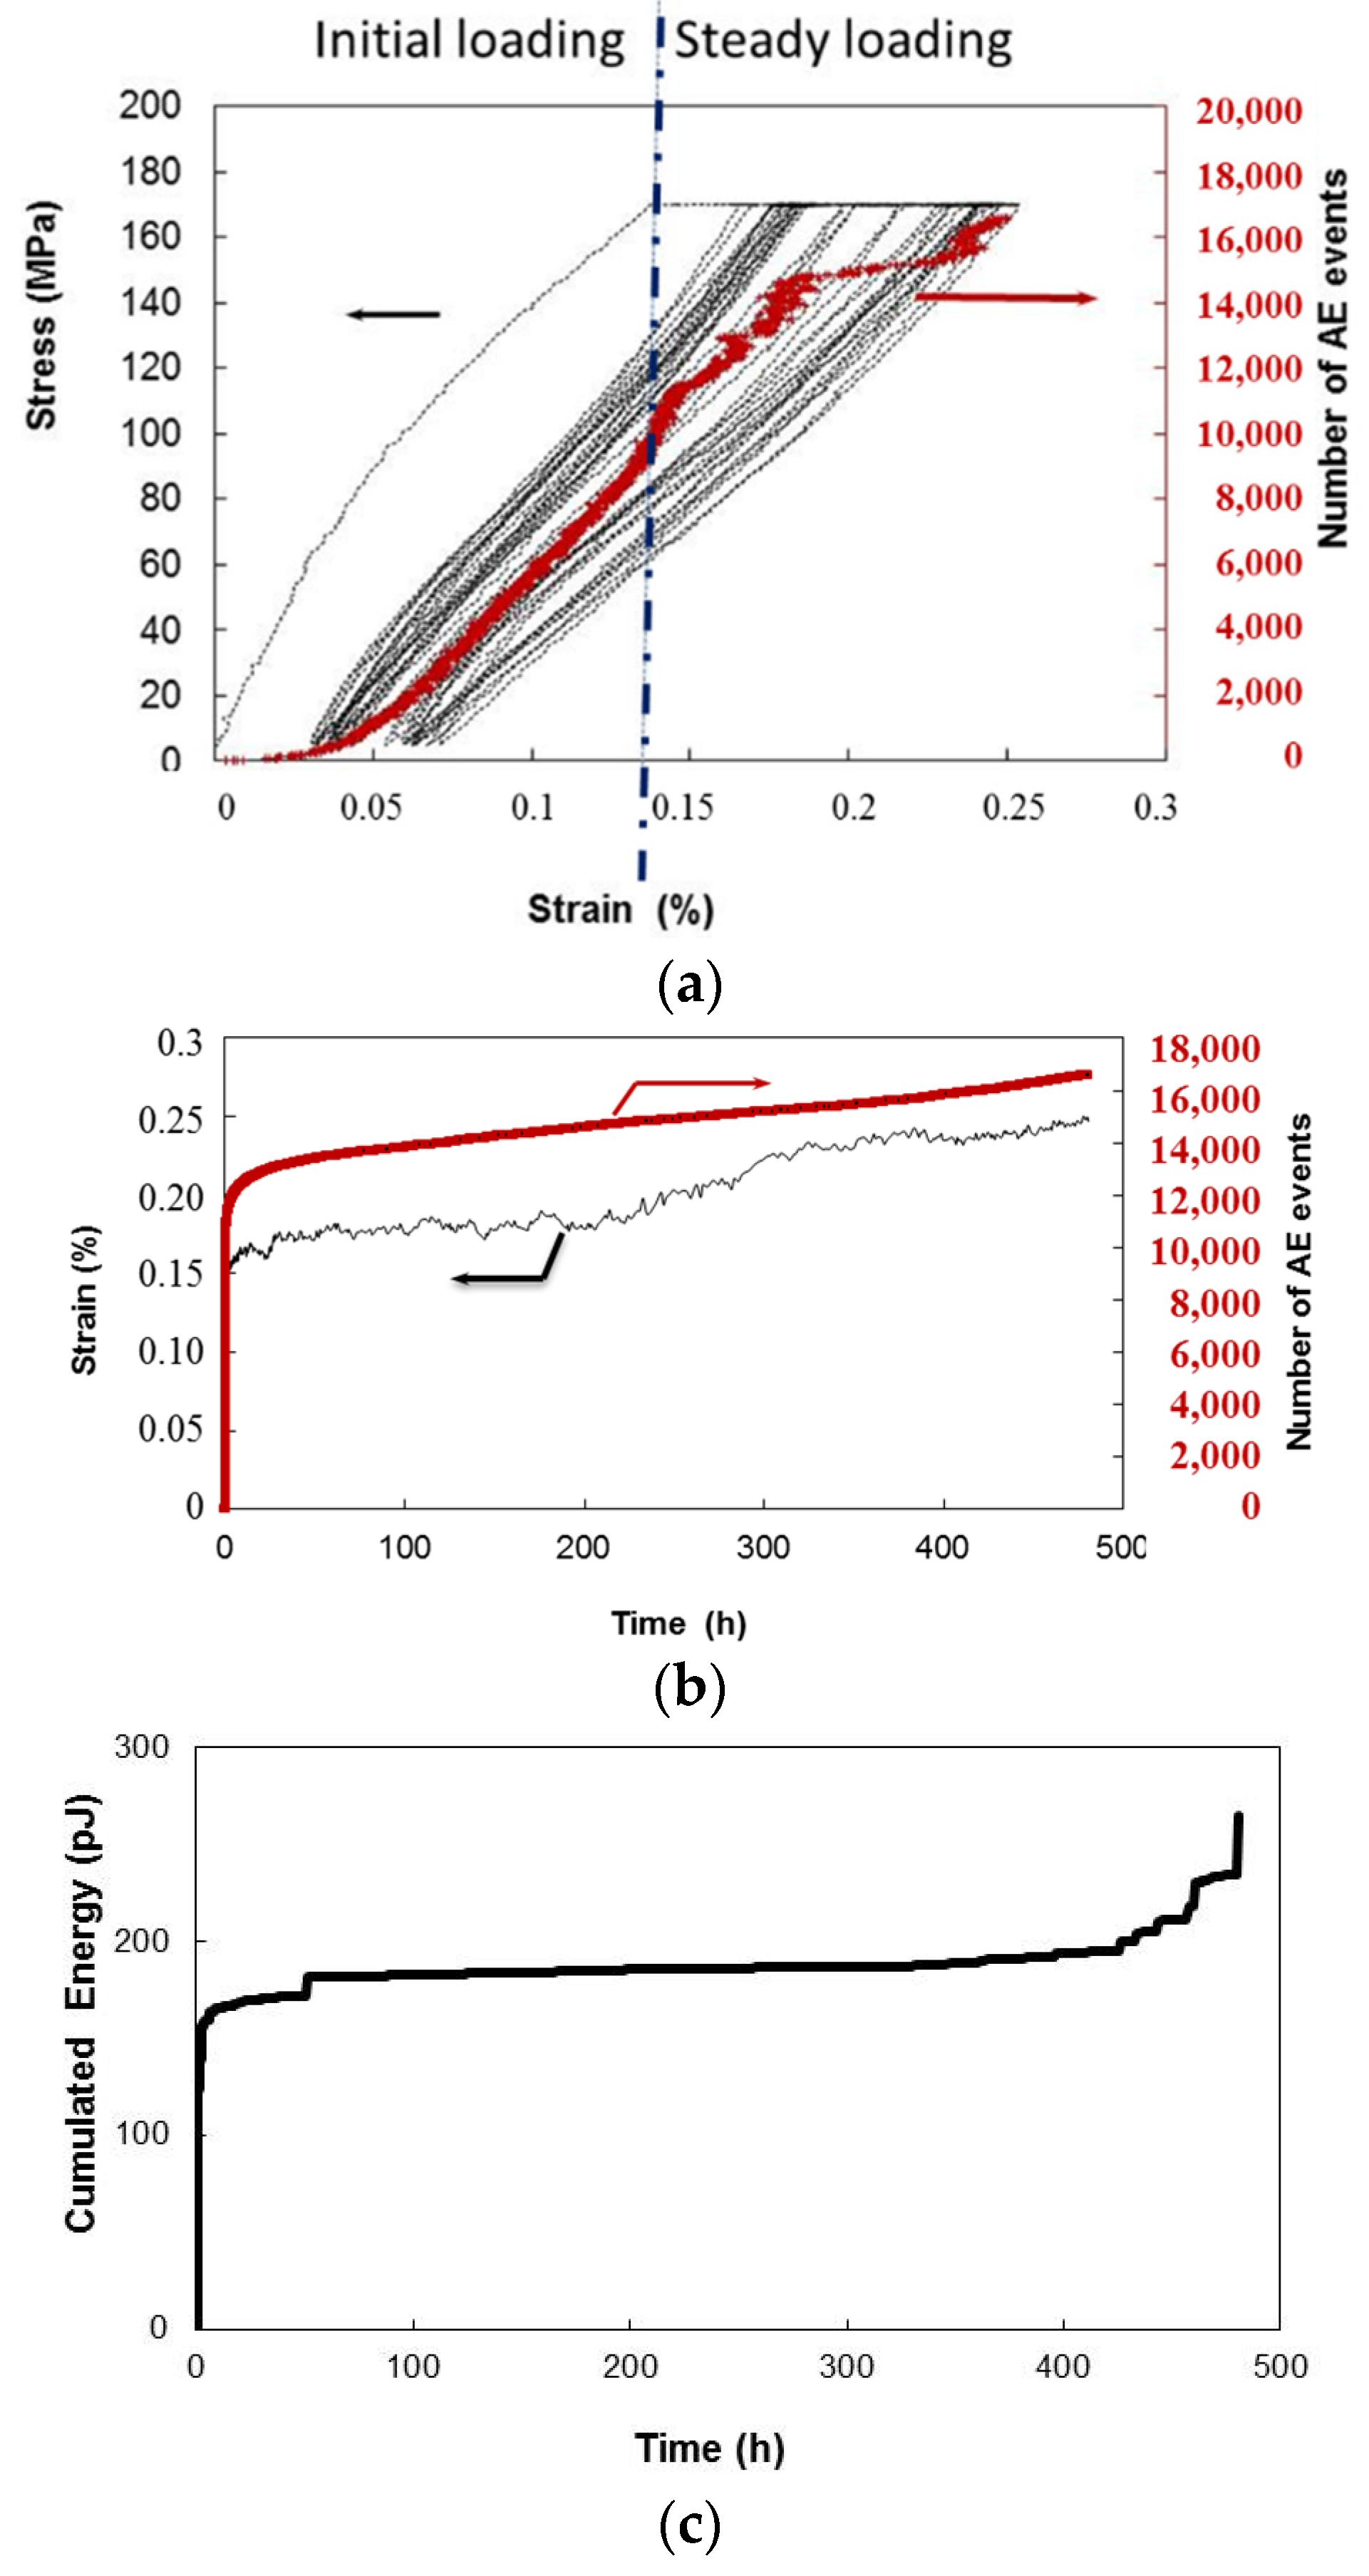
4.1. Mechanical Analysis

The lifetime diagram, obtained at several temperatures and under various stresses, of the composite for static fatigue at intermediate temperature is plotted in Figure 3a. All the points are aligned in the logarithmic representation and follow the power-type law:
t σ n = A
where t is the lifetime, σ is the applied stress, A and n are constants depending on the material, the temperature and the environment. The stress exponent n is estimated at 3.2 ± 0.3. A comparison between our results on composite and on the fibers in literature [34] under static fatigue at 500 °C (Figure 3b) shows that at intermediate and high stresses the lifetime of the composite is longer than the lifetime of the fibers. This is characterized by two different values of n, n is equal to 3.2 for the composite and to 8.45 for the fibers [34].
Figure 3. (a) Lifetimes obtained during static fatigue at 450 °C, 500 °C and 560 °C under air on SiCf/[Si-B-C] composites for several applied stresses; (b) Lifetimes on the fibers bundles [34] and on SiCf/[Si-B-C] composites in static fatigue at 500 °C under air.
Applsci 06 00043 g003
For this range of applied stress, slow crack growth of the fibers needs the diffusion of oxygen but is controlled by the chemical reaction at the crack tip. As shown by Gauthier and Lamon [34], the activation energy 129 kJ/mol corresponds to the reactivity of carbon (present in the fibers) to oxygen. In the composite the diffusion of oxygen toward the fiber surfaces is slackened by the oxygen consumption due to reaction with self-healing matrices and with interphases. Under lower stresses, the lifetimes of the composite and of the fiber bundles are similar. For this low level of stresses reaction kinetics with fiber surfaces are slower than diffusion kinetics of oxygen into the matrix crack. Hence the subcritical crack growth kinetics in dry bundles and in the fibers of the composites are similar.
Stress as a function of strain is shown in Figure 4. The grey curve represents the monotonic tensile curve whereas the other curves correspond to the static fatigue curves for various ratios of stress and with some loading and unloading sequences. One may notice that strain increases significantly during the test, and that hysteresis secant loops evolve as well: the mean elastic modulus decreases whereas the loops width increases. The increase in the loops area is linked to a change in the interfacial shear stress, suggesting that some debonding occur during static fatigue. The evolution of the Young’s modulus was evaluated during the tests by measuring the hysteresis loops modulus Ei. Then the damage parameter D = 1 − Ei/E0 was calculated, E0 being the initial Young’s modulus of the composite. The evolution of D is plotted versus time in Figure 5, for several σ/σR ratios. The biggest increase of D occurs during the loading step and the first 24 h of static fatigue. Then D is observed to rise monotonically up to the failure of the specimen. The general trend is that the highest the σ/σR ratio, the highest the D parameter for similar durations of test. The final D values obtained at failure are not exactly the same: they vary in the range 0.6–0.8, and it seems that this value decreases when the σ/σR ratio decreases. However it seems difficult to define a failure criterion based on the damage parameter.
Figure 4. Stress versus strain during static fatigue experiments for different σ/σR ratios: 0.44, 0.71 and 0.95 at 500 °C on SiCf/[Si-B-C] composites. The grey curve represents the monotonic tensile curve.
Applsci 06 00043 g004
Figure 5. Evolution of the damage parameter D during static fatigue experiments for various σ/σR ratios 0.44, 0.56, 0.62, 0.71, 0.79 and 0.95 at 500 °C on SiCf/[Si-B-C] composites.
Applsci 06 00043 g005
The evolution of strain and acoustic emission events is shown in Figure 6 for a specimen loaded at σ/σR = 0.44. Under the steady loading the strain rate is important at the beginning then decreases before reaching a constant value. At this time, strain rises monotonically up to the final failure for the majority of the specimens (Figure 6b). The AE activity recorded during the constant load hold is also plotted in Figure 6b. The acoustic emission activity evolves with the same trend. Figure 6c shows the evolution of the cumulated acoustic energy. The main activity occurred at the beginning of the test and then reached a plateau. The renewal of AE activity (Figure 6c) just before failure seems to be an interesting way to anticipate the fracture but was not always noticeable on the AE energy vs. time plot.
Figure 6. (a) Stress-strain curve and cumulated number of acoustic emission (AE) events recorded during initial loading up to the nominal load, and during the static loading at a constant load (σ/σR = 0.44 and T = 500 °C); (b) Strain and cumulated number of AE events versus time; (c) Cumulated acoustic energy versus time.
Applsci 06 00043 g006
The main activity occurs at the beginning of the static fatigue. Then the AE rate decreases without stopping. During the initial loading up to the nominal load, the number of events increases with the applied stress, which is consistent with the increasing number of cracks in the matrix (the main source of acoustic emission) as the applied stress increases. Then, during the static loading, the number of events before failure is lower under high stress than under low stress (Figure 7): damage needs to progress more under low stress to cause the final failure of the composite, than under high stress where the matrix already contains a lot of cracks.
Figure 7. Number of AE events recorded during initial loading up to the nominal load and during the static loading at a constant load.
Applsci 06 00043 g007

4.2. Identification of Critical Time

The evolution of R A E is plotted versus time in Figure 8 for three experiments. This coefficient is observed to decrease first, then to reach a minimum value for t = tm, and then to increase up to the failure of the composite at time tR. This ultimate increase in AE activity was not always visible on the curves of AE energy versus time, but it was revealed by this representation. The ratio tm/tR appears to be quite reproducible: tm/tR =0.57 ± 0.06 (Figure 9). Therefore, the R A E ratio may be used as a criterion for predicting the remaining lifetime of a specimen under static loading. During static fatigue test, attenuation coefficient B growths significantly during the first part of tests up to a plateau value near 50% of the rupture time (Figure 10). For each test, the slight increase of B observed during initial loading is very low compared to the one occurring during static fatigue. Therefore, the increase of attenuation coefficient B may be related to matrix crack opening and to the recession of interfaces.
The detection of the plateau during the typical evolution of attenuation coefficient B may be considered as an indicator for lifetime prediction. As the minimum of coefficient RAE, the value plateau of B indicates the beginning of the critical damage phase and provides an estimation of the remaining lifetime.
Figure 8. Evolution of the RAE coefficient during the static load hold on SiCf/[Si-B-C] composites.
Applsci 06 00043 g008
Figure 9. Critical times obtained with the minimum value of RAE and the optimum tsart for the Benioff law obtained with the OCM method.
Applsci 06 00043 g009
Figure 10. Evolution of the attenuation coefficient B during the static load hold (σ/σR = 0.95, σ/σR = 0.71 and T = 500 °C).
Applsci 06 00043 g010
The critical damage phase prior to final rupture may be attributed to the avalanche fibers breaks, controlled by fibers oxidation and by recession of interfaces. In order to confirm this hypothesis, the coefficient RAE is calculated for several damage mechanisms identified with clustering analysis of AE data. The Figure 11 show the activities of several damage mechanisms identified with the supervised analysis. During static fatigue, clusters B and D are more active. The evolution of the coefficients B obtained for the two classes A and B go through a minimum, contrary to those of classes C and D (Figure 12). For the B class (mainly fiber failure at the end of the tests), the minimum value of the coefficient B is observed around 65% of the lifetime. For the A class (mainly yarn fractures or collective fiber breaks at the end of the tests), the minimum is also observed at 65%. One may noticed that the minimum is observed only for clusters A and B corresponding to fibers breaks during the second part of the test. If the growth of the attenuation coefficient B is linked to matrix crack opening, coefficient B also allows considering the plateau observed on the evolution of attenuation coefficient B shows that matrix crack opening leads to an equilibrium state near 40%–50% of the rupture time. The significant increase of matrix crack opening pointed out before 50% of the rupture time is linked to carbon oxidation in the interphases provoking an increase in length of the debonded region of fibers in the vicinity of matrix cracks. Beyond 50% of the rupture time, the oxygen flux, determined by the degree of matrix crack opening, controls the rate of fibers break by slow crack growth. This critical time corresponds to the beginning of a second damage phase where slow crack growth in fibers is prevailing, leading to the ultimate fracture of the composite.
The minimum of coefficient RAE and the value plateau of B appear to be a promising tool to perform “short” static fatigue experiments which could be stopped once the minimum value of R A E is reached, rather than waiting the final failure of the specimen. In this way the test duration could be divided by 1.5 to 2.
Figure 11. Activities of several clusters during static fatigue test at 500 °C and σ/σR = 0.79.
Applsci 06 00043 g011
Figure 12. Evolution of the coefficient of emission for several clusters at 500 °C and σ/σR = 0.79.
Applsci 06 00043 g012

4.3. Toward Lifetime Prediction

The Benioff law was applied to AE data recorded during the static fatigue tests in order to evaluate the lifetime of the studied material. This law is based on a power law description of the cumulative energy (Ω) released by the composite (Equation (2)) and characterized by 4 parameters (Ωr, γ, φ and tr).
Momon [11] studied the applicability on AE signals recorded for C/SiC and SiC/SiC composites. Data beyond the minimum of RAE were in better agreement with the Benioff law than those before the minimum. This point was confirmed with the estimation of the c-value.
The Optimum Circle Method was applied to the fatigue tests. Optimum values (leading to the minimum c-value) of tstart are reported on the Figure 9, which means that the approximation by the Benioff law was relevant for the data collected behind this time. A value of tstart was taken every hour in time interval of 10% to 90% of rupture time tr. The minimum c-value appears clearly around on average 40%–50% of rupture time. The energy release prior to rupture under static fatigue exhibits a critical evolution at 50% of rupture time regardless of the applied stress level. Thus, the Benioff law, initially used to study the activation of earthquakes, may also be applied to the damage of composites. However, this procedure requires preliminary tests until rupture to determine γ and φ for the studied material.

5. Conclusions

Static fatigue experiments were performed at intermediate temperatures under air to assess lifetimes of a SiCf/[Si-B-C] composite. The lifetime as a function of applied stress follows a power-type law, which can be used to predict lifetimes. Additional information is obtained from strain measurement and AE monitoring during the tests. Two criterion based on the AE cumulative energy has been defined, which can be used to predict the final failure of a specimen if the AE activity during the first half of the test is known. This could be a way to shorten such static fatigue experiments, and to divide their duration by 1.5. The coefficient RAE and the attenuation coefficient B confirm the existence of two distinct phases during damage of CMCs in static fatigue at intermediate temperatures. The first phase being mainly attributed to interfacial changes and the second one to the predominance of subcritical crack growth in fibers. Beyond this characteristic point, energy release may be modelled with the Benioff law in order to extrapolate AE activity and hence evaluate time to failure. The same analysis is in progress for the behavior during cyclic fatigue tests. Future works will focus on the use of the Benioff law as a predictive model.

Acknowledgment

The authors gratefully acknowledge Snecma Propulsion Solide, CNRS and DGA for supporting this work in the frame of the research program: “Modélisation, extrapolation, validation de la durée de vie des composites à matrice céramique”.

Author Contributions

All the authors have contributed to perform mechanical tests, to analyze data and to write this paper.

Conflicts of Interest

The authors declare no conflict of interest.

References

  1. Fantozzi, G.; Reynaud, P.; Rouby, D. Thermomechanical behaviour of long fibres ceramic-ceramic composites. Silic. Ind. 2002, 66, 109–119. [Google Scholar]
  2. Reynaud, P.; Rouby, D.; Fantozzi, G. Effects of temperature and of oxidation on the interfacial shear stress between fibres and matrix in ceramic-matrix composites. Acta Mater. 1998, 46, 2461–2469. [Google Scholar] [CrossRef]
  3. Naslain, R.; Christin, F. Sic-matrix composite materials for advanced jet engines. MRS Bull. 2003, 28, 654–658. [Google Scholar] [CrossRef]
  4. Lamon, J. Micromechanics-based approach to the mechanical behavior of brittle matrix composites. Compos. Sci. Technol. 2002, 58, 2259–2272. [Google Scholar] [CrossRef]
  5. Ohnabe, H.; Masaki, S.; Onozuka, M.; Miyahara, K.; Sasa, T. Potential applications of ceramic matrix composites to aero-engine components. Compos. A 1999, 30, 489–496. [Google Scholar] [CrossRef]
  6. Lamon, J. CVI SiC/SiC composites. In Handbook of Ceramics Composites; Bansal, N.P., Ed.; Springer: Berlin, Germany, 2005; pp. 55–76. [Google Scholar]
  7. Fantozzi, G.; Reynaud, P. Mechanical behaviour of SiC fiber reinforced ceramic matrix composites. In Comprehensive Hard Materials; Sarin, V.K., Ed.; Elsevier: Philadelphia, PA, USA, 2014; pp. 345–366. [Google Scholar]
  8. Quemard, L.; Rebillat, F.; Guette, A.; Tawil, H.; Louchet-Pouillerie, C. Self-healing mechanisms of a SiC fiber reinforced multi-layered ceramic matrix composite in high pressure steam environments. J. Eur. Ceram. Soc. 2007, 27, 2085–2094. [Google Scholar] [CrossRef]
  9. Forio, P.; Lamon, J. Fatigue behavior at high temperatures in air of a 2D SiC/SiBC composite with a self-sealing multilayered matrix. In Ceram Transactions; Bansal, N.P., Singh, J.P., Lin, H.T., Eds.; American Ceramic Society: Westerville, OH, USA, 2001; Volume 128, pp. 127–141. [Google Scholar]
  10. Ono, K.; Huang, Q. Pattern Recognition Analysis of Acoustic Emission Signals. NDT and E Int. 1997, 30, 109. [Google Scholar]
  11. Yan, T.; Holford, K.; Carter, D.; Brandon, J. Classification of acoustic emission signatures using a self-organization neural network. J. Acoust. Emiss. 1999, 17, 49–59. [Google Scholar]
  12. Kostopoulos, V.; Loutas, T.H.; Kontsos, A.; Sotiriadis, G.; Pappas, Y.Z. On the identification of the failure mechanisms in oxide/oxide composites using acoustic emission. NDT E Int. 2003, 36, 571–580. [Google Scholar] [CrossRef]
  13. Pappas, Y.Z.; Kontsos, A.; Loutas, T.H.; Kostopoulos, V. Failure mechanisms analysis of 2D carbon/carbon using acoustic emission monitoring. NDT E Int. 1998, 31, 571–580. [Google Scholar] [CrossRef]
  14. Godin, N.; Huguet, S.; Gaertner, R. Integration of the Kohonen’s self-organising map and k-means algorithm for the segmentation of the AE data collected during tensile tests on cross-ply composites. NDT E Int. 2005, 38, 299–309. [Google Scholar] [CrossRef]
  15. Moevus, M.; Rouby, D.; Godin, N.; R’Mili, M.; Reynaud, P.; Fantozzi, G.; Fayolle, G. Analyse of damage mechanisms and associated acoustic emission in two SiC/[Si-B-C] composites exhibiting different tensile curves. Part I: Damage patterns and acoustic emission activity. Compos. Sci. Technol. 2008, 68, 1250–1257. [Google Scholar] [CrossRef]
  16. Moevus, M.; Godin, N.; Rouby, D.; R’Mili, M.; Reynaud, P.; Fantozzi, G.; Farizy, G. Analyse of damage mechanisms and associated acoustic emission in two SiC/[Si-B-C] composites exhibiting different tensile curves. Part II: Unsupervised acoustic emission data clustering. Compos. Sci. Technol. 2008, 68, 1258–1265. [Google Scholar] [CrossRef]
  17. Smith, R.L.; Phoenix, S.L. Asymptotic distributions for the failure of fibrous materials under series-parallel structure and equal load-sharing. J. Appl. Mech. 1981, 48, 75–82. [Google Scholar] [CrossRef]
  18. Curtin, W.A. Theory of mechanical properties of ceramic-matrix composites. J. Am. Ceram. Soc. 1991, 74, 2837–2845. [Google Scholar] [CrossRef]
  19. Newman, W.I.; Phoenix, S.L. Time dependent fiber-bundles with local load sharing. Phys. Rev. E Stat. Nonlin. Soft Matter Phys. 2001, 63, 021507. [Google Scholar] [CrossRef] [PubMed]
  20. Turcotte, D.; Shcherbakov, R. Can damage mechanics explain temporal scaling laws in brittle fracture and seismicity? Pure Appl. Geophys. 2006, 163, 1031–1045. [Google Scholar] [CrossRef]
  21. Guarino, A.; Garcimartin, A.; Ciliberto, S. An experimental test of the critical behaviour of fracture precursors. Eur. Phys. J. B 1998, 6, 13–24. [Google Scholar] [CrossRef]
  22. Nechad, H.; Helmstetter, A.; El Guerjouma, R.; Sornette, D. Andrade and critical time-to-failure laws in fiber-matrix composites: Experiments and model. J. Mech. Phys. Solids 2005, 53, 1099–1027. [Google Scholar] [CrossRef]
  23. Deschanel, S.; Vanel, L.; Vigier, G.; Godin, N.; Ciliberto, S. Experimental study of crackling noise: Conditions on power law scaling correlated to fracture precursors. J. Stat. Mech. Theory Exp. 2009. [Google Scholar] [CrossRef]
  24. Shaira, M.; Godin, N.; Guy, P.; Vanel, L.; Courbon, J. Evaluation of the strain-induced martensitic transformation by acoustic emission monitoring in 304L austenitic stainless steel: Identification of the AE signature of the martensitic transformation and power-law statistics. Mater. Sci. Eng. A 2008, 492, 392–399. [Google Scholar] [CrossRef]
  25. Morscher, G.N. The velocity and attenuation of acoustic emission waves in SiC/SiC composites loaded in tension. Compos. Sci. Technol. 2002, 62, 1171–1180. [Google Scholar] [CrossRef]
  26. Maillet, E.; Godin, N.; R’Mili, M.; Reynaud, P.; Lamon, J.; Fantozzi, G. Analysis of Acoustic Emission energy release during static fatigue tests at intermediate temperatures on Ceramic Matrix Composites: Towards rupture time prediction. Compos. Sci. Technol. 2012, 72, 1001–1007. [Google Scholar] [CrossRef]
  27. Maillet, E.; Godin, N.; R’Mili, M.; Reynaud, P.; Lamon, J.; Fantozzi, G. Determination of acoustic emission sources energy and application towards lifetime prediction of ceramic matrix composites. In Mechanical Properties and Performance of Engineering Ceramics and Composites VII; Singh, D., Salem, J., Halbig, M., Mathur, S., Eds.; Wiley: Hoboken, NJ, USA, 2012; Volume 33, pp. 15–25. [Google Scholar]
  28. Maillet, E.; Godin, N.; R’Mili, M.; Reynaud, P.; Fantozzi, G.; Lamon, J. Real-time evaluation of energy attenuation: A novel approach to acoustic emission analysis for damage monitoring of ceramic matrix composites. J. Eur. Ceram. Soc. 2014, 34, 1673–1679. [Google Scholar] [CrossRef]
  29. Momon, S.; Moevus, M.; Godin, N.; R’Mili, M.; Reynaud, P.; Fantozzi, G.; Fayolle, G. Acoustic emission and lifetime prediction during static fatigue tests on ceramic-matrix-composite at high temperature under air. Compos. A Appl. Sci. Manuf. 2010, 41, 913–918. [Google Scholar] [CrossRef]
  30. Bufe, C.G.; Varnes, D.G. Predictive modeling of the seismic cycle of the Greater San Francisco Bay Region. J. Geophys. Res. 1993, 98, 9871–9883. [Google Scholar] [CrossRef]
  31. Bowman, D.D.; Ouillon, G.; Sammis, C.G.; Sornette, A.; Sornette, D. An observational test of the critical earthquake concept. J. Geophys. Res. 1998, 103, 24359–24372. [Google Scholar] [CrossRef]
  32. Likas, A.; Vlassis, N.; Verbeek, J. The global k-means clustering algorithm. Pattern Recognit. 2003, 36, 451–461. [Google Scholar] [CrossRef]
  33. Lee, M.S.; Keerthi, S.; Jin Ong, C.; Decoste, D. An efficient method for computing leave one out error in support vector machines with gaussian kernels. IEEE Trans. Neural Netw. 2004, 15, 750–757. [Google Scholar] [CrossRef] [PubMed]
  34. Gauthier, W.; Lamon, J. Delayed failure of Hi-Nicalon and Hi-Nicalon S multifilament tows and single filaments at intermediate temperatures. J. Am. Ceram. Soc. 2009, 92, 702–709. [Google Scholar] [CrossRef]

