Article

Extending the Effective Ranging Depth of Spectral Domain Optical Coherence Tomography by Spatial Frequency Domain Multiplexing

1
Department of Applied Physics, College of Science, Nanjing University of Aeronautics and Astronautics, Nanjing 210016, China
2
Key Laboratory of Radar Imaging and Microwave Photonics, Ministry of Education, Nanjing University of Aeronautics and Astronautics, Nanjing 210016, China
*
Authors to whom correspondence should be addressed.
Appl. Sci. 2016, 6(11), 360; https://doi.org/10.3390/app6110360
Submission received: 29 September 2016 / Revised: 6 November 2016 / Accepted: 10 November 2016 / Published: 17 November 2016
(This article belongs to the Special Issue Development and Application of Optical Coherence Tomography (OCT))

Abstract

:
We present a spatial frequency domain multiplexing method for extending the imaging depth range of a spectral domain optical coherence tomography (SDOCT) system without any expensive device. This method uses two galvo scanners with different pivot-offset distances in two independent reference arms for spatial frequency modulation and multiplexing. The spatial frequency contents corresponding to different depth regions of the sample can be shifted to different frequency bands. The spatial frequency domain multiplexing SDOCT system provides an approximately 1.9-fold increase in the effective ranging depth compared with that of a conventional full-range SDOCT system. The reconstructed images of phantom and biological tissue demonstrate the expected increase in ranging depth. The parameters choice criterion for this method is discussed.

1. Introduction

Fourier domain optical coherence tomography (FDOCT) is a high-speed, high-resolution and non-invasive biomedical optical imaging technique [1]. It has been applied in the field of biomedical research, clinical diagnostics, and non-destructive material inspection. FDOCT can be categorized into two embodiments. One is based on a wideband laser source and a spectrometer which is called spectral domain OCT (SDOCT), and the other one is based on a frequency sweeping laser source and a balanced photon detector which is called swept source OCT (SSOCT, also called optical frequency domain imaging, OFDI). For both types of the FDOCT, the achievable imaging depth range is an important performance indicator. In some situations, a long ranging depth is highly desirable. One such example is for the endoscopic application where the distance between the distal end of the endoscopic probe and the tissue surface cannot be accurately controlled. Another example is for imaging the whole eye from anterior to retina.
For FDOCT, the ranging depth can be calculated using the formula Δz = λ02/4nδλ and is fundamentally limited by the center wavelength λ0 of the light source, the spectral resolution δλ, and the refractive index n. The spectral resolution is δλ = Δλ/N when the spectrometer is pixel-limited. In this equation, Δλ represents the spectral bandwidth of the light source and N is the data number of the digitized axial spectral interference signal that covers the bandwidth. In fact, there is a sensitivity roll-off issue for FDOCT, which poses a further limitation to the practical imaging depth range. For the case of SDOCT, the sensitivity roll-off effect is due to the finite pixel number of the line scanning camera. Due to this effect, the visibility of the spectral interference fringe is maximized when the optical path difference (OPD) is zero and decays as the path length difference increases. Thus, the effective ranging depth is defined as the imaging depth at which the sensitivity has decayed −6 dB from the peak value [2]. For FDOCT, the complex conjugate ambiguity further limits the imaging depth to one half of the full-range imaging space. Another limitation on the imaging depth of the FDOCT is posed by the finite depth of focus of the objective lens.
For extending the effective imaging depth range, various techniques have been proposed. A novel MEMS-Vertical Cavity Surface Emitting Laser (VCSEL) source-based [3] SSOCT system was developed for in vivo high-speed imaging of the eye with an unprecedented imaging depth of 50 mm in air and little sensitivity loss. The SDOCT system based on the orthogonal dispersion spectrometer [4] or the frequency comb approach [5] was proposed for large ranging depth imaging through enhancing spectral resolution. To solve the complex conjugate ambiguity, many complex Optical Coherence Tomography (OCT) techniques were proposed. Among these complex OCT methods, an approach involving spatial phase modulation induced by the pivot-offset galvo scanner (GS) in the sample arm is regarded as a widely accepted way [6,7,8,9]. The technique was initially introduced for en face OCT imaging [10]. In the approach, a slight eccentricity of the laser beam incident upon the galvo scanner causes a path length modulation during lateral scanning, generating the required carrier frequency. Recently, the optimization of galvo scanning for OCT was investigated [11].
Alternatively, based on implementing multiple reference arms in the FDOCT system the extended ranging depth can also be achieved [12,13,14,15,16]. These multiple-reference-arm approaches can be roughly categorized into two sorts: simultaneous acquisition approach and sequential acquisition approach. For the simultaneous acquisition approach, Nezam et al. presented an OFDI system based on two independent interferometer reference arms, each having an acousto-optic frequency shifter operating at a distinct frequency and an independent round-trip delay [12]. Through combination of a dual-channel OCT system focusing on different segments of the eye, Chuanqing Zhou et al. extended the imaging depth using two OCT setups [13,14]. For the sequential acquisition approach, Hui Wang et al. proposed a simple and inexpensive method for increasing the effective imaging depth range of the SDOCT system, which was realized by employing a high-speed fiber optic switch to serially access two reference paths with different offset delays [2]. Recently, Ruggeriet al. enabled OCT imaging of multi-frames at four depths without sacrificing axial resolution by implementing a galvo scanner-based mechanical optical switch in the reference arm [15]. They utilized the system to image the whole eye from anterior to retina. More recently, a SDOCT system capable of deep depth imaging using a 3 × 3 fiber coupler, and a mechanical shutter was demonstrated [16]. To conclude, the simultaneous acquisition approaches can extend the imaging depth of the OCT system without sacrificing the effective imaging rate. However, they use either expensive frequency modulators or two OCT systems, which increase the complexity and cost of the imaging system. Furthermore, due to splitting the light source power into two channels, the simultaneous approaches suffer from a 3dB loss of the imaging sensitivity [9]. On the other hand, the sequential acquisition approaches extend the ranging depth with no sensitivity penalty, but with the penalty of halving the effective image acquisition rate, and it cannot be applied in some applications that need to image the different depth regions of the sample simultaneously.
In this paper, we present a simultaneous acquisition approach for extending the imaging depth range of a SDOCT system. The method, which is termed spatial frequency domain multiplexing method, is based on two pivot-offset galvo scanners in two separate reference arms. Galvo scanners are popular devices that offer a good scanning speed, a good field of scan, high precision, and repeatability [17]. Thus, the presented approach can image the different depth regions of the sample simultaneously without any expensive acousto-optic or electro-optic modulation device. In the following sections, we theoretically derive the parameter choice criteria for the high signal/crosstalk ratio (SCR) reconstruction and demonstrate the extended imaging depth performances of the system experimentally.

2. Methods

2.1. Spatial Frequency Domain Multiplexing Spectral Domain Optical Coherence Tomography (SDOCT) System

Figure 1 depicts the schematic of the spatial frequency domain multiplexing SDOCT system. It comprises a super luminescent diode (SLD), an interferometer with two pivot-offset galvo scanners implemented in the two separate reference arms, a custom-built spectrometer, and a personal computer for signal processing and image display. Reference Arms I and II have different round-trip delays, which correspond to the shallow and deep regions of the sample, shown as ZA and ZB in Figure 1. Thus, two sets of the spectral interferogram corresponding to the depths ZA and ZB can be acquired. In the sample arm, the light beam just incidents upon the pivot of the GS0 for sample scanning. The light beams in the reference arms incident upon the GS1 and GS2 with the different offset distances s1 and s2 away from the pivots, respectively, as shown in Figure 1.
When the galvo scanners in the sample arm and reference arms are driven simultaneously, the linear modulated phase will be added into the two-dimensional (2D) spectral interferograms. By ignoring the signals that do not contribute to the depth localization in the sample for simplicity, the 2D spectral interferogram detected at each wavenumber k and lateral position x can be expressed as
I ( x , k ) = 2 S ( k ) R ( x , z ) cos [ 2 n k ( z z A ) + Φ 1 ( x ) + ϕ A ( x , z ) ] d z   + 2 S ( k ) R ( x , z ) cos [ 2 n k ( z z B ) + Φ 2 ( x ) + ϕ B ( x , z ) ] d z
where k represents wavenumber and k = 2 π / λ , z is the depth position coordinate of the scatters within the sample, n is the average refractive index of the sample, R ( x , z ) is the normalized intensity backscattered from the scatter at z, S(k) is the spectral density of the light source, Φ 1 ( x ) and Φ 2 ( x ) represent the linear modulated phase induced by GS1 and GS2, and ϕ A ( x , z ) and ϕ B ( x , z ) are the phases that relate to the optical heterogeneity of the sample in the focus coherence volume. If the linear modulation phase Φ 1 ( x ) and Φ 2 ( x ) have different slopes about the lateral position, the spatial frequency contents of the 2D OCT spectral interferogram corresponding to the depths ZA and ZB will be shifted to the different center spatial frequencies away from the zero spatial frequency.

2.2. Demodulation Algorithm for Spatial Frequency Domain Multiplexing SDOCT

As shown in Figure 2, after taking the Fourier transform of the 2D spectral interferogram I ( x , k ) along the x-direction (step (i) in Figure 2), we obtain the spatial spectrum of the 2D spectral interferogram, which can be expressed as
I ˜ ( ν , k ) = F T x ν { I ( x , k ) } = C A ( ν + ν c 1 , k ) + C ^ A ( ν ν c 1 , k )   + C B ( ν + ν c 2 , k ) + C ^ B ( ν ν c 2 , k )
where ν is the Fourier transform pair of x. C ( ν , k ) and C ^ ( ν , k ) are the pair of Hermit conjugate term due to the Fourier transform of the real valued interference signal and contain the same information on the OCT signal in the spatial frequency domain. The subscripts A and B in Equation (2) indicate the spatial frequency contents corresponding to depths ZA and ZB, respectively. νc1 and νc2 are the center spatial carrier frequencies, which are proportional to the pivot-offset distances. For reconstruction of the complex valued spectral interferogram, two band-pass filters with center frequencies of νc1 and νc2 are applied to the spatial frequency spectrum (step (ii) in Figure 2). We then obtain the separated spatial frequency content C A ( ν + ν c 1 , k ) and C B ( ν + ν c 2 , k ) .
Two complex-valued spectral interferogram I ˜ A ( x , k ) and I ˜ B ( x , k ) can now be reconstructed by performing the inverse Fourier transform from the spatial frequency domain back to the spatial domain for the terms C A ( ν + ν c 1 , k ) and C B ( ν + ν c 2 , k ) (step (iii) in Figure 2). For reasons of energy conservation, the data have to be scaled by a factor of 2. Then, after the k space re-sampling the two full-range OCT images corresponding to the depths of ZA and ZB can be calculated by inversely Fourier transforming the complex-valued linear-in-k spectral interferogram I ˜ A ( x , k ) and I ˜ B ( x , k ) along the wavenumber direction. Finally, an extended range OCT image is formed by concatenating the image regions that correspond to the effective ranging depths of the two full-range OCT images.

2.3. The Center Spatial Frequency and Parameters Design Criterion

Figure 3 is the sketch of the two reference arms with the pivot-offset galvo scanners. The color lines represent the light beams when the galvo scanners are at different scan angles. The pivot-offset distances are indicated as s1 and s2. The phase shift between successive axial scans (A-scan) induced by the galvo scanner can be expressed as [9]
δ ϕ i = 8 ω T s i π λ 0 ,    i = 1 , 2
where ω is the angular velocity of the galvo scanners, T is the exposure time of the camera in the spectrometer, and λ 0 is the center wavelength of the light source.
Considering a tomogram of N depth profiles covering a lateral range of Δx, the two center spatial carrier frequencies can be calculated by
ν c i = δ ϕ i 2 π N Δ x    i = 1 , 2 .
The lateral scanning range Δx is calculated by
Δ x = 2 N ω T f
where f is the focal length of the sample objective.
The positive spatial frequency range can be calculated by
ν x = N 2 Δ x .
For high-quality image reconstruction, another important parameter is the characteristic bandwidth (BW) of the obtained spatial frequency contents, which is determined by the inverse speckle size. The speckle size can be modeled by the transverse resolution, and BW can be expressed as [9]
B W = π d 4 λ 0 f
where d is the collimated beam diameter entering the sample objective.
In theory, the proposed method could quadruple the effective imaging depth range compared with a conventional SDOCT system. However, practically some factors can affect the improvement of the range depth, which includes the crosstalk between the two spatial frequency contents of the two depths signal, the crosstalk between the spatial frequency content and its complex conjugate content, and the crosstalk between the spatial frequency contents and the interference term between the two reference arms’ light fields. Crosstalk between the two spatial frequency contents corresponding to the two depths can occur when the tails of the spatial frequency contents superpose with each other as schematically represented in Figure 4a. In view of the Bedrosian theorem, spatial frequency content should be well separated from the introduced modulation frequency and the other content for successful reconstruction, as shown in Figure 4b. The crosstalk due to the reference arms’ interference can be eliminated via background subtraction. According to Equations (3)–(7), the parameters including the angular velocity ω, the complementary metal oxide semiconductor (CMOS) exposure time T, and the offset distance si are all responsible to the image reconstruction quality. Thus, to avoid crosstalk and fully utilize the proposed method for extended range imaging, the center spatial carrier frequencies and the system parameters must be chosen carefully.
To quantify the crosstalk effect, we introduce the SCR defined as a function of the frequency-spacing/bandwidth ratio ( Δ ν / B W ) for two reference arms, where Δ ν = ν c 2 ν c 1 as shown in Figure 4. According to the theoretical value, the SCR can be higher than 100 dB when the frequency-spacing/bandwidth ratio τ satisfies the condition [12]
τ = Δ ν B W 3 .
Furthermore, to avoid aliasing terms, the bandwidth of the spatial frequency content should be narrow relative to the full spatial frequency range; in this case, the small phase fluctuations will not cause a reduction of the SCR. This condition indicates that [9]
N Δ x B W .
The criteria shown in Equations (8) and (9) will be used to guide the choice of the values of the center spatial carrier frequencies and the other parameters in the experimental SDOCT system.

3. Experiments and Results

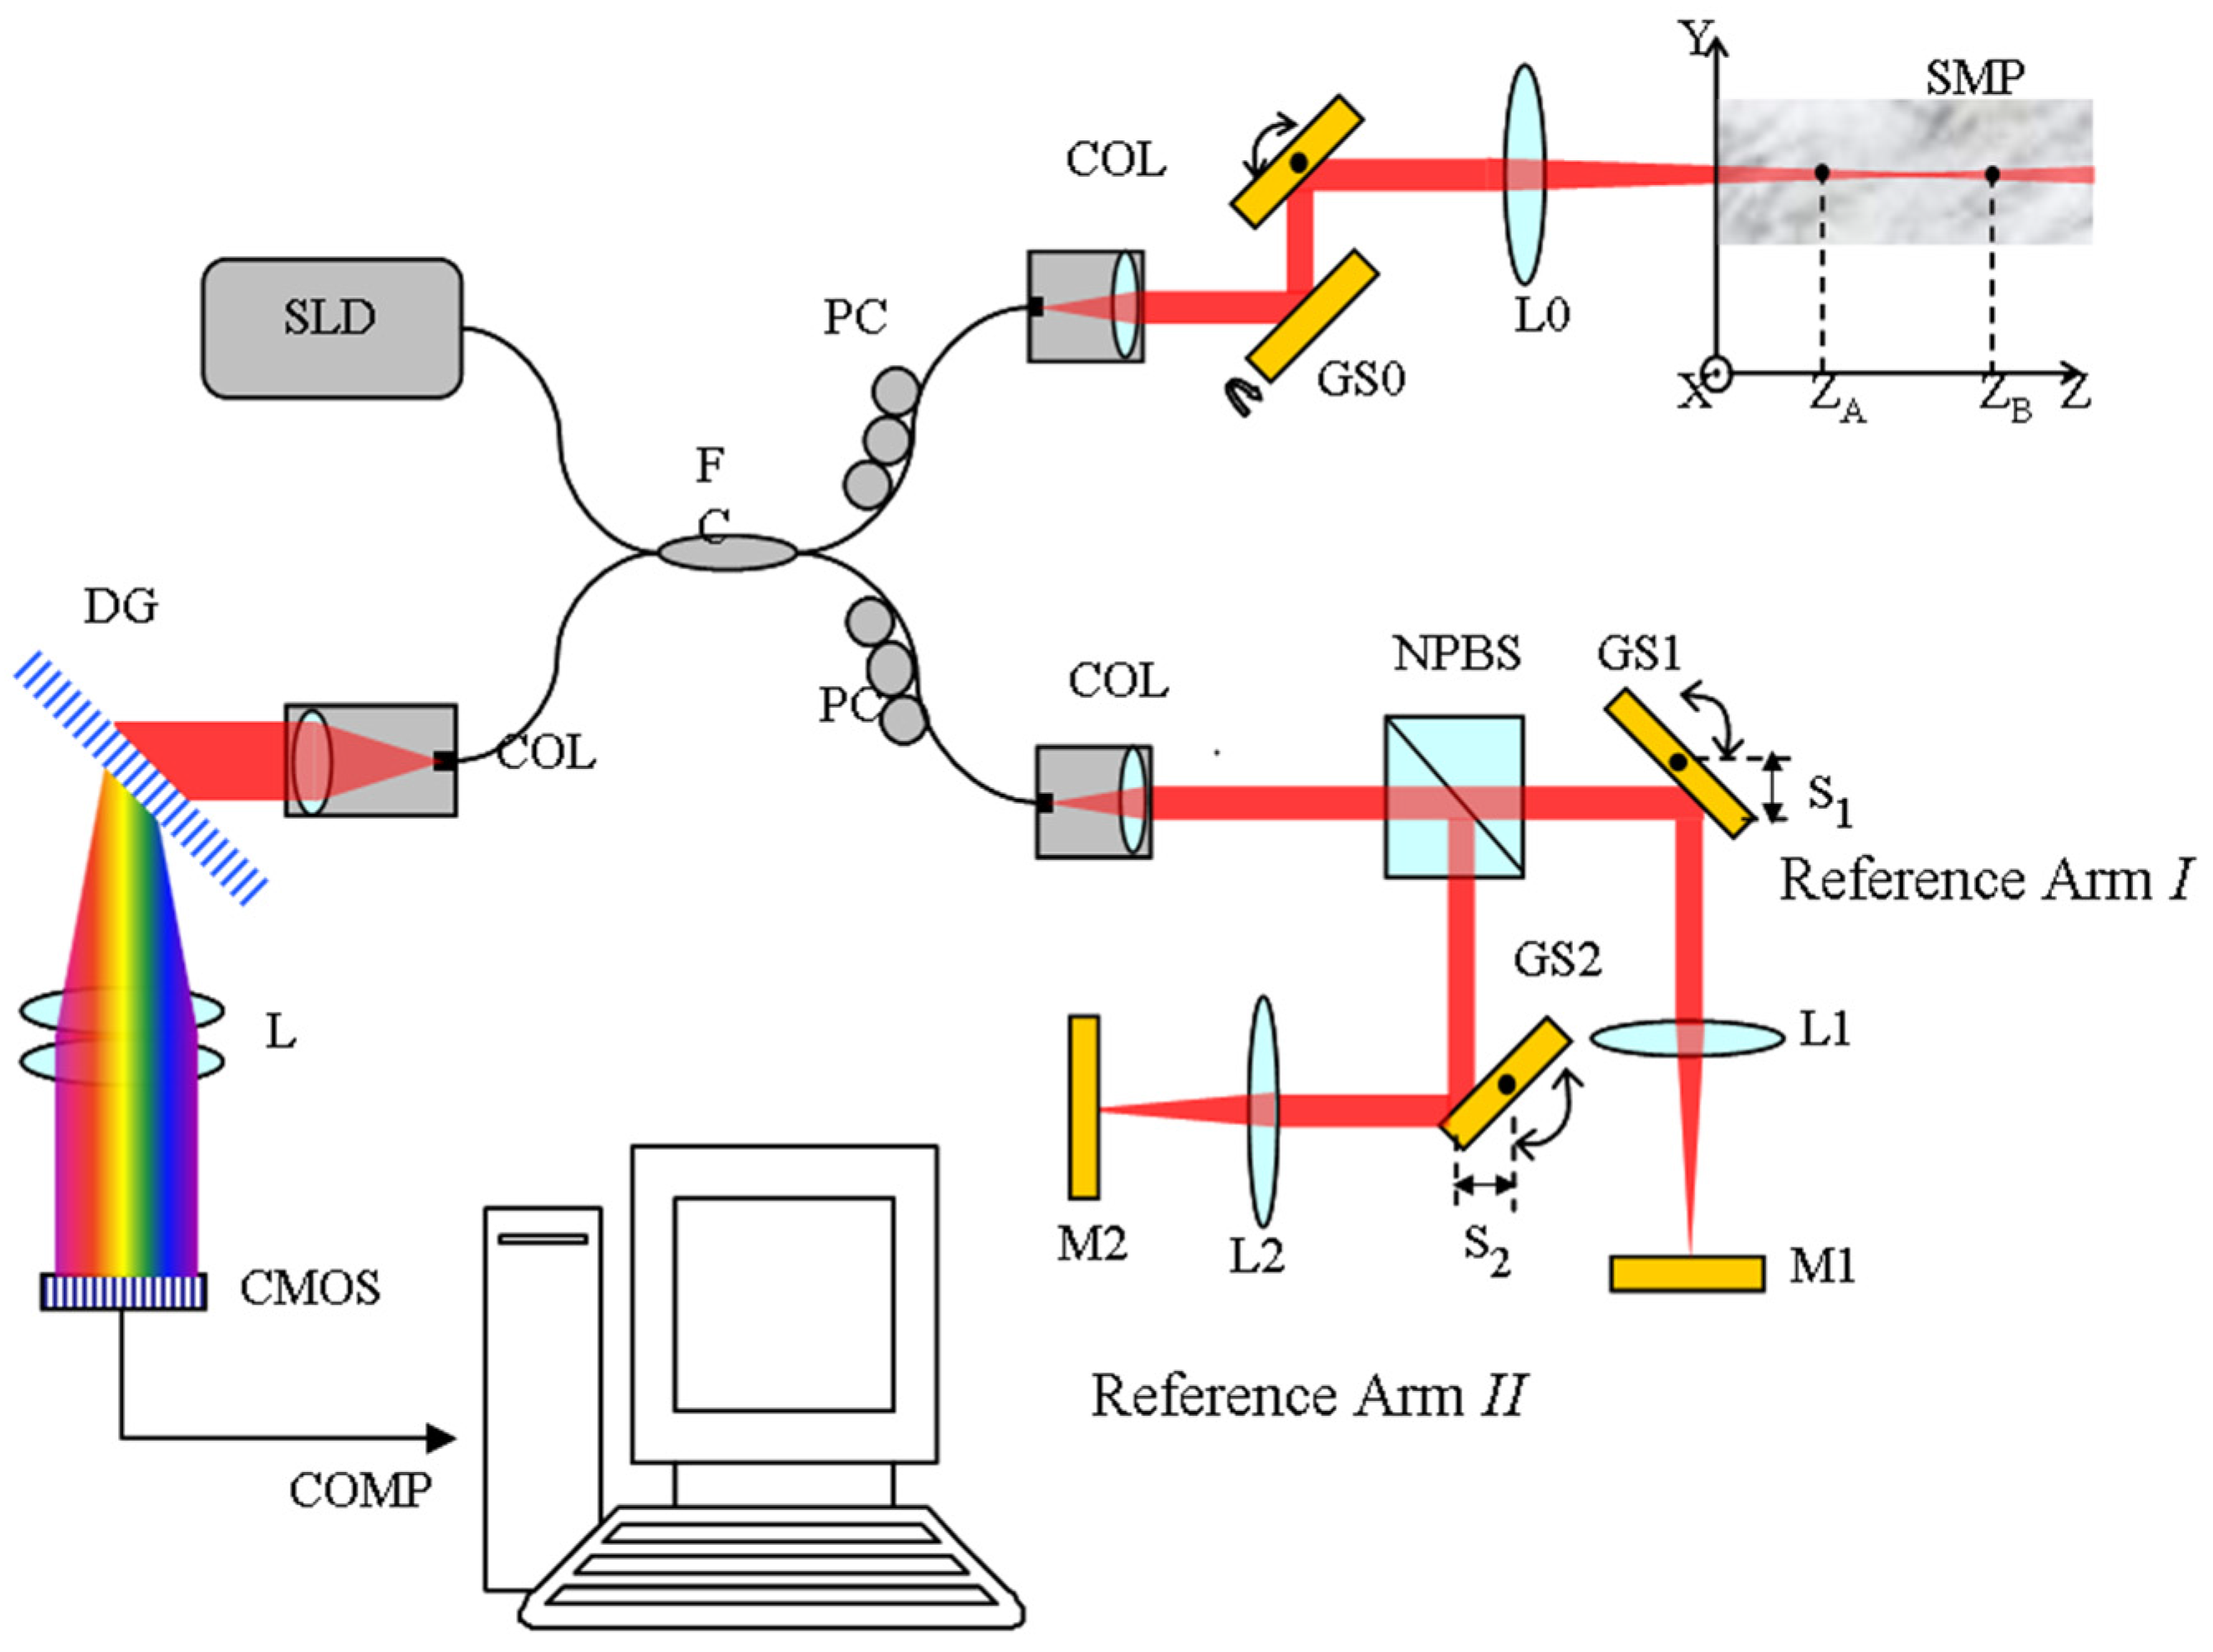
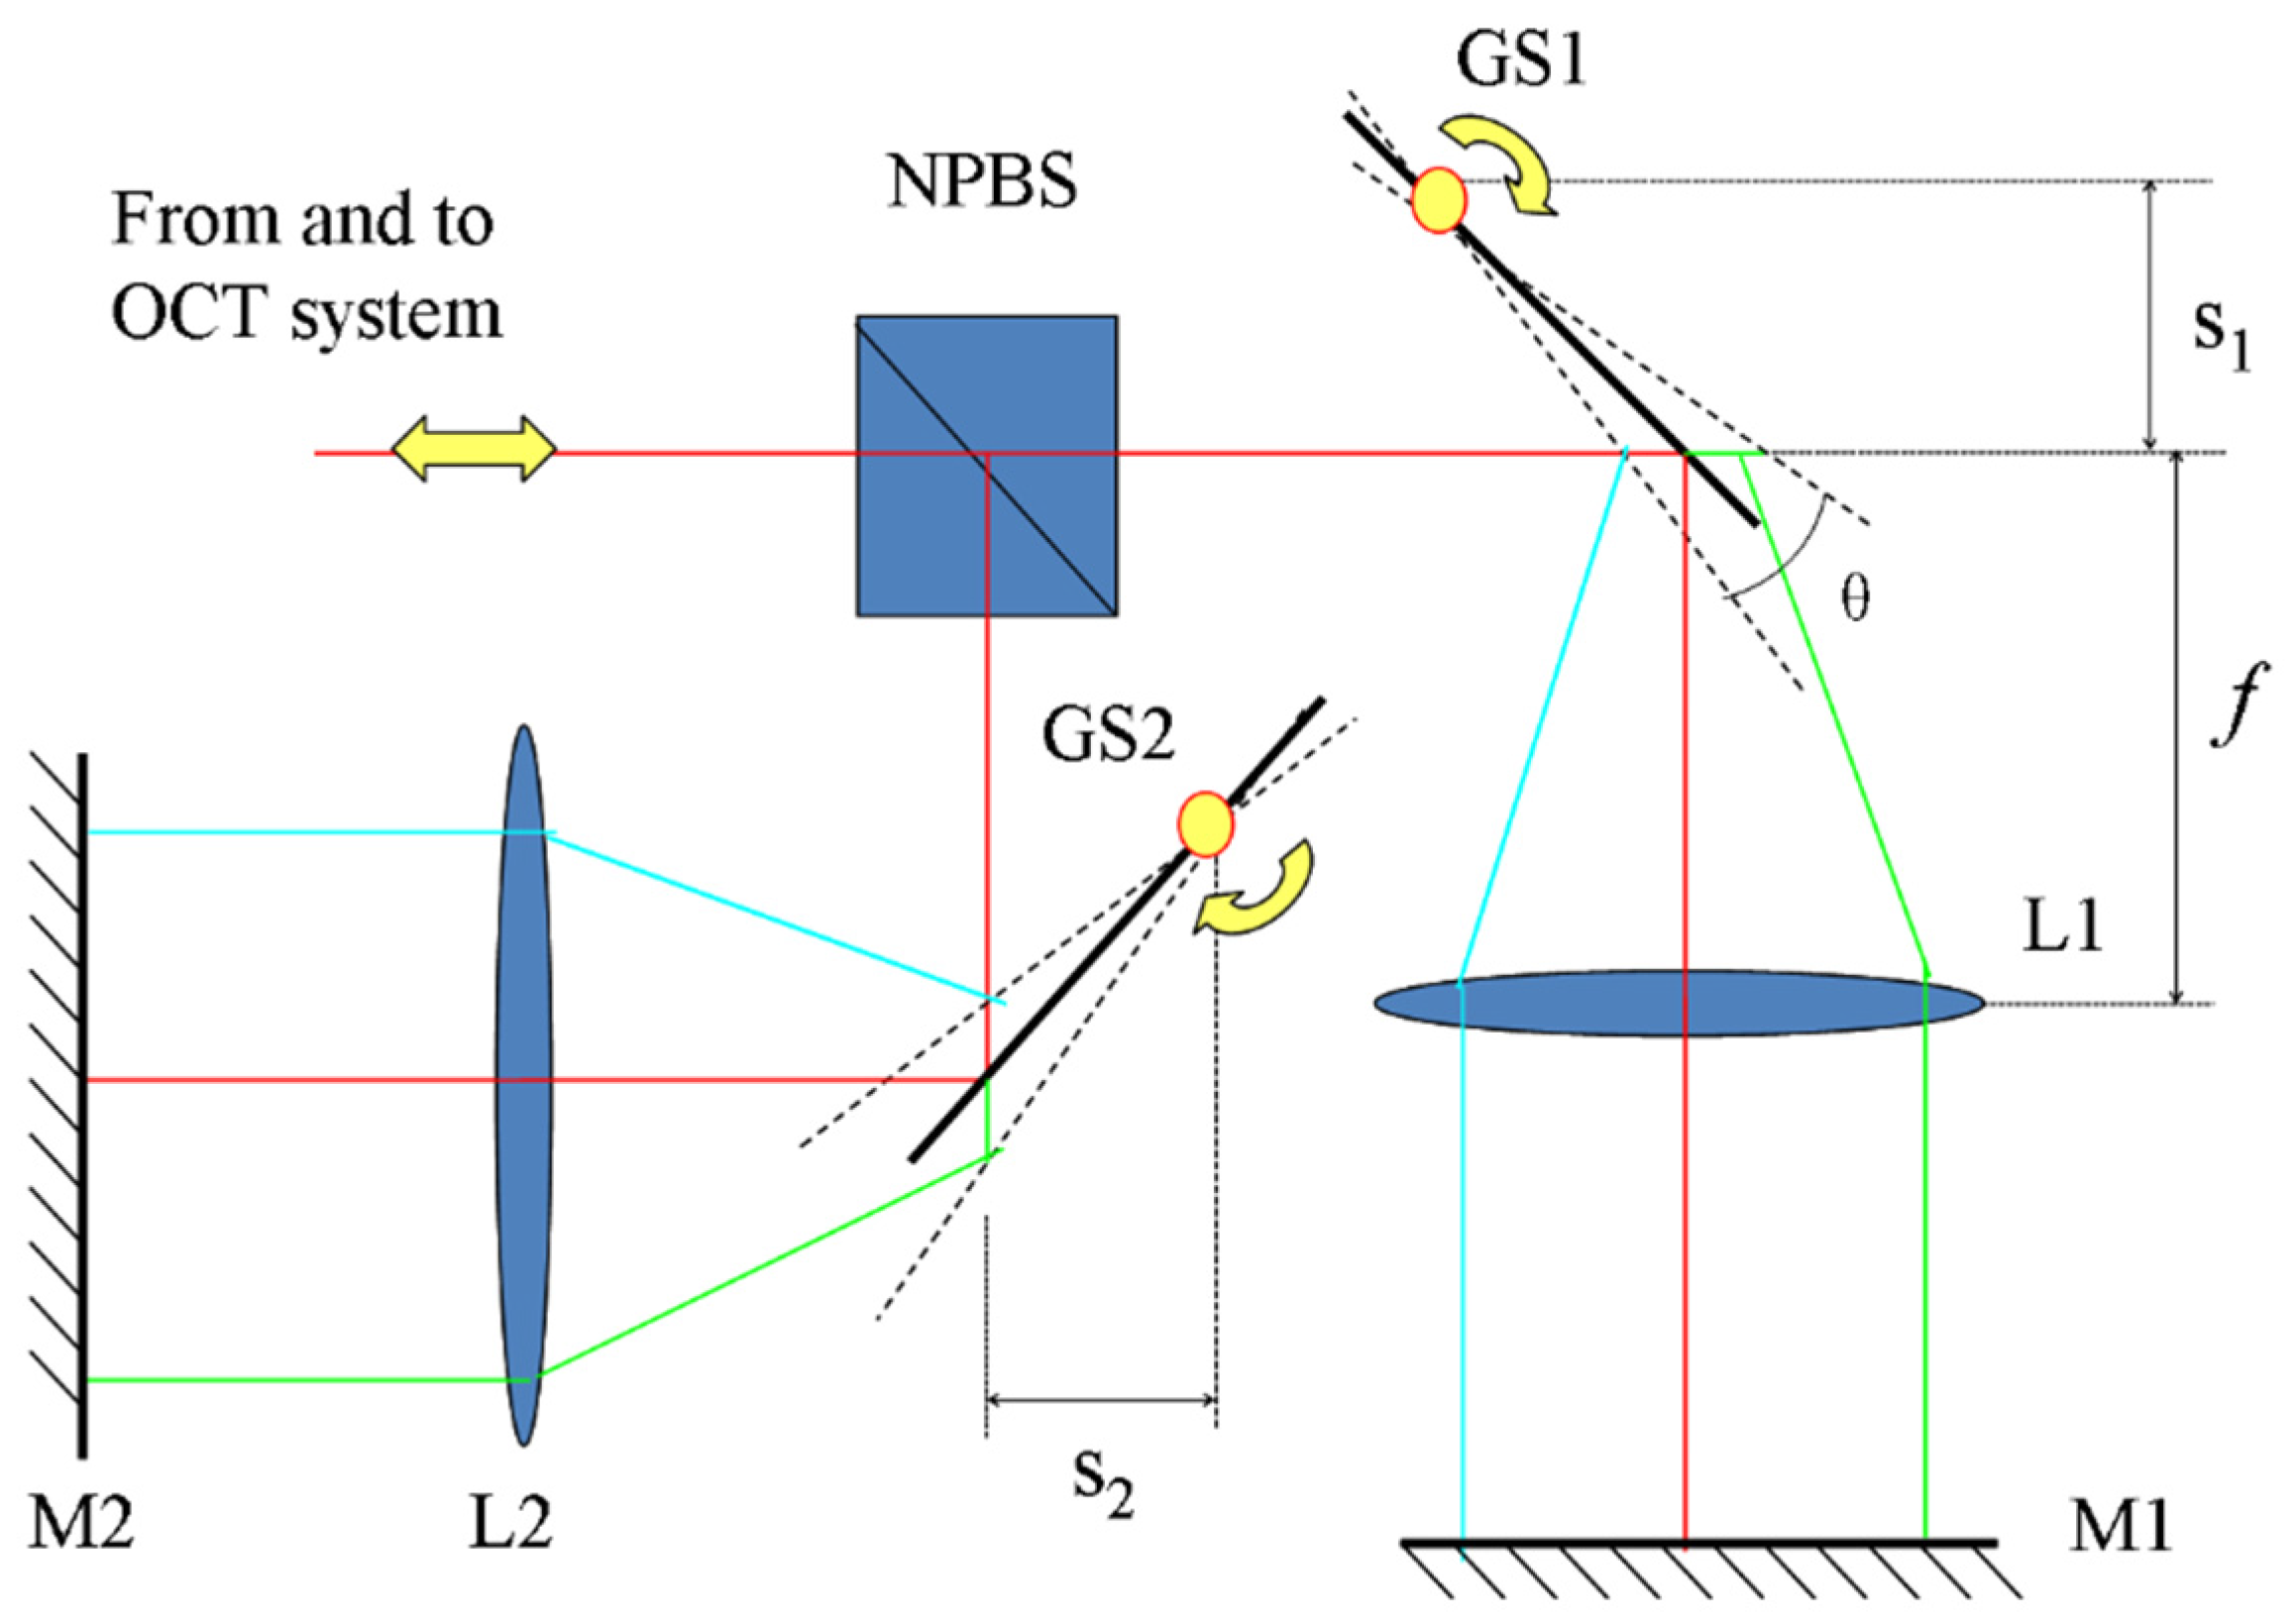
For experimental verification of the method, we constructed a fiber-based spatial frequency domain multiplexing SDOCT system as depicted in Figure 1. The imaging system employs a super luminescent diode light source (SLD-371-HP2, Superlum Inc., Carrigtwohill, Ireland) with a center wavelength at 837 nm and a full width at half maximum (FWHM) of 54 nm. The beam diameter d in the sample arm is 1.8 mm, which will produce a 44 μm 1/e2 diameter focal spot on the sample with a confocal parameter of 3.7 mm. A 50/50 fiber coupler splits the light beam into the sample arm and the reference arms. In the sample arm, the light beam is deflected by a 2D galvo scanner and focused via a 75 mm achromatic lens L0 to the sample. Within the reference arm, a wide bandwidth non-polarizing beam splitter (NPBS, Daheng Optics Inc., Beijing, China) is used to divide the reference optical power into the two separate reference arms. The fiber collimator on a translation stage in the reference arm is used to adjust the overall delay of the two channels. The single-pass OPD between Reference Arms I and II is set to 3 mm. The GS1 and GS2 are the X and Y mirror of a pair of large beam 2D GS system (GVS012, Thorlabs Inc., Newton, NJ, USA), respectively. The focus lengths of achromatic lens L1and L2 are both 30 mm. The plane mirror M1 and M2 are the wide bandwidth dielectric coated mirrors covering the wavelength range of 800 to 900 nm. The spectral interference signal is detected by a custom-built spectrometer, which consists of a collimator (f = 60 mm, OZ optics Inc., Ottawa, ON, Canada), a transmissive diffraction grating (1800 lines/mm), a camera lens (f =105 mm, Nikon Inc., Tokyo, Japan), and a line-scan CMOS camera (sp2048-70km, Basler AG Inc., Ahrensburg, German). The spectral resolution of the spectrometer is 0.065 nm, allowing for a theoretical effective imaging depth range of 3.5 mm.
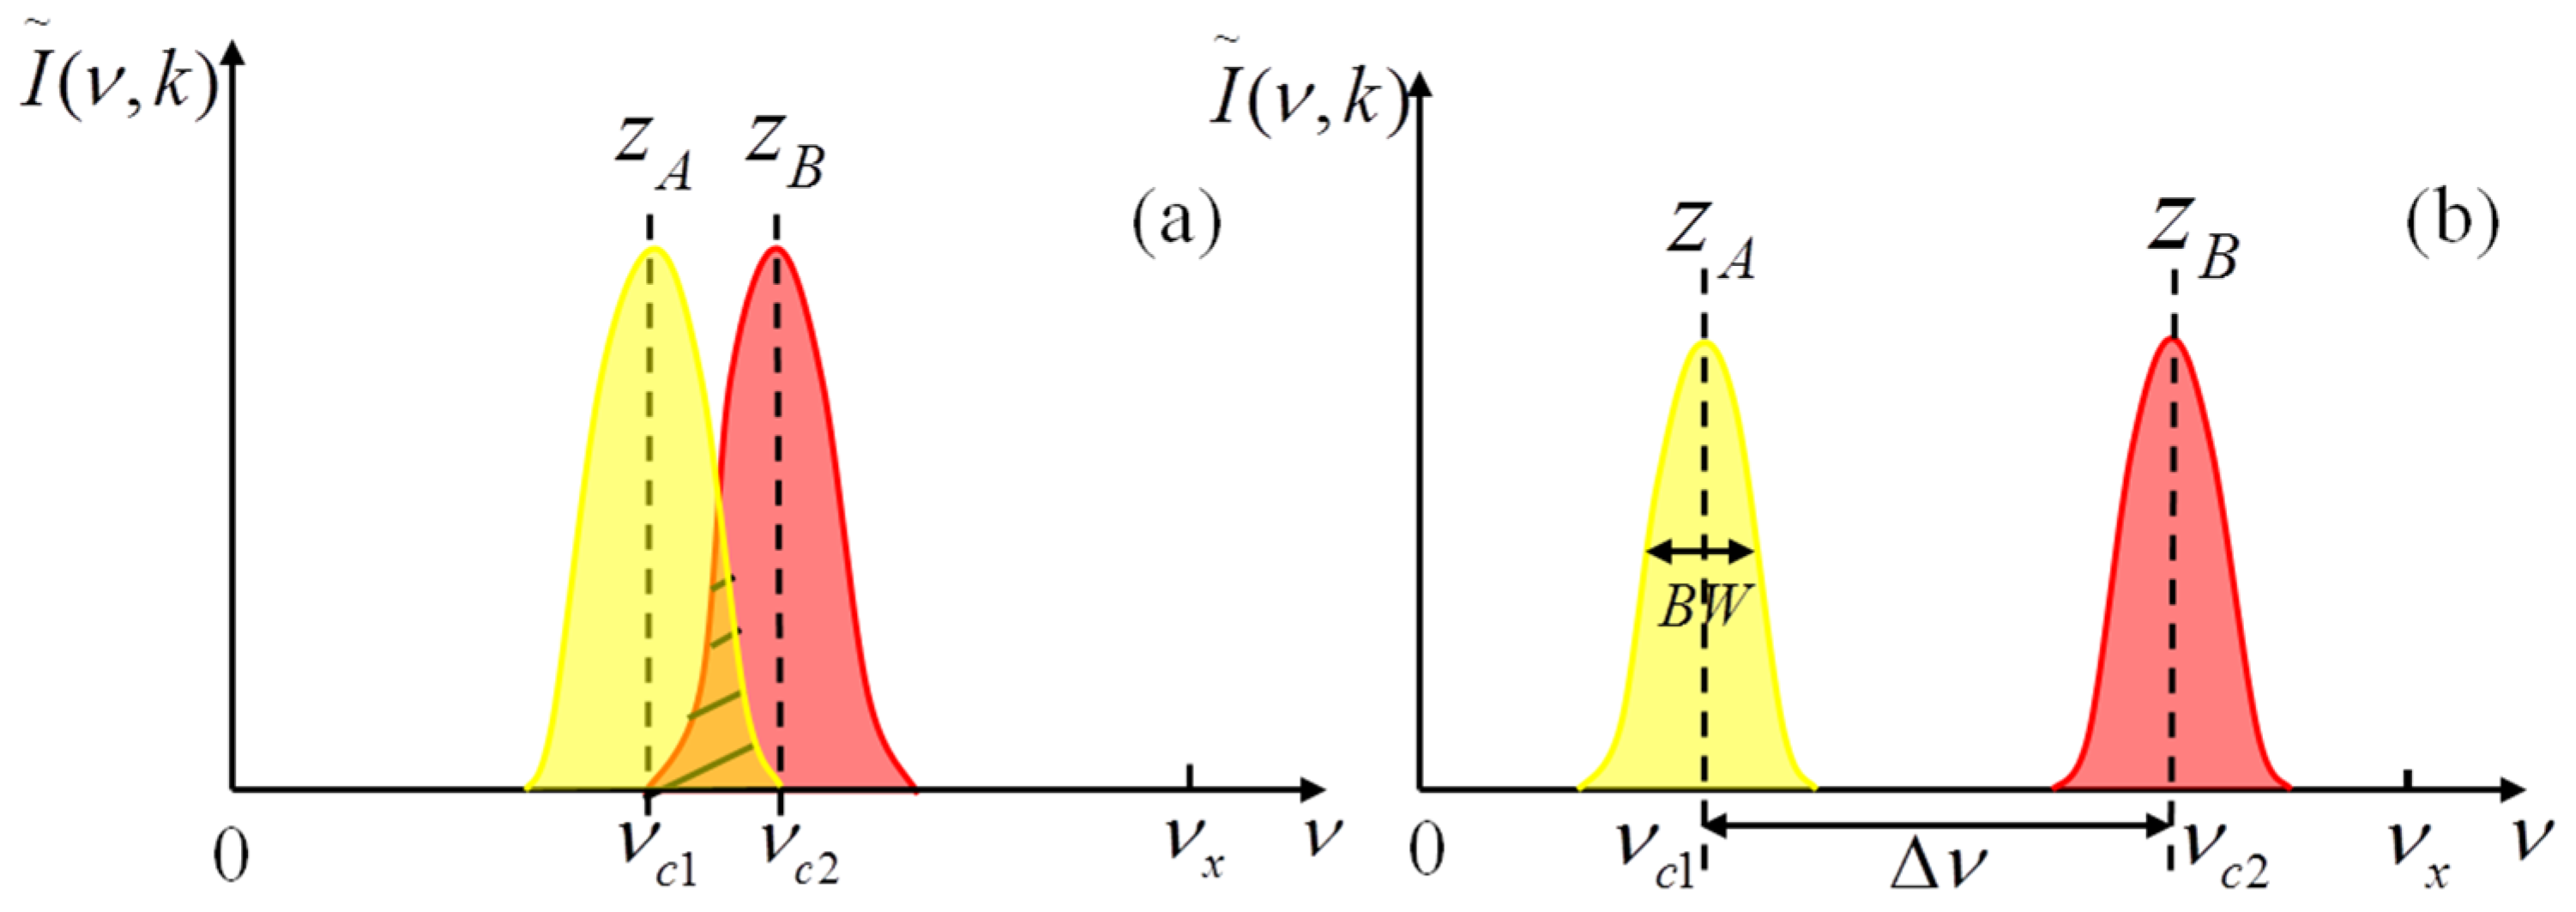
In view of avoiding aliasing terms and according to Equation (9), the number of A-scans per B-scan is set to 500, and the lateral scanning range is set to 1.3 mm. The highest positive spatial frequency calculated by Equation (6) is 192 mm−1. According to the values of the sample beam diameter d, the center wavelength, the focus length of the sample objective and Equation (7), the theoretical BW of the spatial frequency content is calculated to be 22.5 mm−1. In order to suppress the crosstalk of the two spatial frequency contents of the two depths signal, the difference of the two center spatial carrier frequencies must be greater than 67.5 mm−1 according to Equation (8). Considering that the optimal conjugate suppression ratio occurs when δ φ is π / 2 [9], each of the two center spatial carrier frequencies needs to be close to the central region of the positive spatial frequency range. Thus, the two center spatial carrier frequencies νc1 and νc2 are set to 56.5 and 123.5 mm−1, respectively. According to Equation (4), the phase shift δ φ 1 and δ φ 2 between successive axial scans are calculated to be 0.3 π and 0.7 π . The angular velocity of the galvo scanners is set to 0.93 rad/s. The exposure time of the CMOS camera is set to 18 μs. According to Equation (3) and the above parameters, the pivot-offset distances on the GS1 and GS2 mirrors are calculated to be 1.8 and 3.9 mm, respectively. The pivot-offset distance is adjusted via the diagonal translation of the scanners to keep the light beam at the center of the focusing optics.
To experimentally characterize the extension of the imaging depth range of the spatial frequency domain multiplexing SDOCT system, the point spread function is measured by using a plane mirror at various depths in the sample arm. 
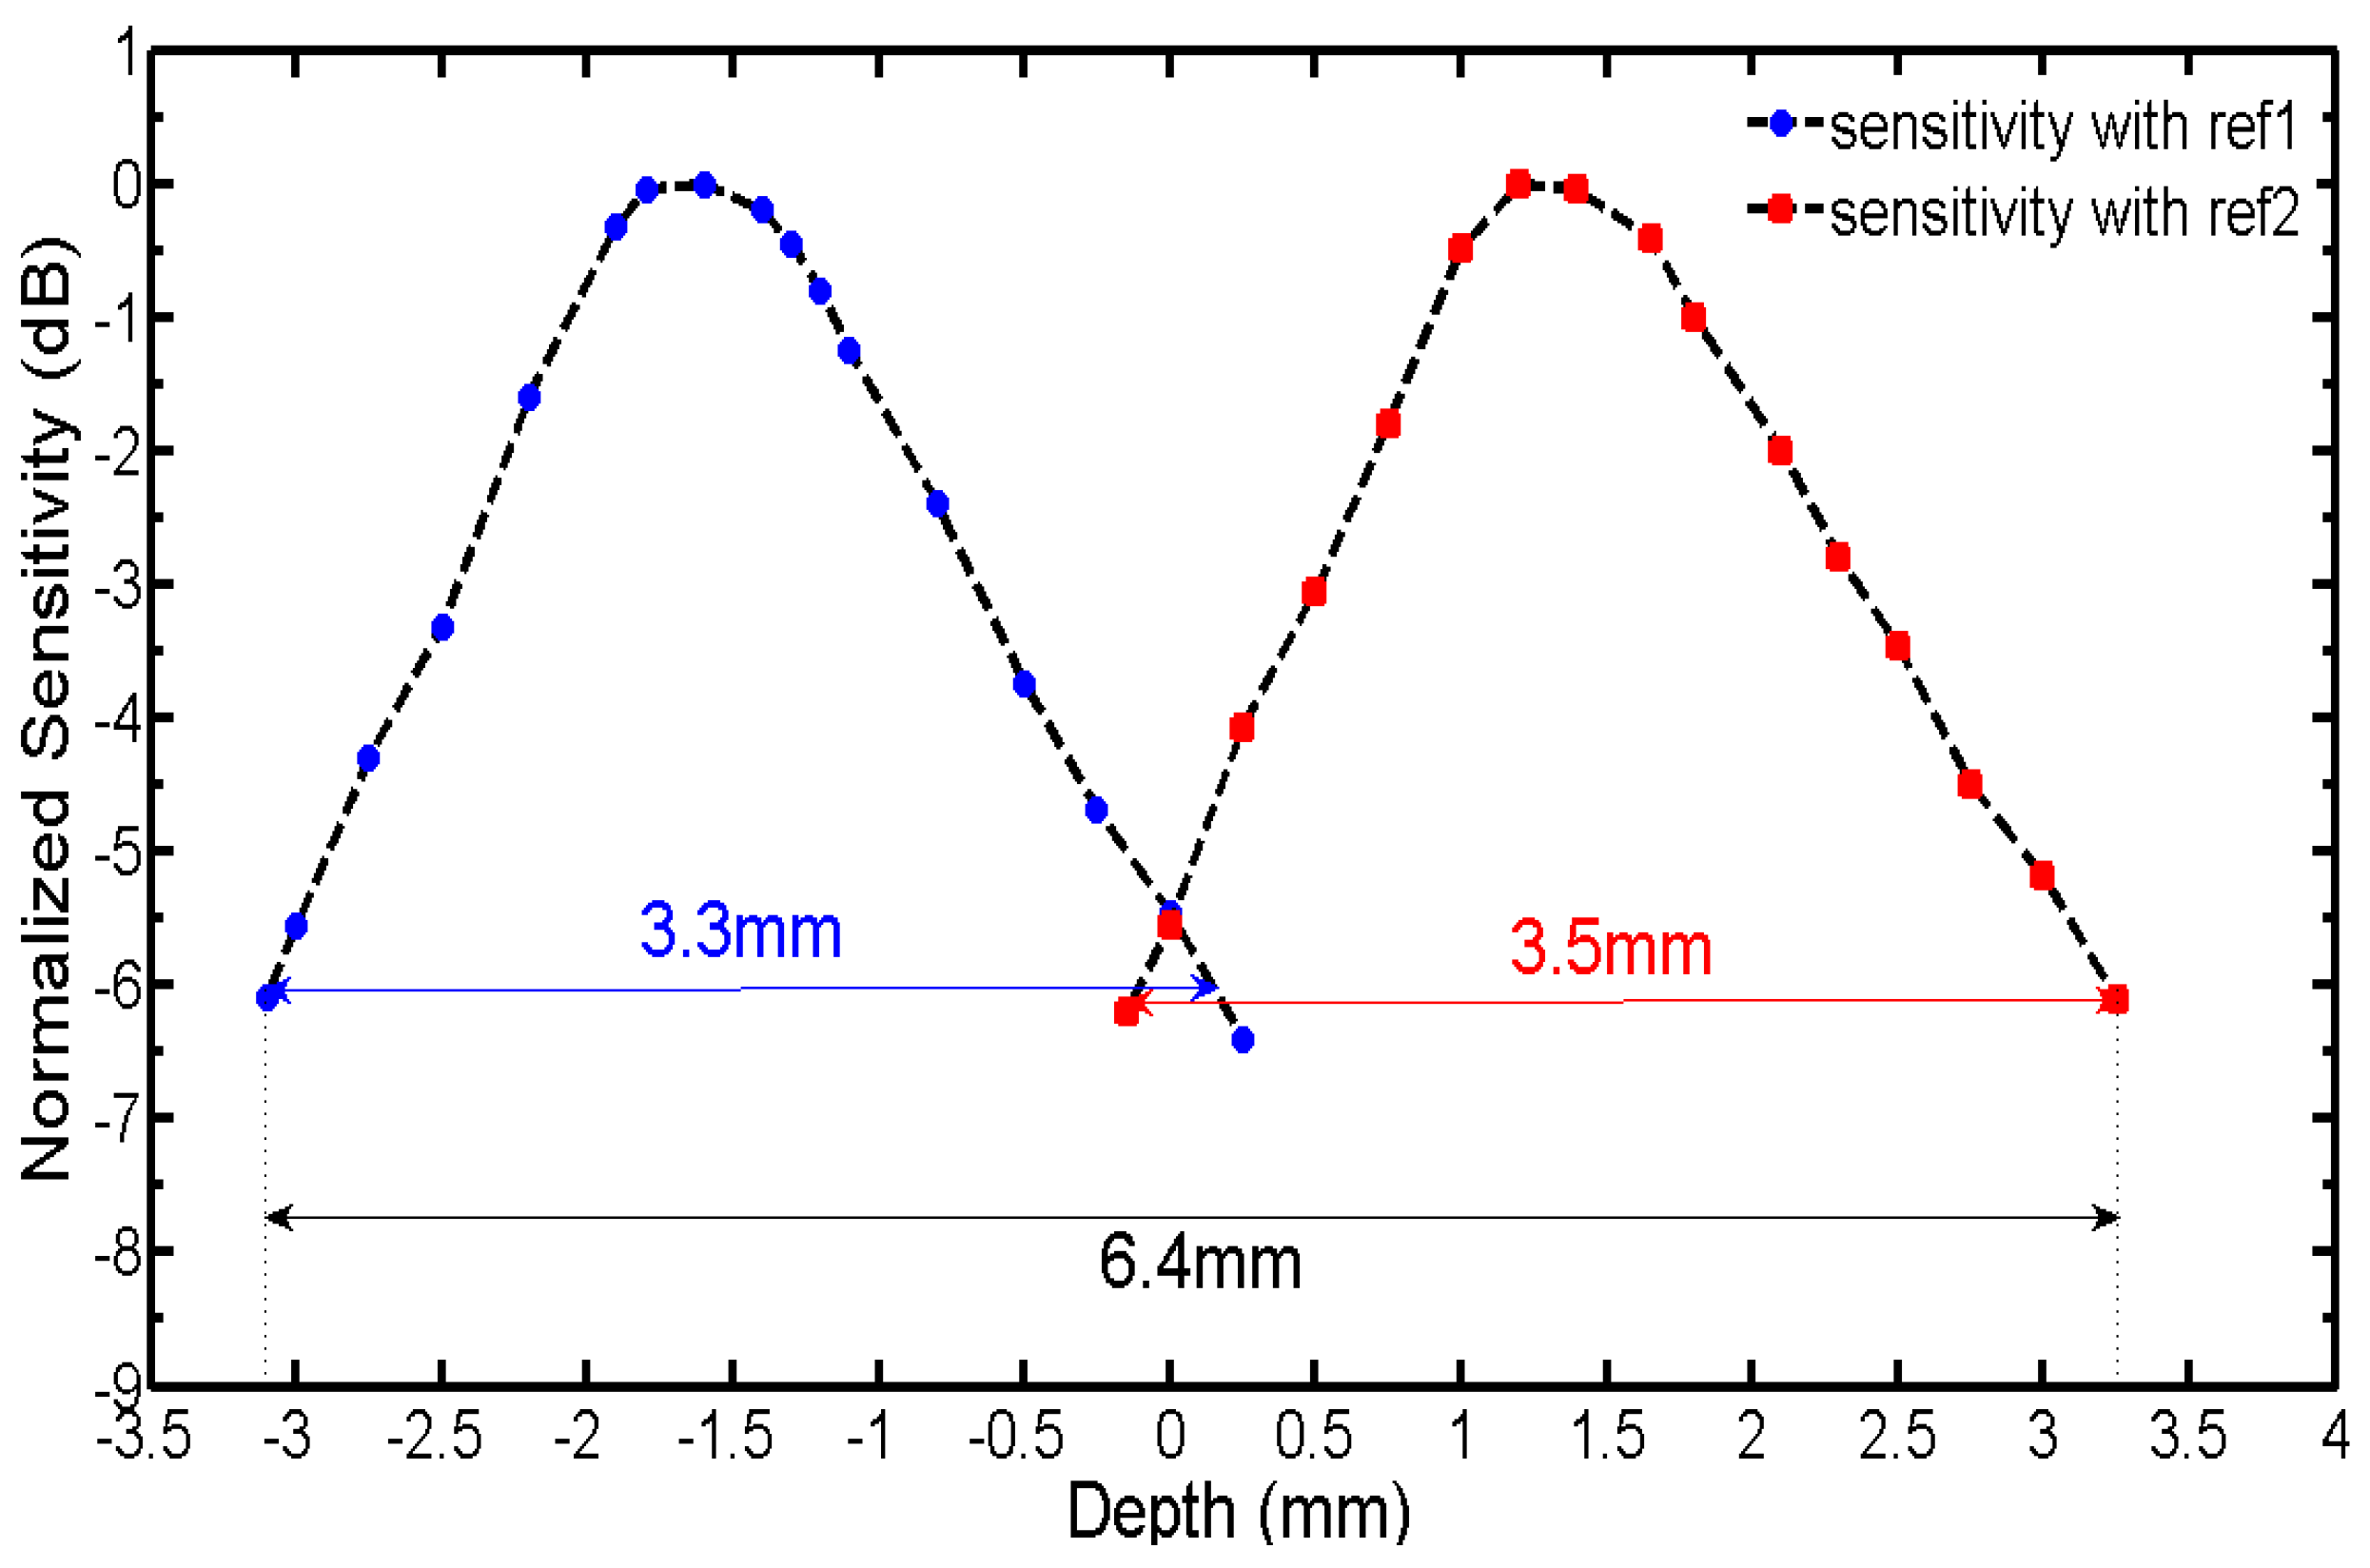
Figure 5 shows the experimentally measured normalized sensitivity as a function of depth for the two reference arms. The measured value of the absolute sensitivity is 59.7 dB. From Figure 5, the separation between the two sensitivity peaks can be used to calibrate the actual relative OPD between the two reference arms, and it can be shown that the actual relative OPD is about 3 mm. The benefit from the use of the spatial frequency domain multiplexing SDOCT system is also demonstrated, and the effective imaging depth range for the proposed system is increased from about 3.4 to 6.4 mm, compared with a conventional full-range SDOCT without depth range enhancement. The depth enhancement factor is 1.9. In this demonstration, the two sensitivity curves are crossed at the −5.5 dB from the sensitivity peaks. Therefore, the effective imaging depth range would be doubled if the relative optical path delay was precisely tuned to make the two sensitivity curves cross at the −6 dB point from the sensitivity peaks.
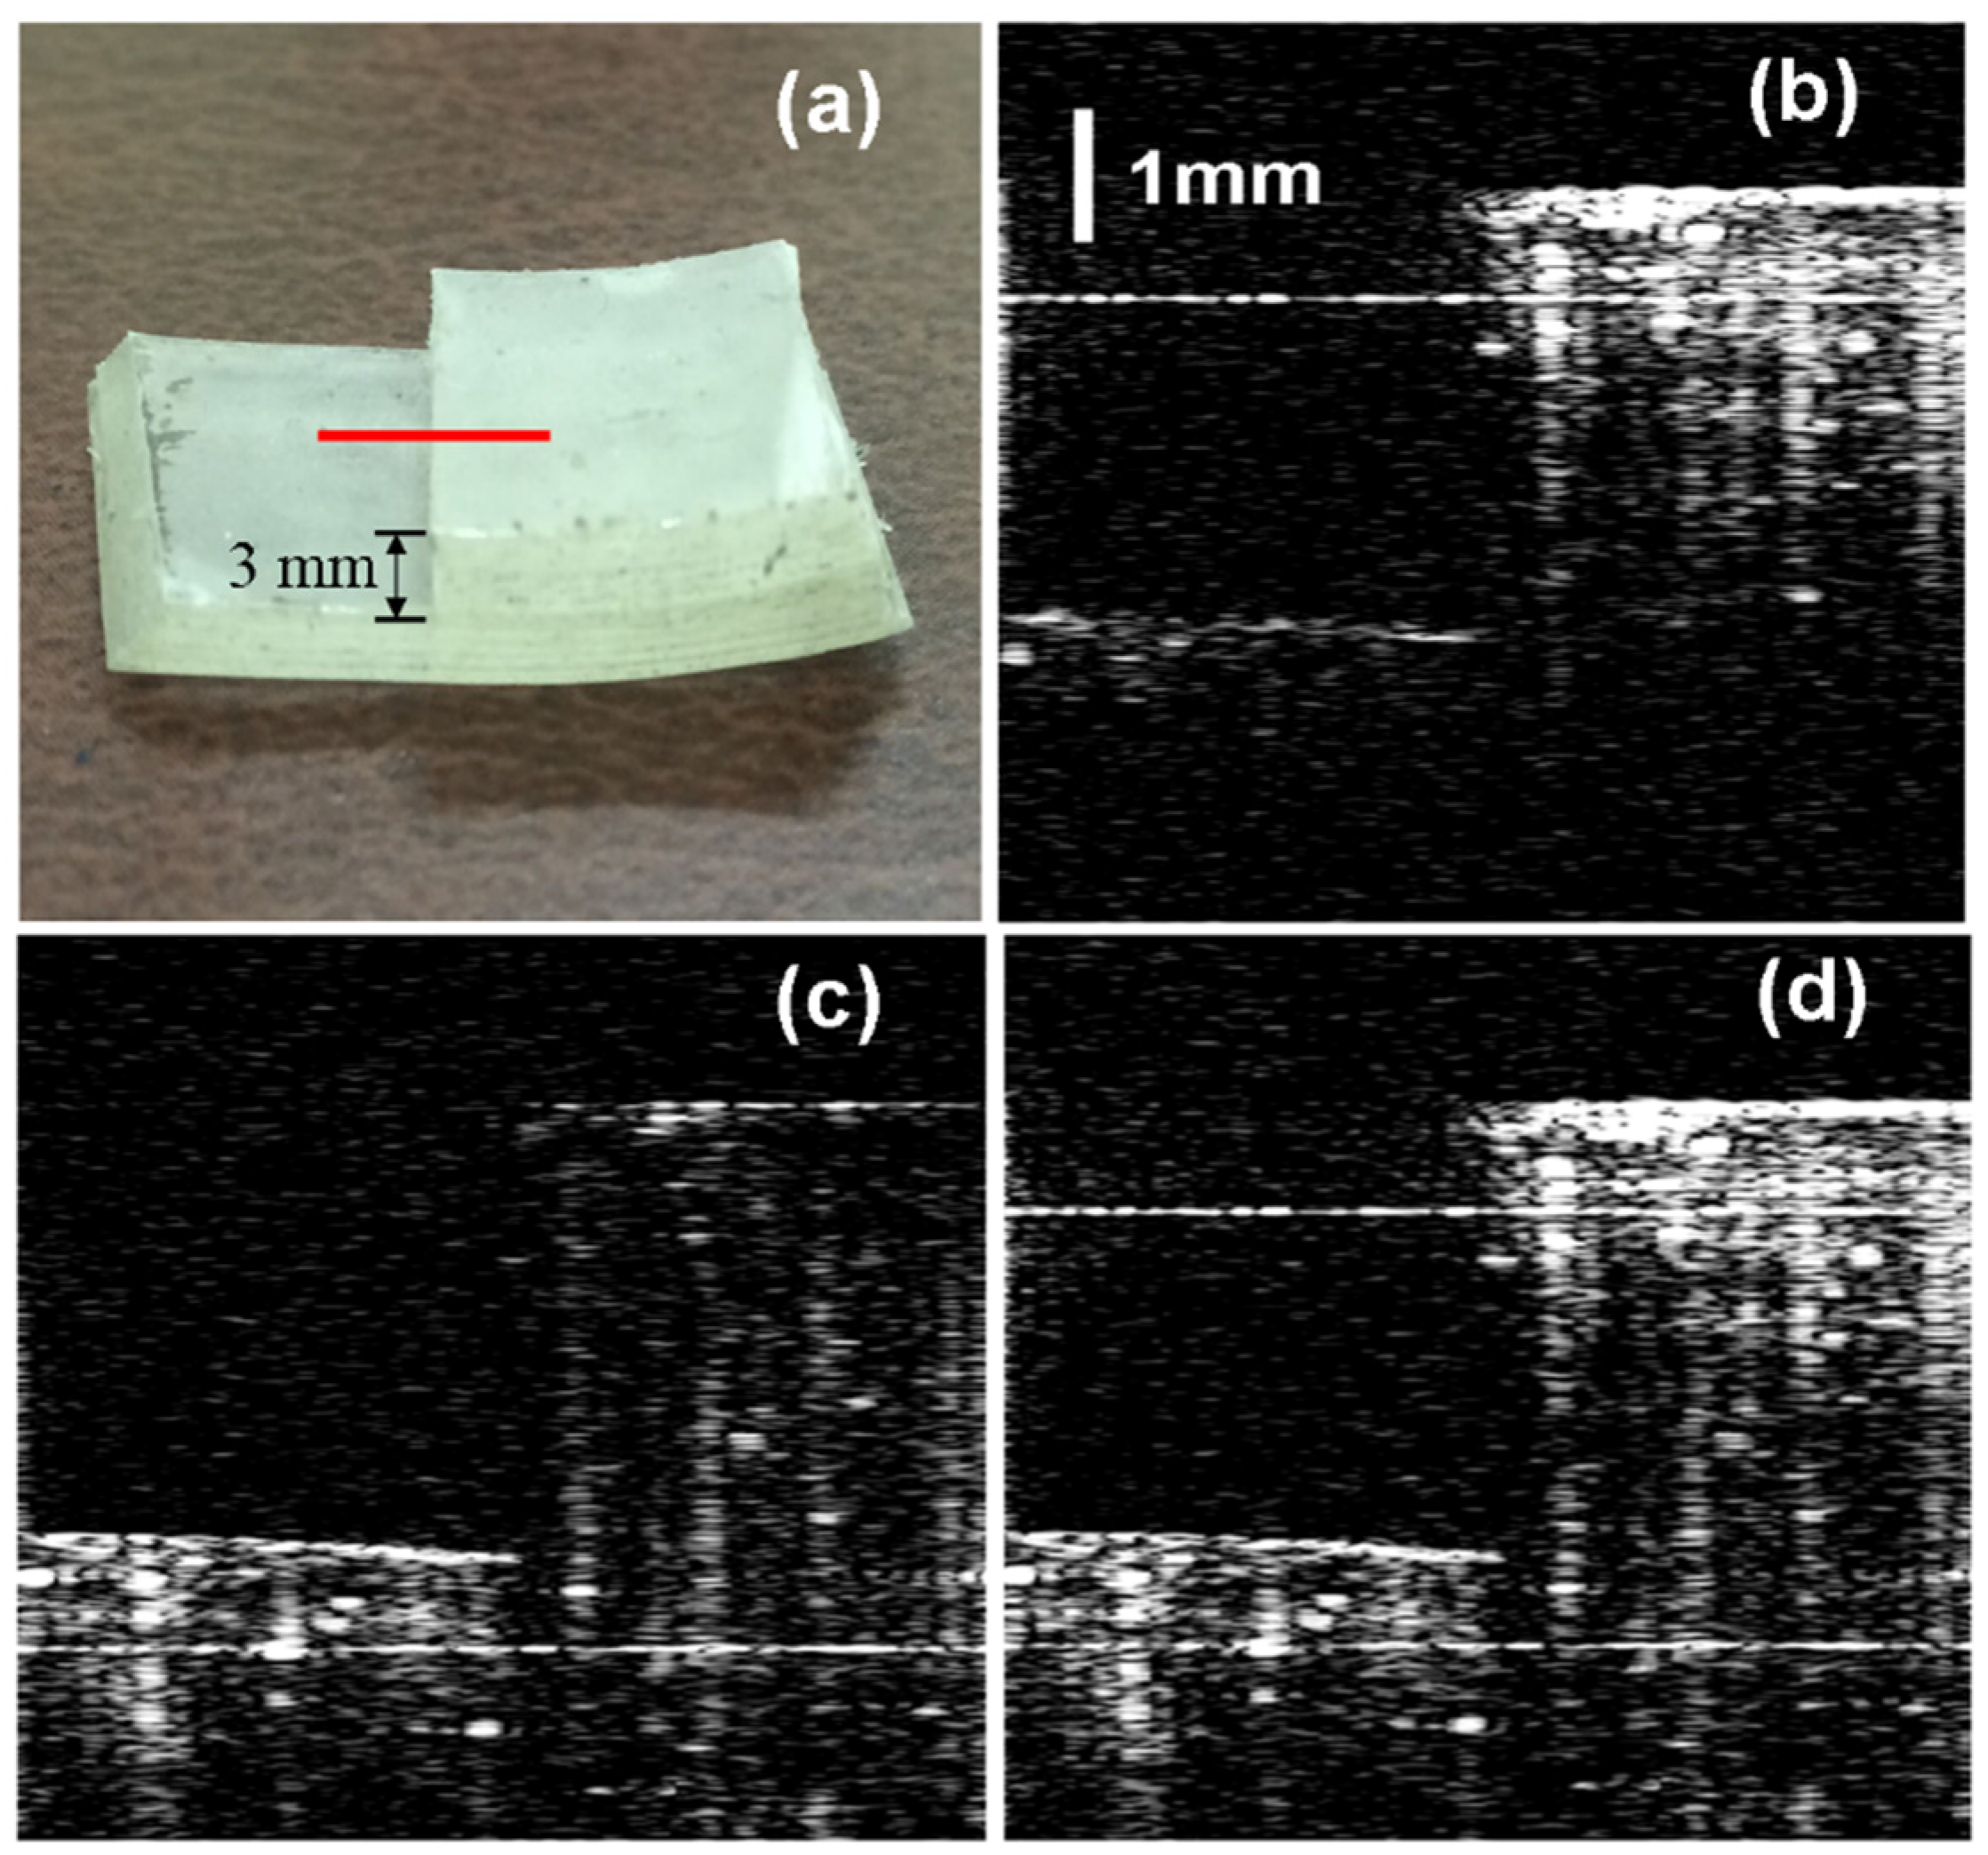
To demonstrate the ranging depth enhancement, we compare image results of the OCT images acquired by the proposed two-reference-arm spatial frequency domain multiplexing approach and the conventional single-reference-arm approach. Firstly, an artificial phantom is imaged by the system. Figure 6a shows the photograph of the phantom taken with a digital camera. The phantom is made by sticking two blocks of sellotape to generate a step 3 mm high. 
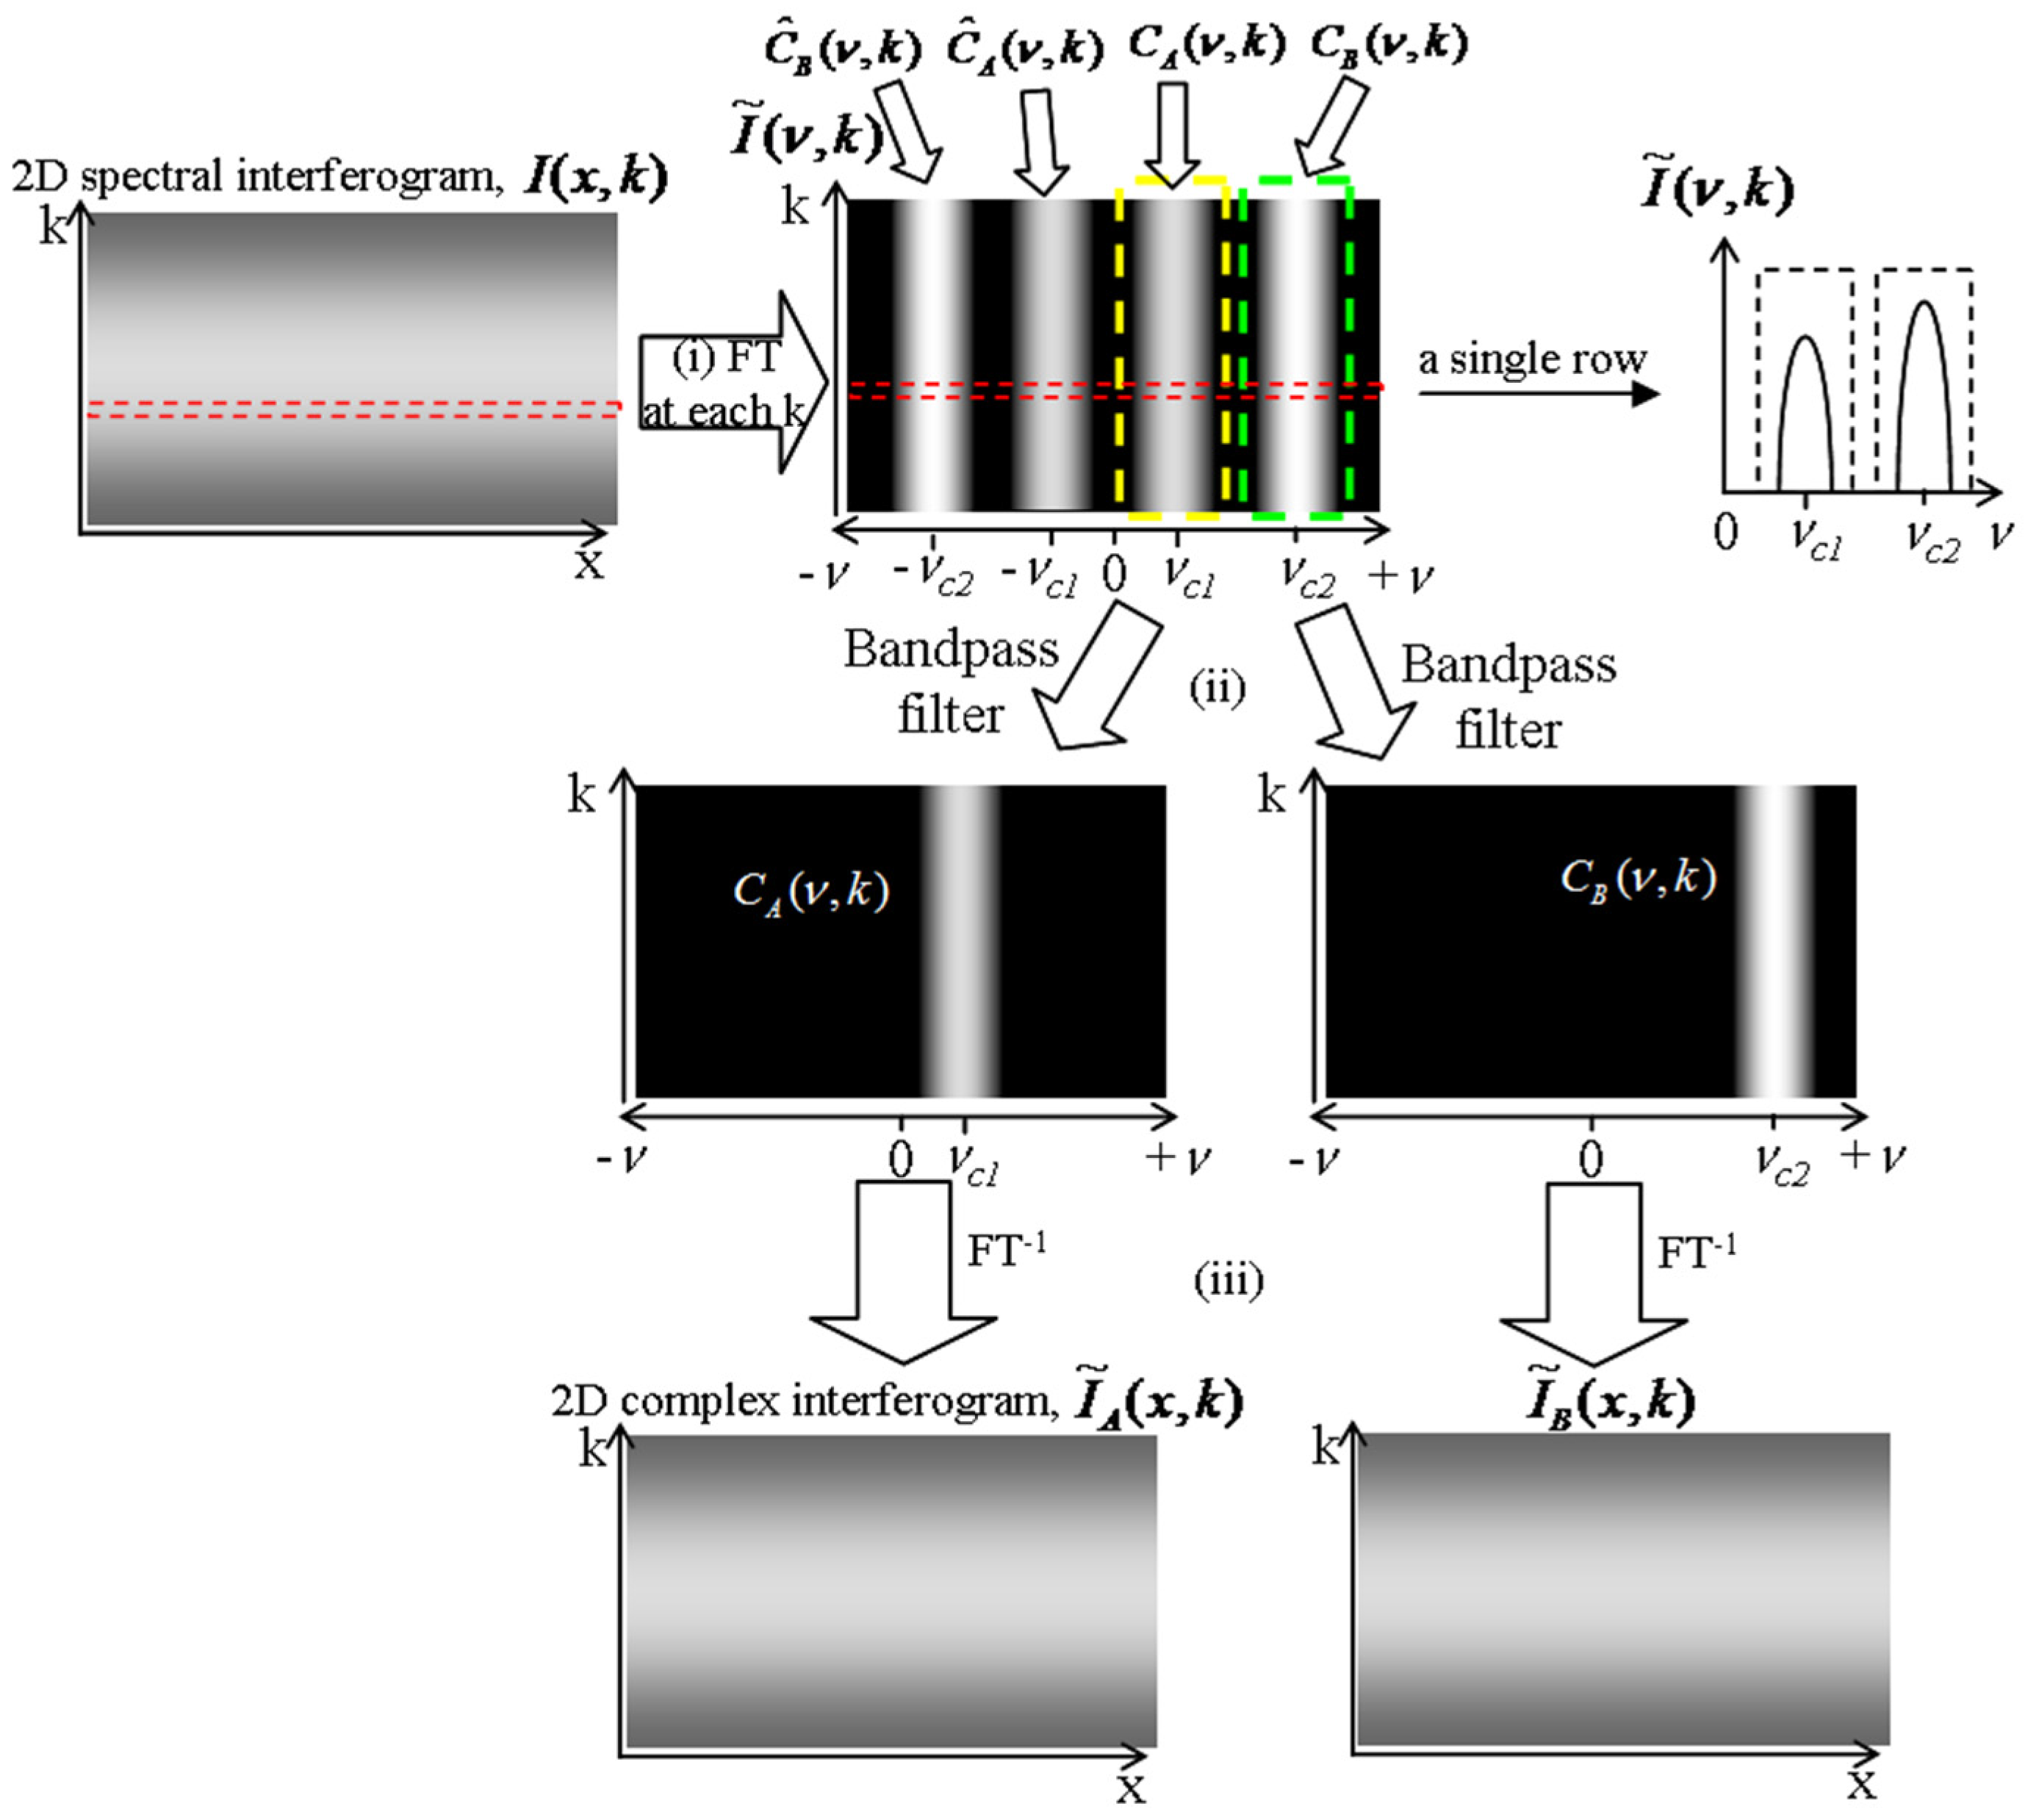
Figure 6b–d are the complex conjugate ambiguity free OCT images of the phantom reconstructed by the data processing algorithm described previously. Figure 6b shows the image acquired with Reference Arm I open while blocking Reference Arm II. As we can see, the upper part of the step is clearly imaged, while the image of the lower part is hard to be discerned. The OPD between the upper part and Reference Arm I resides in the effective imaging range, while that of the lower part and Reference Arm I is larger than 6 mm, out of the effective imaging range. Figure 6c shows the OCT image acquired with Reference Arm II open while blocking Reference Arm I. Likewise, the lower part of the step can be clearly imaged, while the upper part is not clear. Figure 6d shows the reconstructed OCT image of the phantom acquired with both Reference Arms I and II open. The whole phantom including the upper and lower part of the step can be clearly seen. The imaging depth-enhanced OCT image of the artificial phantom demonstrates the feasibility of the proposed method for extending the OCT ranging depth.
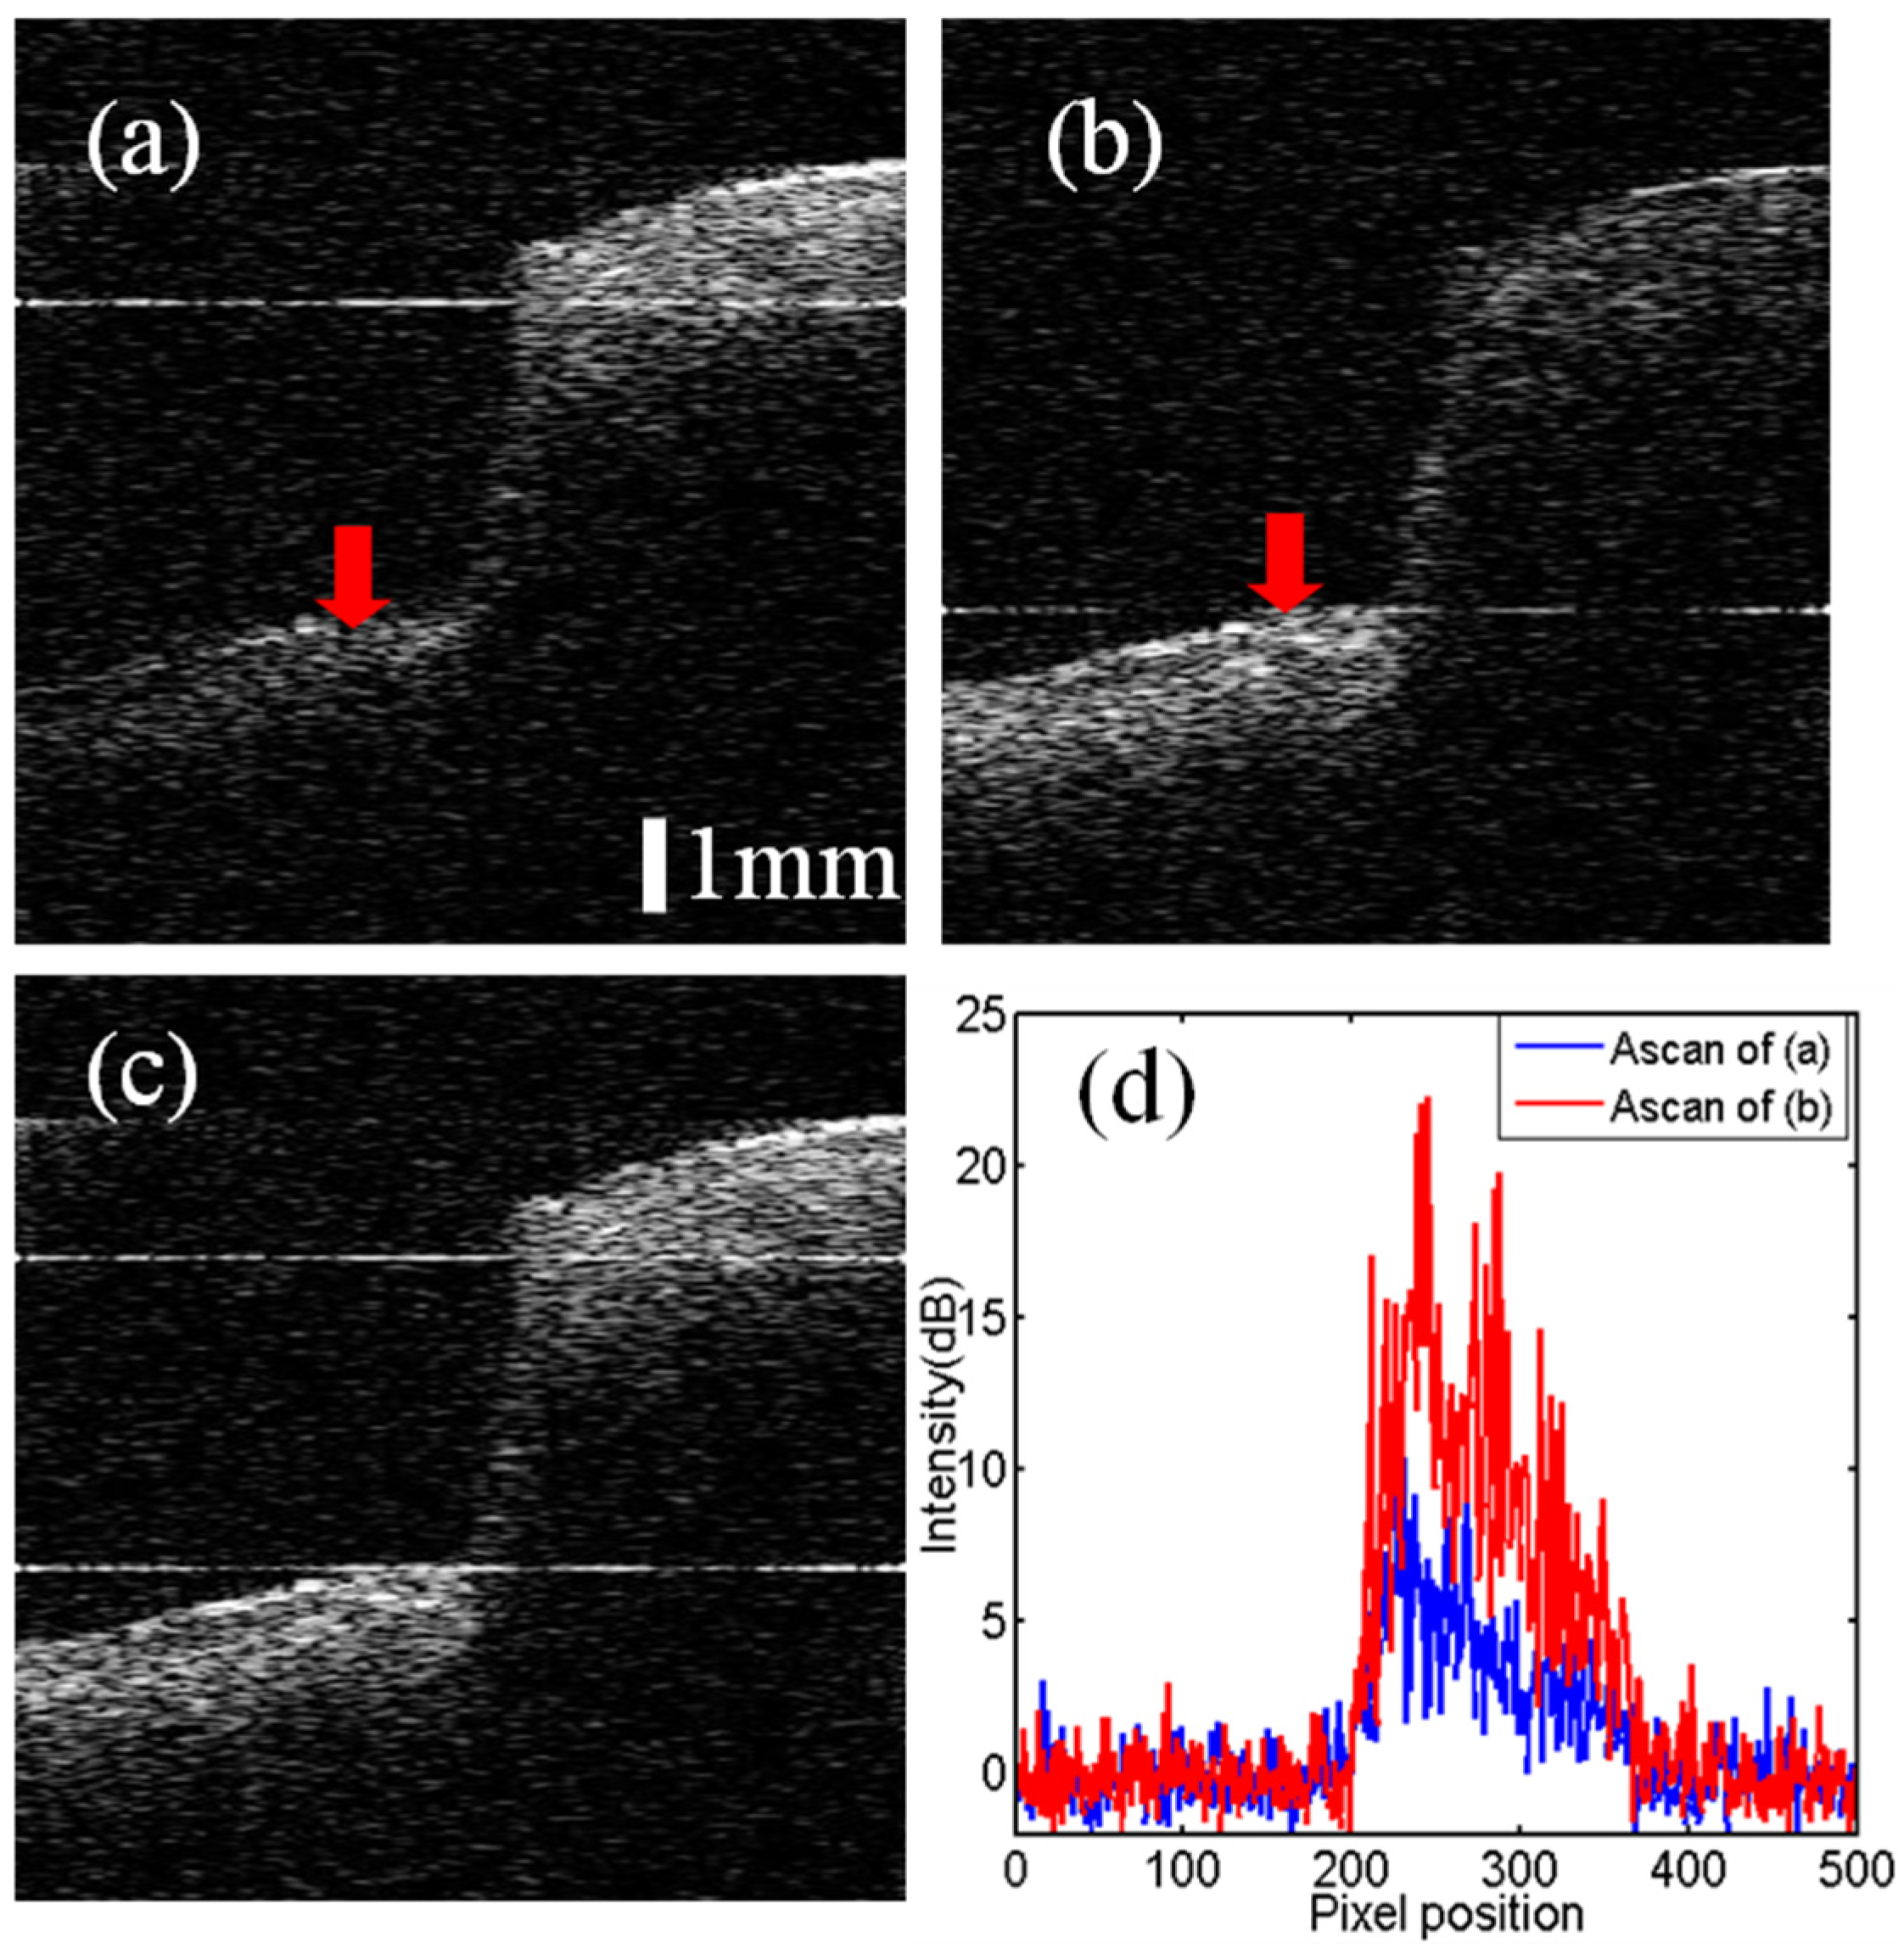
The biological tissue of the swine adipose is also in vitro, imaged and compared with the results acquired by the proposed two-reference-arm spatial frequency domain multiplexing approach and the conventional single-reference-arm approach. Figure 7a,b show the images recorded using the two Reference Arms I and II separately. In each case, the area of the tissue around the DC signal component has maximum sensitivity. Figure 7c shows the OCT image of the tissue acquired with both of Reference Arms I and II open. As we can see, the upper and lower part of the biological sample is clearly appeared at the same time. Figure 7d plots an A-scan profile from the same sample position indicated by the red arrows in Figure 7a,b. It can be seen that the signal is about 13 dB stronger than that of the signal 3 mm away due to the sensitivity roll-off. The extended range OCT image of the biological tissue obtained with the system demonstrates the feasibility of the proposed method for extending the OCT ranging depth. Because the galvanometer scanners in the system are used for phase modulation of the lateral interference spectral signal, the phase noise does not affect the quality of the results. In future, the proposed method for extending the OCT ranging depth can be combined with the depth of the focus extension method to improve the quality of the extended range OCT image.

4. Conclusions

We have proposed and demonstrated a spatial frequency domain multiplexing method to extend the effective imaging depth range for SDOCT system without any expensive acousto-optic or electro-optic modulation device. The spatial frequency domain multiplexing is realized by using two pivot-offset galvo scanners in the two reference arms. The images of shallow and deep regions of a sample can be multiplexed and acquired simultaneously with no image acquisition rate penalty. The proposed two-reference-arm spatial frequency domain multiplexing SDOCT system provides an approximately 1.9-fold increase in the effective imaging range compared with that of a conventional single-reference-arm full-range SDOCT system. We present key system parameter design criteria for ensuring a high signal/crosstalk ratio imaging. The images of an artificial phantom and the swine adipose tissue reconstructed with the proposed method demonstrate the expected increase in the effective imaging depth range. This simple and low-cost method is also applicable to the SSOCT system, and desirable in the in vivo applications requiring a relatively long imaging range.

Acknowledgments

This work was supported by the National Natural Science Foundation of China (61205201, 11174147), the Fundamental Research Funds for the Central Universities, Nanjing University of Aeronautics and Astronautics (NZ2015104), Postdoctoral Research Funds of Jiangsu Province (1201034C), the China Postdoctoral Science Foundation (2013M531345).

Author Contributions

Tong Wu and Youwen Liu conceived the ideas; Tong Wu and Qingqing Wang designed and performed the experiments; Tong Wu and Qingqing Wang processed the data; Jiming Wang, Xiaorong Gu, and Chongjun He contributed with the materials and samples; Tong Wu wrote the paper.

Conflicts of Interest

The authors declare no conflict of interest.

References

  1. Huang, D.; Swanson, E.A. Optical Coherence Tomography. Science 1991, 254, 1178–1181. [Google Scholar] [CrossRef] [PubMed]
  2. Wang, H.; Pan, Y.; Rollins, A.M. Extending the effective imaging range of Fourier-domain optical coherence tomography using a fiber optic switch. Opt. Lett. 2008, 33, 2632–2634. [Google Scholar] [CrossRef] [PubMed]
  3. Grulkowski, I.; Liu, J.J. Anterior segment and full eye imaging using ultrahigh speed swept source OCT with vertical-cavity surface emitting lasers. Biomed. Opt. Express 2012, 3, 2733–2751. [Google Scholar] [CrossRef] [PubMed]
  4. Bao, W.; Ding, Z. Orthogonal dispersive spectral-domain optical coherence tomography. Opt. Express 2014, 22, 10081–10090. [Google Scholar] [CrossRef] [PubMed]
  5. Bajraszewski, T.; Wojtkowski, M. Improved spectral optical coherence tomography using optical frequency comb. Opt. Express 2008, 16, 4163–4176. [Google Scholar] [CrossRef] [PubMed]
  6. Wang, R. In vivo full range complex Fourier domain optical coherence tomography. Appl. Phys. Lett. 2007, 90, 054103. [Google Scholar] [CrossRef]
  7. Baumann, B.; Pircher, M. Full range complex spectral domain optical coherence tomography without additional phase shifters. Opt. Express 2007, 15, 13375–13387. [Google Scholar] [CrossRef] [PubMed]
  8. An, L.; Wang, R. Use of a scanner to modulate spatial interferograms for in vivo full-range Fourier-domain optical coherence tomography. Opt. Lett. 2007, 32, 3423–3425. [Google Scholar] [CrossRef] [PubMed]
  9. Leitgeb, R.A.; Michaely, R. Complex ambiguity-free Fourier domain optical coherence tomography through transverse scanning. Opt. Lett. 2007, 32, 3453–3455. [Google Scholar] [CrossRef] [PubMed]
  10. Podoleanu, A.G.; Dobre, G.M.; Jackson, D.A. En-face coherence imaging using galvanometer scanner modulation. Opt. Lett. 1998, 23, 147–149. [Google Scholar] [CrossRef] [PubMed]
  11. Duma, V.F.; Tankam, P. Optimization of galvanometer scanning for optical coherence tomography. Appl. Opt. 2015, 54, 5495–5507. [Google Scholar] [CrossRef] [PubMed]
  12. Nezam, S.M.R.M.; Vakoc, B.J. Increased ranging depth in optical frequency domain imaging by frequency encoding. Opt. Lett. 2007, 32, 2768–2770. [Google Scholar] [CrossRef]
  13. Zhou, C.; Wang, J. Dual channel dual focus optical coherence tomography for imaging accommodation of the eye. Opt. Express 2009, 17, 8947–8955. [Google Scholar] [CrossRef] [PubMed]
  14. Dai, C.; Zhou, C. Optical coherence tomography for whole eye segment imaging. Opt. Express 2012, 20, 6109–6115. [Google Scholar] [CrossRef] [PubMed]
  15. Ruggeri, M.; Uhlhorn, S.R. Imaging and full-length biometry of the eye during accommodation using spectral domain OCT with an optical switch. Biomed. Opt. Express 2012, 3, 1506–1520. [Google Scholar] [CrossRef] [PubMed]
  16. Dai, C.; Fan, S. Dual-channel spectral-domain optical-coherence tomography system based on 3 × 3 fiber coupler for extended imaging range. Appl. Opt. 2014, 53, 5375–5379. [Google Scholar] [CrossRef] [PubMed]
  17. Montagu, J. Scanners—Galvanometric and resonant. In Encyclopedia of Optical Engineering, 1st ed.; Driggers, R.G., Hoffman, C., Eds.; Taylor & Francis: New York, NY, USA, 2003; Volume 3, pp. 2465–2487. [Google Scholar]
Figure 1. Schematic of the spatial frequency domain multiplexing spectral domain optical coherence tomography (SDOCT) system. SLD: super luminescent diode; FC: fiber coupler; NPBS: non-polarizing beam splitter; M: reference mirror; GS: galvanometer scanner; L: lens; SMP: sample; COL: collimator; PC: polarization controller; DG: diffraction grating; COMP: computer; CMOS: complementary metal oxide semiconductor.
Applsci 06 00360 g001
Figure 2. Data processing flowchart of the spatial frequency domain multiplexing SDOCT system. FT: Fourier Transform.
Applsci 06 00360 g002
Figure 3. Sketch of the two reference arms in the spatial frequency domain multiplexing SDOCT system. s1 and s2: the pivot-offset distances; L1 and L2: the focal lens in the reference arms; M1 and M2: the plane mirrors; f: focal length of the focal lens.
Applsci 06 00360 g003
Figure 4. Schematic of the choice of the center spatial carrier frequencies. Crosstalk between the spatial spectra occurs in (a), and the two spatial spectra can be well separated through parameters design as shown in (b).
Applsci 06 00360 g004
Figure 5. The measured sensitivity curves corresponding to the Reference Arm I and Reference Arm II.
Applsci 06 00360 g005
Figure 6. (a) The photograph of the artificial phantom of a step comprised of two blocks of sellotape. The red line is the lateral scan position on the phantom; (b,c) the cross-sectional optical coherence tomography (OCT) image of the phantom acquired with the conventional single-reference-arm approach; (d) the extended range OCT image acquired with the proposed two-reference-arm spatial frequency domain multiplexing approach. The blurry horizontal white line is the residual direct current (DC) term.
Applsci 06 00360 g006
Figure 7. Cross-sectionalOCT image of the swine adipose tissue, (a,b) acquired with the conventional single-reference-arm approach. (c) The extended range OCT image is obtained with the two-reference–arm spatial frequency domain multiplexing approach. The blurry horizontal white line is the residual DC terms. (d) A-scans at the position marked by the red arrows in (a,b) demonstrate the advantage of the ranging depth extension.
Applsci 06 00360 g007

