Article

Investigating the Influence of Plasma-Treated SiO2 Nanofillers on the Electrical Treeing Performance of Silicone-Rubber

by
Fatin Nabilah Musa
1,
Nouruddeen Bashir
1,2,*,
Mohd Hafizi Ahmad
1,
Zolkafle Buntat
1 and
Mohamed Afendi Mohamed Piah
1
1
Institute of High Voltage and High Current (IVAT), Faculty of Electrical Engineering Universiti Teknologi Malaysia, Johor Bahru 81310, Johor, Malaysia
2
Power Equipment & Electrical Machinery Development Institute (PEEMADI), P.M.B. 1029, Okene, Kogi, Nigeria
*
Author to whom correspondence should be addressed.
Appl. Sci. 2016, 6(11), 348; https://doi.org/10.3390/app6110348
Submission received: 21 August 2016 / Revised: 8 November 2016 / Accepted: 9 November 2016 / Published: 16 November 2016

Abstract

:
This study presents an investigation of electrical tree performance as well as the effect of filler concentration of silicone rubber (SiR) filled with atmospheric-pressure plasma-treated silicon dioxide (SiO2) nanofiller. Atmospheric-pressure plasma was used to treat the SiO2 nanofiller surfaces to enhance compatibility with SiR matrices. A fixed AC voltage of 10 kV, 50 Hz was applied to untreated, silane-treated, and plasma-treated nanocomposites with filler concentrations of 1, 3, and 5 wt % to investigate their electrical performance during electrical treeing. The result showed that plasma-treated SiO2 nanoparticles were uniformly well dispersed and formed strong covalent bonds with the molecules of the SiR polymer matrix. The plasma-treated nanocomposites were able to resist the electrical treeing better than the untreated or silane-treated nanocomposites. The increase in filler concentration enhanced the electrical tree performances of the nanocomposites. The result from this study reveals that the plasma-treated nanocomposites exhibited the best result in inhibiting the growth of electrical treeing compared to the existing surface treatment methods used in this study.

1. Introduction

Electrical treeing is a pre-breakdown phenomenon caused by continuous electrical stress in polymeric insulations. The growth of an electrical tree results in the creation of a conductive path between the high-voltage and grounded parts of the insulation, thus resulting in breakdown. Electrical tree activities have also been reported to occur within the areas of weak points (such as cable accessories) due to electric field localization [1]. Cable accessories such as joints, terminations, and stress cones are commonly made of silicone rubber. Thus, to enhance the silicone-rubber properties for electrical tree performance improvement, silicone rubber is usually mixed with micro-sized filler to create polymer microcomposites. In recent years, studies have shown that the use of nano-sized filler in polymer nanocomposites demonstrates improved properties compared to unfilled polymer or microcomposites [2,3,4].
However, the use of a nanofiller may result in an agglomeration of the nanofiller due to surface incompatibility between the fillers and the polymer matrices. Processing techniques of the nanofiller (such as coupling agents and the intercalation method) have been used in the past, but these techniques use chemical substances; in addition, the processes are complicated and may not be suitable for mass production. Studies have shown the positive effect of various treatment methods; silane coupling prolonged the treeing lifetime [5], improved the interfacial bond strength between the filler polymer, and decreased the void size as well as the defects at the phase interfaces [6]. However, some researchers have reported that silane coupling did not change the tree inception voltage, which results in the faster propagation of electrical treeing [7,8].
Atmospheric-pressure plasma treatment was introduced recently to treat nanofillers. Plasma discharges are environmentally friendly and non-toxic. This treatment was able to enhance the compatibility and the characteristics of the interface between the nanofiller and polymer matrices [9,10]. While many studies on electrical tree characteristics in silicone rubber and silicone-rubber nanocomposites have been conducted [11,12,13,14], comprehensive research on electrical tree performance characteristics of silicone rubber mixed with plasma-treated nanoparticles is still lacking. In addition, previous studies have used glow discharges to treat the surface of the nanoparticles; these discharges are difficult to generate at atmospheric pressure conditions.
In light of the above, this study presents a comprehensive investigation of the electrical tree performance of silicone-rubber-based nanocomposites filled with SiO2 nanoparticles that have been treated with filamentary plasma discharges under atmospheric pressure. The plasma-treated SiO2 nanoparticles and the nanocomposites were characterized using X-ray photoelectron spectroscopy (XPS), field emission scanning electron microscopy (FESEM), and energy dispersive X-ray spectroscopy (EDX), respectively.

2. Sample Preparation

2.1. Base Material and Nanofiller

In this study, silicone rubber was used as the base material. The silicone rubber used was transparent Sylgard 184 silicone elastomer with a dielectric strength of 24 kV/mm, tensile strength of 6.2 MPa, tear strength of 2.7 kN/m, and low viscosity. The hardener used was dimethyl, methylhydrogen siloxane. The material was purchased from Dow Corning and was used as received. The nanofiller used was fumed silica (SiO2), with an average size of 12 nm and average pore of 4 nm, supplied by Sigma Aldrich.

2.2. Silicone-Rubber Nanocomposites

Prior to nanocomposite preparation, leaf-like specimens for the electrical tree tests were prepared. The arrangement was a point-to-plane electrode arrangement consisting of a tungsten needle with a tip radius of 5 ± 1 µm. More details on leaf-like specimen preparation can be found in [7,15]. The preparation of the nanocomposites consisted of three conditions: untreated, silane-treated, and plasma-treated nanocomposites. For each treatment, three different nanofiller loadings were considered, 1%, 3%, and 5% for the preparation of the nanocomposites.
To prepare an untreated nanocomposite with 1% nanofiller loading, the nanosilica filler was weighed using an analytical balance to ensure that it was 1% of the total weight of the specimen (nanocomposite); then mixed with silicone rubber. The nanocomposites were then mixed using a magnetic stirrer for one hour. After the dispersion process had been completed, the nanocomposites were dispersed using an ultrasonicator to obtain a homogeneous dispersion of the nanofiller. After the sonication process, the nanocomposites were mixed with their hardener in the ratio of 10:1 (i.e., ten parts silicone-rubber nanocomposites to one part hardener) for 30 min at 1000 rpm. The nanocomposites were then degassed using a vacuum oven to remove any air bubbles produced within the nanocomposites during the mixing process. This degasification process was performed for 25 min at 35 °C. The nanocomposites were cast on the leaf-like specimen in order to form nanocomposites with a thickness of 15 mm. The specimen was then cured at 100 °C for 45 min in a vacuum oven. For the preparation of 3% and 5% untreated nanocomposite, the aforementioned steps were repeated with nanocomposites having nanofiller weighing 3% and 5% of the nanocomposite, respectively. The processes were repeated for silane-treated and plasma-treated nanocomposites.

2.3. Nanocomposite Treatment

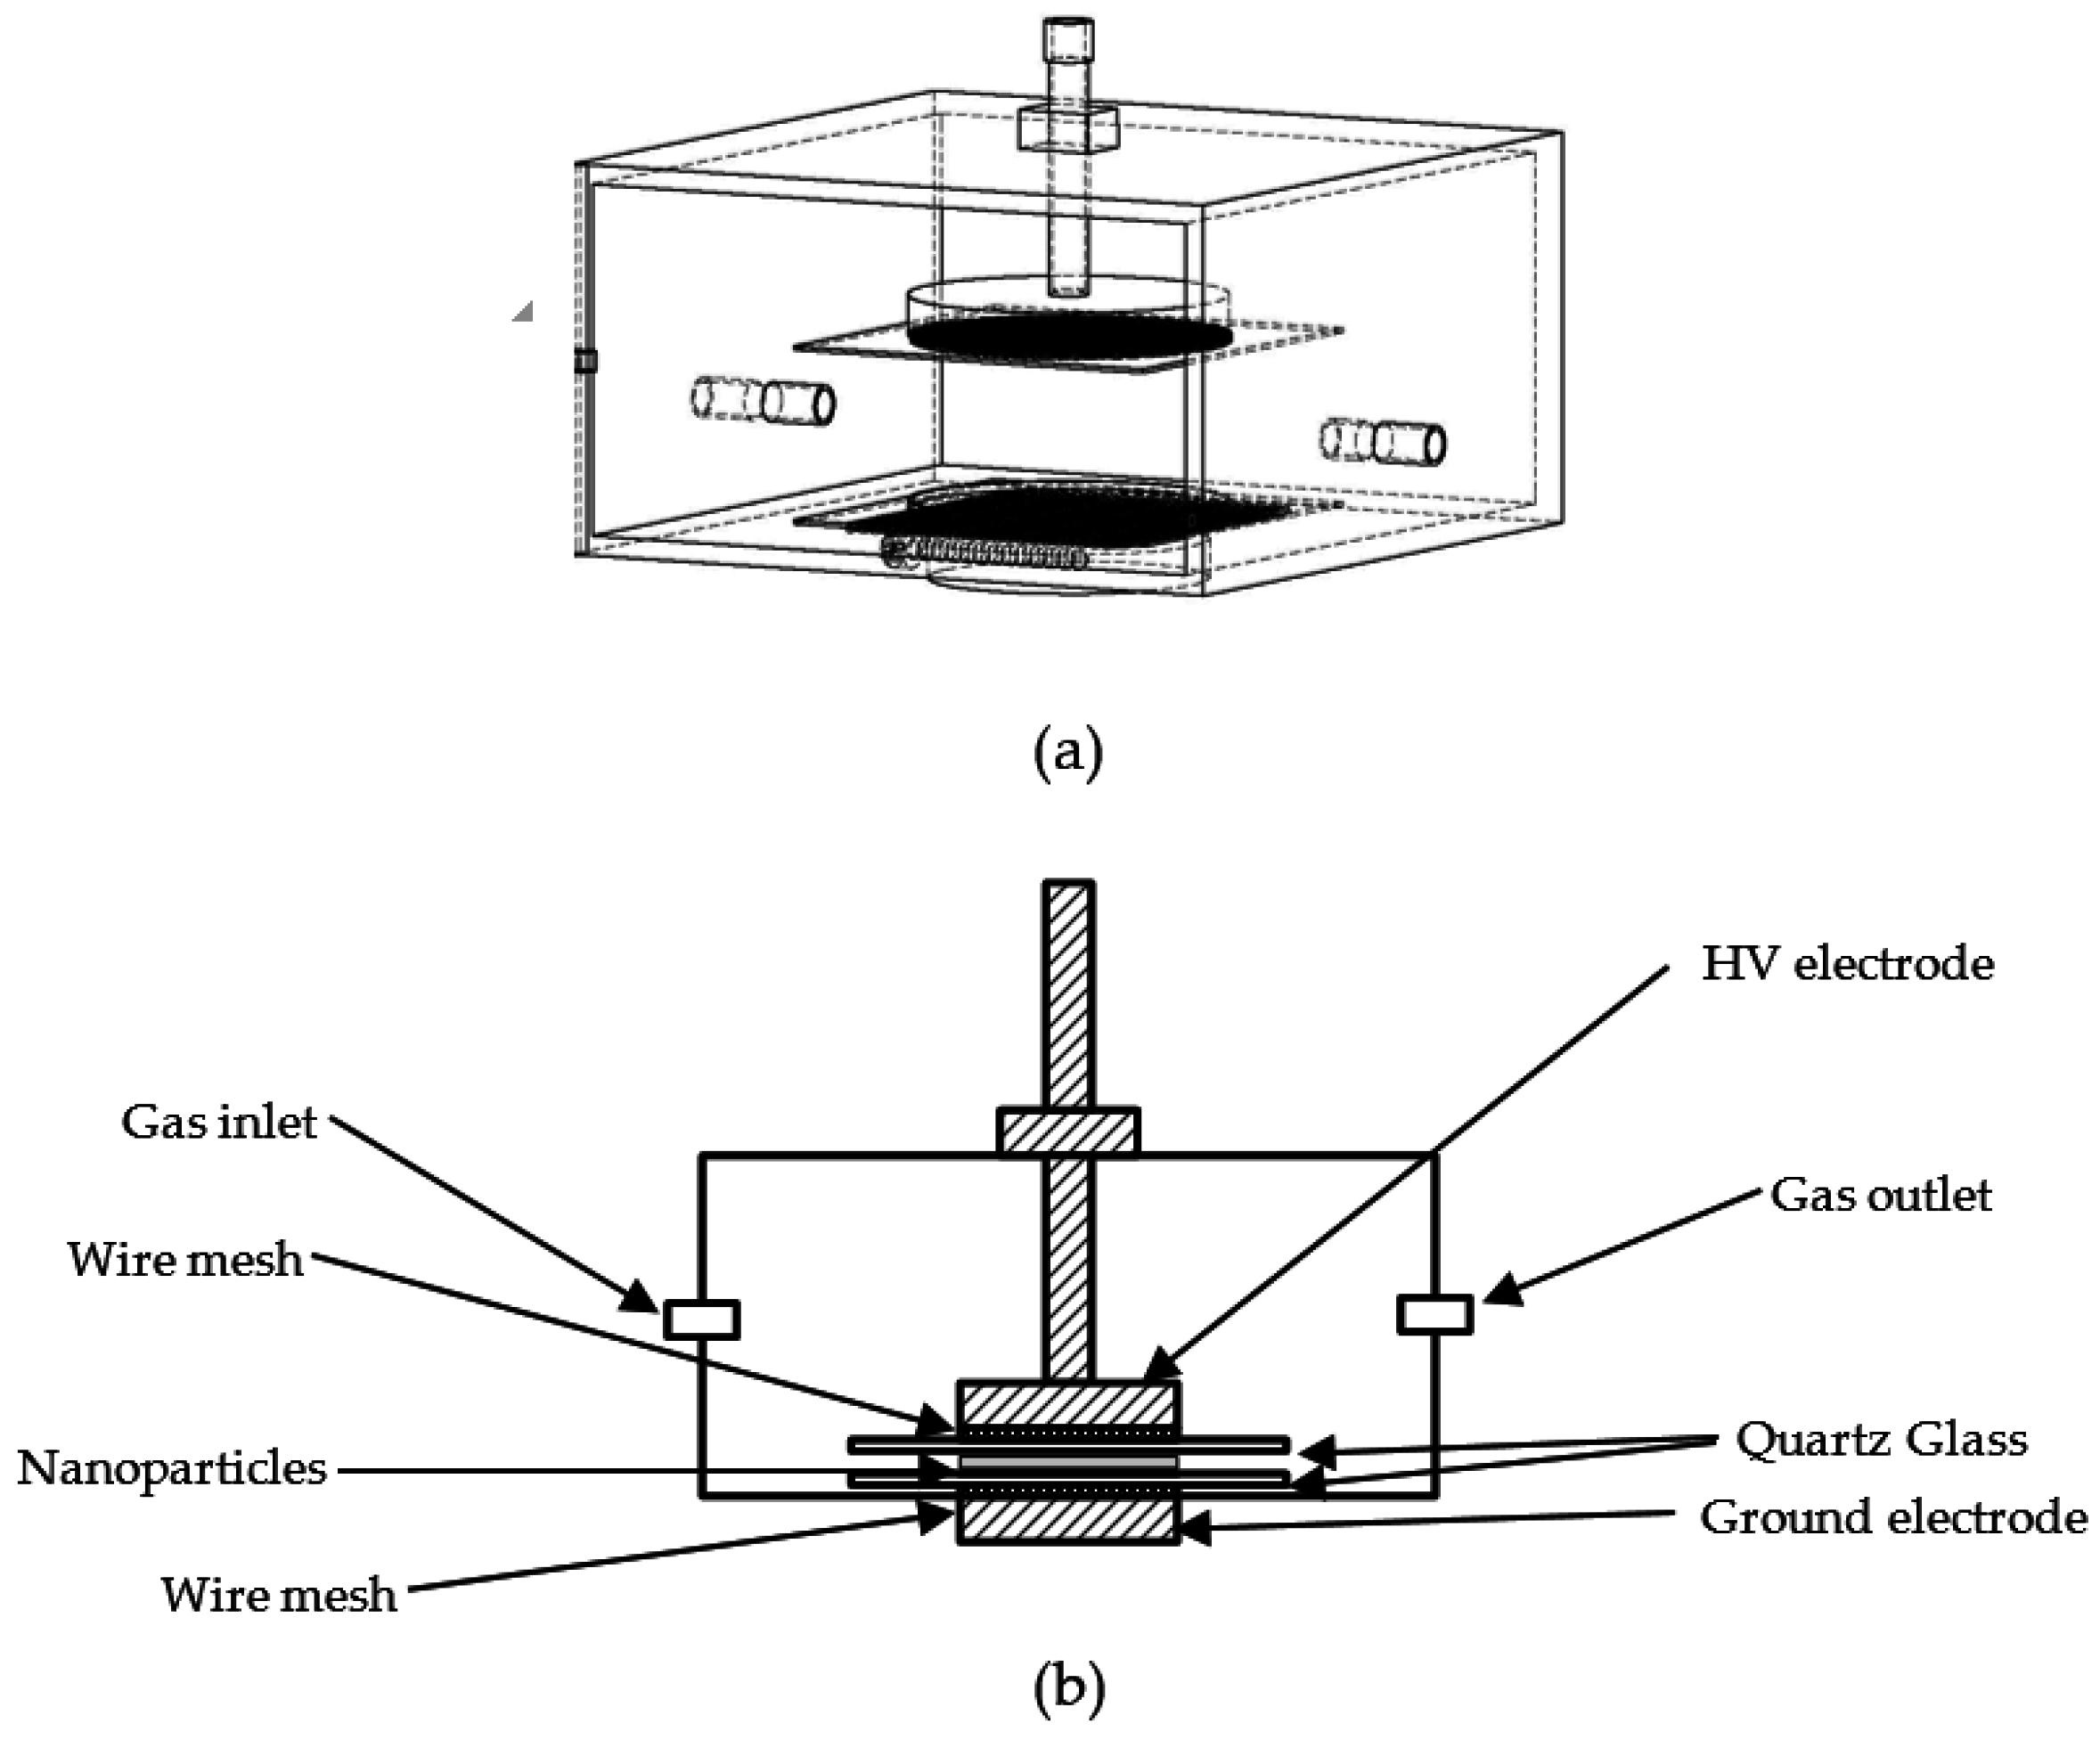
2.3.1. Atmospheric-Pressure Plasma Treatment

The plasma treatment of the nanoparticles was done in a plasma chamber. The dimension of the plasma chamber was 180 mm × 180 mm × 100 mm, using plane-to-plane configuration. A cylindrical, 90 mm × 10 mm diameter stainless-steel electrode was attached with fine steel mesh wire. A 1 mm quartz glass acted as the dielectric barrier to avoid flashover. The same arrangement was applied to the other side of the chamber to form the dielectric barrier discharge (DBD) configuration. The gap spacing was kept constant at 3 mm using a glass spacer. A voltage between 1 to 15 kV at a frequency of 500 Hz was used to supply the plasma chamber; the other electrode was grounded. Helium gas with a flow rate between 1 to 3 lpm was used to control the discharge gas. A 240/15,000 V, 5 mA step-up transformer provided the AC high voltage to the electrode. Figure 1 shows a schematic diagram of the atmospheric plasma test cell, and Figure 2 shows the experimental arrangement for the treatment of the nanoparticles with plasma in the plasma chamber.
The generated plasma discharge used to treat the nanoparticles was filamentary discharge. The plasma discharge was characterized using voltage-current and Lissajous figures (voltage-charge) waveform. The flow of the helium gas and the applied voltage were both controlled so as to maintain the power of the filamentary discharge between 9 to 15 W at a 3 mm working gap. This was to ensure better plasma treatment of the SiO2 nanoparticles. Previous studies have reported 10 W as a good discharge power for plasma treatment [10].
The nanofiller was treated for 5 min and then stirred for 30 s. This process was repeated six times, resulting in a total treatment time of 30 min. This treatment process was conducted in order to achieve a homogenous and uniform plasma treatment of the nanofiller.

2.3.2. Silane Treatment

To treat the nanocomposites with silane, 3-(trimethoxysilyl) propyl methacrylate with 96% purity was used as the silane coupling agent. The silane solution was prepared using 4% silane and ethanol as solvent. The silica nanoparticles were then added to the silane solution was stirred using Fisher Scientific Isotemp Hot Plate Stirrer at 30 °C for 1 h to make sure the silane solution mixed well with the nanoparticles. The mixture was then dried at 100 °C for 24 h to hydrolyze the alcohol from the nanoparticles. After the drying process, the lump silane SiO2 was crushed and filtered in order to get smooth and nano-sized particles [16].

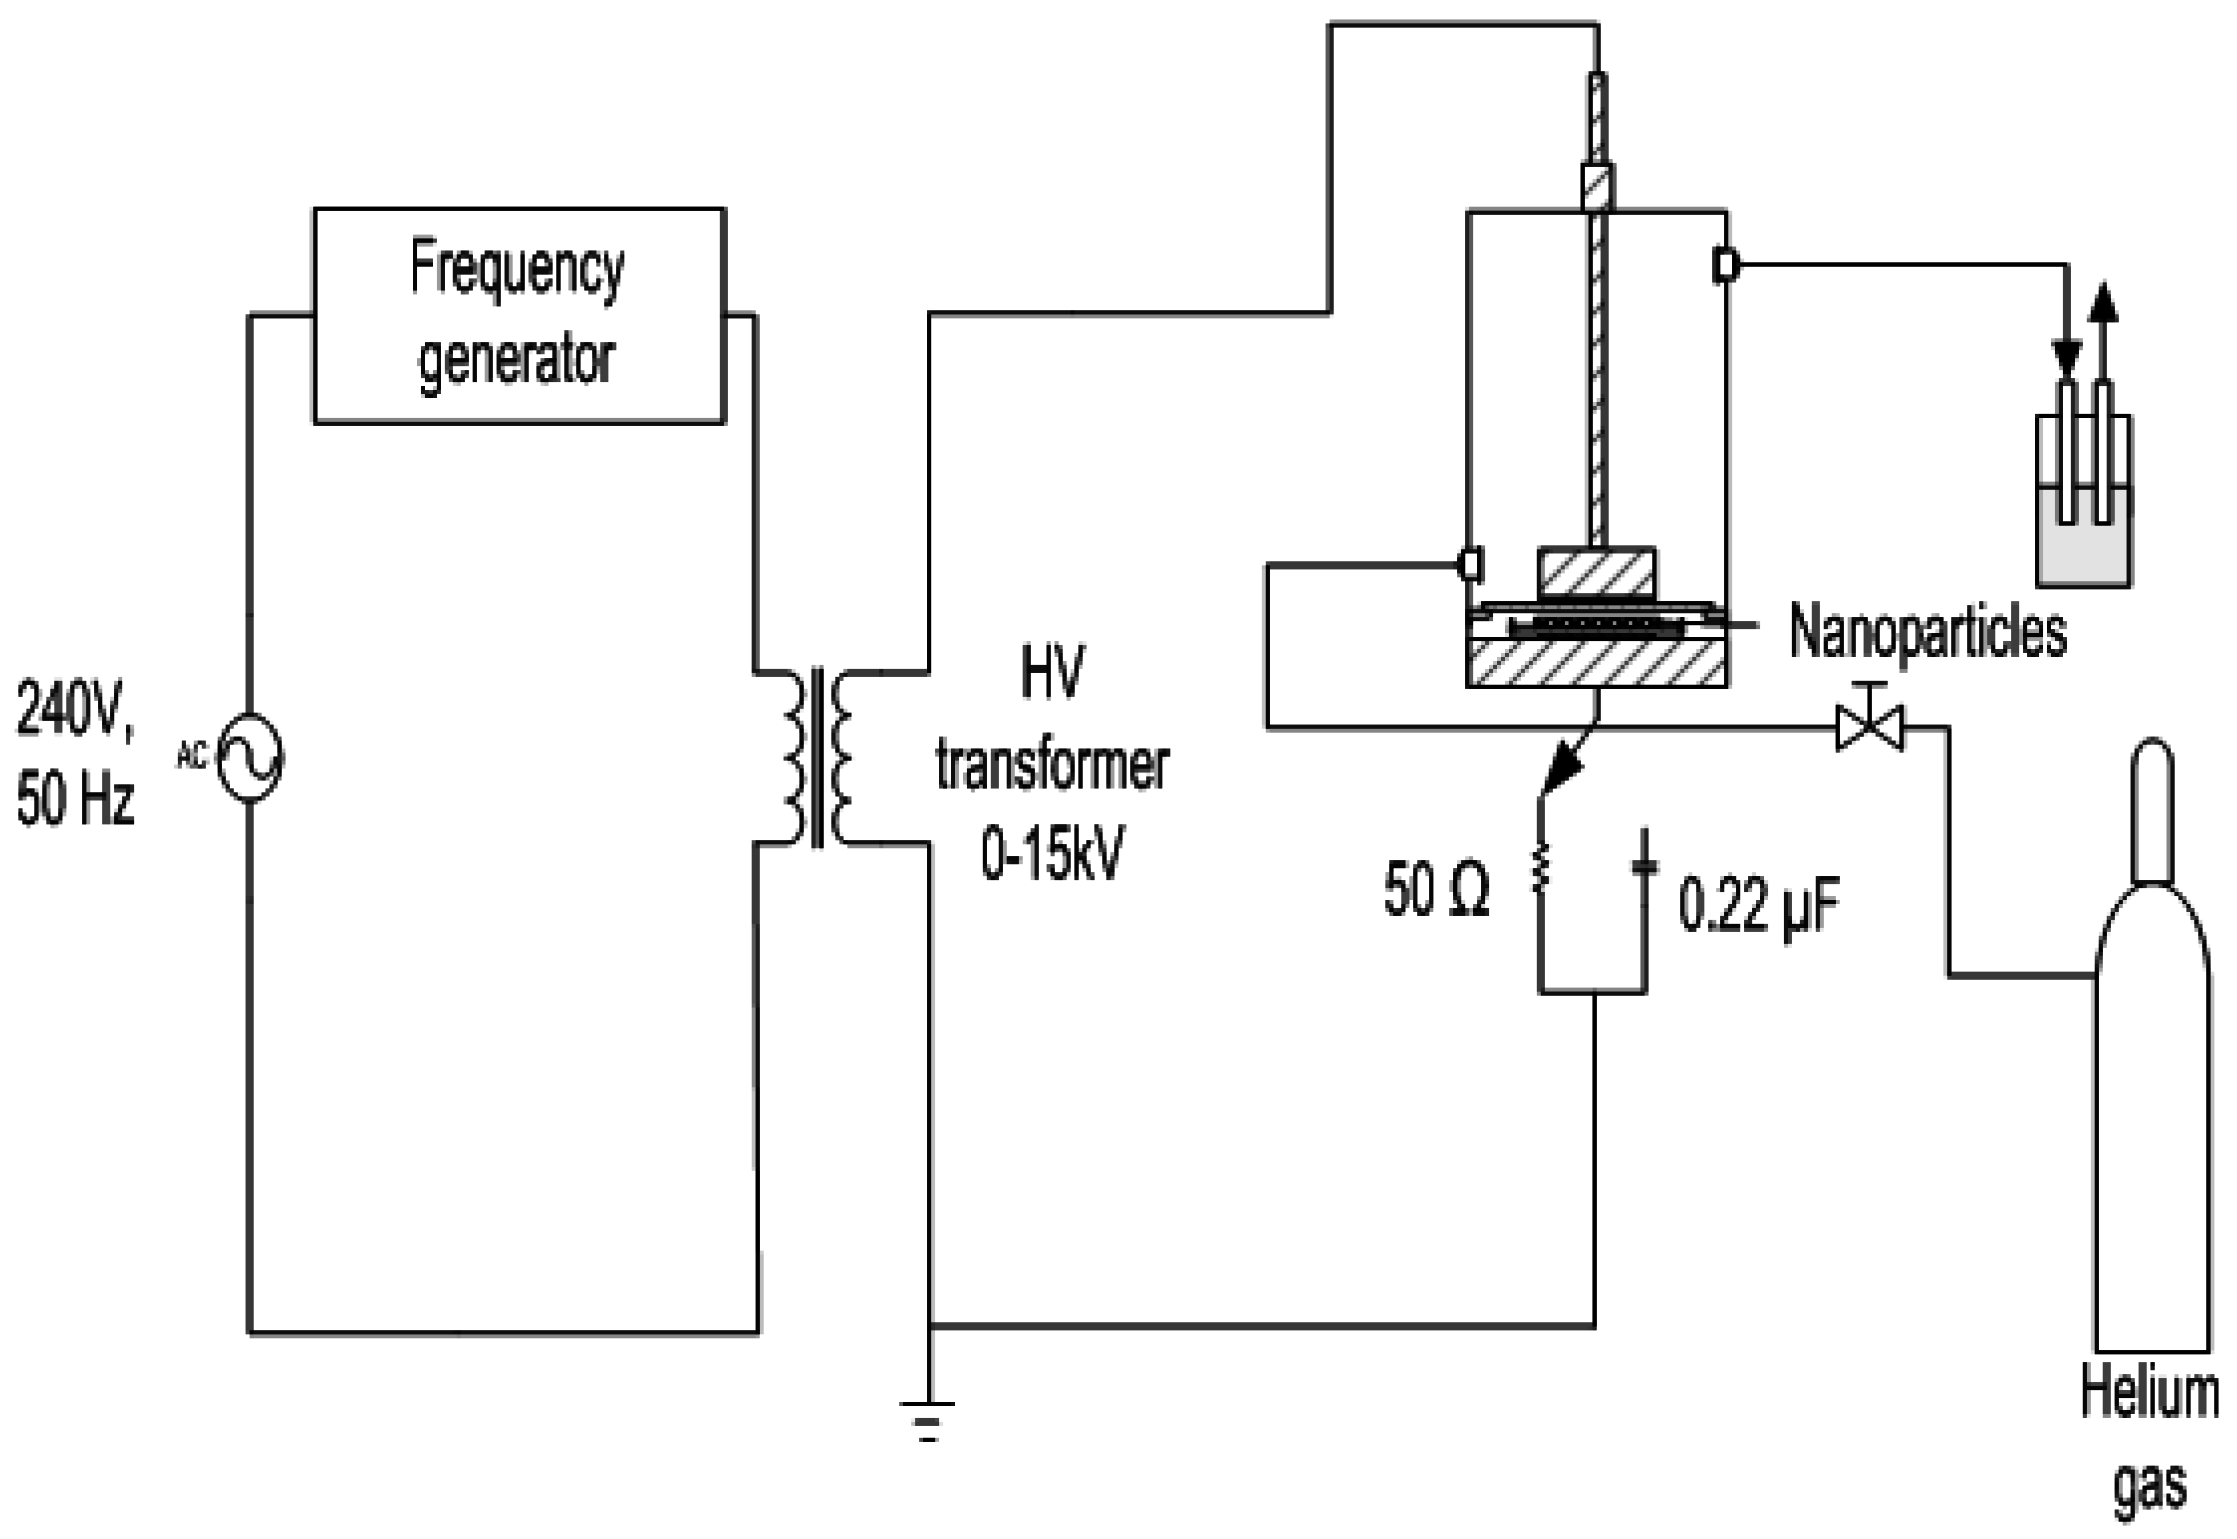
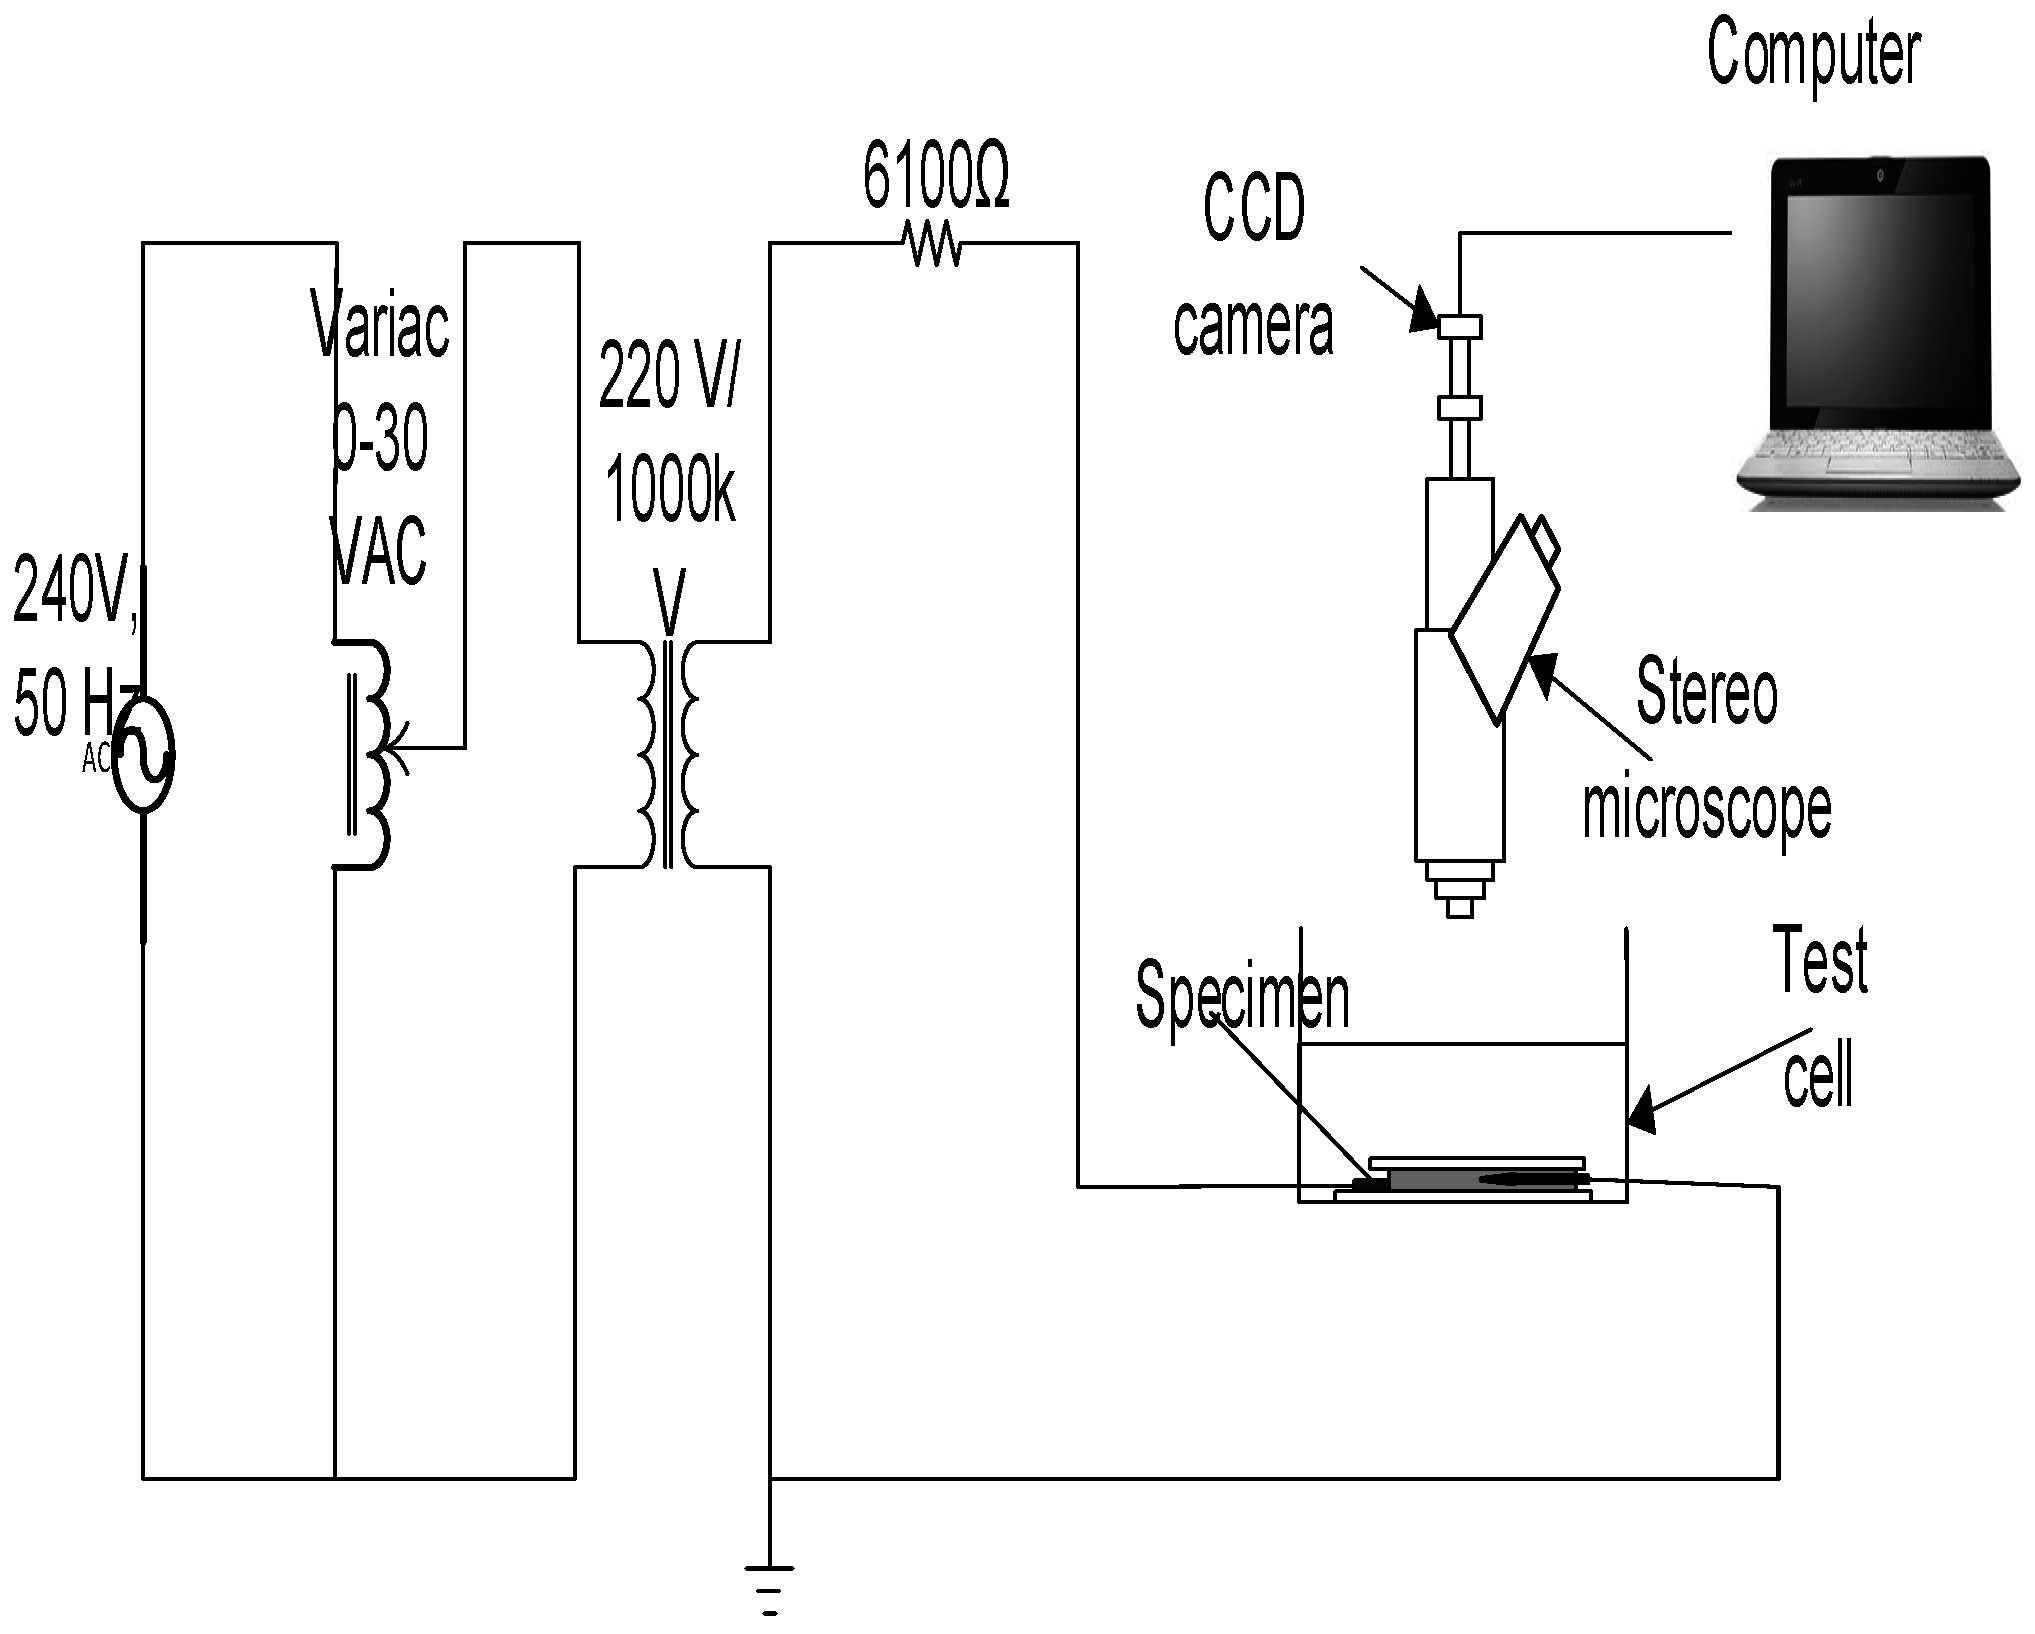
3. Experimental Set-up

Electrical Treeing Test

The schematic diagram of the experimental setup for conducting studies on electrical treeing is shown in Figure 3. The experiments were conducted to observe the growth of the electrical tree in 1, 3, and 5 wt % filler loading of directly mixed nanocomposites (DMNC), silane-treated nanocomposites (STNC), and plasma-treated nanocomposites (PTNC). The DMNC, STNC, and PTNC specimens were subjected to a fixed voltage of 10 ± 0.6 kVrms at 50 Hz. The samples were placed inside an acrylic cell containing silicone oil to prevent surface flashover. All tests were carried out at room temperature of 30 ± 4 °C and 50% ± 10% relative humidity. A set of ten samples for each condition were tested to consider the reproducibility of the electrical tree characteristics.
Tree inception and propagation were continuously observed via a setup that consisted of an SZX16 Olympus research stereomicroscope (Olympus, Singapore), a DP 26 Olympus CCD camera (Olympus, Singapore), and a computer; the microscope and the CCD camera were interfaced to the computer for tree images capturing. The effect of the nanofiller on the tree breakdown of the nanocomposites were studied by measuring the tree and breakdown time. A comparative study was carried out by comparing the existing treatment method and the plasma-treated nanofiller filled with SiR to compare the tree-suppression efficiency and effectiveness between DMNC, STNC, and PTNC.

4. Results and Discussion

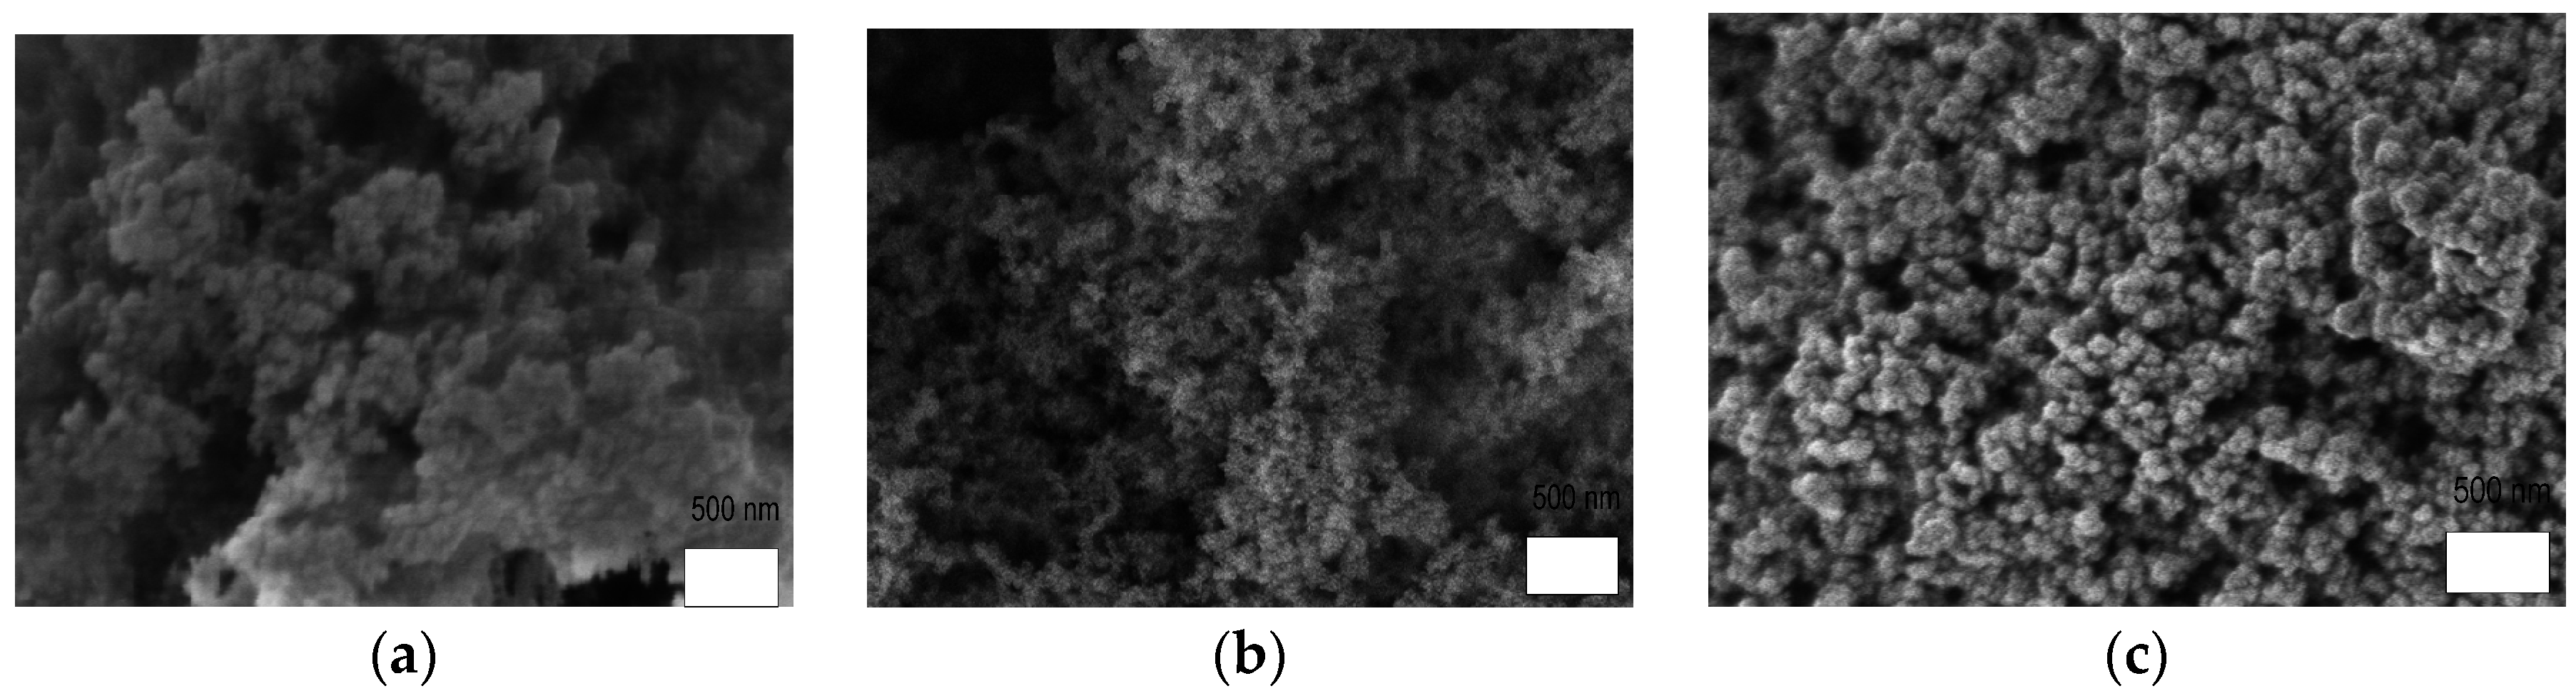
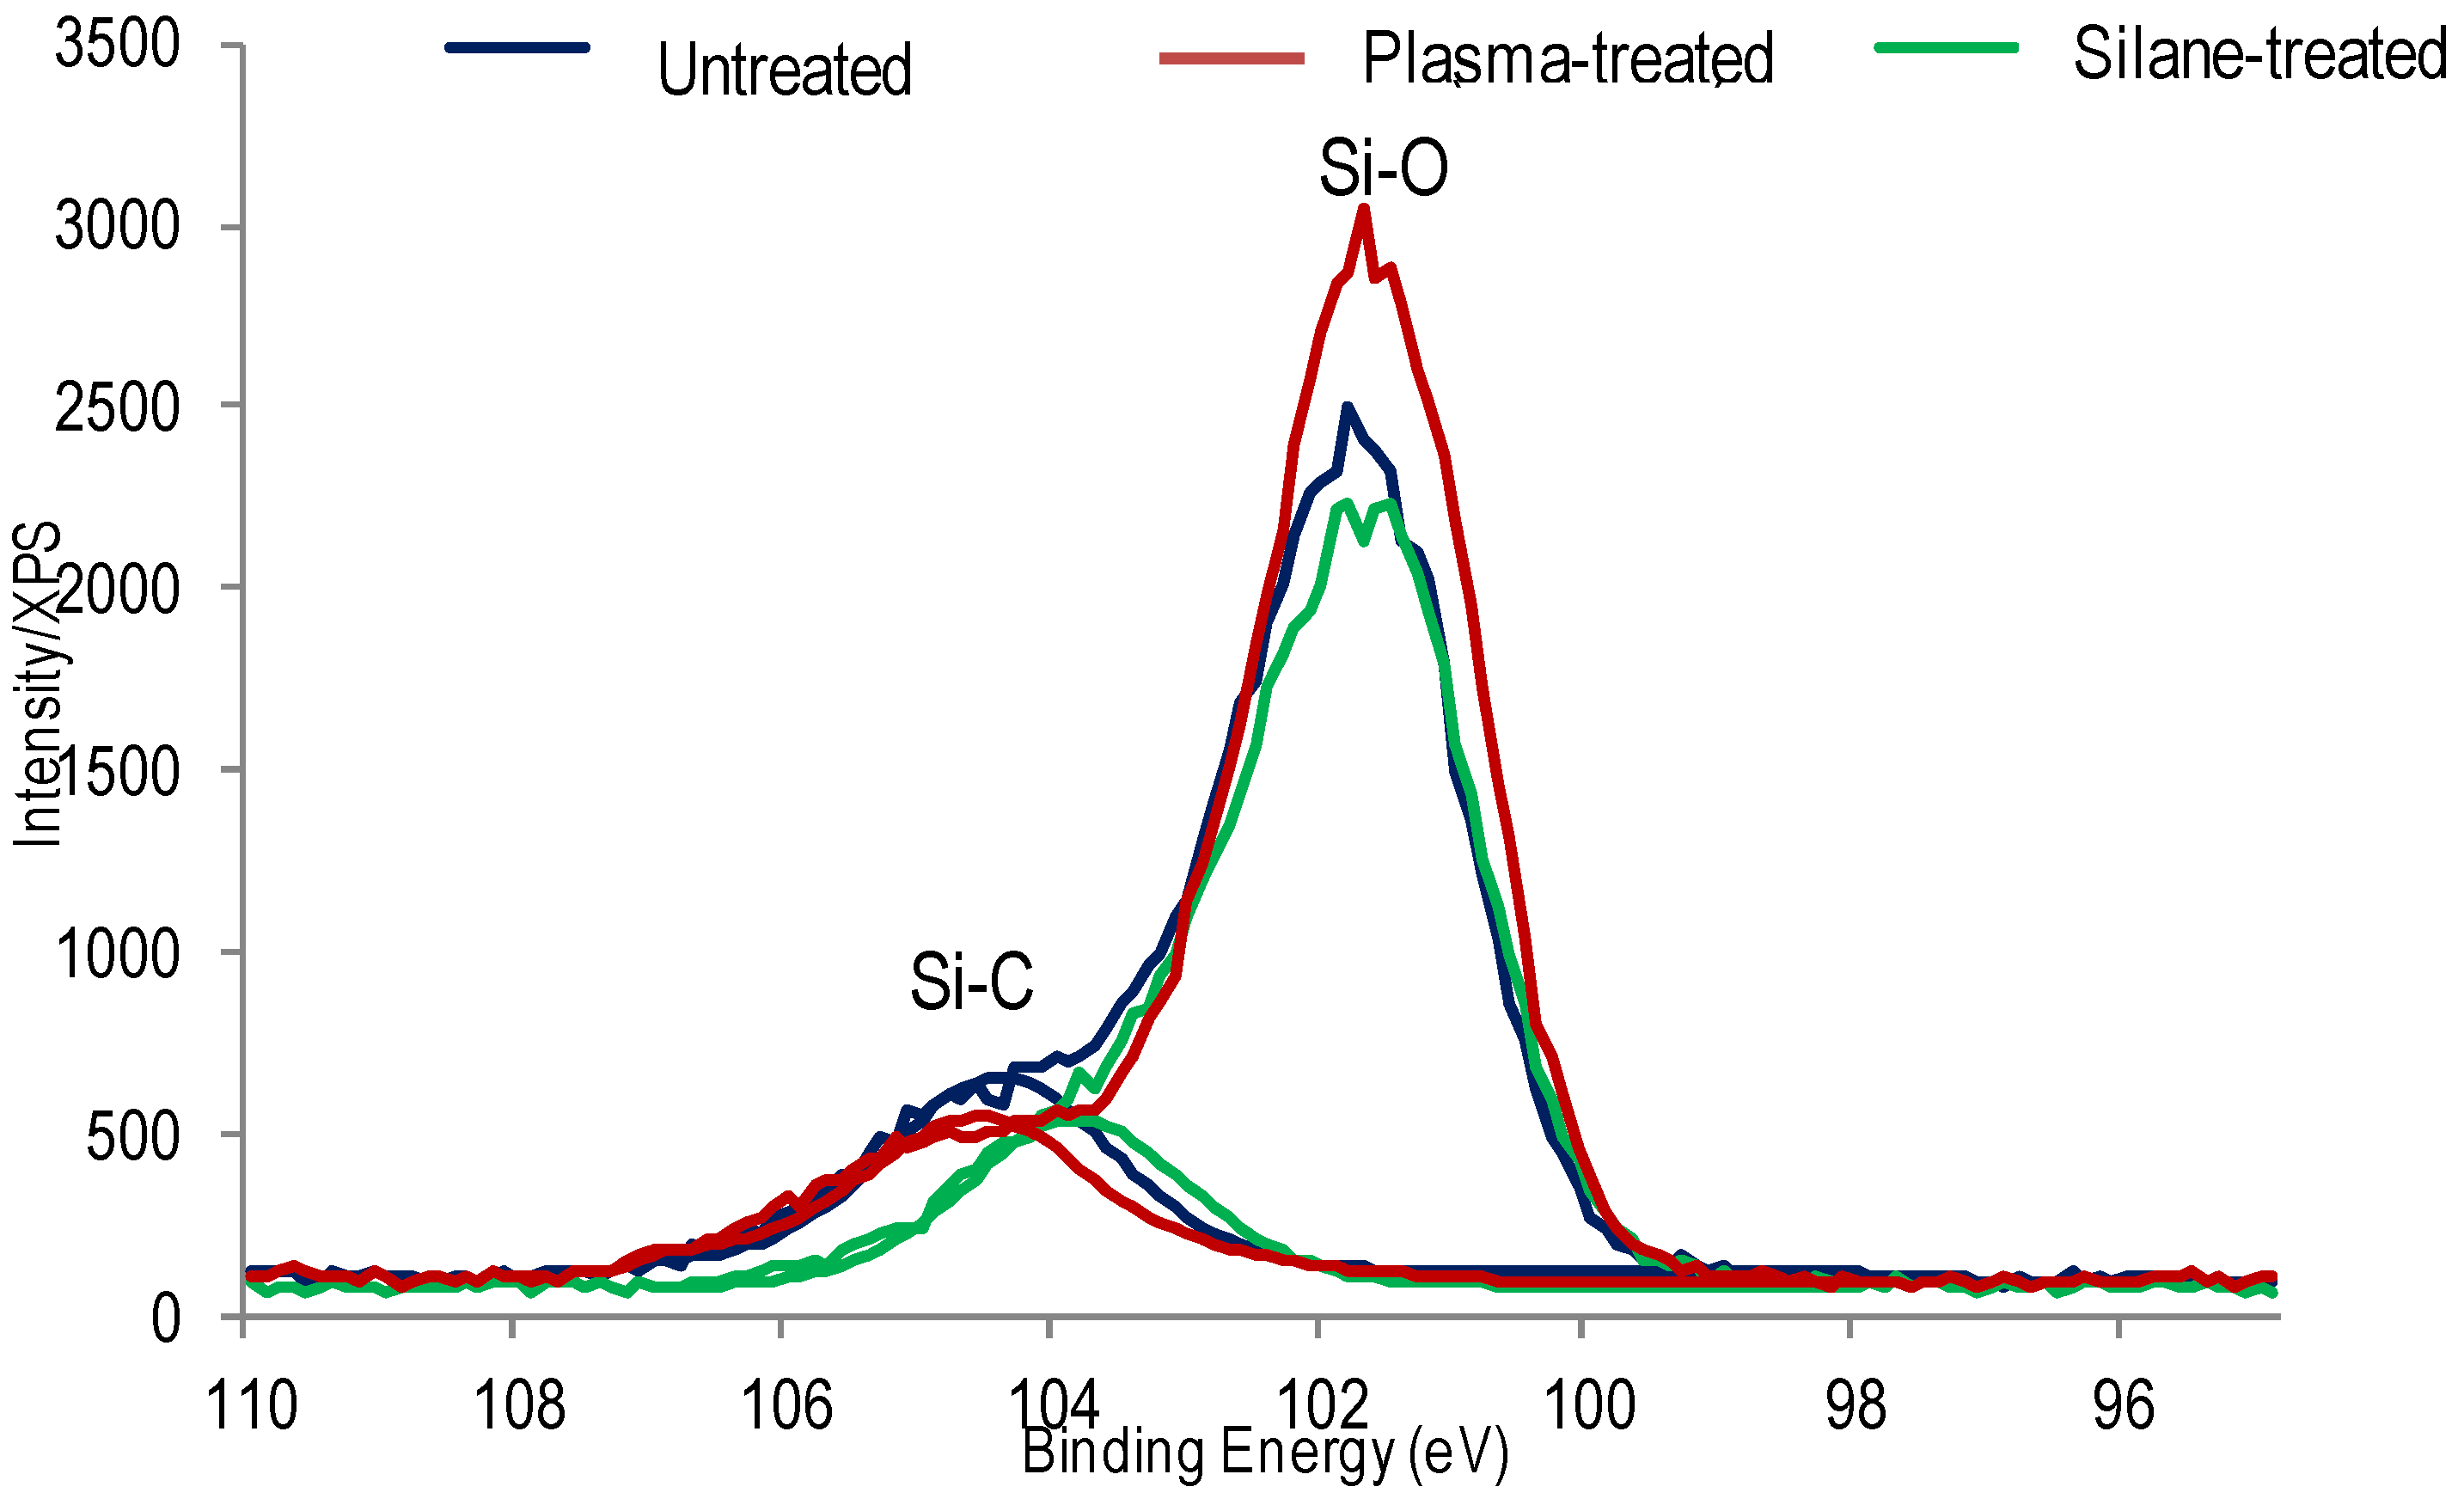
4.1. Morphological Analyses of the Plasma-Treated SiO2 Nanofillers

The morphological analysis of the SiO2 nanoparticles before and after chemical modification using silane coupling and electrical treatment using atmospheric-pressure plasma discharges were characterized using FESEM and EDX. In addition, XPS analysis was conducted to observe the atomic concentration and binding energy of the nanoparticles.
The overall XPS showed that the nanoparticles contained C 1s, O 1s, and Si 2p peaks. The XPS spectra of the untreated, silane-treated, and plasma-treated nanoparticles are shown in Figure 4. We can see that the Si 2p spectrum has shifted from a higher binding energy (BE) of the untreated nanoparticles to a lower BE after the silane and plasma treatments. For the silane-treated nanoparticles the shift in BE was significant, while for the plasma-treated nanoparticles the shift was slight (in fact, insignificant).
From Figure 4, we can also see the intensity of the Si-O bonds. The intensity increased in the plasma-treated nanoparticles, while it decreased in the silane-treated particles. The discharge at atmospheric pressure involves oxygen atoms, which tend to become attached to Si and C atoms. The increase in the intensity of the Si-O bond after plasma treatment implies that a reaction of the oxygen atoms with the Si atoms took place during the plasma-treatment process. Table 1 shows the binding energy and concentrations of the nanoparticles.
The SiO2 nanoparticles consisted of Si-O and Si-C bonds for the untreated, silane-treated, and plasma-treated nanoparticles as shown in Table 1. The plasma discharge contained many active species that led to the formation of radicals. The recombination of radicals also resulted in a reduction of the surface-charging effect of the nanoparticles. As a result, this reduction led to a shift to lower BE; the lower BE was a result of the addition of oxidized atoms that increased the interaction when mixed with the polymer base. The plasma discharges also resulted in surface oxidation due to the oxygen atoms’ attachment to the C and Si atoms within the nanoparticles. Further O atoms attaching to Si atoms resulted in an increase in the concentration of Si-O bonds [17].
Figure 5 shows FESEM micrographs of the nanoparticles before and after the treatment. We can see that the untreated nanoparticles are porous, with an irregular surface structure. This type of structure led to the accumulation and trapping of static charges, thus resulting in agglomeration; the particles were attracted to one another via static charges on the particles’ surfaces. Figure 5b,c show the FESEM images of the silane-treated and plasma-treated nanosilica (SiO2), respectively. From the figures, we can see that both the silane-treated and plasma-treated nanoparticles had relatively smoother and more homogenous surfaces compared to the untreated samples. Compared to the silane-treated nanoparticles, the plasma-treated nanoparticles seem to have had a more uniform, smoother surface due to the plasma coating of the nanoparticles’ surfaces, with less nanoparticle accumulation.
The plasma treatment of the nanoparticles affected the surface of the nanoparticles. The plasma treatment enhanced surface compatibility, reduced agglomeration, altered the interfaces, and increased the surface area of the nanoparticles. These actions resulted in a strengthening of the bonding and adhesion at the interfaces of the nanoparticles and polymer matrices. The lower-agglomeration nanoparticles offered larger surface areas, which had a significant impact when the nanoparticles came into contact with the polymer matrices.
The nanoparticles were then characterized using EDX to observe the changes in their chemical composition after the treatment. Table 2 shows quantitative atomic percentage concentrations of the nanoparticles after treatment. We can see that after both the silane and plasma treatments, their oxygen (O) content increased, while their silicon (Si) content decreased. The O content in the sample increased from 44.80% for the untreated samples to 48.08% after silane treatment and 47.60% after plasma treatment.
The plasma treatment for surface modification of the nanoparticles consisted of the interaction process of plasma discharge and the surface of the nanoparticles. The plasma discharge involved many active species, such as ions, electrons, and photons, the bombardment of which led to the formation of radicals. The recombination of radicals resulted in a surface morphology change in the nanoparticles. During the discharge, however, some of the active species reacted with oxygen-containing radicals. As a result, the process increased the uptake of oxygen. This increase in O content after the plasma treatment indicates that surface oxidation due to the discharge had occurred. This result is in agreement with research by Fang et al. [16], who showed that plasma treatment introduced more oxygen-containing groups than other treatments. The higher O content led to a hydrophilic surface area that enhanced the bonding of the nanofiller and polymer matrices. In this current study, surface compatibility between the silicone rubber and the hydrophilic nanofiller (silica) was achieved, thereby altering the interaction zones (interfacial area) between the silicone-rubber matrices and the nanofiller and, thus, increasing the strength of the filler-matrix interaction. Besides, C content showed a significant increase while Si content decreased after silane treatment. This is due to the silane coupling agent which is 3-(trimethoxysilyl)propyl methacrylate (H2C=C(CH3)CO2(CH2)3Si(OCH3)3) with alkyl chains attached to the nanoparticle surfaces. The coupling agent altered the chemical content of the SiO2 nanoparticles.

4.2. Influence of Plasma-Treated SiO2 Nanofillers on Silicone-Rubber Nanocomposite

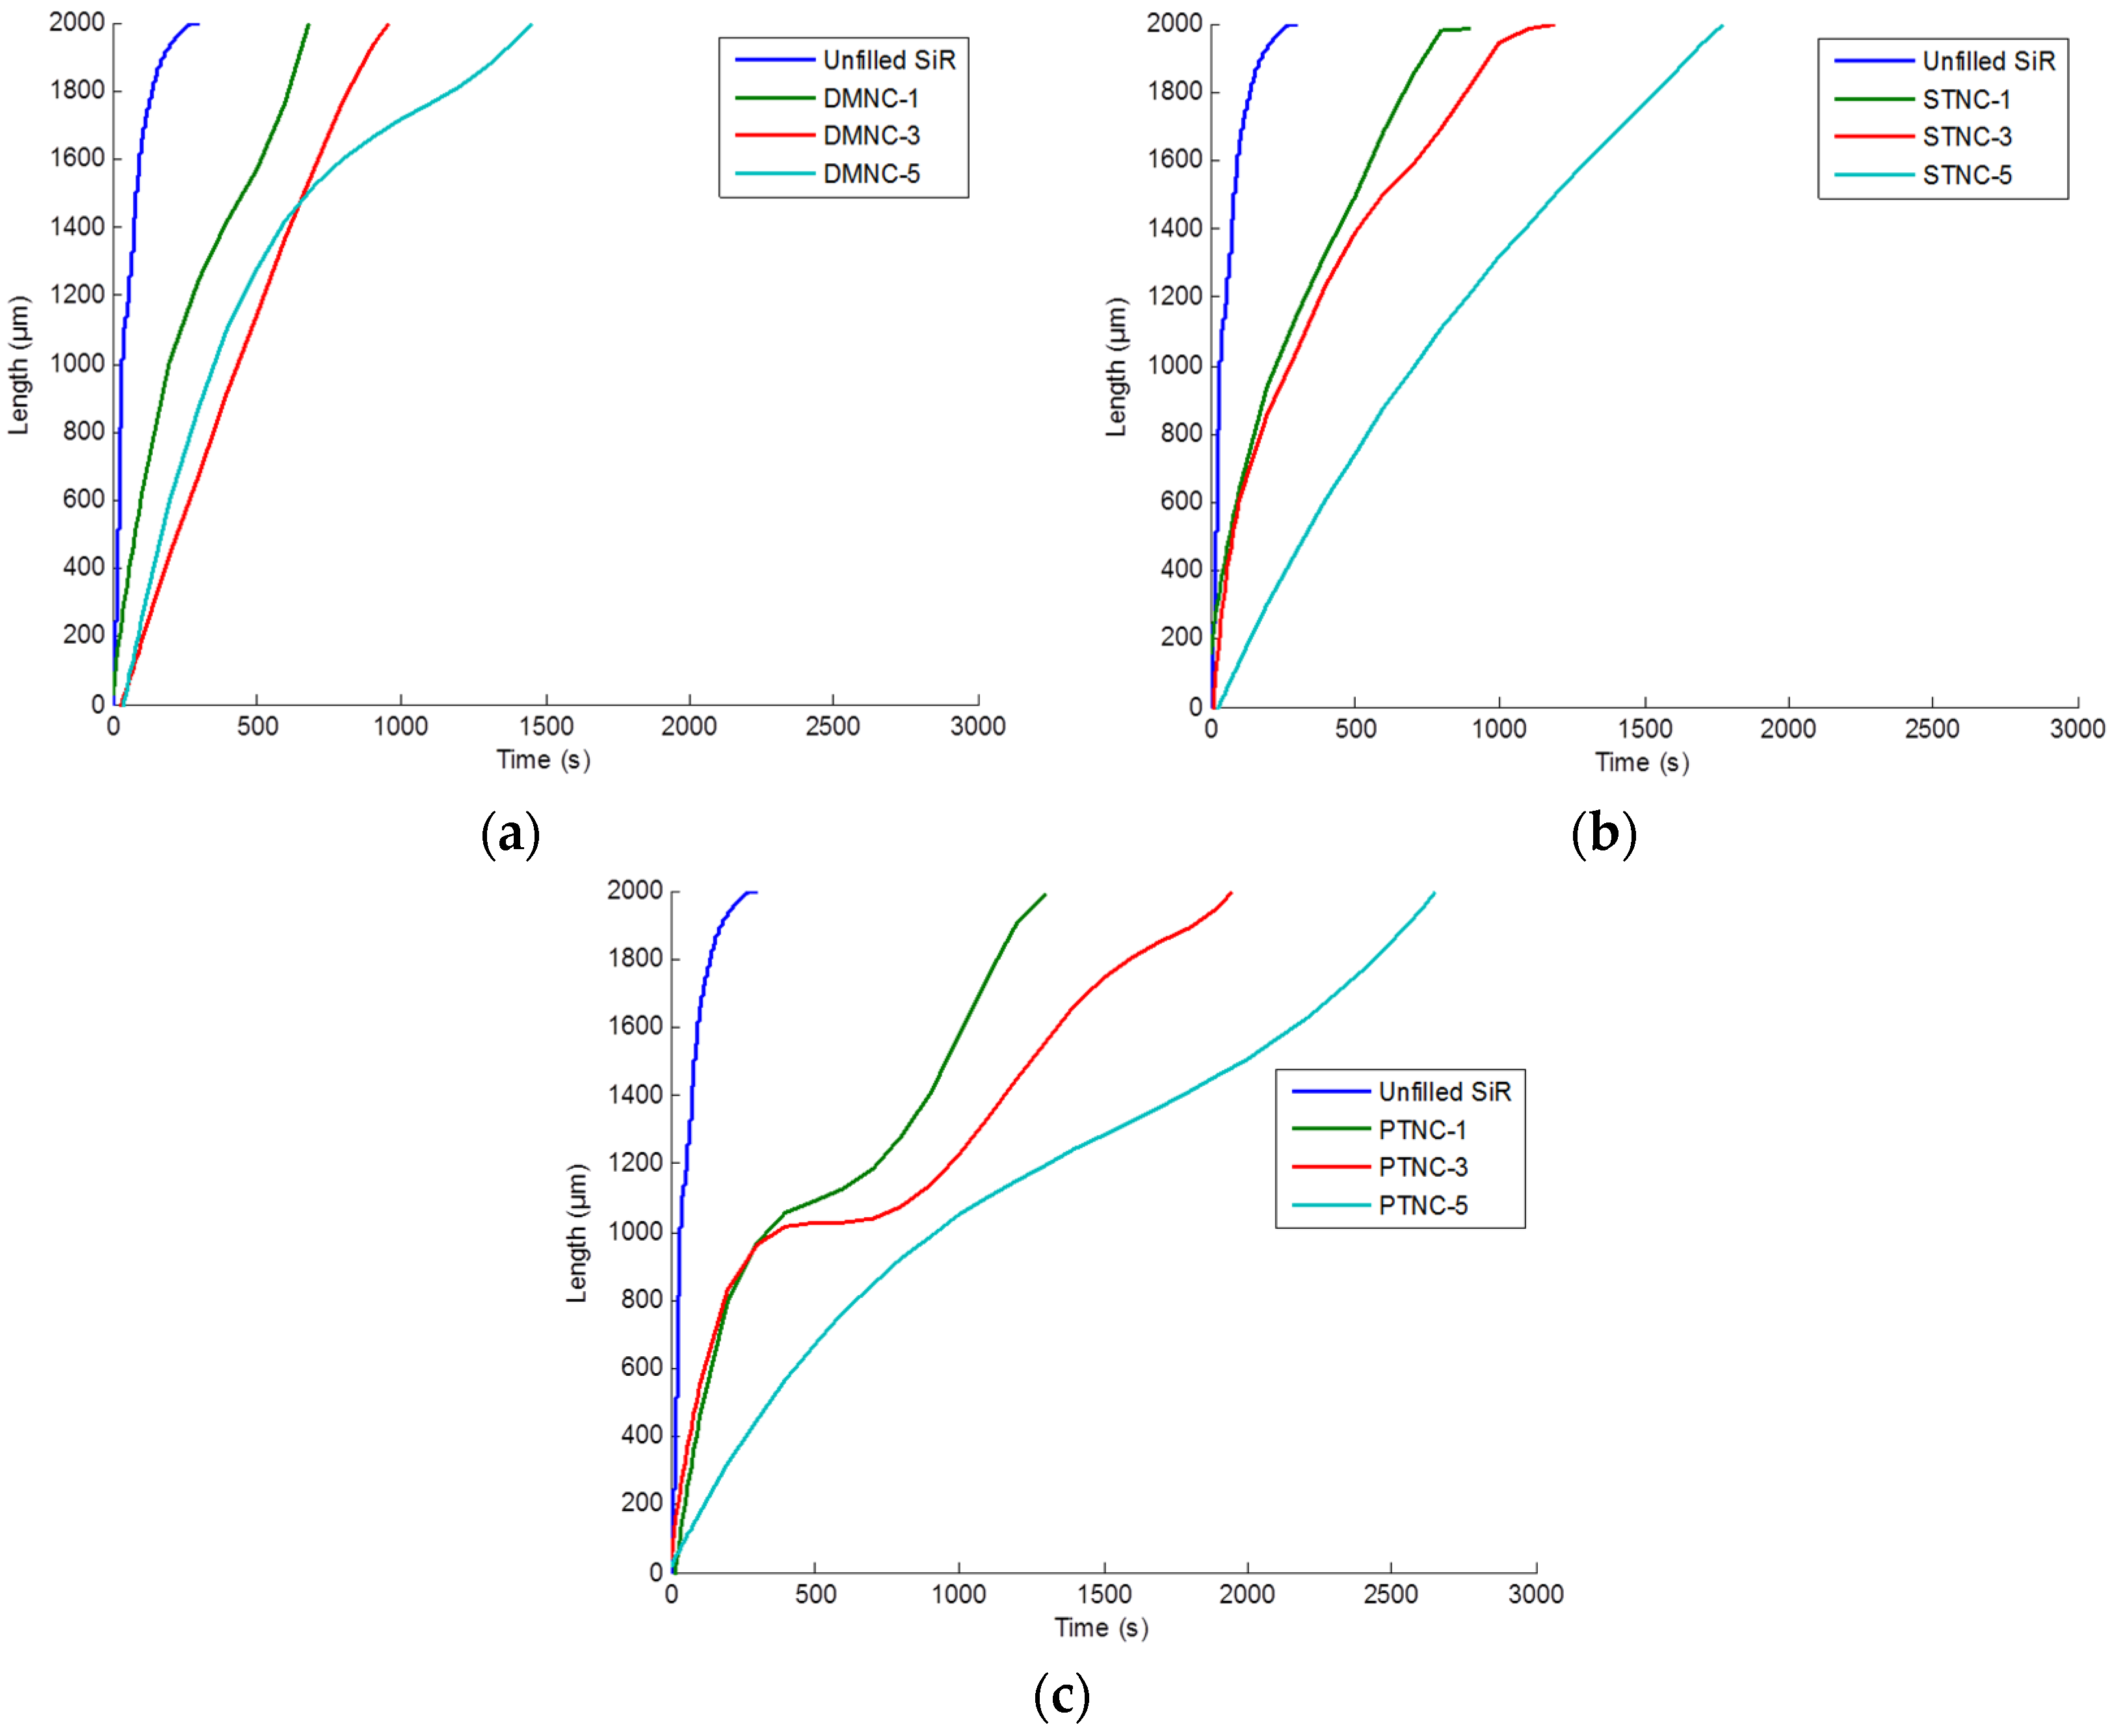
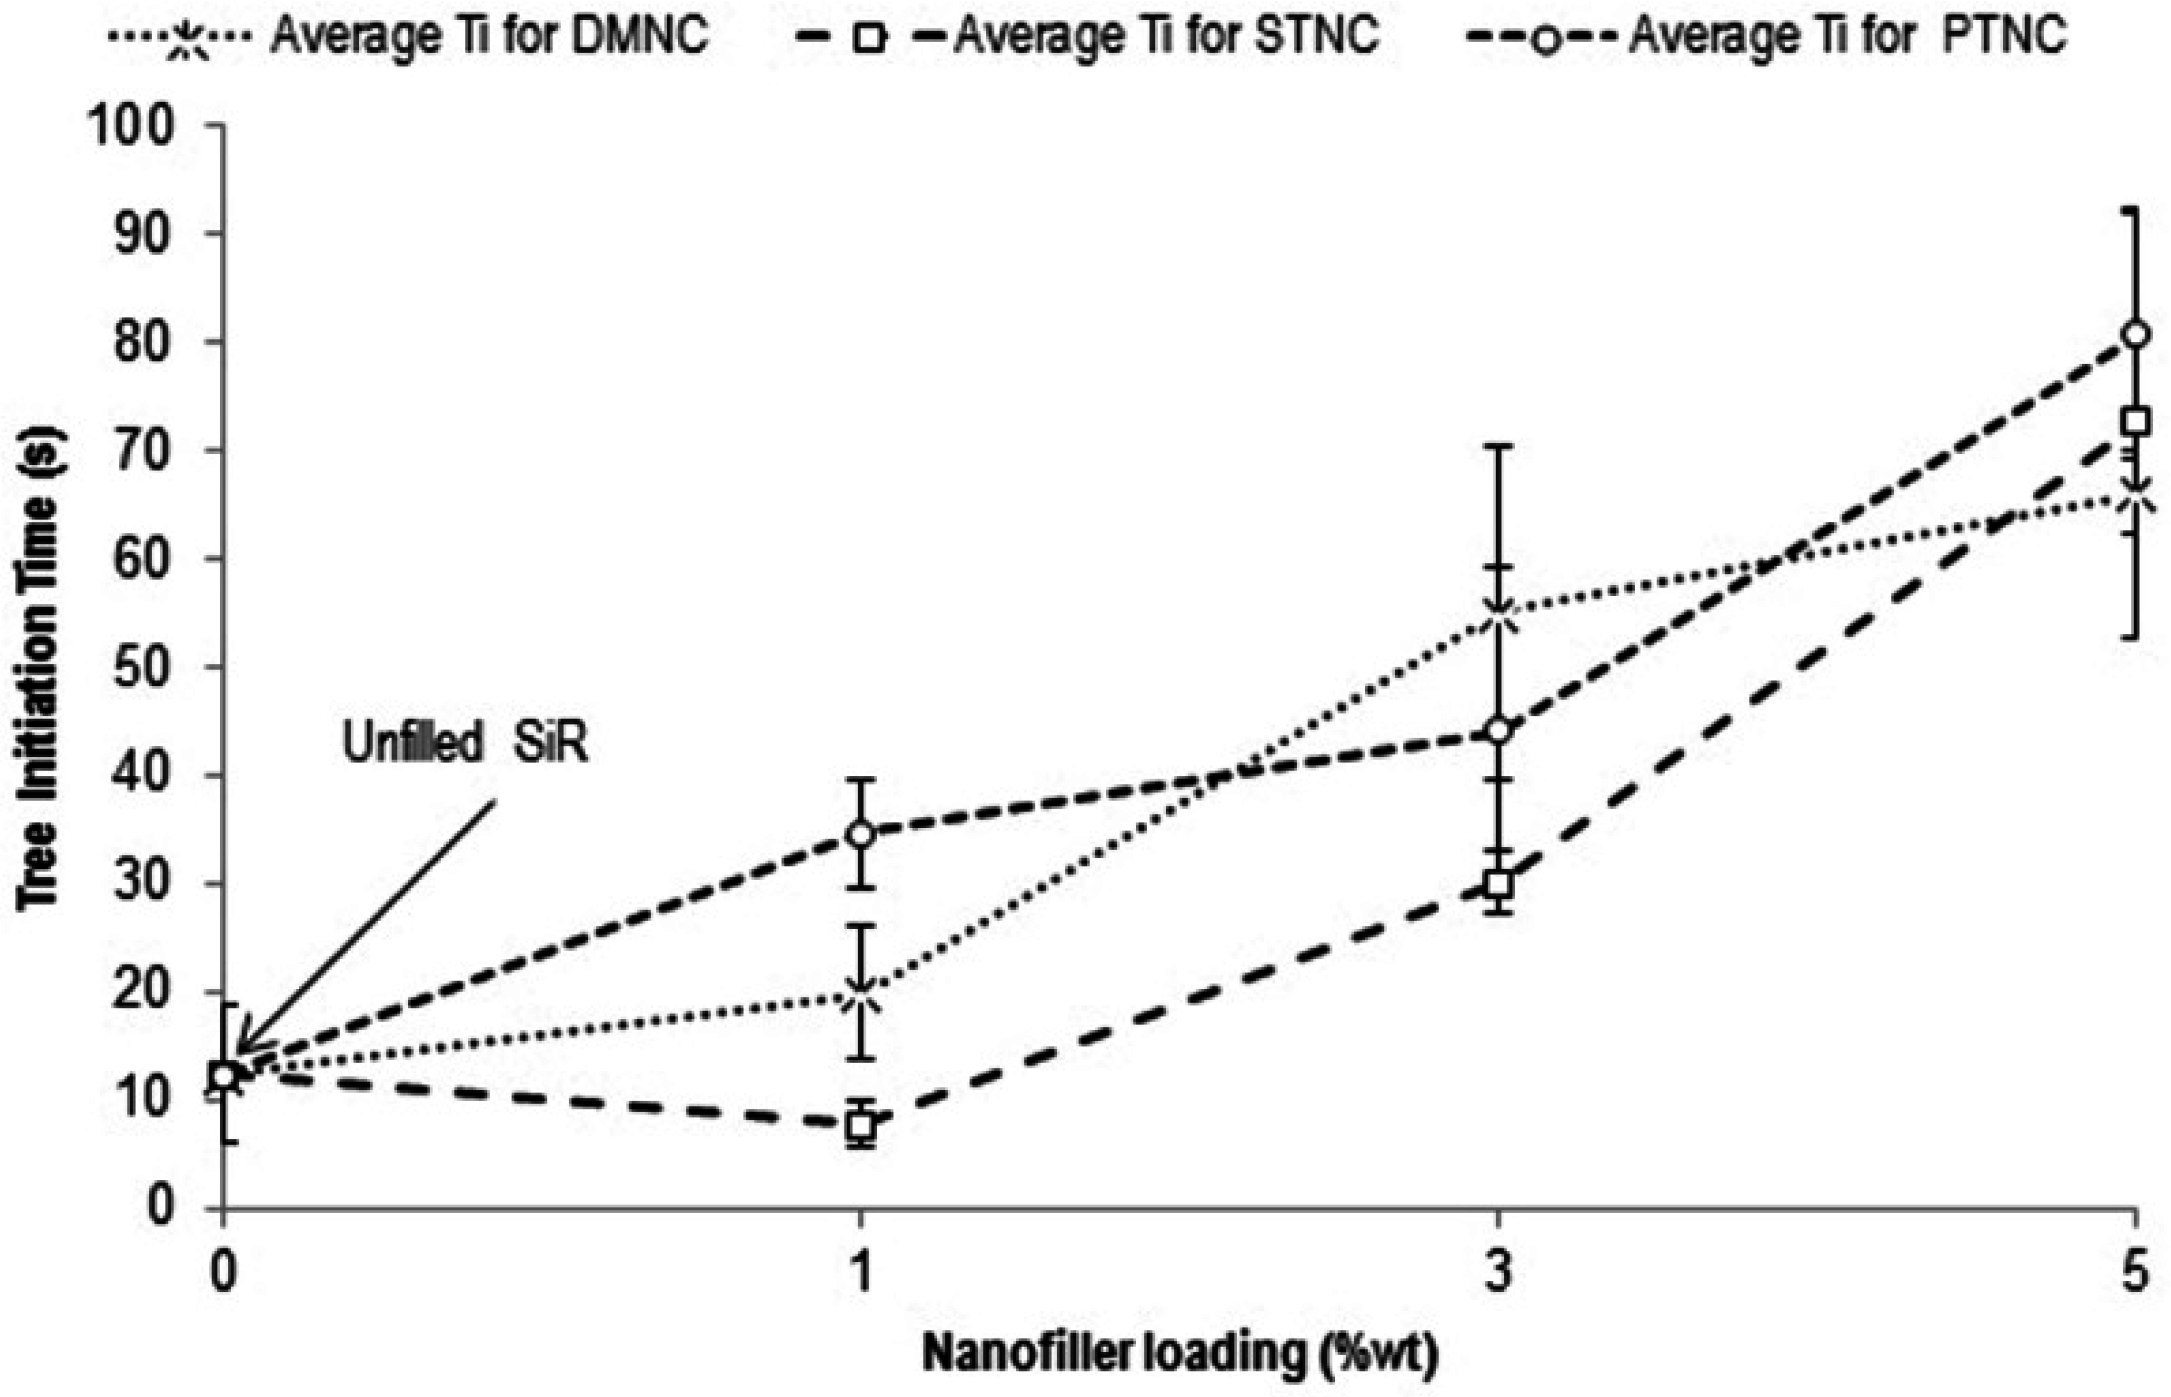
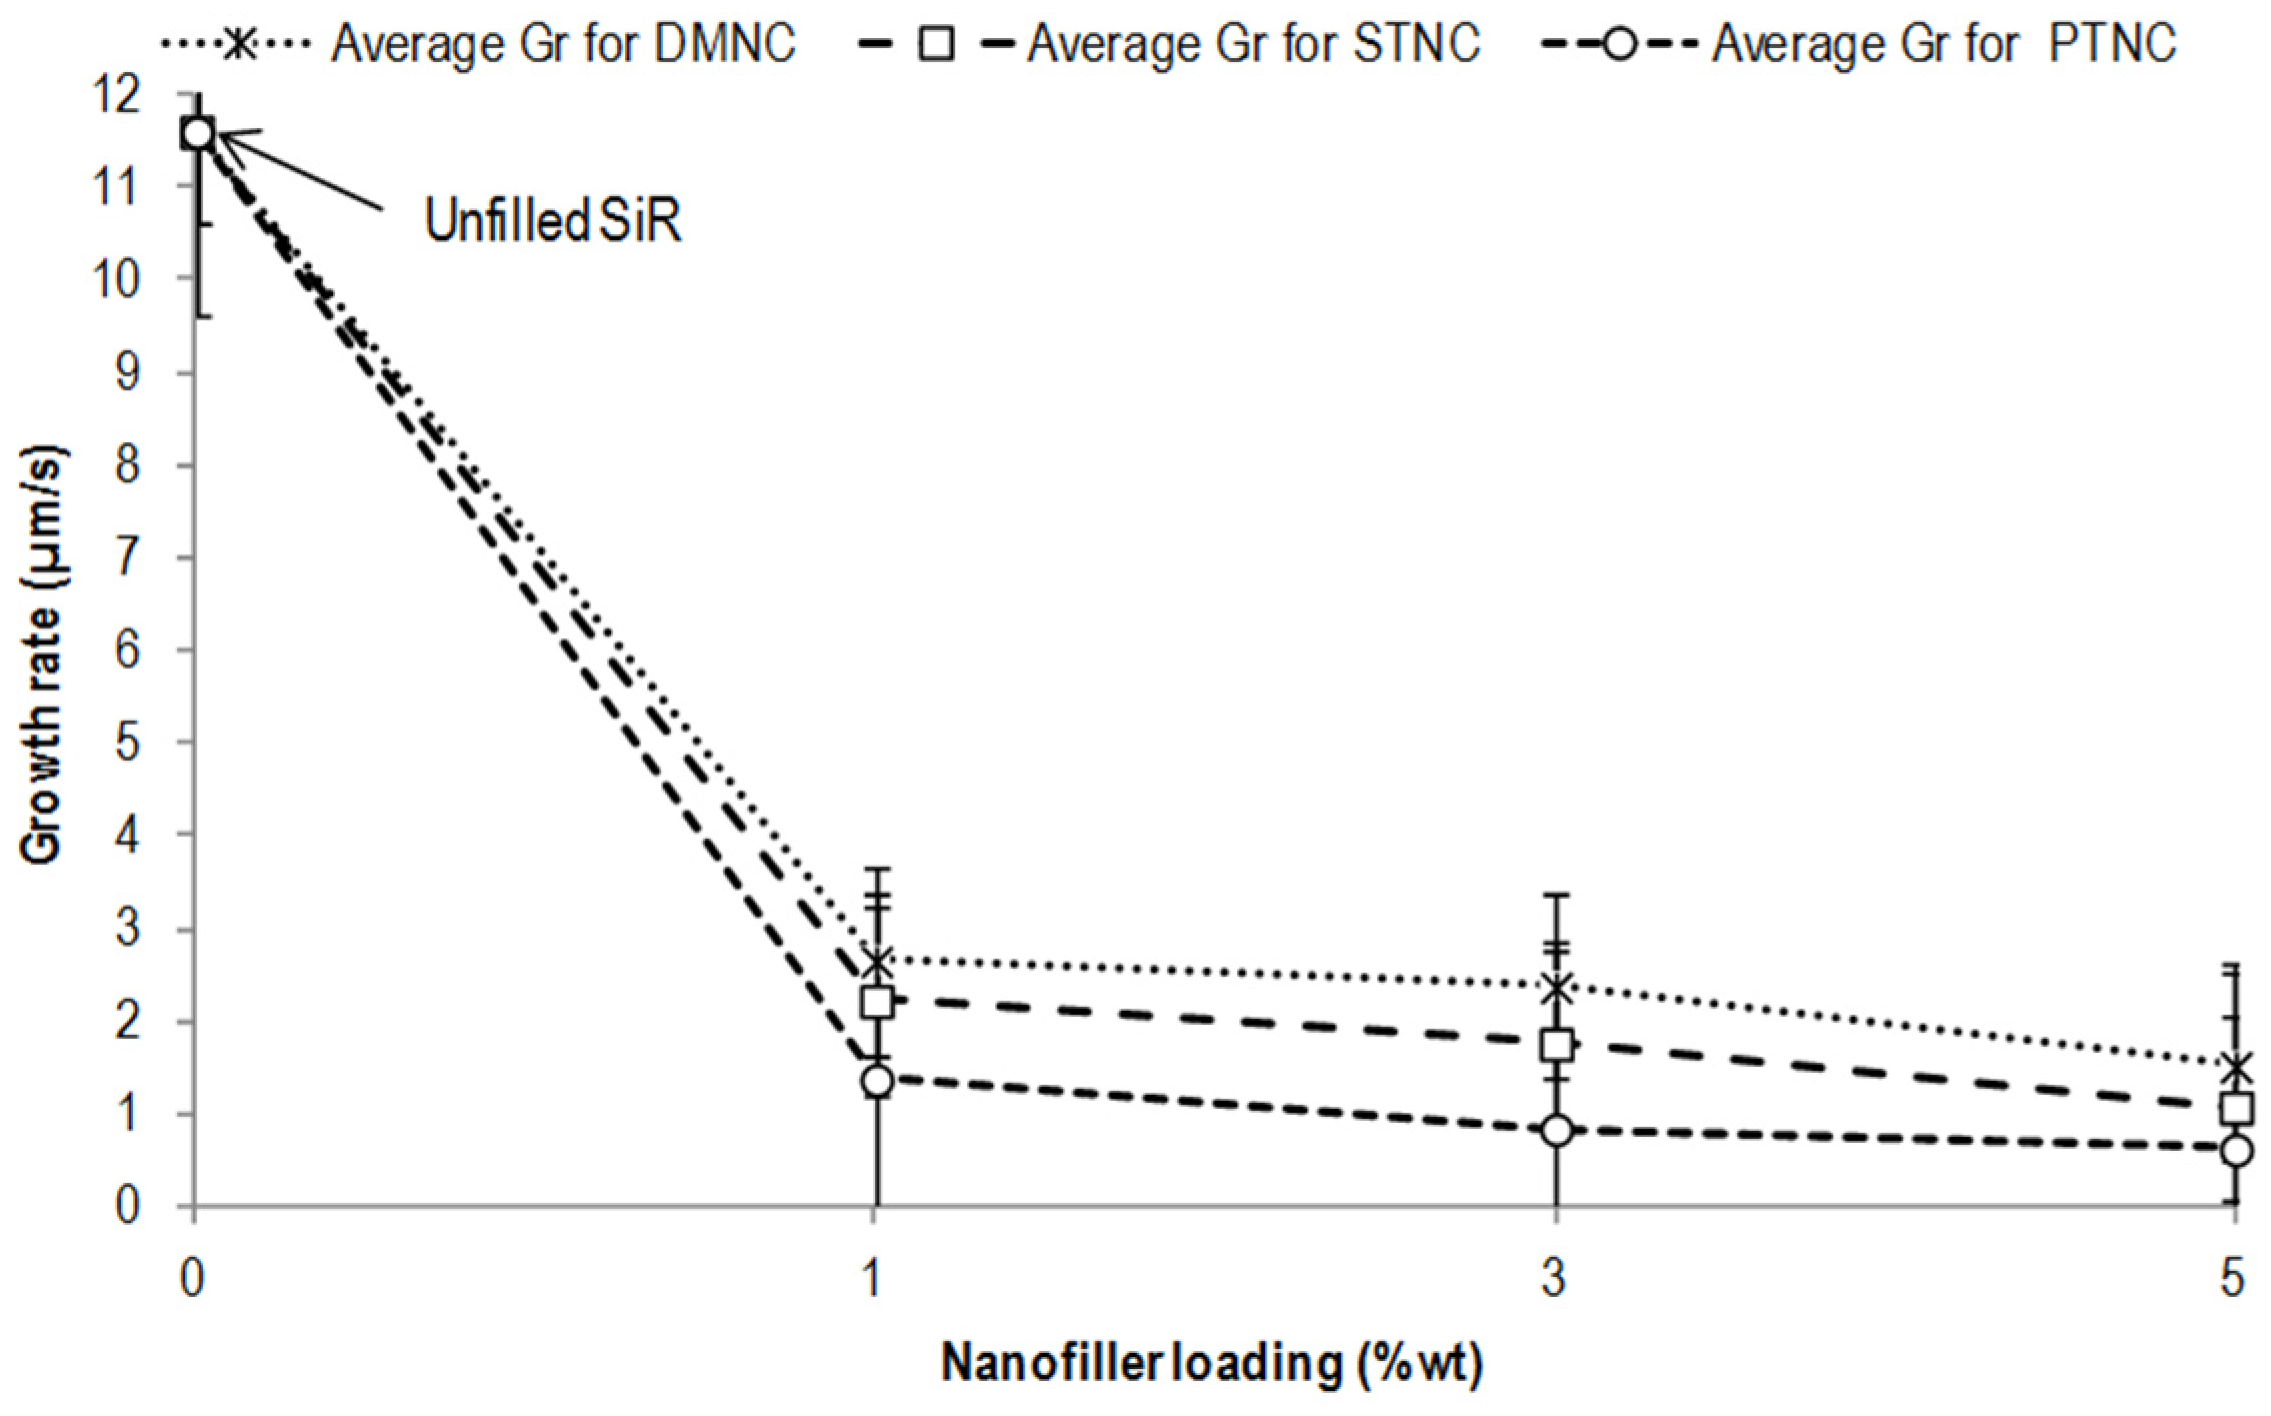
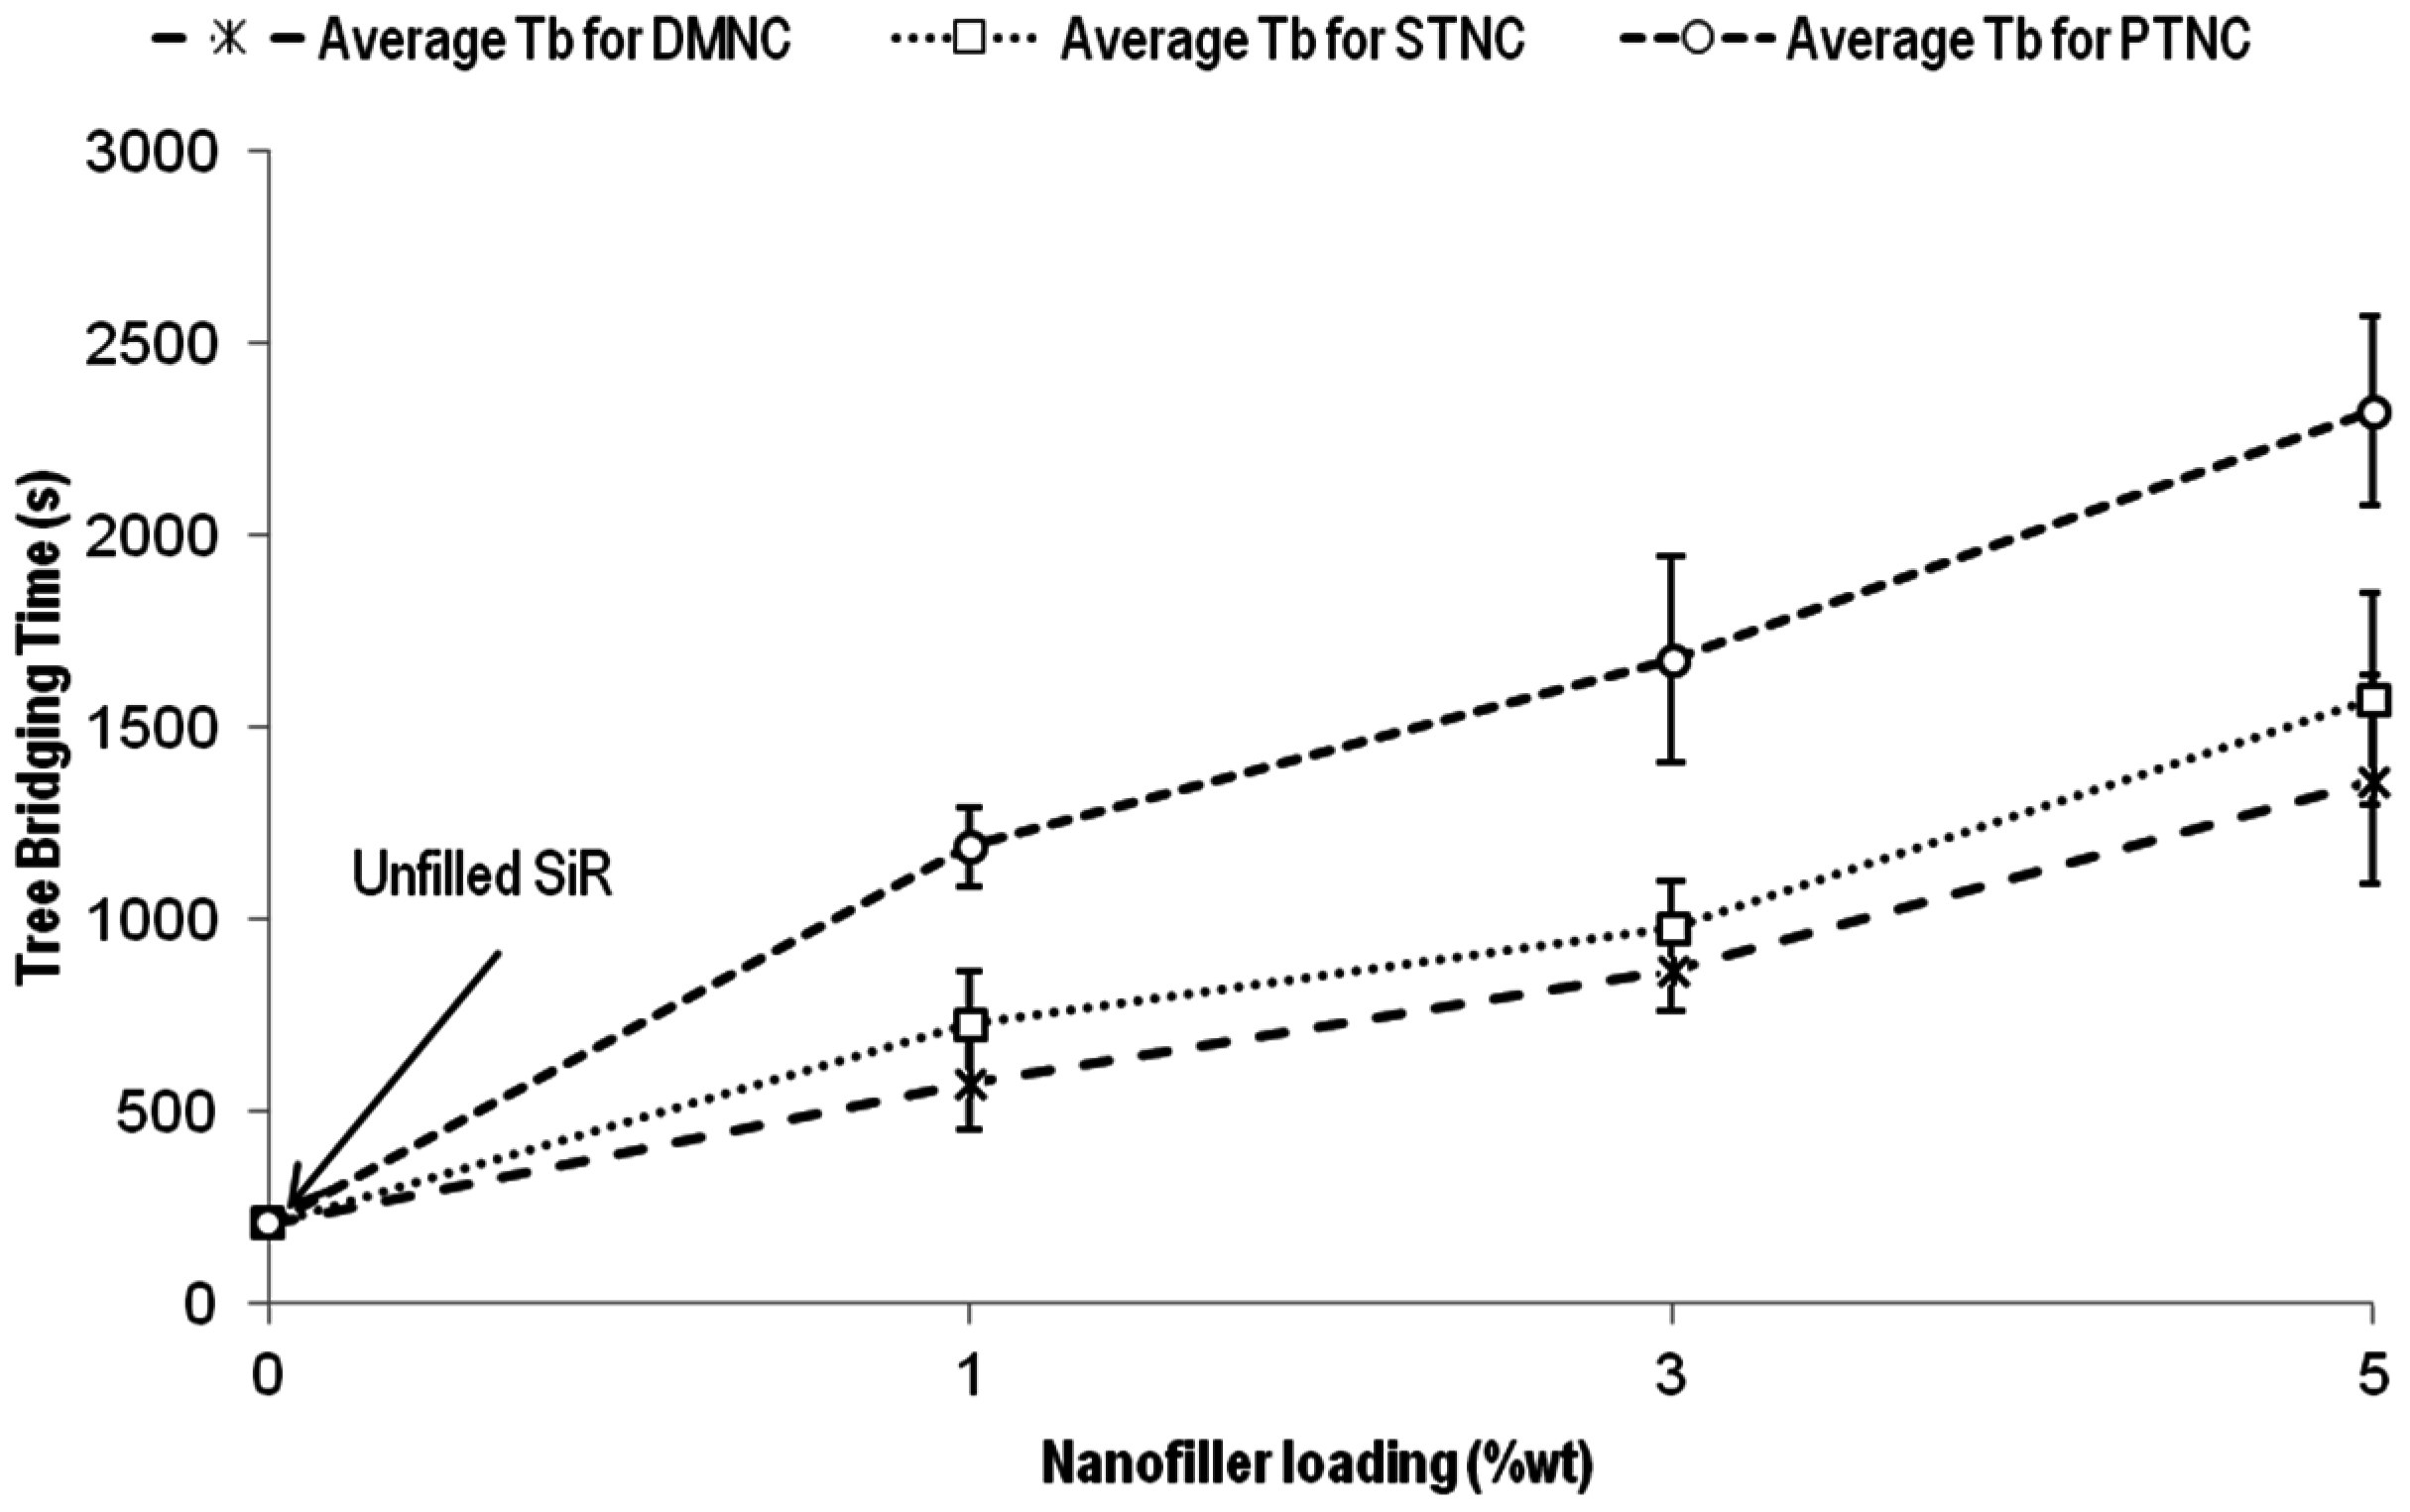
4.2.1. Electrical Tree Parameters

The tree initiation time (Ti) of an electrical tree is the time at which small, observable trees initiate at the needle tip. Figure 6 shows the tree initiation time of the electrical trees of DMNC, STNC, and PTNC, with different nanofiller loadings of 1, 3, and 5 wt %. The error bar represents the maximum and minimum values of Ti, while the center box represents the corresponding average values. The average Ti for unfilled SiR was 12.28 s, while the average Ti for DMNC were 19.8, 55.0, and 66.0 s for 1, 3, and 5 wt %, respectively; the STNC showed a faster Ti of 7.7, 30.7, and 72.6 s. In contrast, the PTNC possessed the slowest Ti, which were 34.6, 72.6, and 80.67 s for 1, 3, and 5 wt % nanocomposites, respectively. Results from statistical analysis, the one-way ANOVA (t-test), show that for the Ti, a significant difference exists between the three different treatment methods in 1% filler loading samples; while no significant difference in tree initiation times exists among the treatment methods for 3% and 5% filler loadings samples.
The result shows that the tree initiation time of the nanocomposites depended on the condition of the treatment and nanofiller loading; in addition, the increase in filler concentration prolonged the initiation times. Nanocomposites with nanofiller took a long time to initiate compared to unfilled SiR. This result agrees with the result from Alapati et al.’s work [18]; they showed that even small amounts of added nanofiller led to significant improvements in tree initiation times. Our study has shown, however, that the STNC has a faster initiation time compared to DMNC and PTNC. This result agrees with the work of Nagao et al. [8] and Kurnianto et al. [7], who showed that silane coupling did not provide significant improvements in tree initiation time and resulted in slower propagation rates. In general, the improved bonding in nanocomposites due to plasma treatment played a role in prolonging tree initiation times, because the trapped charges needed higher energy to be extracted from the polymer; more time was thus required for the tree to initiate within the nanocomposites.
Figure 7 shows the result of electrical tree performance for a sample of each of the SiR nanocomposites with different nanofiller treatments of 1%, 3%, and 5% wt filler loading for the three different treatment methods. The DMNC showed the fastest propagation rate, followed by STNC. PTNC exhibited the slowest propagation time. Similar results were observed for the rest of the samples.
It can be seen from Figure 7 that the tree performances increased with an increase in nanofiller loadings. These results are in line with other studies that have been conducted in which higher filler concentrations led to densely packed structures for resisting electrical tree progression [19,20]. The tree channels needed to propagate through the interfaces of the nanofiller in the packed structures of the polymer, which resulted in longer propagation times. From Figure 7, we can suggest that plasma treatment has a strong ability to slow electrical tree growth. This result agrees with Yan et al.’s work [21], in which plasma-treated nanocomposites (plasma polymerization) exhibited slow tree propagation time, thus indicating that plasma treatment improved resistance against electrical treeing.
To calculate the average growth rate, we plotted the best-fit line of the tree-propagation results. The growth rate was calculated using differences in tree length and time intervals. Figure 8 shows the average growth rate of electrical treeing for unfilled SiR with 1, 3, and 5 wt % of DMNC, STNC, and PTNC. The growth rate of the treeing after initiation for unfilled SiR was faster than for the SiR nanocomposites. The growth rate of electrical treeing in unfilled SiR was 11.60 μm/s, while the growth rates of electrical treeing in DMNC were 2.66, 2.38, and 1.52 μm/s for 1, 3, and 5 wt %, respectively. For STNC, the growth rates were 2.23, 1.76, and 1.08 μm/s. PTNC showed the slowest growth rates, of 1.38, 0.84, and 0.63 μm/s for 1, 3, and 5 wt %, respectively.
From the results, it is clear that the growth rate of the electrical tree decreased with an increase in nanofiller loading; the decrease was significant in 1 wt % growth-rate nanocomposites compared to unfilled SiR. This result agrees with that of Ahmad et al. [18], who found that small amounts of nanofiller (1 wt %) exhibited a slow propagation time, which resulted in slow growth rates compared to unfilled samples. In addition, from this result, it can be seen PTNC showed the slowest growth rate compared to that of DMNC and STNC. The higher filler concentration in PTNC resulted in excellent tree resistance.
Figure 9 shows the average tree bridging time (Tb) for DMNC, STNC, and PTNC with different nanofiller loadings. Tb is the time taken for the tree to reach the ground electrode, which in our study was at 2000 µm from the high-voltage electrode. The error bar represents the maximum and minimum values of Tb, while the center box represents the average value of Tb. Statistical analysis was done using ANOVA analysis and this confirmed that only the plasma treatment significantly improved the tree bridging time; silane treatment was marginal at best.
From Figure 9, the unfilled SiR recorded the shortest Tb result, followed by DMNC, STNC, and PTNC. The average Tb of the unfilled SiR was 211.20 s, while the Tb for DMNC were 578.42, 867.35, and 1365.48 s for 1, 3, and 5 wt %, respectively; the Tb for STNC were 729.82, 979.82, and 1573.18 s for the same three wt %, respectively. PTNC showed the longest Tb of 1190.42, 1675.30, and 2326.28 s for 1, 3, and 5 wt %, respectively. From these results, it is clear that the Tb of electrical treeing increased with an increase in nanofiller loading. PTNC showed the longest Tb when compared to DMNC and STNC.
The result shows that the tree bridging time of the nanocomposites is also dependent on both the condition of the treatment and the nanofiller loading. Nanocomposites with nanofiller take a longer time to break down compared to unfilled SiR. In addition, the Tb increased with an increase in nanofiller concentration. Overall, this result showed that PTNC has a longer breakdown time than the other nanocomposites. This result agrees with that of Yan et al. [9], who found that plasma-treated nanocomposites had higher breakdown strength and longer endurance under constant electrical stress.

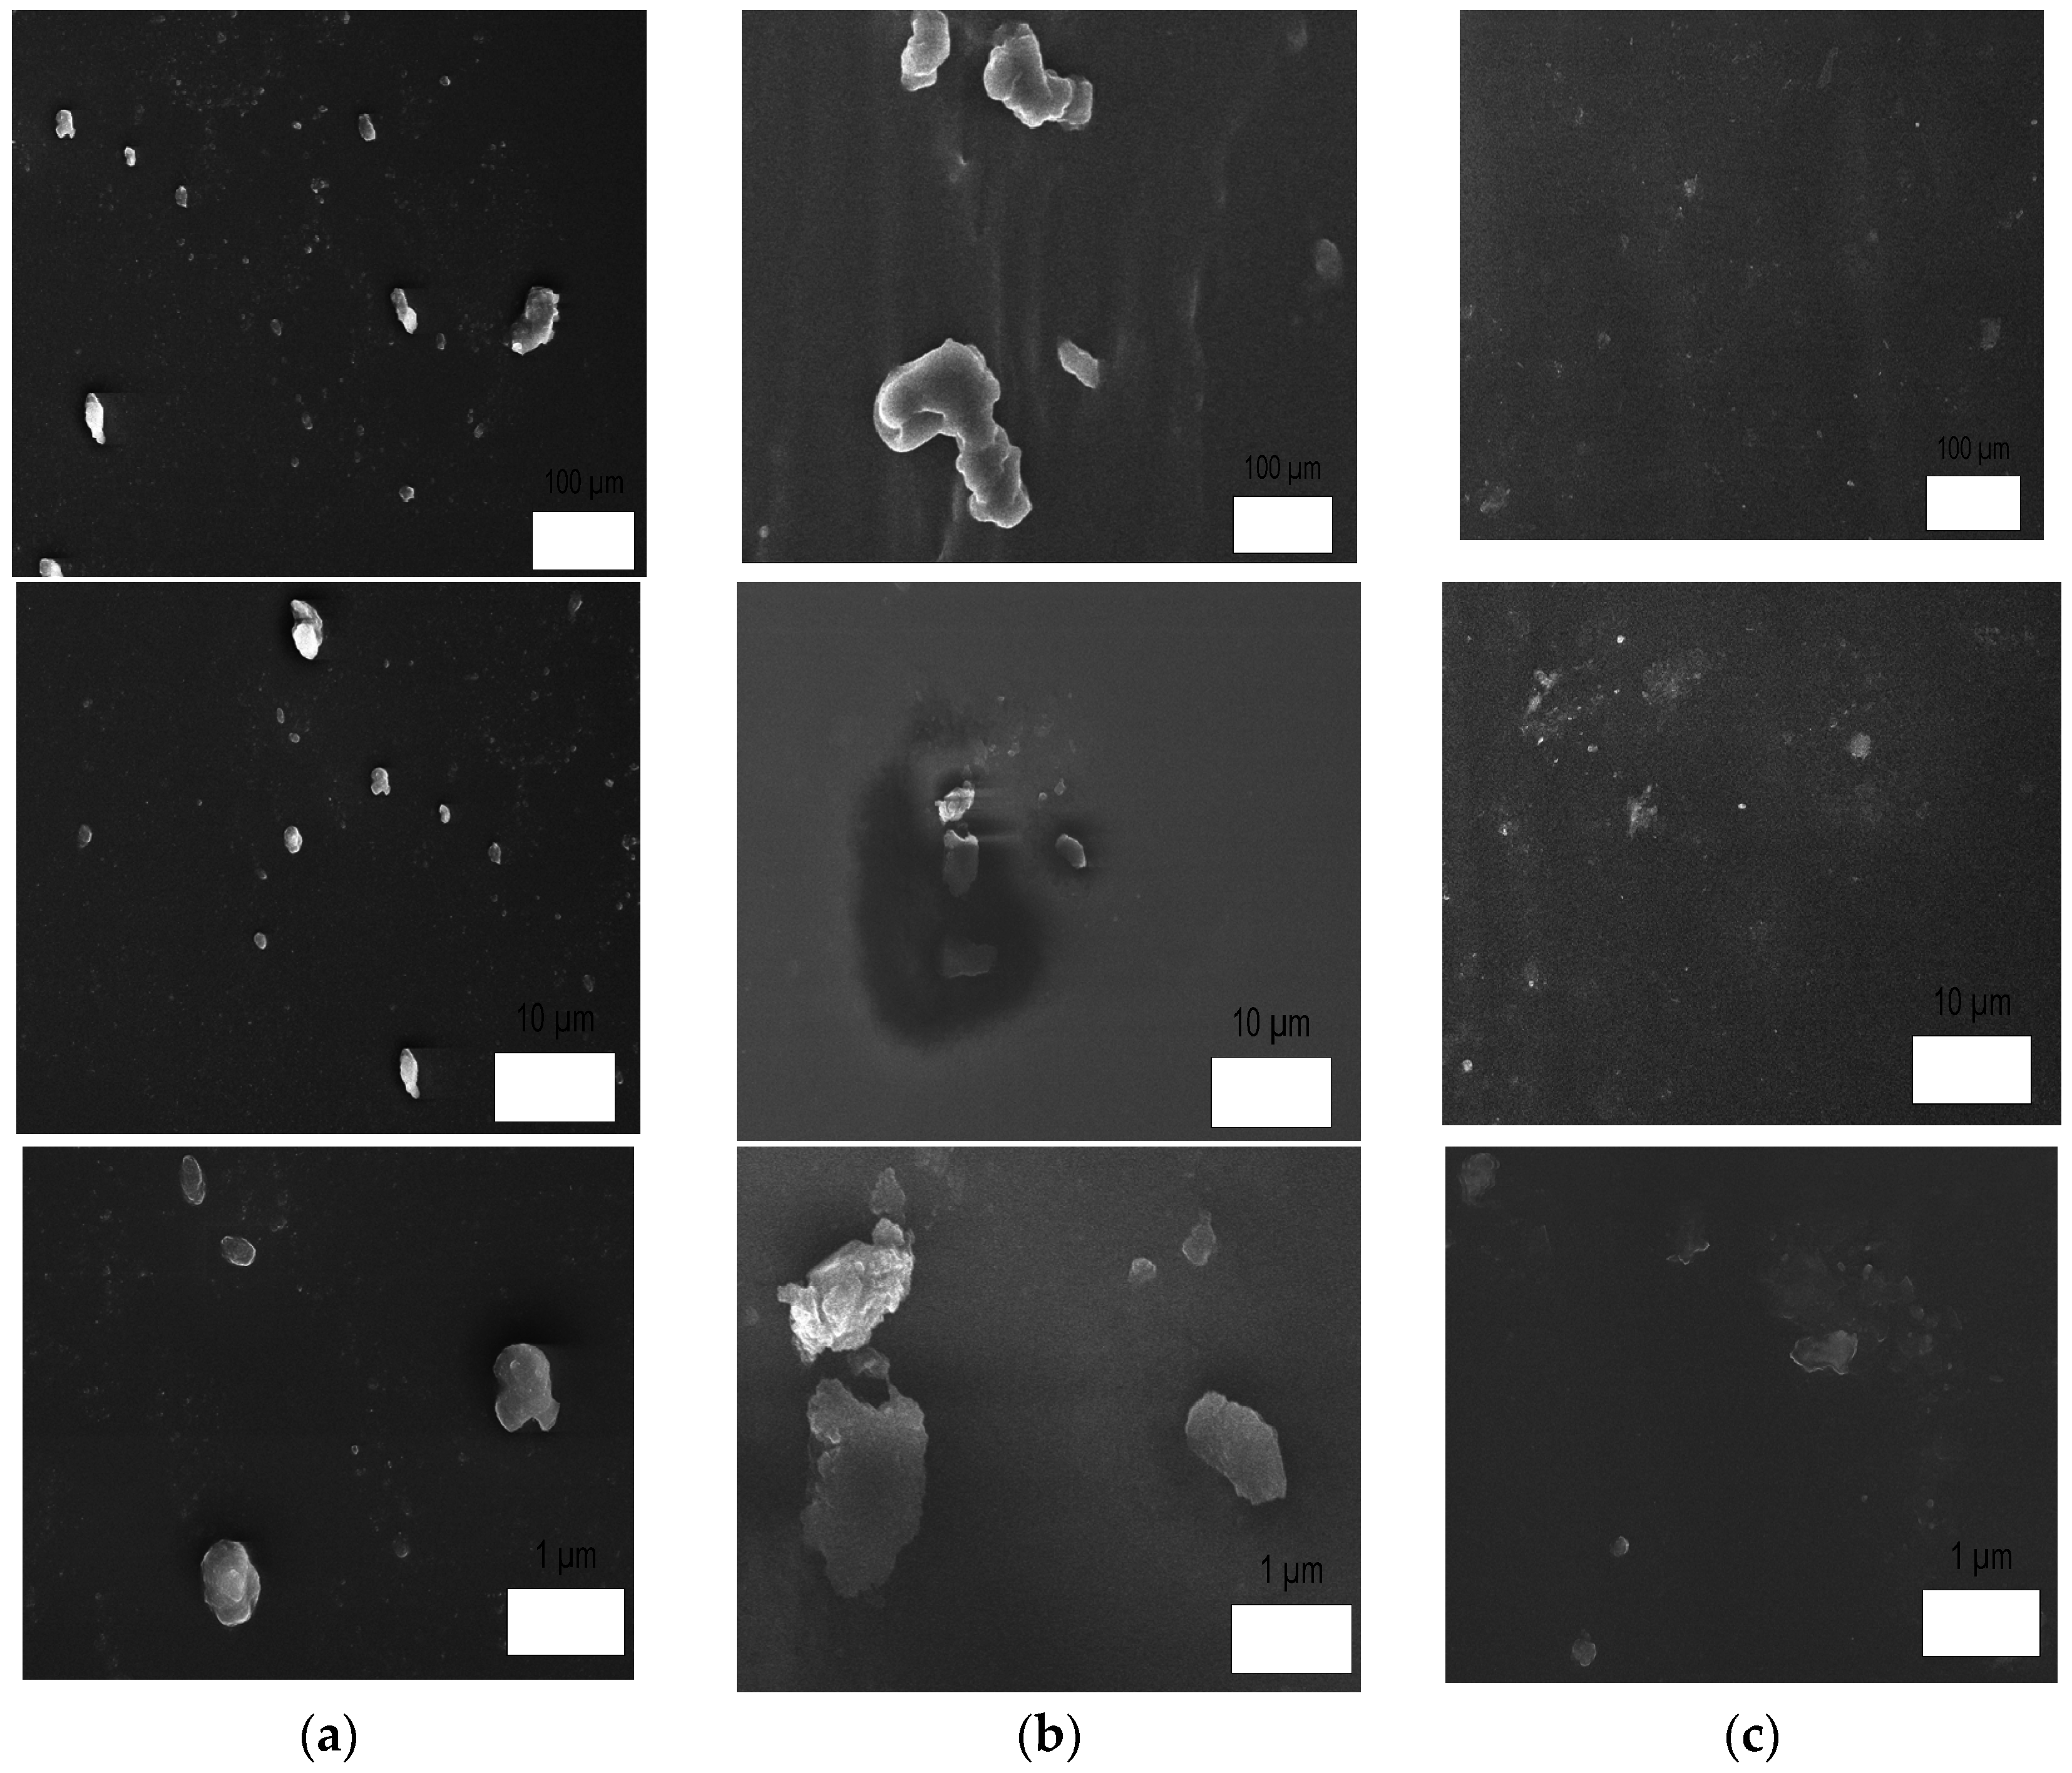
4.2.2. FESEM Analysis of the Silicone-Rubber Nanocomposites Filled with Plasma-Treated SiO2 Nanoparticles

In our study, the dispersion of the various treated SiO2 nanofillers to the polymer nanocomposite was analyzed using FESEM; FESEM analysis will show the agglomeration of the nanofillers, with diameters ranging from a few hundred nanometers to mere micrometers. The FESEM images of the DMNC-treated nanofiller (Figure 10a) showed that the nanofiller agglomerated and was not well dispersed in the polymer matrix, while clusters could be seen (Figure 10b) for the STNC-treated nanofiller. Dispersion greatly improved, however, with no obvious agglomerations appearing in the PTNC-treated nanofiller, as shown in Figure 10c.
The plasma treatment improved the uniformity of the treatment and resulted in less agglomeration, which may have been due to the repelling effect of the nanoparticles. In general, when a plasma discharge is applied to nanoparticles, ions and electrons will be generated. The electrons become attached to the nanoparticles and repel one another due to electrostatic force. The nanoparticles become separated by strong intermolecular force, which prevents the formation of agglomeration and the attraction of the nanoparticles [10].
In addition, the improvement in dispersion in our study can be attributed to the surface modification of the nanoparticles. The plasma-treated nanoparticles improved the oxygen atom content due to the plasma treatment at the atmospheric-pressure condition. The high concentration of oxygen on the surface of the nanofiller resulted in a hydrophilic characteristic, which led to higher compatibility when mixed with the silicone-rubber matrix. This resulted in better adhesion of the nanofiller-polymer interfaces.

5. Conclusions

This study has examined electrical treeing performance and has conducted a morphological analysis of plasma-treated silicone-rubber nanocomposites under different filler loadings. In addition, we have made various comparisons with existing filler treatment methods. The paper has presented the experimental results, the main findings of which are as follows:
  • The plasma-treated SiO2 nanofillers showed smoother and smaller amounts of agglomeration nanofillers with an increase in oxygen content after treatment among the three different treatment methods of the nanocomposites.
  • The plasma treatment improved the electrical tree initiation time, tree propagation time, and tree growth rates. In addition, based on the bridging times of the electrical trees, ANOVA analysis results showed a signifcant difference between the plasma-treated nanocomposites and silane-treated as well as direct-mixed nanocomposites. In addition, the plasma-treated nanocomposites exhibited the longest tree bridging times, implying that the plasma treatment of the SiO2 nanofiller improved the electrical tree performance of the silicone rubber nanocomposite. The increase in filler concentration also resulted in better electrical treeing performance.
  • The plasma-treated nanocomposites possessed the least agglomeration among the three different treatment methods of the nanocomposites due to the well dispersed SiO2 nanofillers.

Acknowledgments

The authors gratefully acknowledge the financial support by Universiti Teknologi Malaysia and the Malaysia Ministry of Education under the Fundamental Research Grant Scheme (FRGS), Vot. No. 4F398, 4F599, 4F751, 13H98, and 10J87 to carry out this work.

Author Contributions

Fatin Nabilah Musa (MPhil student) conducted the experiments and drafted the manuscript; Nouruddeen Bashir and Mohd Hafizi Ahmad supervised the experiments and study as well as finalized the manuscript; Zolkafle Buntat assisted in the design plasma chamber and plasma treatment experiments; Mohamed Afendi Mohamed Piah provided technical assistance in the course of this study.

Conflicts of Interest

The authors declare no conflict of interest.

References

  1. Du, B.X.; Gao, Y. Grow characteristics of electrical tree in silicone rubber. In Proceedings of the 16th International Symposium on High Voltage Engineering, Cape town, South Africa, 24–28 August 2009; pp. 102–106.
  2. Danikas, M.G.; Tanaka, T. Nanocomposites—A review of electrical treeing and breakdown. IEEE Electr. Insul. Mag. 2009, 25, 19–25. [Google Scholar] [CrossRef]
  3. Ding, H.-Z.; Varlow, B. Effect of nano-fillers on electrical treeing in epoxy resin subjected to ac voltage. In Proceedings of the IEEE Conference on Electrical Insulation and Dielectric Phenomena, Boulder, CO, USA, 20–20 October 2004; pp. 332–335.
  4. Imai, T.; Sawa, F.; Nakano, T.; Ozaki, T.; Shimizu, T.; Kozako, M.; Tanaka, T. Effects of nano-and micro-filler mixture on electrical insulation properties of epoxy based composites. IEEE Trans. Dielectr. Electr. Insul. 2006, 13, 319–326. [Google Scholar] [CrossRef]
  5. Iizuka, T.; Ohki, Y.; Tanaka, T. Effects of coupling agent and filler dispersion on V-t characteristics of epoxy/silica nanocomposites. In Proceedings of the International Symposium on Electrical Insulating Materials, Yokkaichi, Japan, 7–11 September 2008; pp. 60–63.
  6. Zhou, W.; Yu, D. Effect of coupling agents on the dielectric properties of aluminum particles reinforced epoxy resin composites. J. Compos. Mater. 2011, 45, 1981–1989. [Google Scholar] [CrossRef]
  7. Kurnianto, R.; Murakami, Y.; Nagao, M.; Hozumi, N. Investigation of filler effect on treeing phenomenon in epoxy resin under ac voltage. IEEE Trans. Dielectr. Electr. Insul. 2008, 15, 1112–1119. [Google Scholar] [CrossRef]
  8. Nagao, M.; Oda, K.; Nishioka, K.; Muramoto, Y.; Hozumi, N. Effect of filler on treeing phenomenon in epoxy resin under ac voltage. In Proceedings of the International Symposium on Electrical Insulating Materials, Himeji, Japan, 19–22 November 2001; pp. 611–614.
  9. Yan, W.; Han, Z.J.; Phung, B.T.; Ostrikov, K. Silica nanoparticles treated by cold atmospheric-pressure plasmas improve the dielectric performance of organic–inorganic nanocomposites. ACS Appl. Mater. Interfaces 2012, 4, 2637–2642. [Google Scholar] [CrossRef] [PubMed]
  10. Yan, W. Nanocomposite Dielectric Materials for Power System Equipment. Ph.D. Thesis, University of New South Wales, Sydney, Australia, 2013. [Google Scholar]
  11. Du, B.; Ma, Z.; Gao, Y.; Han, T. Effect of ambient temperature on electrical treeing characteristics in silicone rubber. IEEE Trans. Dielectr. Electr. Insul. 2011, 18, 401–407. [Google Scholar] [CrossRef]
  12. Zhou, Y.; Liu, R.; Hou, F.; Zhang, X.; Xue, W. Morphology of electrical trees in silicon rubber. J. Electrost. 2013, 71, 440–448. [Google Scholar] [CrossRef]
  13. Ahmad, M.H.; Bashir, N.; buntat, Z.; Arief, Y.Z.; Jamil, A.A.A.; Piah, M.A.M.; Suleiman, A.A.; Dodd, S.; CHalashkanov, N. Temperature effect on electrical treeing and partial discharge characteristics of silicone rubber-based nanocomposites. J. Nanomater. 2015, 2015. [Google Scholar] [CrossRef]
  14. Jamil, A.A.A.; Bashir, N.; Ahmad, M.H.; Arief, Y.Z.; Kamarol, M.; Mariatti, M. Electrical treeing initiation and propagation in silicone rubber nanocomposites. In Proceedings of the IEEE Conference on Electrical Insulation and Dielectric Phenomena, Shenzhen, China, 20–23 October 2013; pp. 502–505.
  15. Ahmad, M.; Piah, M.; Arief, Y.; Bashir, N.; Chalashkanov, N.; Dodd, S. Temperature dependance of pd from electrical trees grown in silicone rubber based nanocomposites. In Proceedings of the 2013 IEEE International Conference on Solid Dielectrics (ICSD), Bologna, Italy, 30 June–4 July 2013; pp. 816–819.
  16. Fang, Z.; Xie, X.; Li, J.; Yang, H.; Qiu, Y.; Kuffel, E. Comparison of surface modification of polypropylene film by filamentary dbd at atmospheric pressure and homogeneous dbd at medium pressure in air. J. Phys. D Appl. Phys. 2009, 42, 085204. [Google Scholar] [CrossRef]
  17. Chan, C.-M.; Ko, T.-M.; Hiraoka, H. Polymer surface modification by plasmas and photons. Surf. Sci. Rep. 1996, 24, 1–54. [Google Scholar] [CrossRef]
  18. Alapati, S.; Thomas, M.J. Influence of nano-fillers on electrical treeing in epoxy insulation. IET Sci. Meas. Technol. 2012, 6, 21–28. [Google Scholar] [CrossRef]
  19. Kurnianto, R.; Murakami, Y.; Hozumi, N.; Nagao, M.; Murata, Y. Some fundamentals on treeing breakdown in inorganic-filler/LDPE nano-composite material. In Proceedings of the IEEE Conference on Electrical Insulation and Dielectric Phenomena, Kansas City, MO, USA, 15–18 October 2006; pp. 373–376.
  20. Musa, M.; Arief, Y.Z.; Abdul-Malek, Z.; Ahmad, M.H.; Jamil, A.A.A. Influence of nano-titanium dioxide (TiO2) on electrical tree characteristics in silicone rubber based nanocomposite. In Proceedings of the IEEE Conference on Electrical Insulation and Dielectric Phenomena, Shenzhen, China, 20–23 October 2013; pp. 498–501.
  21. Yan, W.; Phung, B.T.; Han, Z.J.; Ostrikov, K. Plasma polymer-coated on nanoparticles to improve dielectric and electrical insulation properties of nanocomposites. IEEE Trans. Dielectr. Electr. Insul. 2014, 21, 548–555. [Google Scholar]
Figure 1. Schematic diagram of atmospheric pressure plasma test cell (a) 3D; (b) 2D.
Applsci 06 00348 g001
Figure 2. Experimental setup for the plasma treatment.
Applsci 06 00348 g002
Figure 3. Experimental setup for electrical tree growth monitoring.
Applsci 06 00348 g003
Figure 4. Surface composition of nanoparticles: untreated, silane-treated, and plasma-treated.
Applsci 06 00348 g004
Figure 5. Morphology images of silicon dioxide nanoparticles: (a) untreated; (b) silane-treated; and (c) plasma-treated.
Applsci 06 00348 g005
Figure 6. Tree initiation time for directly mixed nanocomposites (DMNC), silane-treated nanocomposites (STNC), and plasma-treated nanocomposites (PTNC).
Applsci 06 00348 g006
Figure 7. Electrical tree performance (a) DMNC; (b) STNC; (c) PTNC.
Applsci 06 00348 g007
Figure 8. Growth rates for DMNC, STNC, and PTNC.
Applsci 06 00348 g008
Figure 9. Tree bridging times for DMNC, STNC, and PTNC.
Applsci 06 00348 g009
Figure 10. Field emission scanning electron microscopy (FESEM) images at 5 wt % for (a) DMNC; (b) STNC; and (c) PTNC.
Applsci 06 00348 g010
Table 1. Si 2p binding energy and concentration of untreated, silane-treated, and plasma-treated nanoparticles.
UntreatedSilane-TreatedPlasma-Treated
BE (eV)IntensityBE (eV)Concentration (%)BE (eV)Concentration (%)
101.792500101.702230101.703040
104.79655103.80551104.68545
Table 2. Atomic concentrations of nanoparticles after treatment.
SamplesAtomic Content (%)
COSi
Untreated7.5044.8047.70
Silane-treated25.0048.0826.93
Plasma-treated9.4047.6043.00

