Article

Effects of Process Parameters on the Extraction of Quercetin and Rutin from the Stalks of Euonymus Alatus (Thumb.) Sieb and Predictive Model Based on Least Squares Support Vector Machine Optimized by an Improved Fruit Fly Optimization Algorithm

1
Key Laboratory of Industrial Advanced Process Control for Light Industry of Ministry of Education, Jiangnan University, Wuxi 214122, China
2
Department of Physics and Electrical Engineering, Ningde Normal University, Ningde 352100, China
3
School of Chemical and Environment Science, Shaanxi University of Technology, Hanzhong 723001, China
*
Author to whom correspondence should be addressed.
Appl. Sci. 2016, 6(11), 340; https://doi.org/10.3390/app6110340
Submission received: 17 September 2016 / Revised: 18 October 2016 / Accepted: 2 November 2016 / Published: 8 November 2016

Abstract

:
Ultrasonic-assisted extraction (UAE) of quercetin and rutin from the stalks of Euonymus alatus (Thunb.) Sieb in our laboratory, which aimed at evaluating and optimizing the process parameters, was investigated in this work. In addition, process parameters such as ethanol solution concentration, solvent volume/sample ratio, ultrasound power and extraction time, ultrasound frequency and extraction temperature were also first applied for evaluating the influence of extraction of quercetin and rutin. Optimum process parameters obtained were: ethanol solution 60%, extraction time 30 min, solvent volume/sample ratio 40 mL/g, ultrasound power 200 W, extraction temperature 30 °C and ultrasound frequency 80 kHz. Further a hybrid predictive model, which is based on least squares support vector machine (LS-SVM) in combination with improved fruit fly optimization algorithm (IFOA), was first used to predict the UAE process. The established IFOA-LS-SVM model, in which six process parameters and extraction yields of quercetin and rutin were used as input variables and output variables, respectively, successfully predicted the extraction yields of quercetin and rutin with a low error. Moreover, by comparison with SVM, LS-SVM and multiple regression models, IFOA-LS-SVM model has higher accuracy and faster convergence. Results proved that the proposed model is capable of predicting extraction yields of quercetin and rutin in UAE process.

Graphical Abstract

1. Introduction

Euonymus alatus (Thunb.) Sieb, an important conventional medicinal herb, has received increasing interest worldwide due to its reliable therapeutic activity and long history of clinical practice. Quercetin and rutin are of great importance as bioactive compounds from the stalks of Euonymus alatus (Thunb.) Sieb [1]. They can be used as an excellent source of pharmaceutical products for phytotherapy, and have shown significant scavenging of anti-ageing activity and free oxygen radicals [2].
In recent years, various extraction techniques such as solvent extraction, heat reflux extraction, Soxhlet extraction, microwave-assisted extraction, and so on, have been reported [3,4,5]. In these techniques, the extraction of quercetin and rutin was usually carried out by refluxing, boiling and heating, which resulted in loss of many analytes due to oxidation and thermal decomposition during the extraction process [6]. Moreover, these extraction techniques were characterized by of large amount of solvent consumption and more extraction time [7].
As an inexpensive, environmentally benign, and more effective extraction technique, ultrasonic-assisted extraction was used to extract quercetin and rutin from various plants previously with decent results [8,9,10]. However, thus far, there are few reports that consider ultrasound frequency, ultrasound power and extraction temperature as the process parameters to evaluate the impact on extraction yields of quercetin and rutin from the stalks of Euonymus alatus (Thunb.) Sieb. Therefore, we will further evaluate the effects of above three process parameters on the extraction of quercetin and rutin from this herb.
To better predict the UAE process and to analyze process parameters, modeling of ultrasonic extraction process is a good approach, which can allow us to easily understand the effects of process parameters on the extraction process. Only when all these process parameters and their interrelationships were fully represented, an excellent extraction performance of ultrasonic extraction process can be obtained [11]. Thus, reliable accurate model of ultrasonic extraction process can allow us to better optimize process parameters, and therefore to minimize operational costs.
Many kinetic models based on basic principles and ultrasonic mechanism equations have been developed [12,13,14,15]. These models were proven to be complicated and difficult to solve. Moreover, establishment of these models are sometimes complicated due to numerous constants and uncertain parameters. Therefore, a model, which is based on statistical learning theory, i.e., data-based from input/output experimental data, is urgent to put forward.
As a kind of learning machine, least squares support vector machine (LS-SVM) was proven to have high precision in prediction of complex and non-linear systems [16], especially in the case of small samples. In prediction problems in many fields, such as liquid densities [17], penicillin fermentation process [18], classification of carbon fiber fabrics [19], interfacial tension [20], melt index [21], gas compressibility factor [22], and so on, the LS-SVM model has been applied successfully. Unfortunately, it has been found that the LS-SVM model is rarely applied to predict the extraction yield or efficiency in the UAE process.
This paper attempts to use the LS-SVM model to predict the extraction yields of quercetin and rutin from Euonymus alatus (Thunb.) Sieb. The prediction accuracy and convergence speed of the LS-SVM model depends mainly on two key parameters called regularization parameter (γ) and kernel parameter (σ2). In order to obtain the optimum values of γ and σ2, in recent years, various swarm intelligence algorithms have been proposed and proven to be effective [23,24,25,26,27]. However, these optimization algorithms have been reported having some drawbacks such as hard to understand, low convergence speed, easily falling into local optimal solution, and so on. As a simple and robust evolutionary optimization technique, fruit fly optimization algorithm (FOA) which is easy to understand and to reach the global optimal solution compared with other swarm intelligence algorithms, has been first proposed by Pan in 2012 [28]. However, like other swarm intelligence algorithms, because the seeking step size of fruit fly is always fixed, it may lead the basic FOA to fall into the local optimum. Therefore, this paper introduces a novel adaptive step update factor into the basic FOA. This improved FOA is called IFOA, which has sound optimizing ability for the values of γ and σ2 compared to the basic FOA. Based on the IFOA, this work established a new IFOA-LS-SVM model to improve prediction performance for the extraction yields of quercetin and rutin in UAE process.
The objective of this paper is firstly to evaluate effects of the aforementioned process parameters on the extraction yields of quercetin and rutin from Euonymus alatus (Thunb.) Sieb and to optimize the process parameters. Then, the experimental data, collected from this laboratory, were used to establish the IFOA-LS-SVM model for predicting the extraction yields in ultrasonic extraction process. Finally, the prediction performance of the proposed model was evaluated and it also compared with the SVM model and LS-SVM model.

2. Materials and Methods

2.1. Experimental

2.1.1. Materials and Chemicals

The stalks of Euonymus. alatus were obtained from an herb market (Wuxi, China). The samples were dried at 40 °C for 24 h and ground (80 meshes). Both quercetin and rutin standards were purchased from Zhejiang Institute of Food and Drug Control (Hangzhou, China). Methanol and analytical-grade ethanol and analytical-grade ethanol were purchased from Shanghai Chemical Reagent Company (Shanghai, China). High Performance Liquid Chromatography (HPLC)-grade acetic acid was purchased from Tedia Company (Fairfield, OH, USA). Water was purified using a Milli-Q system (Molsheim, France).

2.1.2. Instrumentation and Analytical Conditions

An extraction apparatus with an ultrasonic bath (300 mm × 240 mm × 150 mm) (Hongxianglong Biotechnology Developing Co., Ltd., Beijing, China) was used for extraction experiments. The apparatus has a work frequency in a range of 18–200 kHz and the power rating of the ultrasonic bath is 500 W on the scale of 1–8, corresponding to the powers of 25, 50, 100, 150, 200, 300, 400 and 500 W, respectively. The actual electrical power or ultrasonic energy to the transducers was measured by using a digital wattmeter (JYK-96var, Shanghai elite Instrument Electric Co., Ltd., Shanghai, China), to be 24.9, 50.4, 98.9, 199.4, 300.7 and 401.2 W, respectively for the setting of 1, 2, 3, 5, 6 and 8 tested in this study. Extraction temperature was controlled by the water temperature in the ultrasonic bath, which can be circulated and regulated at constant desired temperatures using a heating/cooling temperature controlling circulator included in the extraction apparatus. Moreover, time can also be set to a desired value by a digital timer. For HPLC analysis, an Agilent Model 1100 HPLC system (Agilent Co., Palo Alto, CA, USA), which consists of a controller, a G1311A pump and a G1314A multi-wavelength detector, was used to determinate quercetin and rutin. Meanwhile, calibration curve method was also applied for the HPLC analysis of quercetin and rutin from Euonymus. alatus.

2.1.3. Ultrasound-Assisted Extraction

Because the extraction results may be influenced by the small variations in the experimental conditions, a 250 mL flat bottom flask with 7 cm diameter was selected due to a optimum extraction result according to the previous report [29]. Moreover, the bottom flask was kept at 2.5 cm above the bottom of the bath and the liquid height in the flask was kept at 6.4 cm. As the extraction solvent, the ethanol aqueous solution was added into the flask. Then, it was heated to the desired temperature. Five grams of dried sample powders were added into the flask. Agitate the mixture and then immerse the flask into the axis center position of the bath, which contains 3.5 L of water. The ethanol aqueous solution surface in the flask was maintained at the same height level of water. After that, ultrasound power and ultrasound frequency were adjusted to the proper values (according to the experimental planning). After irradiating under ultrasound for a desired time, the quercetin and rutin were induced into the liquid phase. When extraction finished, the flask was taken out and cooled to room temperature. The extract solution was filtered through a 0.45 μm filter before HPLC analysis. The extraction yield of quercetin and rutin can be calculated using Equation (1) [30].
Extraction   yield   ( mg / g ) = amount   of   target   analyte   ( mg )   sample   weight   ( g )
where amount of target analyte represents the average mass of three subsequent sample determinations, and sample weight represents the average weight from 3 samples before extraction.

2.1.4. Statistical Analysis

Each extraction procedure was replicated 3 times. The significance of the differences of quercetin and rutin was calculated using a one-way ANOVA procedure. Duncan’s multiple range tests were applied for the determination of significant differences among treatments at p-values < 0.05. The results of HPLC analysis were expressed as the mean value ± the standard deviation.

2.2. Methodology of FOA-LS-SVM Model

2.2.1. Support Vector Machine (SVM)

As a supervised machine learning method, SVM aims to finite data points based on statistical learning theory [31]. Details of the SVM algorithm can be found in the literature [32,33].
Assume a training data set is defined as { x k , y k } k = 1 N , and the input data and the corresponding output are x k R n and y k R m , respectively. The feature space of SVM model is expressed as Equation (2).
y ( x ) = ω T φ ( x ) + b
where ω represents the weight vector of the same dimension as the feature space, superscript T is transpose matrix, b is bias terms, and φ ( · ) : R n R m represents the nonlinear mapping function which is not explicitly constructed.
To solve the solution of SVM model, quadratic programming method is usually adopted. However, this method is difficult to implement and is time consuming. Moreover, it is often confronted with some problems such as long CPU time and large memory requirement when trained SVM model [18], and so on.

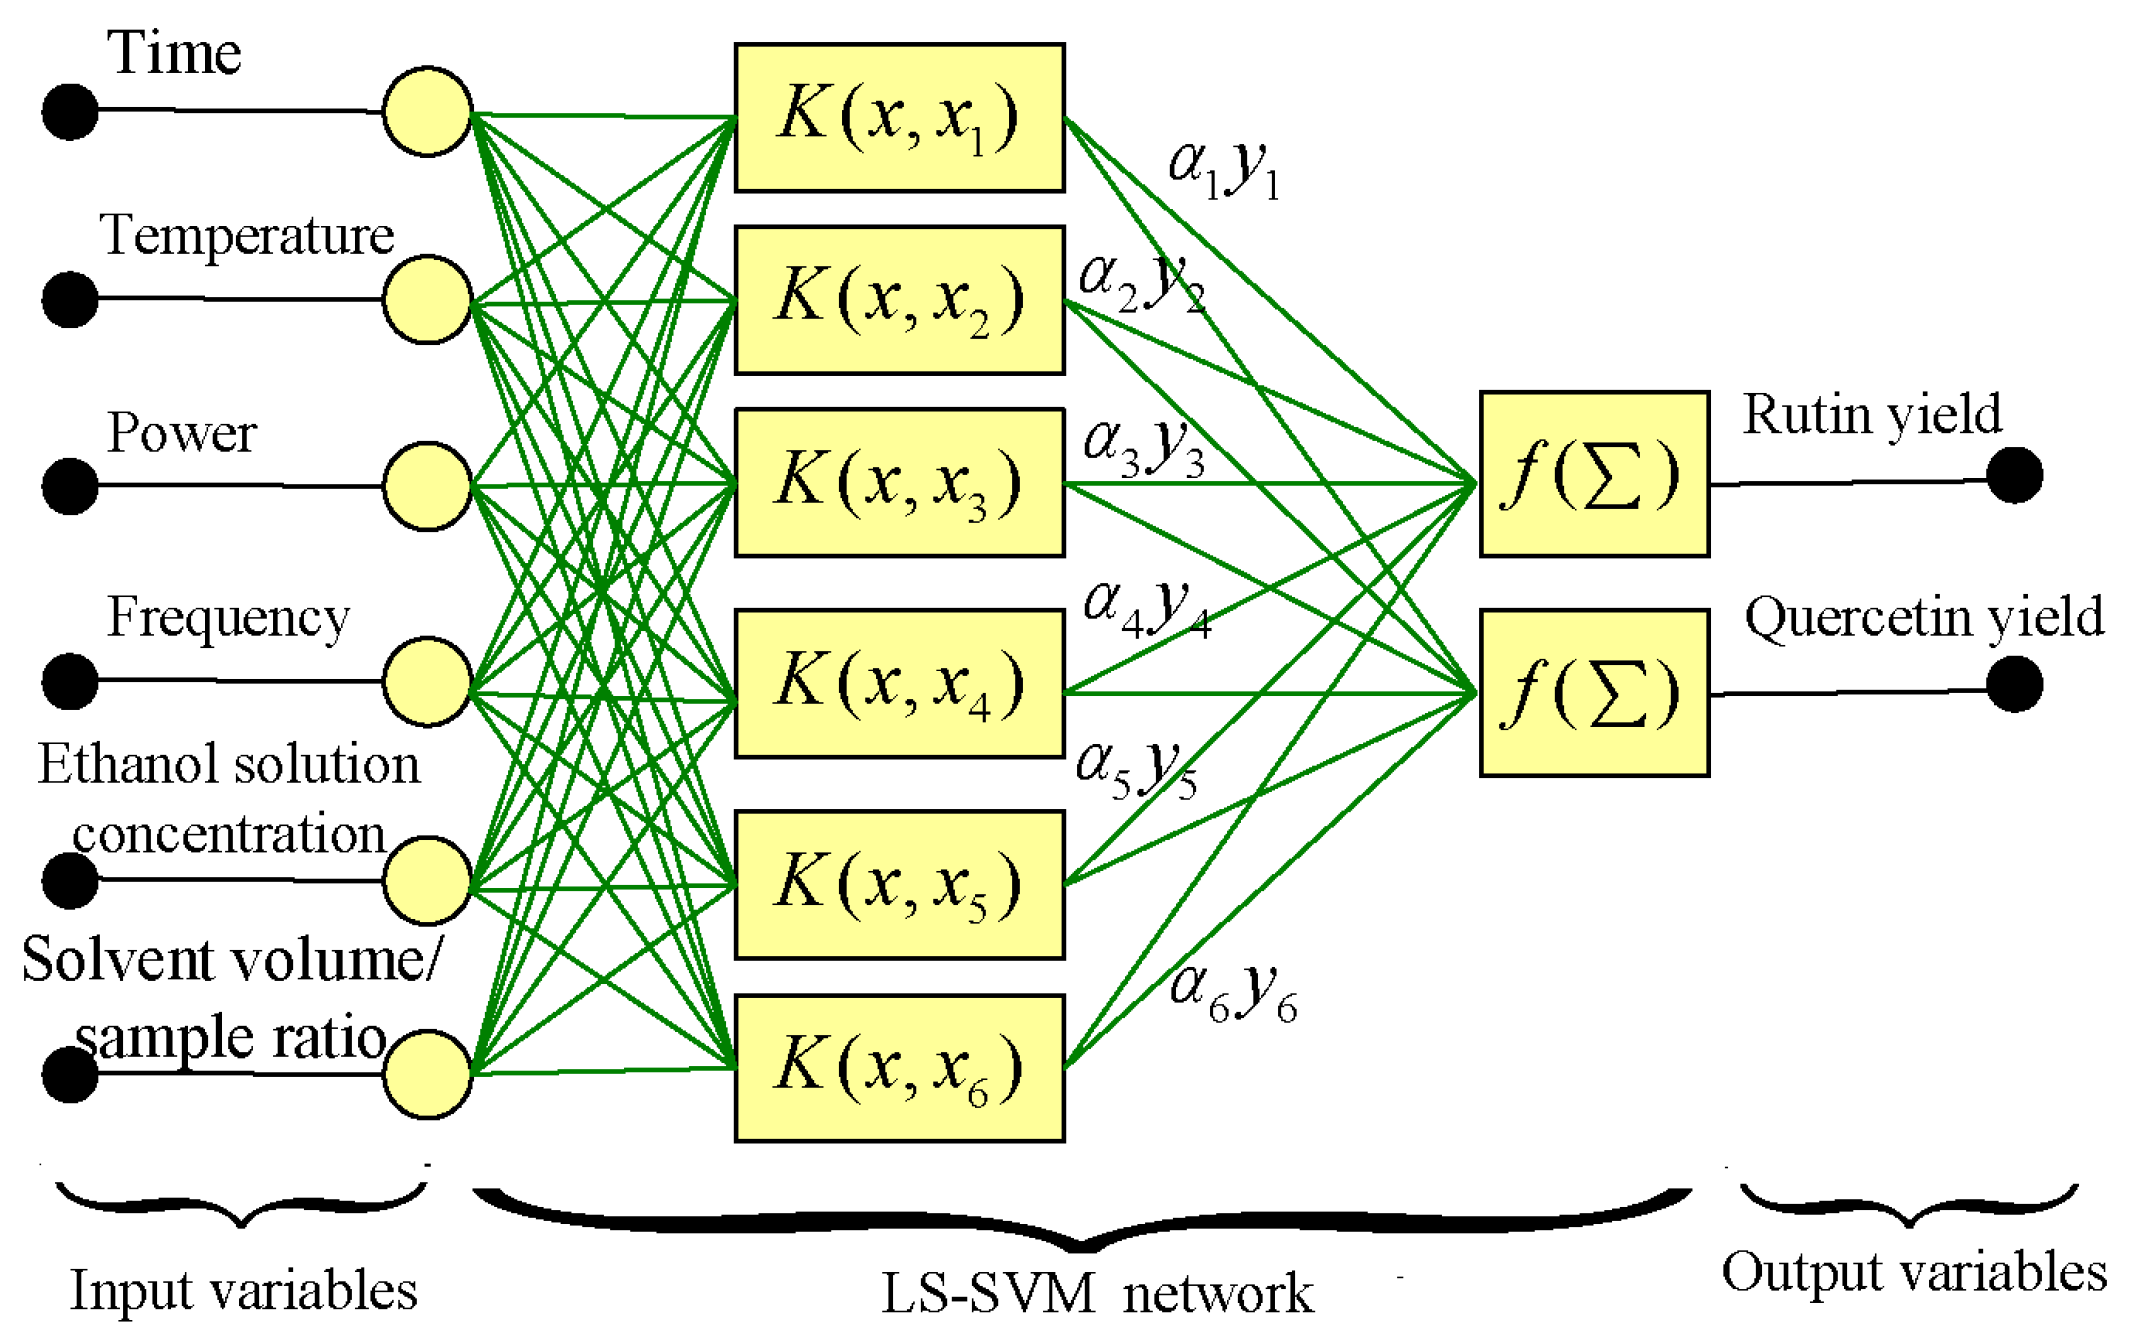
2.2.2. Least Squares Support Vector Machine (LS-SVM)

Regarding those issues above, an improved version of SVM, called least Squares Support Vector Machine, was proposed by Suykens and Vandewalle [33]. By substituting the convex quadratic programming problem through utilizing equality constraints, LS-SVM can not only reduce the complexity of SVM, but also enhance its convergence speed. For LS-SVM, the formulation of primal problem can be expressed as Equation (3) [18,33].
min J ( w , e ) = 1 2 w T w + 1 2 γ k = 1 N e k 2 , y > 0
Subject to
y k = w T φ ( x k ) + b + e k , k = 1 , , N
where γ represents the regularization parameter, which balances the training errors and the complexity of model; and e k represents the slack variable.
To solve this optimization problem, the Lagrange function is adopted to construct as follow.
L ( w , b , e , α ) = J ( w , e ) k = 1 N α k [ w T φ ( x k ) + b + e k y k ]
where α k are Lagrange multipliers. According to the Kuhn–Tucker conditions [34], the solutions of Equation (5) can be obtained by performing partial differential for each variable.
{ L w = 0 w = k = 1 N α k φ ( x k ) L b = 0 w = k = 1 N α k = 0 L e k = 0 α k = γ e k ,   k = 1 , , N    L α k = 0 α k = w T φ ( x k ) + b + e k y k ,   k = 1 , , N
After w and e k are removed, the solution of Equation (6) can also be rewritten by:
[ b α ] = [ 0 I T I T Ω + γ 1 I ] [ 0 y ]
with
{ α = [ α 1 , , α N ] y = [ y 1 , , y N ] I = [ 1 , , 1 ]    Ω = { Ω k | k = 1 , N }
and
Ω k = φ ( x k ) T φ ( x ) = K ( x k , x ) ,   k = 1 , , N
Then, the regression function of LS-SVM model for parameter prediction can be obtained as:
y k = k = 1 N α k K ( x , x k ) + b
where K ( x , x k ) is the kernel function, which is used for mapping input vectors into a high-dimension feature space. There are several kinds of kernel functions including radial basis function (RBF), polynomial, sigmoid. Due to an excellent overall performance and fewer parameters, the RBF kernel function is more interesting to apply in many fields [35]. Therefore, the RBF kernel function was selected in this work and its equation is expressed as:
K ( x , x k ) = exp [ x k x 2 σ 2 ]
where σ2 is the kernel parameter, which can be optimized by an optimization algorithm such as FOA.
Consequently, in the LS-SVM mode, there are only two parameters, which are γ and σ2, need to be chosen. In this work, an improved fruit fly optimization algorithm will be applied for seeking the optimal values of γ and σ2.

2.2.3. Basic Fruit Fly Optimization Algorithm (FOA)

FOA, a new swarm intelligence algorithm by fruit fly foraging behavior for global optimization, was first proposed by Pan in 2012. Fruit fly is an insect, which likes living in the tropical and temperate climate regions and eating rotten fruits and leaves. The olfactory and visual senses of fruit fly are better than other species. The basic thought of food seeking process of fruit fly is summarized as follows.
Firstly, the fruit fly smells the food source by its olfactory organ. When the fruit fly has smelled the food odors, it then flies towards that food location. When the fruit fly reaches the location of target food, it will continue to seek flocking locations of other fruit flies and other foods by its sensitive vision. Finally, the fruit fly flies towards that direction. Repeat above processes until the optimum food is found. Figure 1 illustrates the iterative process for food seeking of fruit fly swarm. The details on the seeking procedures of basic FOA can refer to literature [28].

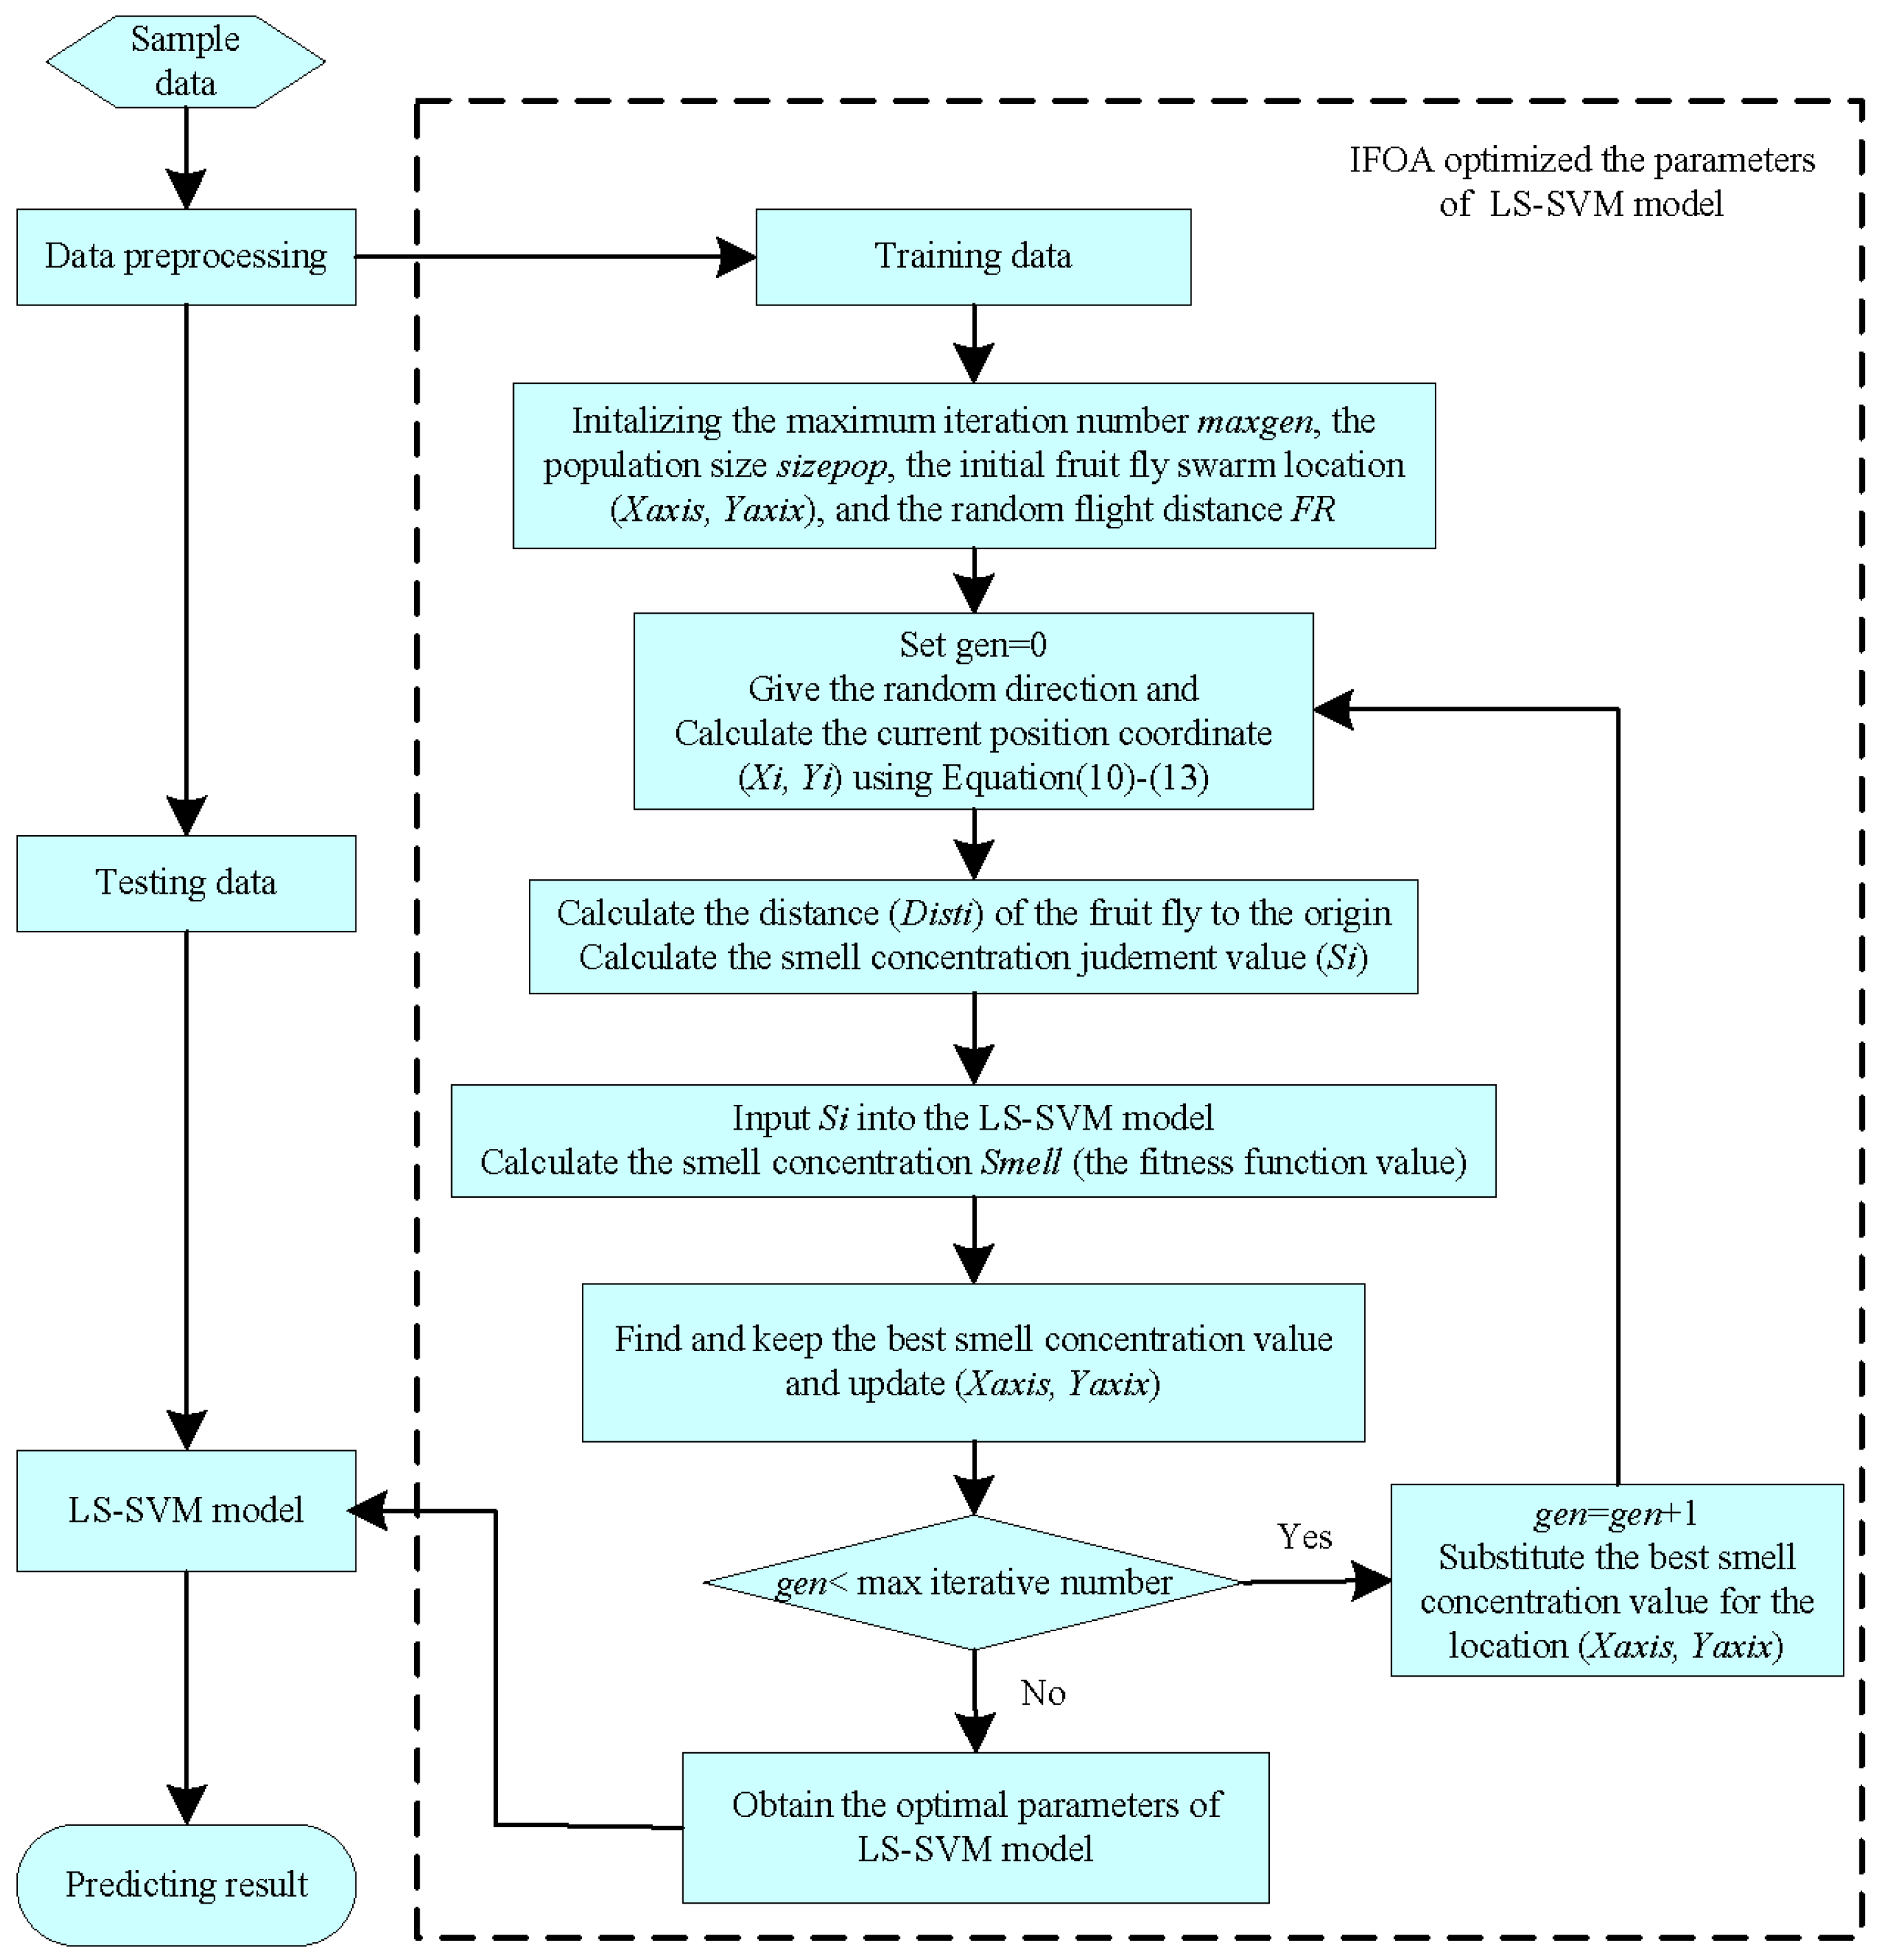
2.2.4. Improved Fruit Fly Optimization Algorithm (IFOA)

For the basic FOA, the fruit fly seeks the food by the pre-set step size. It means that the seeking step size of fruit fly is always fixed. Obviously, under such circumstance, if the seeking step size is larger, which can lead to the wider search space, the global search ability will be strengthened obviously, while its local search ability will be weakened remarkably. On the contrary, the smaller seeking step size will bring about the limited search space. In this case, the FOA easily traps into the local optimum, while its convergence speed is improved. Therefore, we need an appropriate step size, which can well balance the global search capability and the local search capability.
In order to solve this issue, we introduced a novel adaptive step update factor to adjust the seeking distance of fruit fly in each iteration process. The main thought of the improved algorithm is summarized as follows. At the initial stage in the iteration process, assign the fruit fly a bigger step value, which is beneficial to rapidly seek the approximate position of food. Then, at the later phase, assign the fruit fly a smaller step size, which is conducive to accurately converge the target position of food. The following expressions are the step size update mechanism.
w ( i ) = { w max exp [ ln w max w min × ( g M ) a ] , g 1 1 ,   g = 0
D RandValue ( i ) = w ( i ) × ( 2 r a n d 1 )
X i = X axist + D RandValue ( i )
Y i = Y axist + D RandValue ( i )
D i s t i = ( X i 2 + Y i 2 ) 1 / 2
S i = 1 D i s t i
where w ( i ) is the step update factor; w max and w min represent the maximum and minimum of step factor, respectively; g represents the current iteration number and M is the corresponding maximum; a represents the parameter, which is used to regulate the fly location change; D RandValue ( i ) represents the random iteration step; ( X i , Y i ) and ( X axist , Y axist ) denote the current position coordinate and the initial position coordinate at ith fruit fly, respectively; D i s t i is the distance of ith fruit fly to the original point; and S i is the reciprocal of D i s t i , which represents the smell concentration judgment value. The improved algorithm step variations at a = 5 is depicted in Figure 2.
As can be seen, the step gradually decreases with the increasing of g / M from 0 to 1.0. That is to say, in the early stage in the iteration process, the improved FOA has a bigger step size that possesses a slowly reducing rate. In the later phase, the step reaches its minimal size with a rapidly reducing rate.

3. Results and Discussion

3.1. Effect of Process Parameters

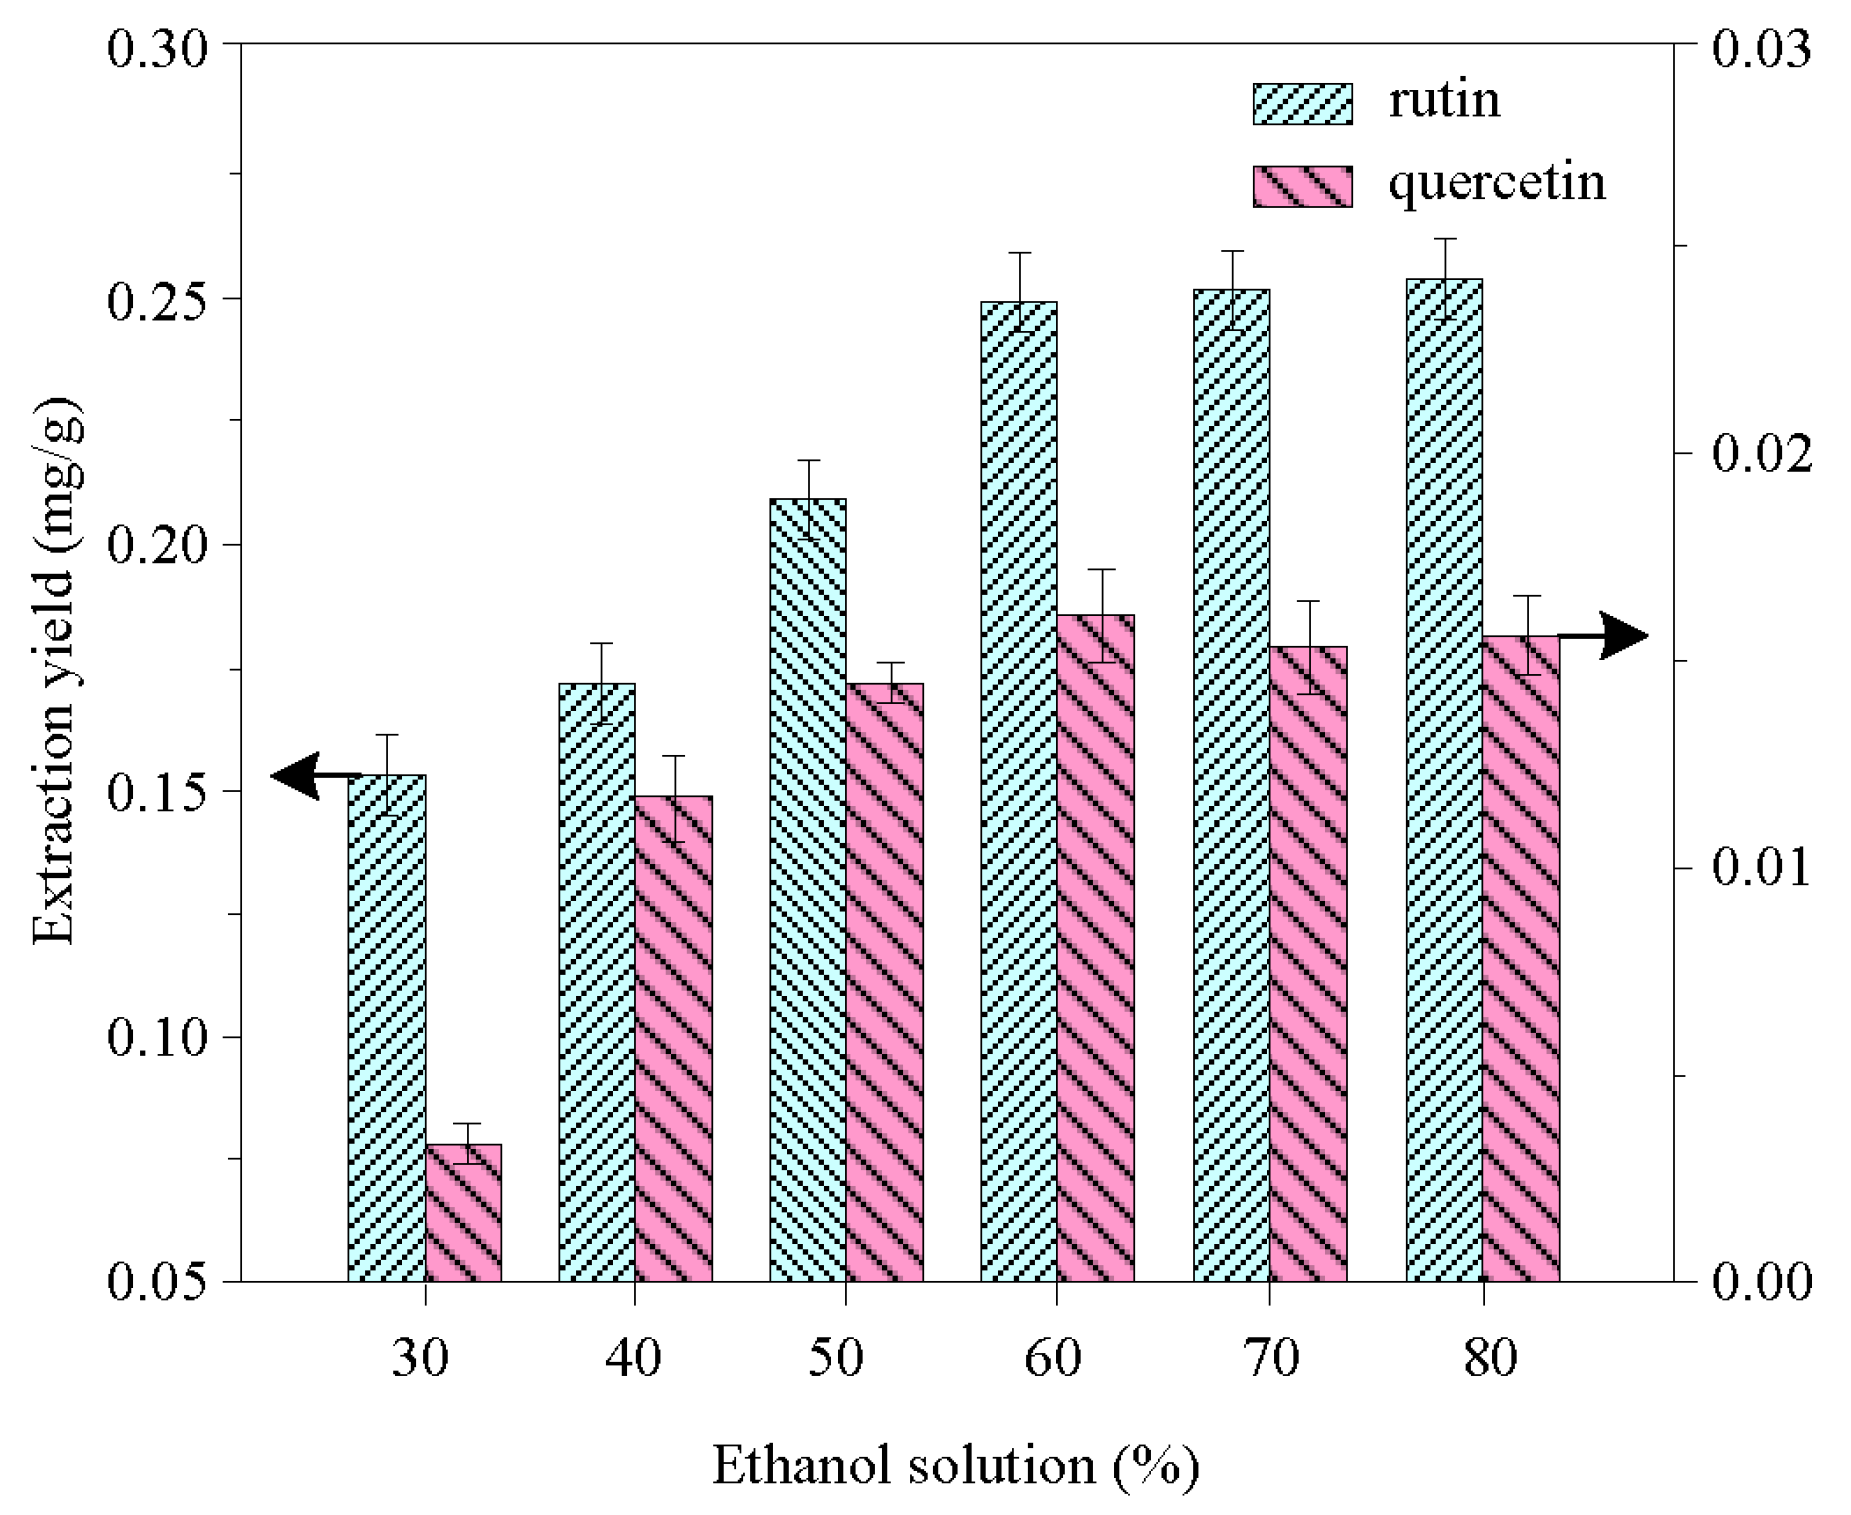
3.1.1. Effect of Concentration of Ethanol Solution

Five different concentrations of ethanol solution (30%, 40%, 50%, 60%, 70%, and 80%) have been used to extract quercetin and rutin from Euonymus alatus (Thunb.) Sieb. All extraction experiments are performed at room temperature for 30 min. The results shown in Figure 3 indicated that the extraction efficiency of quercetin and rutin significantly increased with the increasing concentration of ethanol solution from 30% to 60%. However, little increase in the extraction yields was found when higher concentrations of ethanol solution were applied. Relative polarity is the probable reason. In addition, it may be attributed to strengthened effective swelling of the solid samples in the liquid medium, which is favorable for expanding the surface contact area of solute-solvent [36]. Hence, 60% ethanol solution was used as the following extraction experiments.

3.1.2. Effect of Solvent Volume/Sample Ratio

The influence of solvent volume/sample ratio on the extraction of quercetin and rutin was evaluated. As shown in Figure 4, the extraction yields rapidly increased with the solvent volume/sample ratio increase from 20 to 40 mL/g. In general, more solvent volumes can effectively dissolve more target components, leading to an enhancement of extraction efficiency. However, it was found that there were no significant changes on the extraction yields when the ratios further increased from 40 to 70 mL/g. One of the possible reasons is that ultrasound can promote the establishment of the dissolution equilibrium of the target compounds between the extraction solvent and the cell walls of plant samples, so it is very difficult to recover [37,38]. This result demonstrated that a ratio of 40 mL/g is enough for extraction and is determined as the optimum ratio. A similar result was reported in the earlier literature [10].

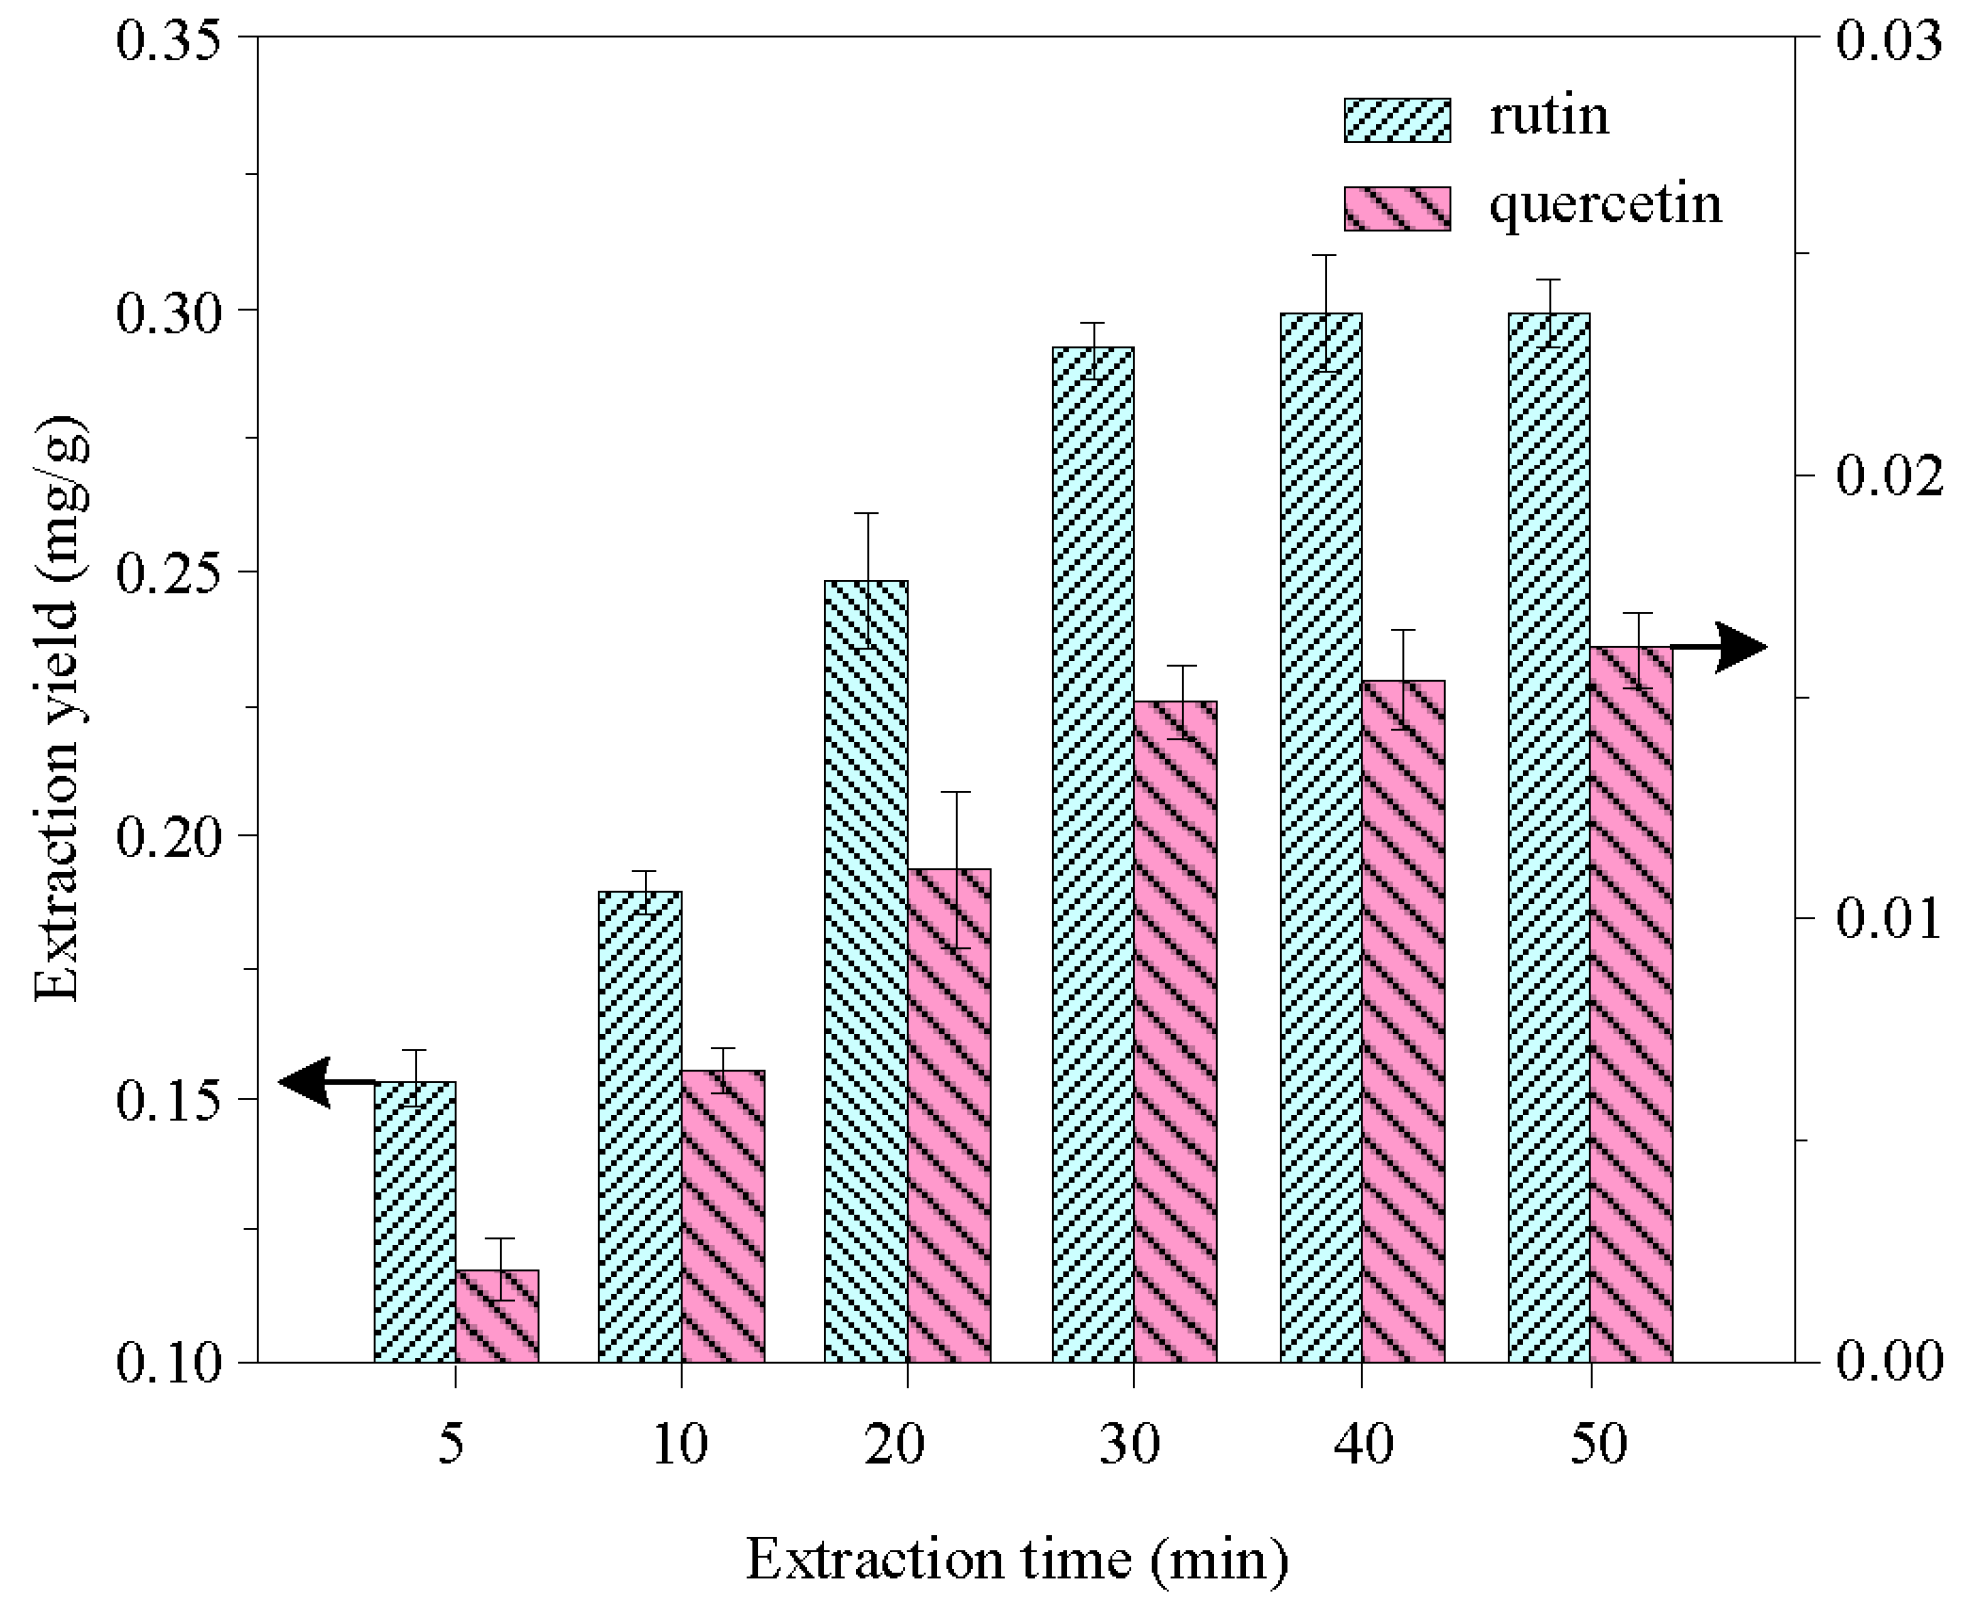
3.1.3. Effect of Extraction Time

Figure 5 shows the influence of extraction time using ultrasound on the extraction yield of quercetin and rutin. As can be seen, extraction time has a prominent influence on the extraction yield of quercetin and rutin. That is, the extraction yield increased rapidly within the first 30 min. Subsequently, by prolonging extraction time from 30 to 50 min, only a slight increase of the extraction yields of quercetin and rutin was found. A possible reason is that ultrasonic wave initially can disrupt rapidly the cell walls, so there is a larger contact area between sample and solvent, which is helpful to improve extraction yield. However, when extraction time is prolonged, the contact area would be decreased on the inner cell walls due to the increasing distance. As a result, there was no significant change in an extended extraction period. Therefore, 30 min is more suitable for the extraction of quercetin and rutin.

3.1.4. Effect of Ultrasonic Power

In this work, the effect of ultrasonic power on the extraction yield of quercetin and rutin was examined under different ultrasonic conditions. The result is shown in Figure 6, which exhibited a positive influence on the extraction of quercetin and rutin with the increase in ultrasonic power from 25 to 200 W. When higher ultrasonic power was applied, however, an obvious yield reduction was observed for ultrasonic power between 200 and 400 W. An explanation for this phenomenon is that suitable ultrasound wave can facilitate the cell walls of target sample to disrupt, also can accelerate the diffusing and dissolving of target components in the liquid medium. However, higher ultrasonic power can weaken the cavitation effect because the cavitation bubbles in this case more likely grow too big to collapse [39,40]. Moreover, excessive cavitation bubbles production can hinder the mass transfer and lead the ultrasound waves to scatter, which weaken the effect of ultrasonic power. As already discussed, to extract quercetin and rutin from Euonymus alatus, the optimum ultrasound power is selected as 200 W.

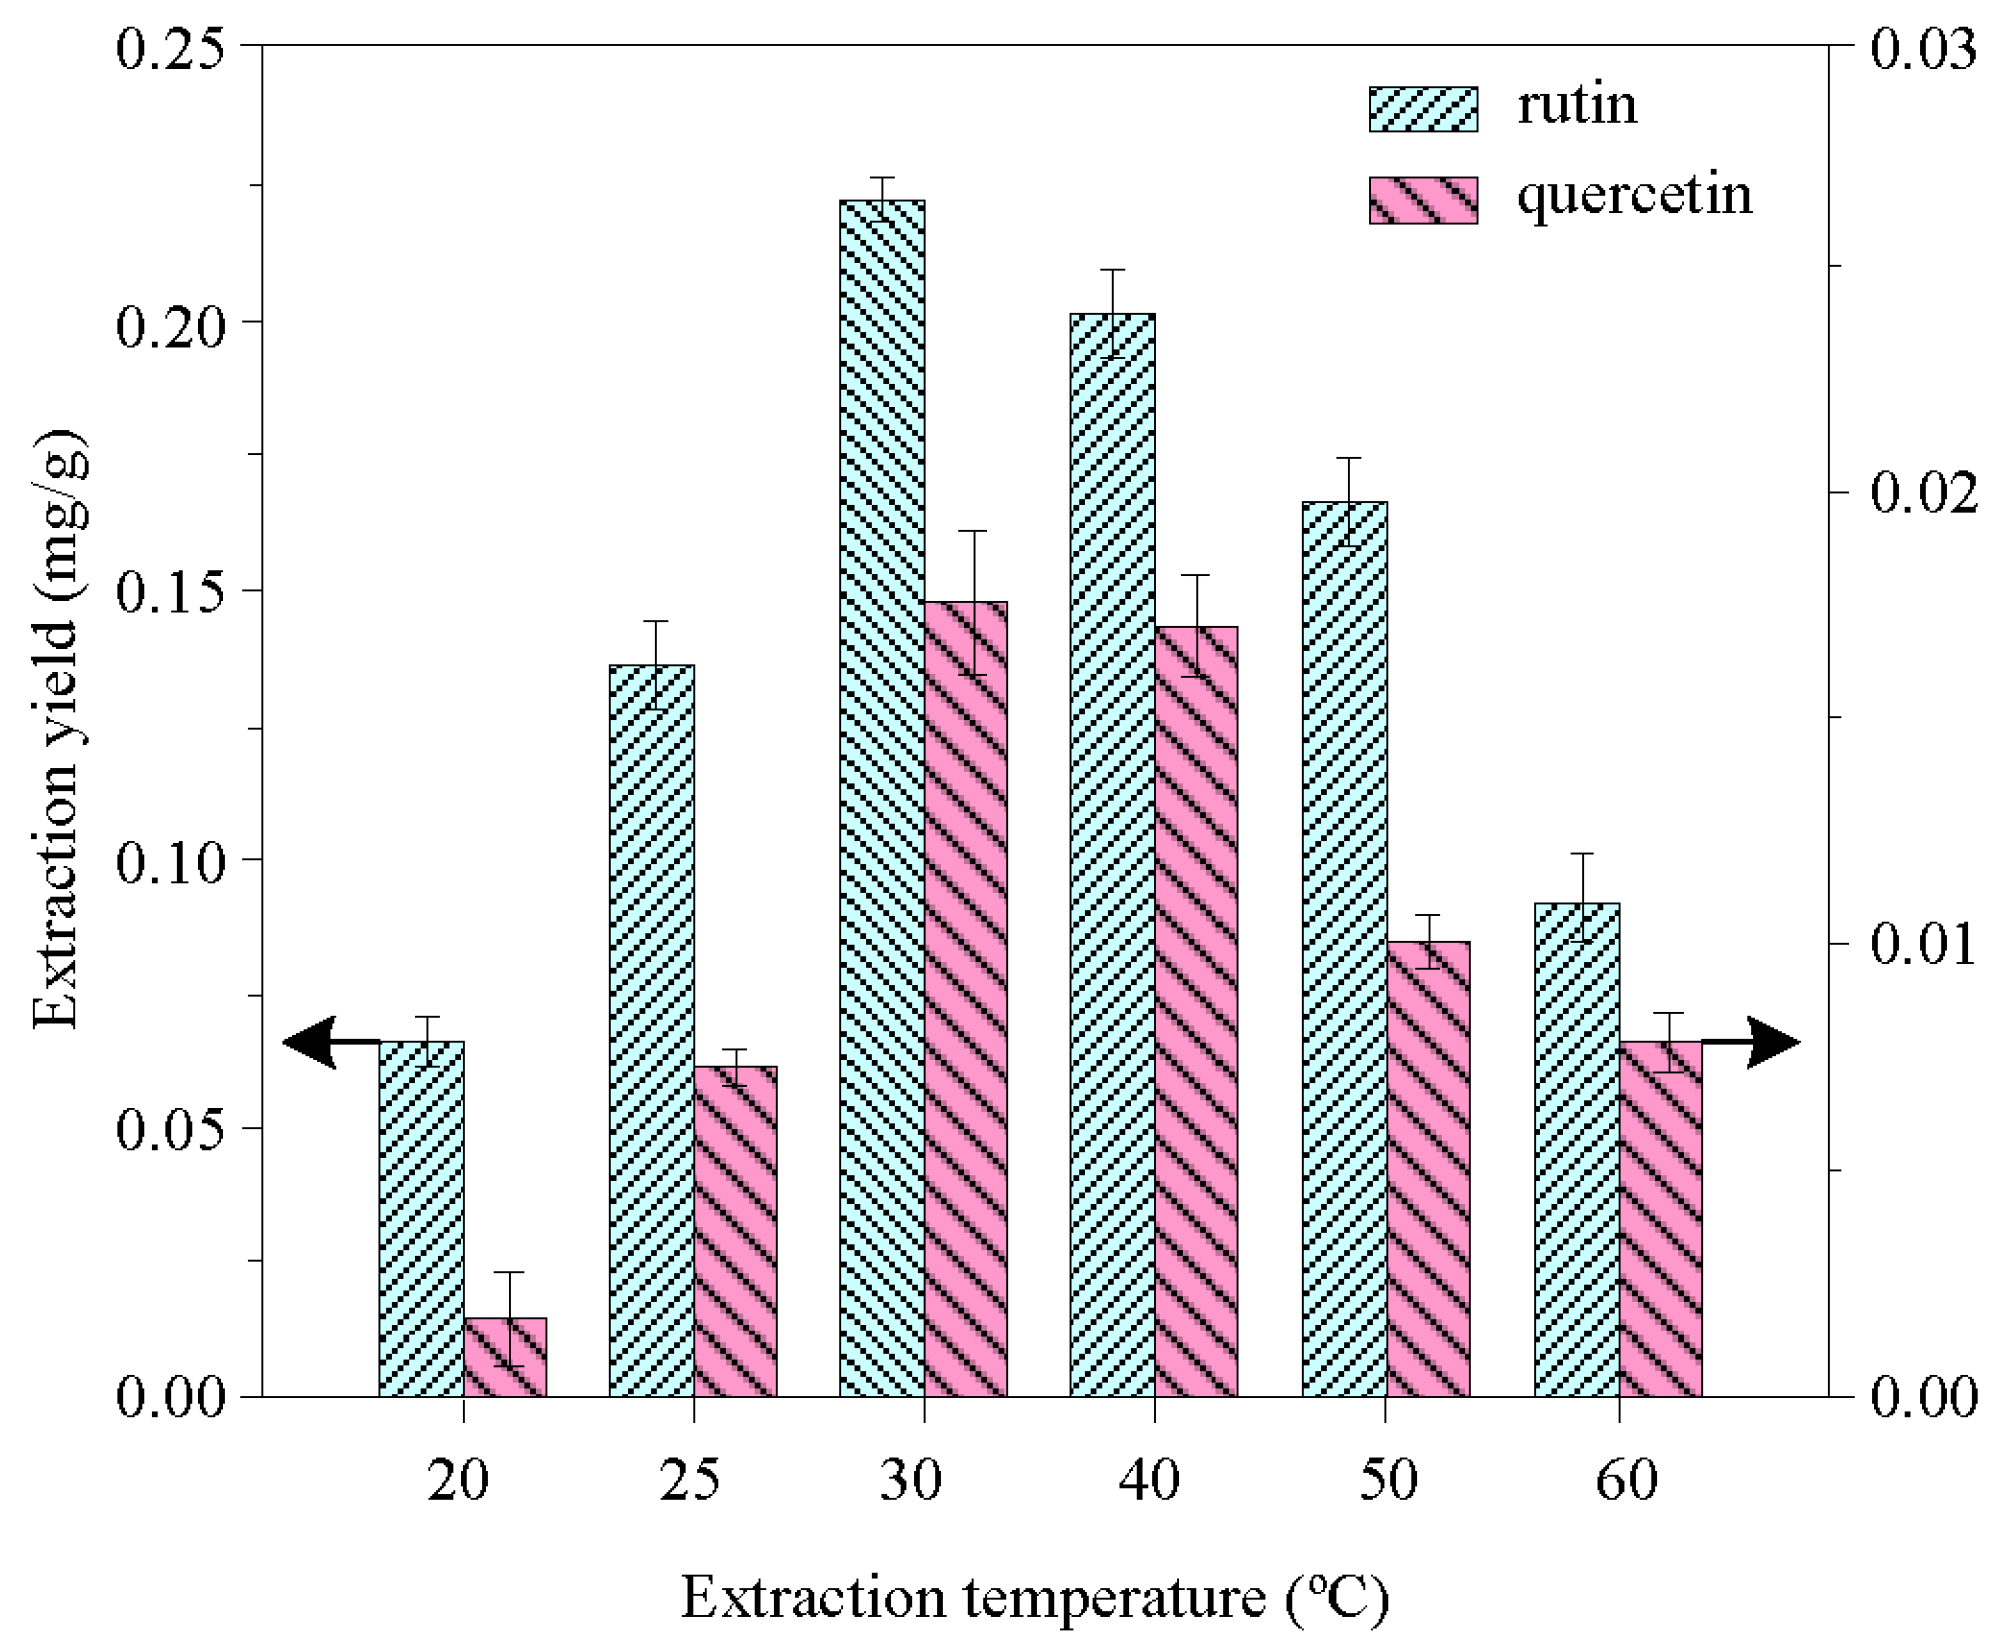
3.1.5. Effect of Extraction Temperature

Figure 7 shows the effects of the different temperatures (i.e., 20, 25, 30, 40 and 50 °C) on the extraction yield of quercetin and rutin. As can be seen, when the extraction temperature changes, a significant change has occurred in the extraction yield. That is, the extraction yield rapidly increased with increasing of temperature from 20 to 30 °C. If a higher temperature was applied, however, the yield obviously decreased. This phenomenon can be explained that higher temperature is not beneficial for ultrasonic-assisted extraction, since high temperature may induce the extracted quercetin and rutin to oxide and decompose during the extraction process. Therefore, extraction temperature is a very sensitive process parameter for the extraction of quercetin and rutin. Through the above analysis, 30 °C is chosen as the optimal extraction temperature.

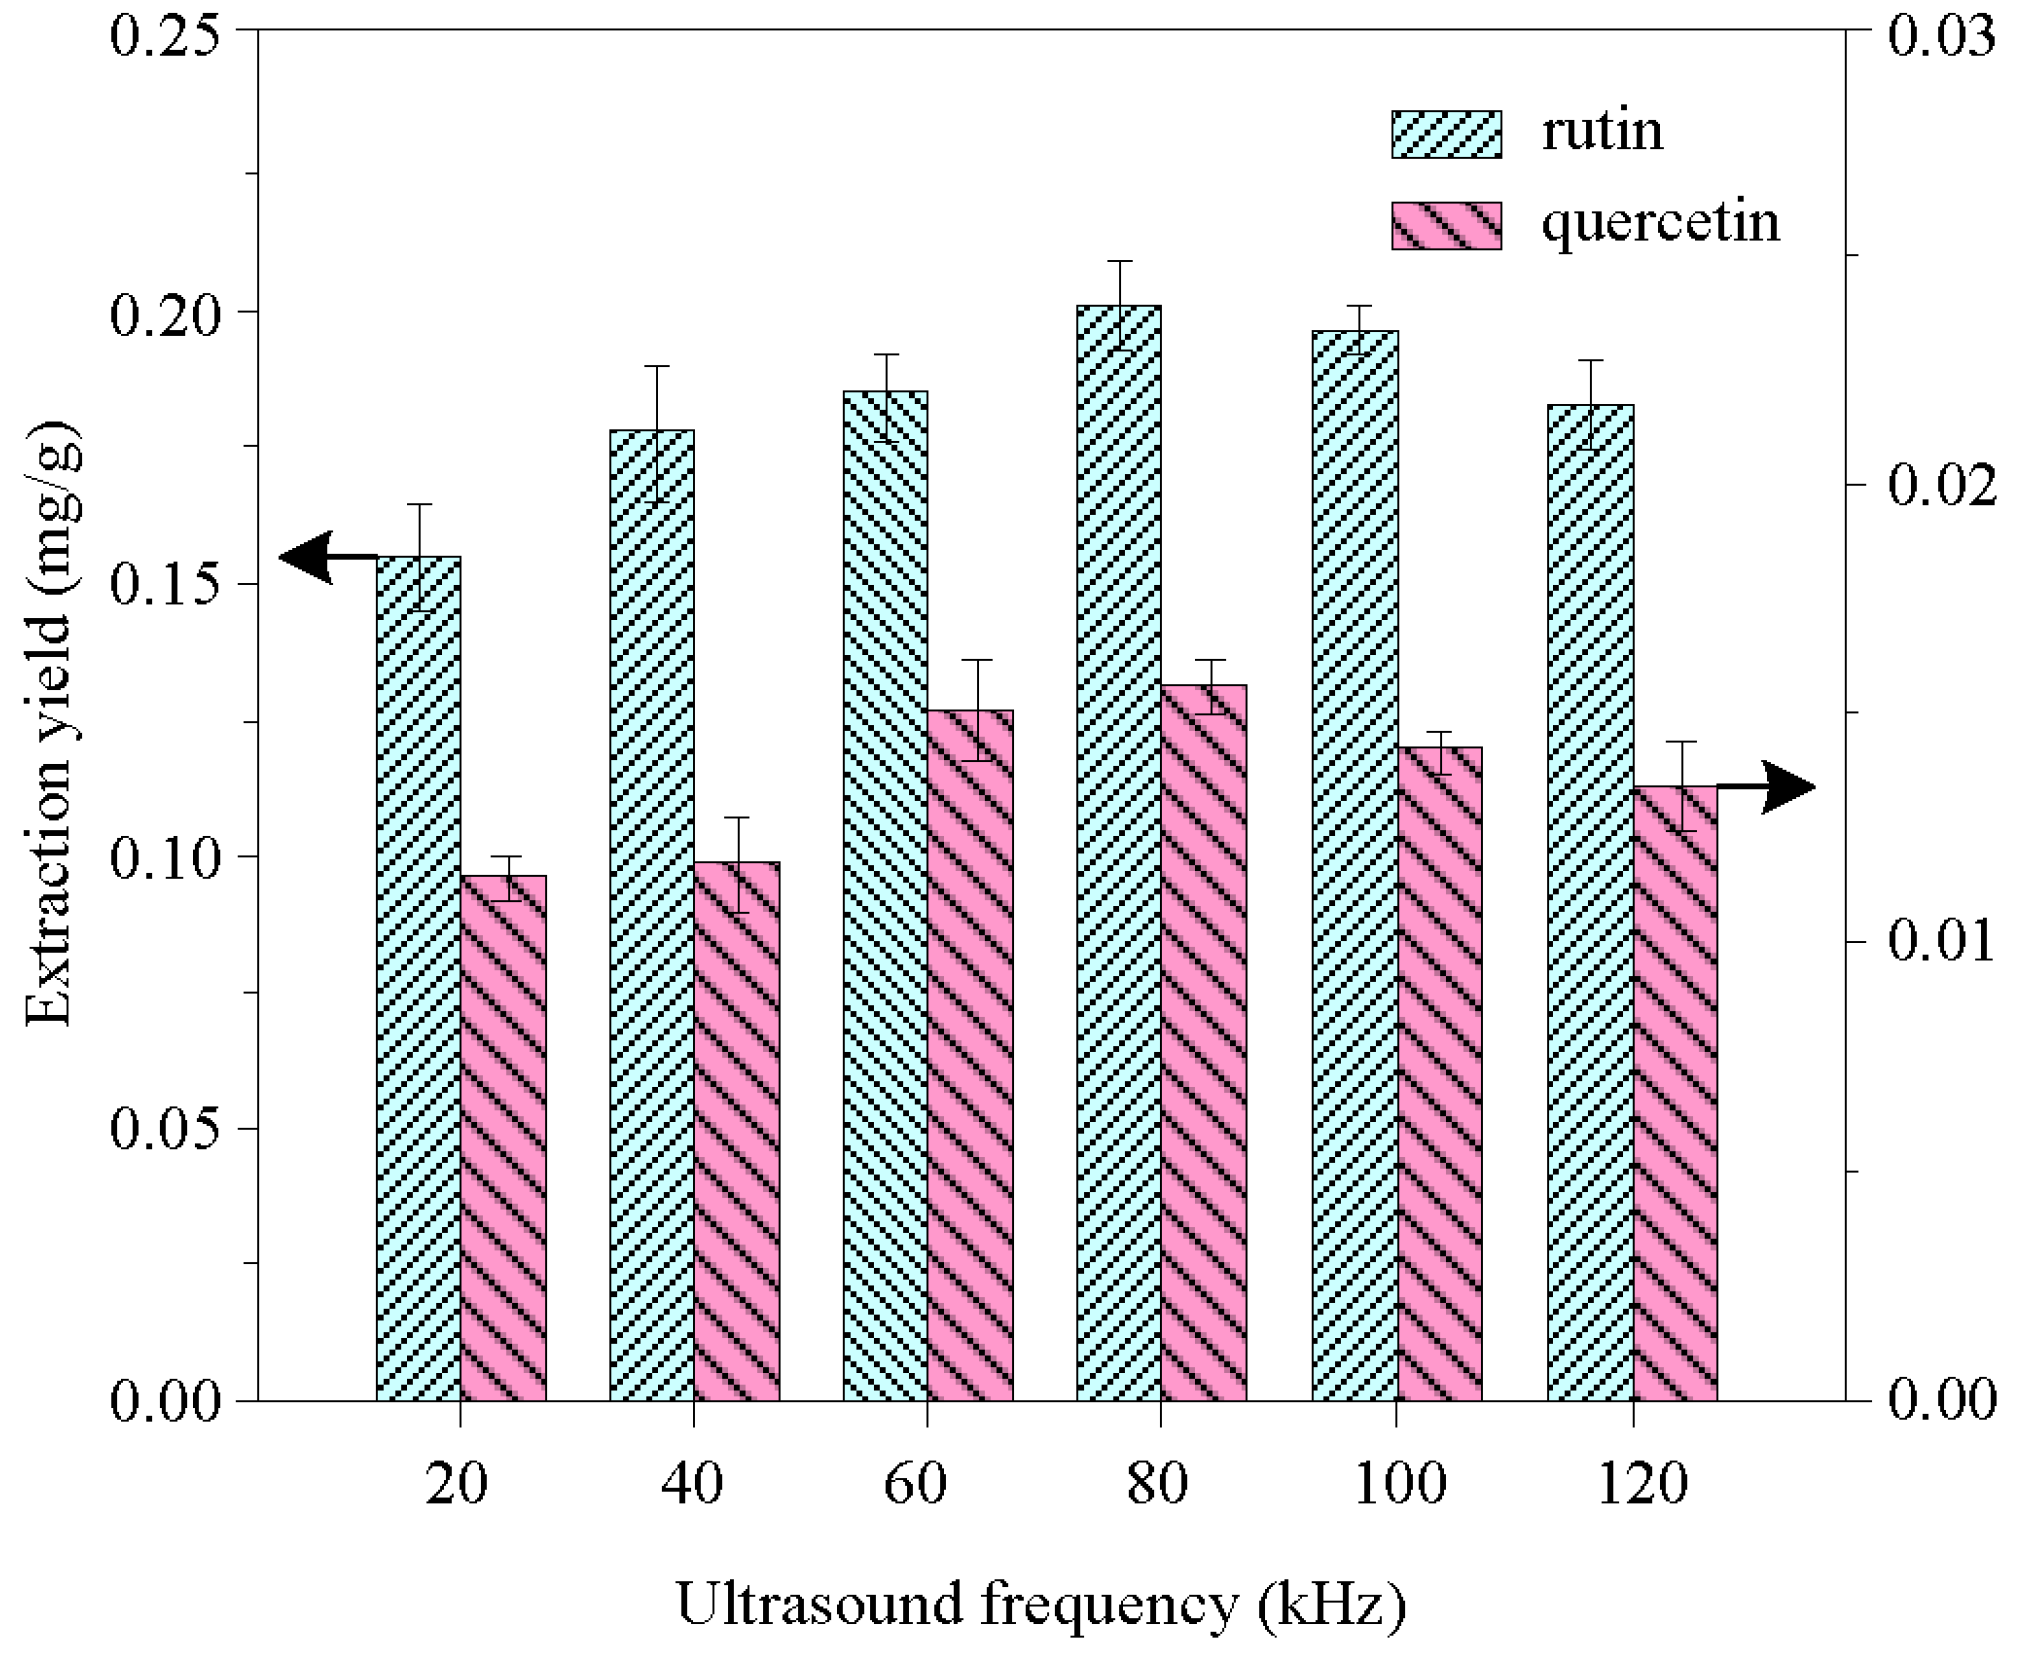
3.1.6. Effect of Ultrasonic Frequency

Besides the aforementioned process parameters, ultrasonic frequency is another important parameter for the UAE of quercetin and rutin in this work. The effect of ultrasonic frequency on the yield of quercetin and rutin was studied. The result is illustrated in Figure 8. As can been seen, similar to other process parameters, the extraction yield is dependent on different ultrasonic frequency. That is, the extraction yield increased with the increase in frequency of 20–80 kHz. Then, it displayed a gradual decrease from 80 to 120 kHz. The possible reason is that ultrasonic frequency of 80 kHz is closer the resonant frequency of the target component cell. Similarly, our previous studies [41,42,43] also found a highest extraction yield at one optimal frequency during the extraction of rutin from Sophora japonica and hesperidin from tangerine peels. Thus, 80 kHz as the optimum ultrasonic frequency is used for the UAE of quercetin and rutin.

3.2. Modeling of UAE Using IFOA-LS-SVM

In this work, the prediction model of the UAE of quercetin and rutin from Euonymus alatus (Thunb.) Sieb was established by the improved FOA optimized LS-SVM model. LS-SVM is more suitable for modeling using limited experimental data since it has higher generalization, more efficient than that of SVM. In order to construct a more practical and accurate IFOA-LS-SVM model for the UAE of quercetin and rutin, in this work, all training data and validating data are selected from the aforementioned experiment data. The extraction time, extraction temperature, ultrasound power, ultrasound frequency, solvent volume/sample ratio and ethanol solution concentration are used as the input of this model, while the rutin yield and quercetin yield are used as the output. The structure diagram for ultrasonic extraction process based on LS-SVM is represented in Figure 9.
To prevent truncation error from experimental data for model developed, all input/output should be normalized to the range [ 1 , + 1 ] using Equations (16) and (17).
x scale = 2 x x min x max x min 1
y scale = 2 y y min y max y min 1
where x scale and y scale are the scaled valves of input and output, respectively; x and y are the actual values of input and output, respectively; x min and x max represent the minimum and maximum actual values of input, respectively; and y min and y max represent the minimum and maximum actual values of output, respectively.
In this work, a total of 60 batches of experimental data are used. Each batch of data represents a complete UAE process. Forty batches of data are used as the training sample to optimize the parameters of LS-SVM and to build the IFOA-LS-SVM model, and the remaining batches of data are used as the testing sample to verify the generalization ability of the model.
The parameters of the IFOA-LS-SVM are set as follows: maxgen (i.e., maximum iteration number) = 200, sizepop (i.e., population size) = 40, ( X axist , Y axist ) (i.e., the initial position coordinate) = (2.5, 2.5), the random flight distance range FR⊂[−15, 15], and step length = 2, a = 5. All mentioned calculations are performed by means of Matlab program (Mathworks, Natick, MA, USA). The LS-SVM toolbox (LS-SVM v 1.5, Suykens, Leuven, Belgium) is utilized to derive all models under the Windows 7 operating system using a high-performance (Lenovo Co., Beijing, China).
In the LS-SVM model, the two key parameters of “γ” and “σ2” are optimized by the IFOA. By iterative evolution, the IFOA continuously adjusts these two parameters until the optimum values of parameters are obtained. The procedure diagram of the IFOA-LS-SVM model is illustrated in Figure 10.
After optimizing processes, the values of “γ” and “σ2” were obtained (Table 1). Based on the optimized parameters, we established a new optimum LS-SVM model and predicted the training set and the generalization set for the extraction of quercetin and rutin. Finally, comparison diagrams between the predicting value and the experimental value are drawn to validate the performance of the proposed model.

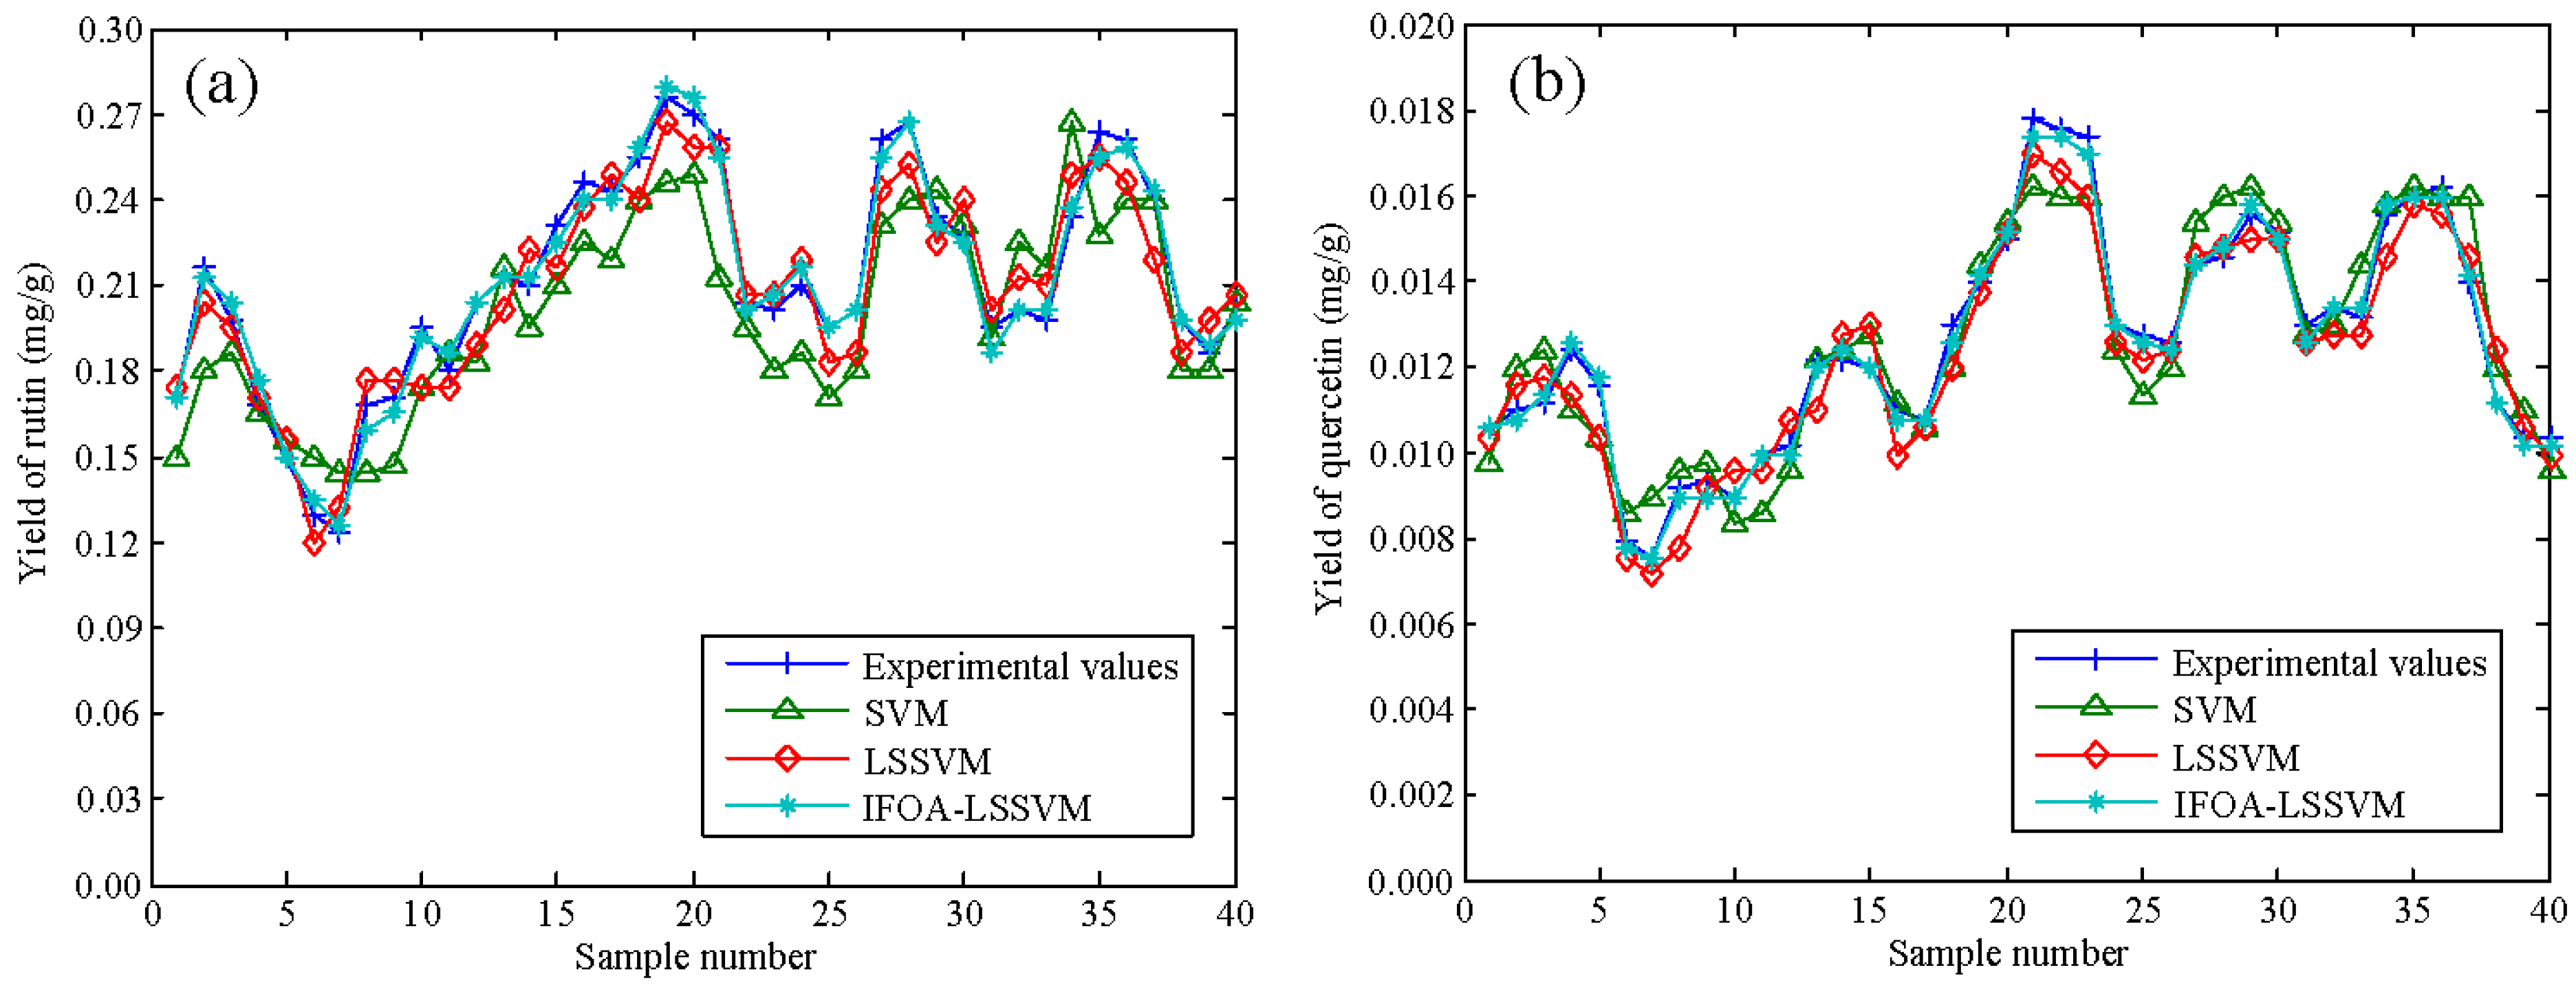
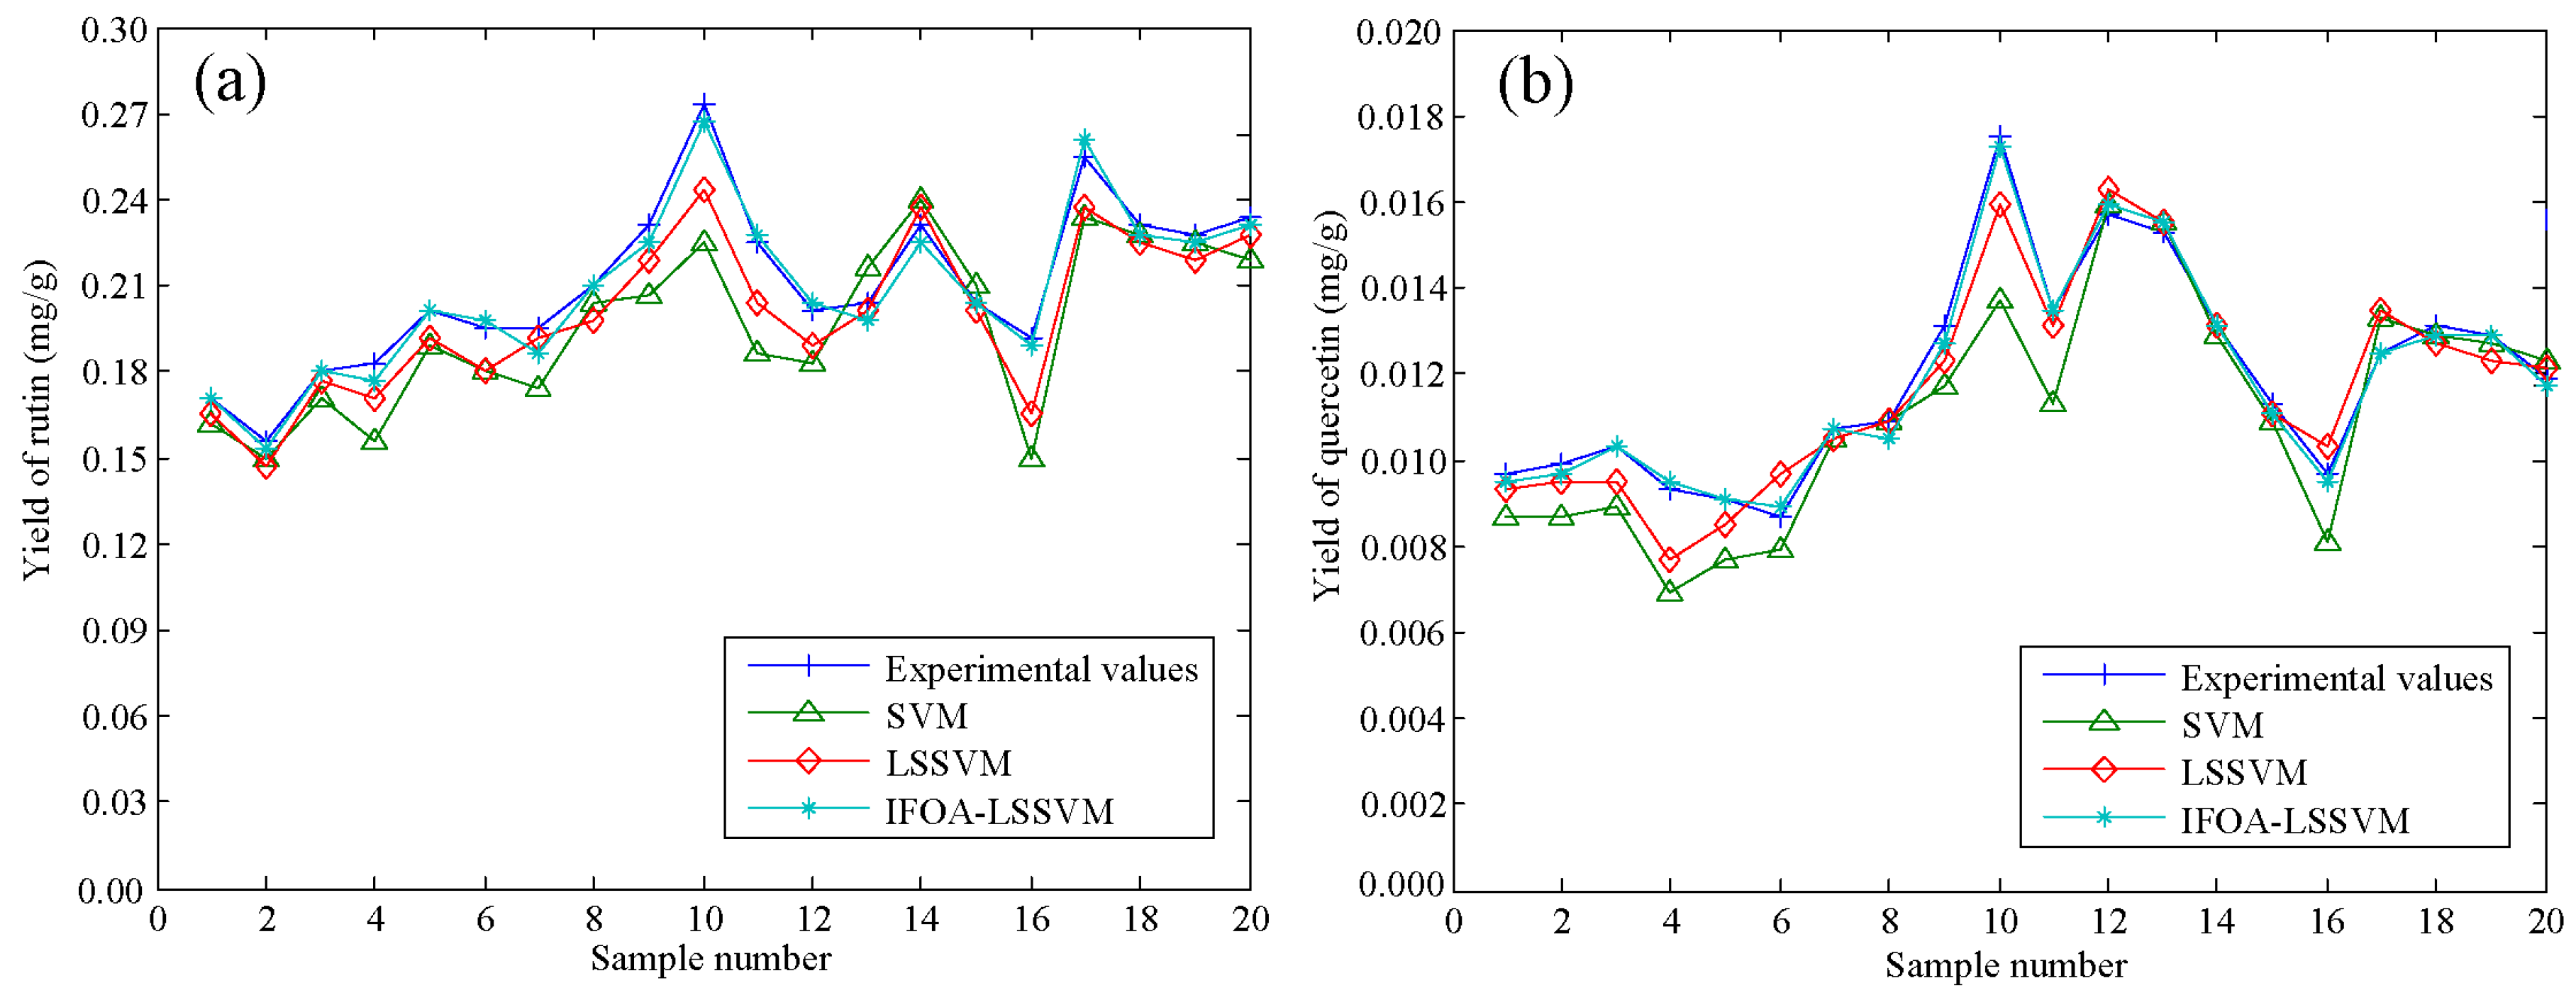
3.3. Prediction and Comparstion of between SVM, LS-SVM and IFOA-LS-SVM Models

To evaluate the prediction accuracy of the IFOA-LS-SVM model, the difference between the target values (i.e., the values of extraction yield of quercetin and rutin) and the predicted values (i.e., the actual output of the model) is considered as the error, and is represented in different ways. In this work, four measures, the mean relative error (MRE), the root of mean square error (RMSE), the mean absolute error (MAE) and Theil’s inequality coefficient (TIC), are employed for model evaluation. They expresses are defined as follows.
M R E = 1 n i = 1 n | y i y ^ i | y i × 100 %
M A E = 1 n i = 1 n | y i y ^ i |
R M S E = 1 n i = 1 n ( y i y ^ i ) 2
T I C = 1 n i = 1 n ( y i y ^ i ) 2 i = 1 n y i 2 + i = 1 n y ^ i 2
where ŷi and yi denote the predicted values of model and actual values, respectively; and n represents the total number of samples. RMSE, MRE and MAE are used to assess the prediction accuracy of model. TIC is applied for evaluating the fitness of model.
To compare the predicting effect of extraction yield of quercetin and rutin, the SVM model and LS-SVM model are employed as the comparison basis. The prediction results of three models on the testing dataset are listed in Table 2.
As can be seen, the prediction performance of IFOA-LS-SVM model is superior to other two models. That is, for rutin, the SVM model gave a RMSE of 0.1268, an MRE of 3.87%, an MAE of 0.0998 and a TIC of 0.0082; the LS-SVM model obtained a RMSE of 0.1035, an MRE of 1.88%, an MAE of 0.0566 and a TIC of 0.0028; and the IFOA-LS-SVM model obtained a RMSE of 0.0540, an MRE of 1.05%, an MAE of 0.0189 and a TIC of 0.0014. For quercetin, the SVM model obtained a RMSE of 0.1204, an MRE of 3.99%, an MAE of 0.0965 and a TIC of 0.0080; the LS-SVM model obtained a RMSE of 0.0997, an MRE of 2.05%, an MAE of 0.0557 and a TIC of 0.0030; and the IFOA-LS-SVM model gave a RMSE of 0.0536, an MRE of 0.97%, an MAE of 0.0183 and a TIC of 0.0013. Rutin and the MRE (%) indicator were chosen as illustration: comparing with that of SVM model and LS-SVM model, the predictive error of IFOA-LS-SVM model decreased 72.9% and 44.1%, respectively, which suggests the proposed IFOA-LS-SVM model has higher prediction accuracy for the extraction yield of rutin during the UAE process. For quercetin, a similar result was also found.
A visual comparison between the prediction outputs and the experimental values are also depicted in Figure 11. As can be seen, compared with the SVM model and LS-SVM model, the prediction values of IFOA-LS-SVM model were closer to the experimental values and the errors of the IFOA-LS-SVM model were less than those of the SVM model and LS-SVM model. That is, the prediction performance of the proposed IFOA-LS-SVM model surpasses other two models in term of predicting the extraction yields of quercetin and rutin from Euonymus alatus (Thunb.) Sieb.
To further prove the IFOA-LS-SVM model having a good universality for the prediction of extraction yield, the prediction result of different models on generalization dataset are also listed in Table 3. As we can see, the SVM model obtained a RMSE of 0.1192, an MRE of 3.81%, an MAE of 0.0798 and a TIC of 0.0049; the LS-SVM model gave a RMSE of 0.0903, an MRE of 2.05%, an MAE of 0.0466 and a TIC of 0.0023; the IFOA-LS-SVM model obtained a RMSE of 0.0596, an MRE of 0.97%, an MAE of 0.0224 and a TIC of 0.0011. For quercetin, the SVM model gave a RMSE of 0.1008, an MRE of 3.86%, an MAE of 0.0776 and a TIC of 0.0045; the LS-SVM model obtained a RMSE of 0.0889, an MRE of 2.78%, an MAE of 0.0425 and a TIC of 0.0020; the IFOA-LS-SVM model gave a RMSE of 0.0612, an MRE of 0.99%, an MAE of 0.0231 and a TIC of 0.0014. In order to clearly illustrate comparative results, the MRE (%) indicator and rutin are chosen as illustration. As can be seen, comparing with those of the SVM model and LS-SVM model, the predictive errors of IFOA-LS-SVM decreased 74.5% and 52.7%, respectively.
Meanwhile, the visual comparison illustrations for the two analytes are shown in Figure 12. As can be seen, the IFOA-LS-SVM model has fewer estimation errors compared to the SVM model and LS-SVM model. Similar to the testing dataset, the comparison result on generalization dataset suggests that the proposed IFOA-LS-SVM model also has good universality ability. In conclusion, the proposed IFOA-LS-SVM model has a good prediction performance for the yield prediction of quercetin and rutin from Euonymus alatus (Thunb.) Sieb.

3.4. Comparison between IFOA-LS-SVM Model and MR Model

In order to further compare the prediction ability of the proposed model, a classic multiple regression (MR) analysis was employed for the determination of the empirical relationships for estimation of target extract yield. Due to similar extraction characteristics between quercetin and rutin, to simplify the modeling process, the extraction process of quercetin was selected as the only study object in this study.

3.4.1. MR Model

Multiple regression is a time-honored technique, which is used to predict the variance in an interval dependent according to linear combinations of dummy independent variables, dichotomous or interval [44]. Generally, multiple regression aims to learn about the relationship between a dependent variable and several independent variables. The general equation of multiple regression is expressed as follows [45,46].
y = i = 1 n a i X i + c
where n represents the number of dependent variables, a represents the regression coefficient, X represents the independent variable, and c is a constant which represents the regression line intercept.
To establish the predictive model of multiple regression with the process parameters obtained from Section 3.1, the experimental data were tested and used as the basic statistics. For characterizing the variation of extraction yield of quercetin used as an independent value, the SPSS Version 22.0 (2015) package was used to calculate the descriptive statistics such as mode, median, standard deviation, minimum, maximum, mean, and so on.
Multiple regression analysis was performed to correlate the measured extraction yield of quercetin to six extraction parameters, i.e., X1, extraction time; X2, extraction temperature; X3, ultrasound power; X4, ultrasound frequency; X5, solvent volume/sample ratio; and X6, ethanol solution concentration (Table 4). Multiple regression models to predict extraction yields of quercetin and rutin were given below.
y = 0.236 X 1 0.685 X 2 0.198 X 3 + 0.702 X 4 + 0.225 X 5 0.663 X 6 12.146
where y represents the extraction yield of quercetin.

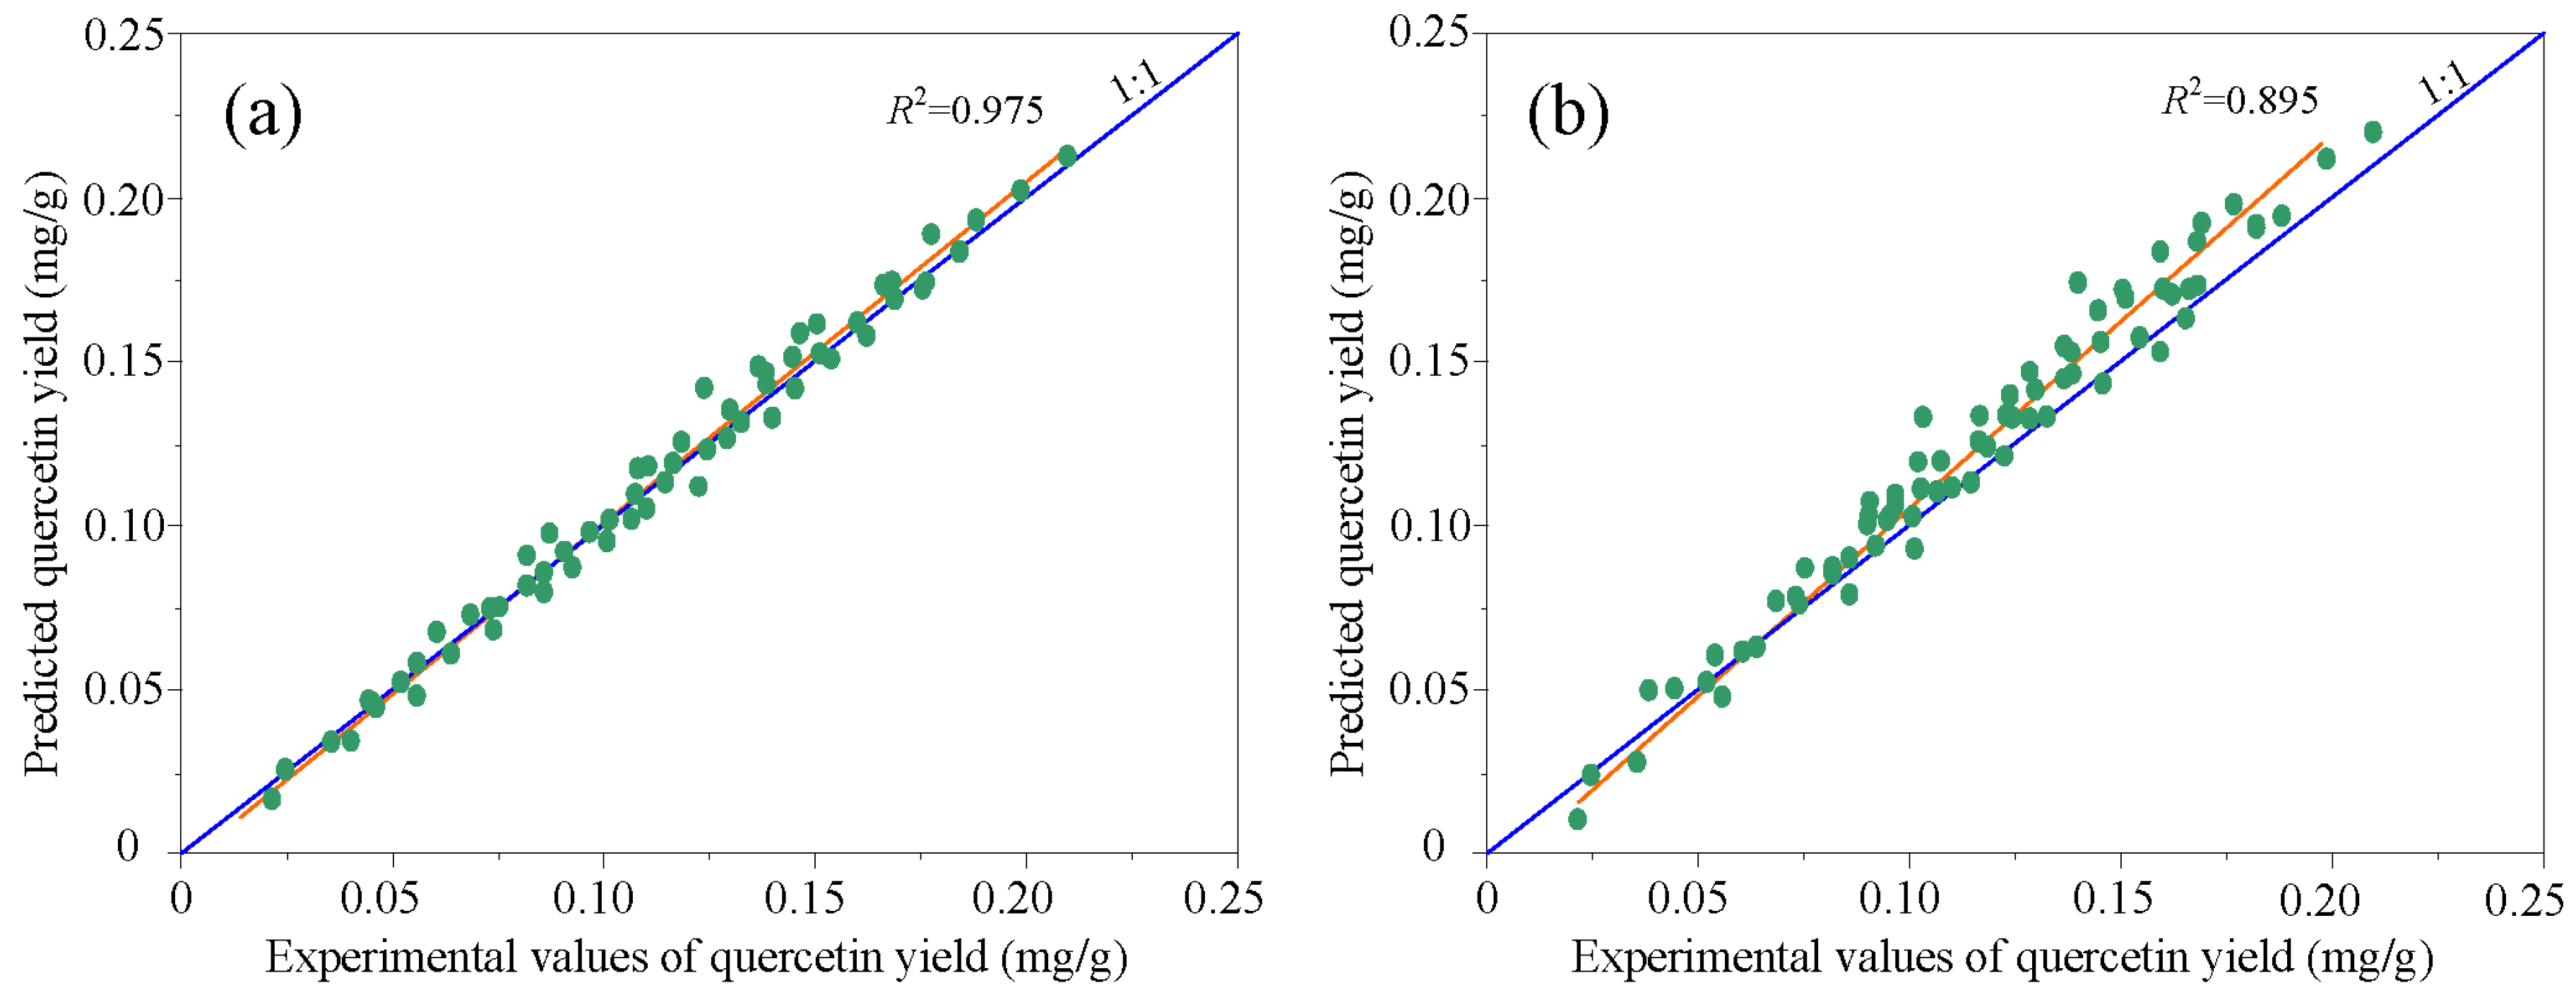
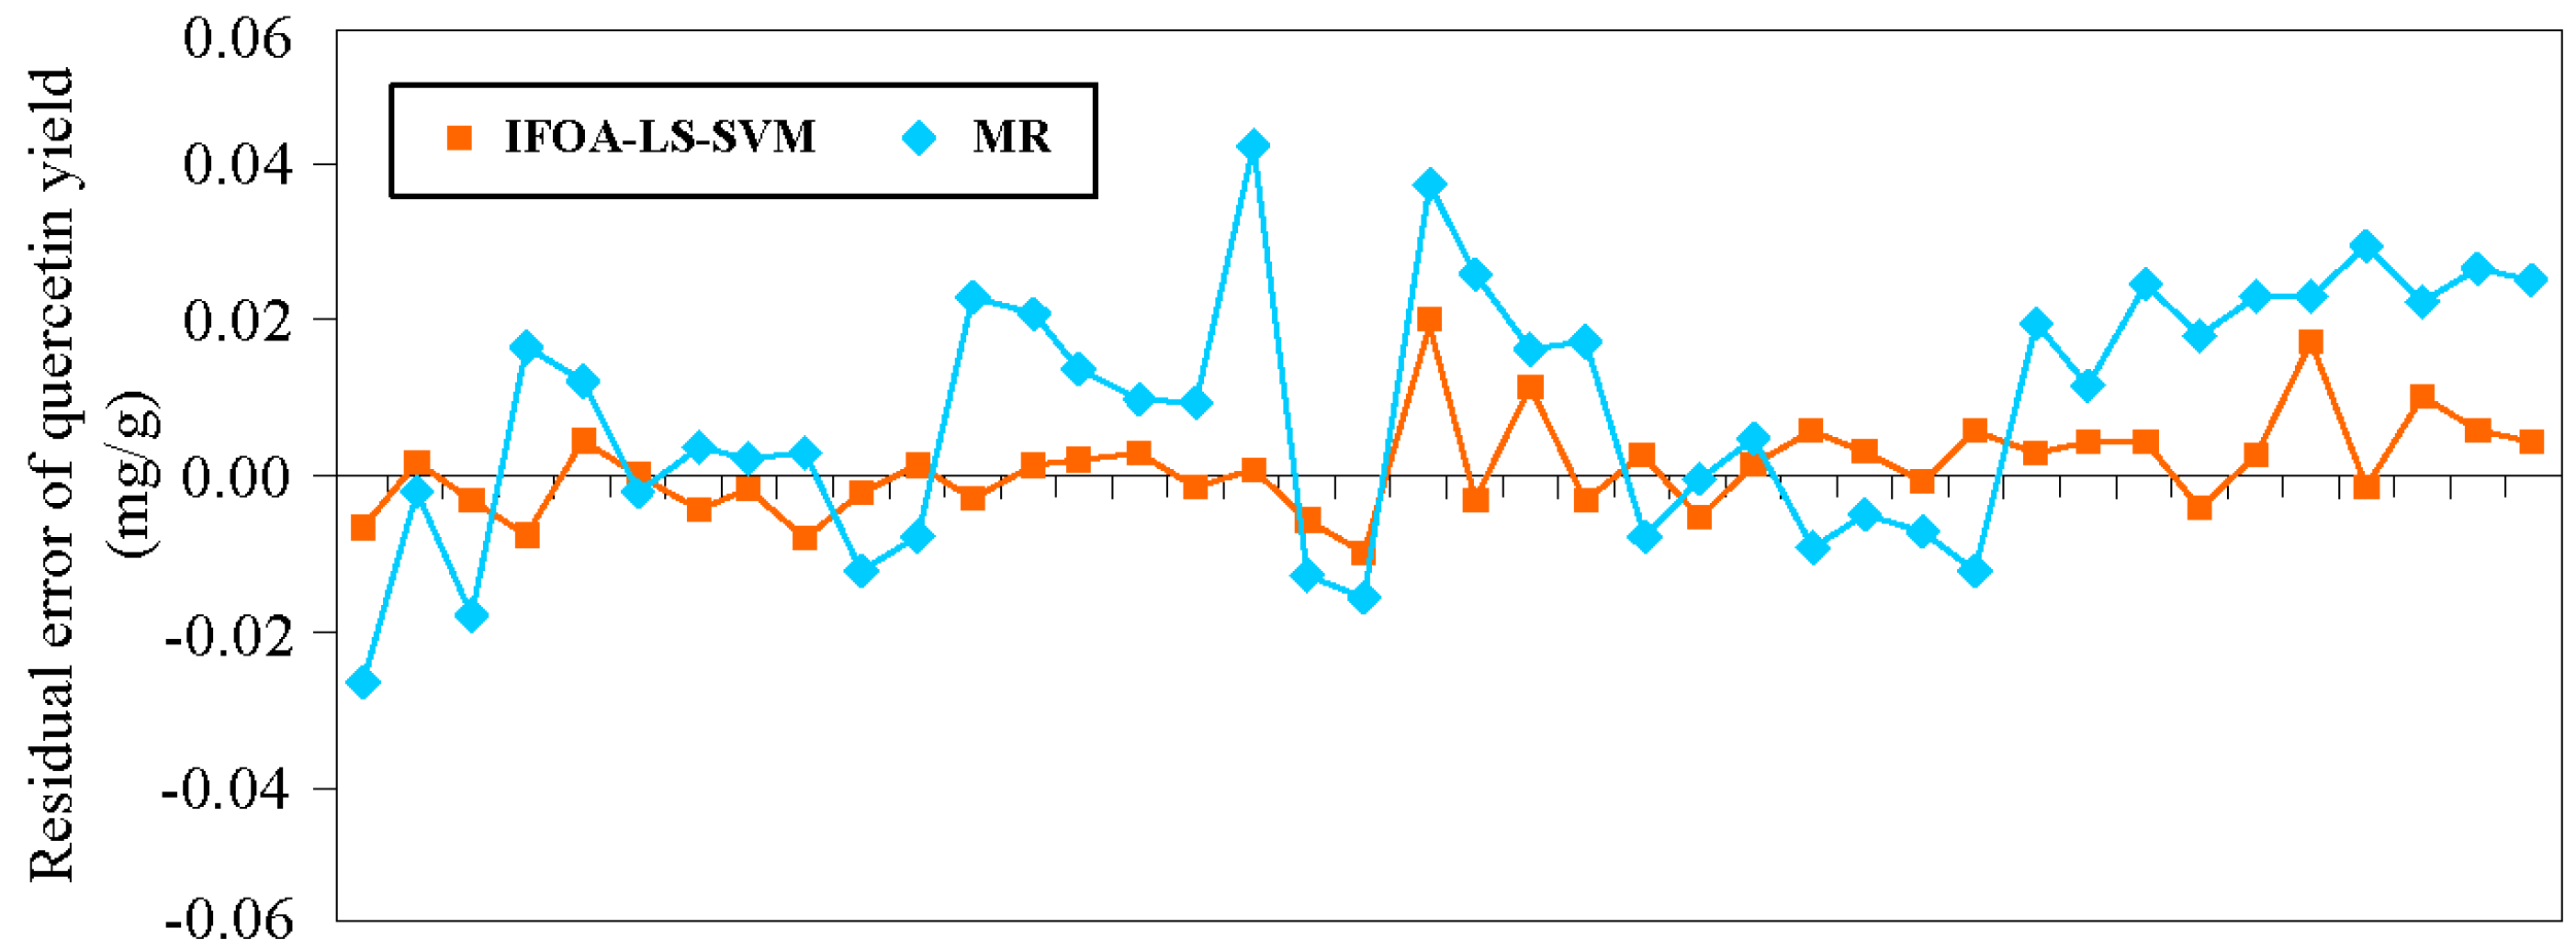
3.4.2. Performance Comparison of IFOA-LS-SVM Model and Multiple Regression Model

In order to compare the prediction performance of these two models, a good indicator, the coefficient of correlation between predicted and experimental values, was used in this study. The relationships between predicted and experimental values obtained from the IFOA-LS-SVM model and MR model for the extraction yield of quercetin are shown in Figure 13. As can been seen, the IFOA-LS-SVM model and MR model have good correlation coefficients with R2 = 0.975 and R2 = 0.895, respectively. It indicated that the IFOA-LS-SVM model has a uniform and very small deviation from the quadrant line, which revealed its excellent predictive ability in comparson with MR model for the extraction yield of quercetin.
To show the deviations from the experimental values of quercetin yield, the distances between the predicted values from IFOA-LS-SVM and MR models and the experimental values were also calculated and are plotted in Figure 14.
The graphic showed that the deviation interval (from −0.01 to 0.0198 mg/g) of the predicted values from IFOA-LS-SVM model was much smaller than that obtained from MR model (from −0.032 to 0.045 mg/g). The results indicated that IFOA-LS-SVM model has higher prediction performance compared to MR model.

3.5. Comparison of Training-Time between IFOA-LS-SVM Model and MR, SVM, LS-SVM Models

In order to further demonstrate the advantage of IFOA-LS-SVM model in terms of training-time, comparisons of the values of training-time for the MR, SVM, LS-SVM and IFOA-LS-SVM models were listed in Table 5.
As can be seen, the training-time value of IFOA-LS-SVM model was 2.298 s, which was much shorter than that obtained by MR and SVM models (which were 16.863 and 27.652 s, respectively), as well as shorter than that obtained by LS-SVM model (which was 3.247 s). It indicated that the improved fruit fly optimization algorithm by optimizing the model parameters can speed up the training speed of LS-SVM model and therefore can shorten the training-time of model.
In conclusion, compared to MR, SVM and LS-SVM models, the IFOA-LS-SVM model has highest prediction accuracy with very narrow deviations between the predictive values and experimental values, as well as a shortest training-time, which outperforms the MR, SVM and LS-SVM models in the UAE process forecasting. Furthermore, the proposed model can enormously save resources and manpower by reducing the number of essential experiments. Despite the advantages of the proposed model, few studies have reported to modeling for the UAE process by reducing the number of experiments. Therefore, the proposed model is a hopeful and useful approach to accelerate and enhance the UAE process for different nature products.

4. Conclusions

The extraction of quercetin and rutin from the stalks of Euonymus alatus (Thunb.) Sieb using ultrasound was investigated. Effects of six process parameters (i.e., extraction time, extraction temperature, ultrasound power, ultrasound frequency, solvent volume/sample ratio and ethanol solution concentration) on extraction yields of quercetin and rutin were evaluated. It was found that all process parameters significantly affected the extraction of quercetin and rutin. Meanwhile, optimal extraction conditions were determined as follows: ethanol solution 60%, extraction time 30 min, solvent volume/sample ratio 40 mL/g, ultrasonic power 200 W, extraction temperature 30 °C and ultrasonic frequency 80 kHz. Taking into account the complex nature of the UAE process, conventional kinetic models are hardly developed. In this work, a hybrid model based on IFOA in combination with LS-SVM was proposed. The prediction performance of the proposed model had been validated by the testing and generalization data gotten from the laboratory. Four error indicators and two visual comparison illustrations between the prediction values and the experimental values were successfully applied for evaluating the prediction accuracy of the IFOA-LS-SVM model. Moreover, the predicting results also were compared with the SVM model and LS-SVM model in detail. The IFOA-LS-SVM model successfully predicted the extraction yields of quercetin and rutin with MRE of 0.97% and 1.05%, respectively, and MAE of 0.0183 and 0.0189, respectively, which are more accurate than those of the SVM and LS-SVM model. Additionally, a classic MR model established in this work was also used for comparing with the proposed model. Results indicated that the proposed model has a good fitness to experimental values, which proved its effectiveness and accuracy for the prediction yield of analytes in UAE process.

Acknowledgments

The authors wish to thank the Natural Science Foundation of Fujian Province of China (2015J01661), and the Natural Science Foundation of China (309716899; 61302177) for the support of this study.

Author Contributions

Jianqing Liao and Baida Qu proposed the idea for this research work; Jianqing Liao conceived and designed the experiments; Baida Qu performed the experiments; and Jianqing Liao and Nan Zheng wrote the MATLAB code and the paper.

Conflicts of Interest

The authors declare no conflict of interest.

References

  1. Chaudhuri, S.; Banerjee, A.; Basu, K.; Sengupta, B.; Sengupta, P.K. Internation of flavonoids with red blood cell membrane lipids and proteins: Antioxidant and antihemolytic effect. Int. J. Biol. Macromol. 2007, 41, 42–48. [Google Scholar] [CrossRef] [PubMed]
  2. Jiang, P.; Burczynski, F.; Campbell, C.; Pierce, G.; Austria, J.A.; Briggs, C.J. Rutin and flavonoid contents in three buckwheat species Fagopyrum esculentum, F. tataricum, and F. homotropicum and their protective effects against lipid perocidation. Food Res. Int. 2007, 40, 356–364. [Google Scholar] [CrossRef]
  3. Kado, Y.; Atobe, M.; Nonaka, T. Ultrasonic effects on electroorganic processes–Part 20. Photocatalytic oxidation of aliphatic alcohols in aqueous suspension of TiO2 powder. Ultrason. Sonochem. 2001, 8, 69–74. [Google Scholar] [CrossRef]
  4. Morgan, A.B.; Harris, J.D. Effects of organoclay Soxhlet extraction on mechanical properties, flammability properties and organoclay dispersion of polypropylene nanocomposites. Polymer 2003, 44, 2313–2320. [Google Scholar] [CrossRef]
  5. Hawthorne, S.B.; Grabanski, C.B.; Martin, E.; Miller, D.J. Comparisons of Soxhlet extraction, pressurized liquid extraction, supercritical fluid extraction and subcritical water extraction for environmental solids: Recovery, selectivity and effects on sample matrix. J. Chromatogr. A 2002, 892, 421–433. [Google Scholar] [CrossRef]
  6. Paganga, G.; Miller, N.; Rice-Evans, C.A. The polyphenolic content of fruit and vegetables and their antioxidant activities. What does a serving constitute. Free Radic. Res. 1999, 30, 153–162. [Google Scholar] [CrossRef] [PubMed]
  7. Gao, M.; Song, B.Z.; Liu, C.Z. Dynamic microwave-assisted extraction of flavonoids from Saussurea medusa Maxim cultured cells. Biochem. Eng. J. 2006, 32, 79–83. [Google Scholar] [CrossRef]
  8. Chen, G.; Zhang, H.; Ye, J. Determination of rutin and quercetin in plants by capillary electrophoresis with electrochemical detection. Anal. Chim. Acta 2000, 423, 69–76. [Google Scholar] [CrossRef]
  9. Yang, Y.; Zhang, F. Ultrasound-assisted extraction of rutin and quercetin from Euonymus alatus (Thunb.) Sieb. Ultrason. Sonochem. 2008, 15, 308–313. [Google Scholar] [CrossRef] [PubMed]
  10. Zhang, F.; Yang, Y.; Su, P.; Guo, Z. Microwave-assisted extraction of rutin and quercetin from the stalks of Euonymus alatus (Thunb.) Sieb. Phytochem. Analysis 2009, 20, 33–37. [Google Scholar]
  11. Kopyscinski, J.; Schildhauer, T.J.; Vogel, F.; Biollaz, S.M.A.; Wokaun, A. Applying spatially resolved concentration and temperature measurements in a catalytic plate reactor for the kinetic study of CO methanation. J. Catal. 2010, 271, 262–279. [Google Scholar] [CrossRef]
  12. Sicaire, A.G.; Vian, M.; Fine, F.; Joffre, F.; Carré, P.; Tostain, S.; Chemat, F. Alternative Bio-Based Solvents for Extraction of Fat and Oils: Solubility Prediction, Global Yield, Extraction Kinetics, Chemical Composition and Cost of Manufacturing. Int. J. Mol. Sci. 2015, 16, 8430–8453. [Google Scholar] [CrossRef] [PubMed]
  13. Cheung, Y.C.; Siu, K.C.; Wu, J.Y. Kinetic models for ultrasound-assisted extraction of water-soluble components and polysaccharides from medicinal fungi. Food Bioprocess Technol. 2013, 6, 2659–2665. [Google Scholar] [CrossRef]
  14. Gao, S.; Lewis, G.D.; Ashokkumar, M.; Hemar, Y. Inactivation of microorganisms by low-frequency high-power ultrasound: 2. A simple model for the inactivation mechanism. Ultrason. Sonochem. 2014, 21, 454–460. [Google Scholar] [CrossRef] [PubMed]
  15. Dai, L.; Yue, L.; Ouyang, W.; Wang, Z. A Kinetic Model for Ultrasound-Assisted Extraction of Geniposide from Gardenia jasminoides. Separ. Sci. Technol. 2015, 50, 1518–1522. [Google Scholar] [CrossRef]
  16. Vong, C.M.; Wong, P.K.; Li, Y.P. Prediction of automotive engine power and torque using least squares support vector machines and Bayesian inference. Appl. Artif. Intell. 2006, 19, 277–287. [Google Scholar] [CrossRef]
  17. Li, H.; Tang, X.; Wang, R.; Lin, F.; Liu, Z.; Cheng, K. Comparative Study on Theoretical and Machine Learning Methods for Acquiring Compressed Liquid Densities of 1, 1, 1, 2, 3, 3, 3-Heptafluoropropane (R227ea) via Song and Mason Equation, Support Vector Machine, and Artificial Neural Networks. Appl. Sci. 2016, 6, 25. [Google Scholar] [CrossRef]
  18. Wang, X.; Chen, J.; Liu, C.; Pan, F. Hybrid modeling of penicillin fermentation process based on least square support vector machine. Chem. Eng. Res. Des. 2010, 88, 415–420. [Google Scholar] [CrossRef]
  19. Zhao, M.; Li, Z.; He, W. Classifying Four Carbon Fiber Fabrics via Machine Learning: A Comparative Study Using ANNs and SVM. Appl. Sci. 2016, 6, 209. [Google Scholar] [CrossRef]
  20. Meybodi, M.K.; Shokrollahi, A.; Safari, H.; Lee, M.; Bahadori, A. A computational intelligence scheme for prediction of interfacial tension between pure hydrocarbons and water. Chem. Eng. Res. Des. 2015, 95, 79–92. [Google Scholar] [CrossRef]
  21. Wang, W.; Liu, X. Melt index prediction by least squares support vector machines with an adaptive mutation fruit fly optimization algorithm. Chemometr. Intell. Lab. 2015, 141, 79–87. [Google Scholar] [CrossRef]
  22. Chamkalani, A.; Zendehboudi, S.; Chamkalani, R.; Lohi, A.; Elkamel, A.; Chatzis, I. Utilization of support vectormachine to calculate gas compressibility factor. Fluid Phase Equilibr. 2013, 358, 189–202. [Google Scholar] [CrossRef]
  23. Shuai, H.; Yijun, H.; Huanjun, Y.; Dezhao, C. Progress in ant colony algorithm and its application in chemistry and chemical engineering. Comput. Appl. Chem. 2008, 25, 1. [Google Scholar]
  24. Wu, Q. Hybrid model based on wavelet support vector machine and modified genetic algorithm penalizing Gaussian noises for power load forecasts. Expert Syst. Appl. 2011, 38, 379–385. [Google Scholar] [CrossRef]
  25. Dos Santosa, G.S.; Justi Luvizottob, L.G.; Marianib, V.C.; Dos Santos, L.C. Least squares support vector machines with tuning based on chaotic differential evolution approach applied to the identification of a thermal process. Expert Syst. Appl. 2012, 39, 4805–4812. [Google Scholar] [CrossRef]
  26. Jiang, H.; Yan, Z.; Liu, X. Melt index prediction using optimized least squares support vector machines based on hybrid particle swarm optimization algorithm. Neurocomputing 2013, 119, 469–477. [Google Scholar] [CrossRef]
  27. Liao, R.J.; Zheng, H.B.; Grzybowski, S.; Yang, L.J. Particle swarm optimization-least squares support vector regression based forecasting model on dissolved gases in oil-filled power transformers. Electr. Power Syst. Res. 2011, 81, 2074–2080. [Google Scholar] [CrossRef]
  28. Pan, W.T. A new Fruit Fly Optimization Algorithm: Taking the financial distress model as an example. Knowl. Based Syst. 2012, 26, 69–74. [Google Scholar] [CrossRef]
  29. Kulkarni, V.M.; Rathod, V.K. Mapping of an ultrasonic bath for ultrasound assisted extraction of mangiferin from Mangifera indica leaves. Ultrason. Sonochem. 2014, 21, 606–611. [Google Scholar] [CrossRef] [PubMed]
  30. Wu, H.; Chen, M.; Fan, Y.; Elsebaei, F.; Zhu, Y. Determination of rutin and quercetin in Chinese herbal medicine by ionic liquid-based pressurized liquid extraction-liquid chromatography-chemiluminescence detection. Talanta 2012, 88, 222–229. [Google Scholar] [CrossRef] [PubMed]
  31. Cortes, C.; Vapnik, V. Support-vector networks. Mach. Learn. 1995, 20, 273–297. [Google Scholar] [CrossRef]
  32. Vapnik, V.; Golowich, S.; Smola, A. Support vector machine for function approximation, regression estimation, and signal processing. In Neural Information Processing Systems; Mozer, M., Petsche, T., Eds.; MIT Press: Cambridge, MA, USA, 1997; Volume 9, pp. 265–278. [Google Scholar]
  33. Suykens, J.A.K.; Vandewalle, J. Least squares support vector machine classifiers. Neural Process. Lett. 1999, 9, 293–300. [Google Scholar] [CrossRef]
  34. Fletcher, R. Practical Methods of Optimization; John Wiley and Sons: Chichester, UK; New York, NY, USA, 1987; pp. 366–389. [Google Scholar]
  35. Keerthi, S.S.; Lin, C.J. Asymptotic behaviors of support vector machineswith Gaussian kernel. Neural Comput. 2003, 15, 1667–1689. [Google Scholar] [CrossRef] [PubMed]
  36. Chemat, F.; Fabiano-Tixier, A.S.; Vian, M.A.; Allaf, T.; Vorobiev, E. Solvent-free extraction of food and natural products. TrAC Trends Anal. Chem. 2015, 71, 157–168. [Google Scholar] [CrossRef]
  37. Chemat, S.; Esveld, E.D. Contribution of microwaves or ultrasonics on carvone and limonene recovery from dill fruits (Anethum graveolens L.). Innov. Food Sci. Emerg. 2013, 17, 114–119. [Google Scholar] [CrossRef]
  38. Park, J.E.; Atobe, M.; Fuchigami, T. Synthesis of multiple shapes of gold nanoparticles with controlled sizes in aqueous solution using ultrasound. Ultrason. Sonochem. 2006, 13, 237–241. [Google Scholar] [CrossRef] [PubMed]
  39. Carail, M.; Fabiano-Tixier, A.S.; Meullemiestre, A.; Chemat, F.; Caris-Veyrat, C. Effects of high power ultrasound on all-E-carotene, newly formed compounds analysis by ultra-high-performance liquid chromatography-tandem mass spectrometry. Ultrason. Sonochem. 2015, 26, 200–209. [Google Scholar] [CrossRef] [PubMed]
  40. Assami, K.; Chemat, S.; Meklati, B.Y.; Chemat, F. Ultrasound-Assisted Aromatisation with Condiments as an Enabling Technique for Olive Oil Flavouring and Shelf Life Enhancement. Food Anal. Methods 2015, 9, 982–990. [Google Scholar] [CrossRef]
  41. Liao, J.; Qu, B.; Liu, D.; Zheng, N. New method to enhance the extraction yield of rutin from Sophora japonica using a novel ultrasonic extraction system by determining optimum ultrasonic frequency. Ultrason. Sonochem. 2015, 27, 110–116. [Google Scholar] [CrossRef] [PubMed]
  42. Liao, J.Q.; Zheng, N.; Shun, S.G. Optimization of ultrasonic frequency for the improvement of extraction yields of bufadienolides from the Chinese medicine ChanSu by using a novel ultrasonic system. RSC Adv. 2015, 5, 49480–49486. [Google Scholar] [CrossRef]
  43. Liao, J.; Zheng, N.; Qu, B. An Improved Ultrasonic-Assisted Extraction Method by Optimizing the Ultrasonic Frequency for Enhancing the Extraction Efficiency of Lycopene from Tomatoes. Food Anal. Methods 2016, 9, 2288–2298. [Google Scholar] [CrossRef]
  44. Yilmaz, I.K.; Kaynar, O. Multiple regression, ANN (RBF, mLP) and ANFIS models for prediction of swell potential of clayey soils. Expert Syst. Appl. 2011, 38, 5958–5966. [Google Scholar] [CrossRef]
  45. Efroymson, M.A. Multiple regression analysis. Math. Method Digit. Comput. 1960, 1, 191–203. [Google Scholar]
  46. Krackhardt, D. Predicting with networks: Nonparametric multiple regression analysis of dyadic data. Soc. Netw. 1988, 10, 359–381. [Google Scholar] [CrossRef]
Figure 1. The iterative process for food seeking of fruit fly swarm.
Applsci 06 00340 g001
Figure 2. Step variations curve at a = 5 .
Applsci 06 00340 g002
Figure 3. Effect of concentration of ethanol solution using 80 kHz ultrasonic frequency at 30 °C for 30 min on the extraction of quercetin and rutin.
Applsci 06 00340 g003
Figure 4. Effect of solvent volume/sample ratio using 60% concentration of ethanol solution with 80 kHz at 30 °C and 200 W for 30 min on the extraction of quercetin and rutin.
Applsci 06 00340 g004
Figure 5. Effect of extraction time using 60% concentration of ethanol solution with 40 mL/g of ratio and 80 kHz at 30 °C and 200 W on the extraction of quercetin and rutin.
Applsci 06 00340 g005
Figure 6. Effect of ultrasonic power using 60% concentration of ethanol solution with 40 mL/g of ratio at 30 °C and 80 kHz for 30 min on the extraction of quercetin and rutin.
Applsci 06 00340 g006
Figure 7. Effect of extraction temperature using 60% concentration of ethanol solution with 40 mL/g of ratio at 80 kHz and 200 W for 30 min on the extraction of quercetin and rutin.
Applsci 06 00340 g007
Figure 8. Effect of ultrasound frequency using 60% concentration of ethanol solution with 40 mL/g of ratio at 30 °C and 200 W for 30 min on the extraction of quercetin and rutin.
Applsci 06 00340 g008
Figure 9. Structure diagram for ultrasonic extraction process based on least squares support vector machine (LS-SVM) model.
Applsci 06 00340 g009
Figure 10. Procedure diagram of the least squares support vector machine the improved based on fruit fly optimization algorithm (IFOA-LS-SVM) model.
Applsci 06 00340 g010
Figure 11. Prediction performance of different models on the test dataset of: rutin (a); and quercetin (b).
Applsci 06 00340 g011
Figure 12. Prediction performance of different models on the generalization dataset of: rutin (a); and quercetin (b).
Applsci 06 00340 g012
Figure 13. Cross-correlation of predicted and experimental values of quercetin yield for: IFOA-LS-SVM model (a); and multiple regression (MR) model (b).
Applsci 06 00340 g013
Figure 14. Residual error of the values predicted by IFOA-LS-SVM and MR models from the experimental values.
Applsci 06 00340 g014
Table 1. The optimum parameter values of LS-SVM model optimized by the IFOA.
Parametersγσ2
Rutin yield9913.6511.08
Quercetin yield9896.8010.55
Table 2. Prediction performance of different models on the testing dataset of analytes.
AnalytesModelsRMSEMRE (%)MAETIC
RutinSVM0.12683.870.09980.0082
LS-SVM0.10351.880.05660.0028
IFOA-LS-SVM0.05401.050.01890.0014
QuercetinSVM0.12043.990.09650.0080
LS-SVM0.09972.050.05570.0030
IFOA-LS-SVM0.05360.970.01830.0013
Table 3. Prediction performance of different models on the generalization dataset of analytes.
AnalytesModelsRMSEMRE (%)MAETIC
RutinSVM0.11923.810.07980.0049
LS-SVM0.09032.050.04660.0023
IFOA-LS-SVM0.05960.970.02240.0011
QuercetinSVM0.10083.860.07760.0045
LS-SVM0.08892.780.04250.0020
IFOA-LS-SVM0.06120.990.02310.0014
Table 4. Model summaries of multiple regressions for prediction of extraction yield of quercetin.
Independent VariablesX1X2X3X4X5X6Constant
Coefficient0.236−0.685−0.1980.7020.225−0.663−12.146
Std. error0.0880.1330.6650.0540.0360.1470.456
Sig. level0.2800.0110.0020.4210.1260.0080.102
Table 5. Training-time comparison between SVR, LS-SVM and IFOA-LS-SVM models.
ModelsMRSVMLS-SVMIFOA-LS-SVM
Training-time (s)16.86327.6523.2472.298

