Article

Analysis of the Stiffness Ratio at the Interim Layer of Frame-Supported Multi-Ribbed Lightweight Walls under Low-Reversed Cyclic Loading

1
College of Architecture and Civil Engineering, Beijing University of Technology, No.100, Pingleyuan, Chaoyang District, Beijing 100124, China
2
Academy of Railway Sciences, Scientific & Technological Information Research Institute, No. 2 Daliushu Road, Haidian District, Beijing 100081, China
3
School of Civil Engineering, Beijing Jiaotong University, No.3 Shangyuancun, Haidian District, Beijing 100044, China
*
Author to whom correspondence should be addressed.
Appl. Sci. 2016, 6(1), 21; https://doi.org/10.3390/app6010021
Submission received: 23 October 2015 / Revised: 4 January 2016 / Accepted: 11 January 2016 / Published: 15 January 2016

Abstract

:
By conducting low-reversed cyclic loading tests, this paper explores the load-bearing performance of frame-supported multi-ribbed lightweight wall structures. The finite-element software (OpenSees) is used to simulate the process with the shear wall width (at the frame-supported layer) and different hole opening approaches (for multi-ribbed lightweight walls) as variables. The conclusions reflect the influence of the stiffness ratio at the interim layer on the load-bearing performance of the structure. On this basis, the paper identifies the preferable numerical range for engineering design, which provides a solid foundation for the theoretical advancement of the structures in this study.

Graphical Abstract

1. Introduction

The wide application of frame-supported structures serves the increasing demand for modern buildings that are designed and constructed with multiple functions for various purposes. However, the uneven distribution of stiffness and mass in the vertical direction may induce a sudden change in structural stiffness under seismic influence, which undermines the overall structure [1,2,3]. Framework-masonry structures (FM structures), with a design scheme where the upper part is relatively stronger than the lower part, have poor seismic resistance based on their behavior in previous earthquakes [4]. The Olive View Medical Center in San Fernando, for instance, suffered from crashed ground columns and buckled reinforced steel in the main building [5,6]. Another example occurred in Skopje, Yugoslavia. A five-storey building on October Street (literally translated) was heavily damaged at the ground floor which consisted of stores with no partition wall, while the upper floors—primarily partitioned residences—were only slightly damaged. [7]. These findings were confirmed in China, where FM structure stands were some of the most extensively damaged structures in both Wenchuan and Yushu earthquakes (in Sichuan and Qinghai Province, respectively) [8]. Comparatively, the masonry structure of framework seismic walls presents a good choice in terms of city reconstruction and business decentralization. The China Academy of Building Research conducted an experimental study on the seismic performance of a 1/2-scale-seven-floor brick house with a seismic wall framework. The conclusions indicate that, as the weak layer emerges, elastic-plastic deformation takes place in a collective manner, which means that severe damage is likely to occur. Therefore, the study suggests that the stiffness ratio at the interim layer falls somewhere between 1.2 and 2.0 [9]. Xi’an University of Architecture and Technology conducted quasi-dynamic response tests to using 1/2-scale models, where a two-layer framework seismic wall supports a four-layer brick house. The results show the peak values for the seismic shear force and for the moment occur at the interim layer, which remains vulnerable to external force. Therefore, to enhance the lateral stiffness and load-bearing performance in the horizontal direction, structural columns are added to the middle of the interim layer for further support. In the meantime, the stiffness ratio between the third layer and the second layer is between 1.2 and 1.4, whereas that between the second and the first should not exceed 1.4 [4].
The frame-work shear wall structure delivers strong performance in seismic resistance. Although a ground shear wall with increased wall thickness can cope with any sudden change in stiffness at the interim layer, its overuse undermines the layout design and the daily function of the building. At the same time, frame-supported columns tend to be underused as they bear only limited shear force during earthquakes [10]. Both Japan and South Korea have placed frame-supported shear wall structures under quasi-dynamic and vibration tests. The majority of the structural damage is noticed in the frame, whereas the upper structure remains in the elastic stage. In other words, the overall specimen is unevenly damaged [11,12]. The Southeast University of China (Jiangsu Province) scaled a reinforced framework structure with the bottom layer of a large bay supported by specially shaped columns to 1/6 of the prototype and performed seismic simulations on a vibration test rig. The damage could be categorized as structural damage of the beam hinge. As the plastic hinge at the beam end develops, the wall corners crack; therefore, stronger corner design is highly recommended [13]. Several researchers and scholars have studied the seismic design of frame-supported structures, which tend to display an uneven distribution of stiffness and mass. The results show that the inter-layer displacement and ductility increase with decreasing stiffness and strength of the first layer. Therefore, the use of a multiple-defense design in the upper structure is recommended to mitigate the accumulation of damage and withstand collapse in an aftershock [14,15].
On this basis, this paper suggests multi-ribbed lightweight wall for the construction of buildings with large spaces at the bottom, which helps to create a new structural system—frame-supported multi-ribbed lightweight wall structure (FSMRL wall structure). The paper presents low-reversed cyclic loading tests of differential-span FSMRL wall structures with their scales reduced by half of the prototype. The finite-element software (OpenSees) [16] is used to simulate the load-bearing performance of the specimens with variable stiffness ratios at the interim layer. Thanks to this application, the paper identifies the numerical range of the stiffness ratio for engineering design.

2. Multi-Ribbed Lightweight Wall Structure

The multi-ribbed lightweight wall structure (or MRL wall structure), with a layer-by-layer embedded design, is composed of cast-in-situ concealed frames, layer slabs and prefabricated MRL walls [17,18], which can be further divided into environmentally friendly embedded lightweight blocks and densely arranged ribbed beams and ribbed columns. The frame, constructed of reinforced concrete edge columns, connected columns and concealed beams, restrains the displacement of the wall. These parts make up the major load-bearing members of the structure, namely the MRL wall (see Figure 1).
Compared with structures of similar functions, MRL wall structures offer the following advantages:
(1)
Outstanding structural integrity and working performance
The manufacturing technique promises consistent deformation between the MRL wall, concealed frame and layer slab, which then work together to bear the exerted force. From an overall perspective, the MRL wall can be viewed as a composite material structure, with the lightweight blocks acting as the matrix and the ribbed grid as the reinforced fiber. With smaller mechanical difference between the grid and blocks, the structure works as a new type of load-bearing member, standing out for its strength and overall integrity. It needs to be pointed out that the blocks and the ribbed grid—mutually restraint and coordinately functioned—contribute to greater stiffness, which means block cracking only occurs within a certain range under cyclic loading. The cracks then tend to close up under reversed loading, in other words the blocks—though cracked—still bear the exerted force and participate in lateral force resistance [19].
Figure 1. Sketch map of a multi-ribbed lightweight wall structure; (a) Multi-ribbed lightweight wall structure; (b) Multi-ribbed lightweight wall.
Applsci 06 00021 g001
(2)
Multiple seismic lines of defense
From the perspective of the applied material, the embedded block is composed of a brittle material with strong stiffness, whereas the multi-ribbed grid and the concealed frame use reinforced concrete, which has high ductility. Overall, the structure has average stiffness, with a load-bearing performance greater than the framework structure, but less than the shear wall structure. Under horizontal loading, the lightweight blocks with low elastic moduli are the first to crack. However, due to the restraint of the ribbed grid, the seismic energy is dissipated through friction between blocks, forming the first seismic line of defense. Thanks to the criss-crossed ribbed beams and ribbed columns, better plane interaction (i.e., densely arranged ribbed beams and ribbed columns form cross grids, and increase the in-plane stability of the MRL wall)—together with the support of the lightweight blocks—results in stronger structural stiffness in comparison with that of the concealed frame. Therefore, the structure is prone to collapse before its counterpart does, forming the second seismic line of defense. In the final stage of force bearing, the cooperation between the concealed frame and the ribbed columns withstands the external force applied, preventing the occurrence of structural collapse in major seismic incidence—hence the third seismic line of defense.
Previous studies and analysis show that the failure process-the graded process of energy consumption—for instance—starts with the lightweight blocks, then moves to the grids and finally to the concealed frame, all of which make up the multiple seismic lines of defense [20].
(3)
Easy adjustment of structural stiffness
The adjustment of the stiffness in lateral force resistance can be achieved by changing the block material, the grid layout and the dimensions of the ribbed beams and ribbed columns. As the MRL wall structure can easily cooperate with other structural system(s), it promises easy adjustment of stiffness distribution and force-bearing capacity [21].
(4)
Low dead weight, limited construction duration, and tangible benefits on the energetic, social, environmental, and economic fronts
The dead weight of the MRL wall structure is approximately 7.2 kN/m2, equivalents to 65% of that of a brick masonry structure, 68% of that of a frame structure, and 72% of that of a shear-wall structure. Engineering practice has found that the MRL wall structure cuts the civil cost by 4%–6% compared with masonry concrete structures, 10%–12% compared with framework structures, and more than 15% compared with shear wall structures. At the same time, the thinner wall offers a 6%–8% increase in usable floorage. These figures confirm that this new structural system has great potential for industrialization [22].
(5)
Residence pilot projects
As 1,000,000 m2 residence pilot projects have been constructed in Hebei, Shanxi, Henan and many other provinces [23], the MRL wall structure has achieved every aspect of social production and practice (see Figure 2), and our efforts toward this end have yielded both economic and social results. In reference to the Code for Masonry Structure Design (GB50003-2011), the Load Code for Building Structures (GB50009-2012), the Code for the Design of Concrete Structures (GB50010-2010), and the Code for Seismic Design of Buildings (GB 50011-2010), the Ministry of Housing and Urban Development, P.R. China, has issued the industrial standard—the Directive Rules for Multi-Ribbed Lightweight Wall Structures—which became effective from 1 June 2014 (JGJ/T275-2013). Details about the design and construction are provided in Figure 3 [24].
Figure 2. Residence pilot projects using the system—frame-supported multi-ribbed lightweight wall structure (FSMRL for short) wall structure.
Applsci 06 00021 g002
Figure 3. Details of the design and construction of FSMRL wall structures. (a) Slab joints; (b) Structure construction process.
Applsci 06 00021 g003

3. Low-Reversed Cyclic Loading Test on FSMRL Wall Structure

In accordance with a frame-supported brick masonry structure [4], the specimen is designed to withstand an earthquake with an intensity level of eight when the site soil is type II. Built on theories applied in the field, the specimen is scaled to 1/2 of the prototype (see Figure 4), and the preparation is performed by anchoring the rib reinforcement of the MRL wall in the upper half to the edge columns at each end and the head beams, whereas the wall is laid on the frame-supported beam (FS beam) using the bed mortar method [24,25]. Table 1, Table 2 and Table 3 provide the key parameters of reinforcement, concrete and block material. The applicationt aims to unveil the influence of the stiffness ratio (at the interim layer) on the load-bearing performance of the overall structure. Additionally, the authors conducted a height cut to the bottom layer to avoid any premature cracking of the frame-supported columns (FS columns).
Figure 4. Structural diagram of the FSMRL wall. (a) FSMRL-1 Differential-span FSMRL wall without holes; (b) FSMRL-2 Differential-span FSMRL wall with holes; (c) The reinforcement for the outer frame; (d) The reinforcement for the ribbed beam and ribbed column; (e) Reinforcement details of the cross section.
Applsci 06 00021 g004
Table 1. Concrete test results.
Major MemberFrame at the BottomRibbed Beam and Ribbed ColumnEdge Column and Connected Column
Cubic compression strength/MPa34.1330.0232.27
Elastic modulus/MPa3.11 × 1042.98 × 1043.09 × 104
Table 2. Steel bar test results.
SpecificationФ6Ф8Ф12Ф14Ф20
Area/mm228.350.3113.1153.9314.2
Yield strength/MPa430.55613.06367.42441.76525.33
Strength limit/MPa533.14644.90527.54576.03739.02
Elastic modulus/MPa2.14 × 1052.11 × 1052.03 × 1052.12 × 1052.08 × 105
Table 3. Block test results.
Dry Density (kN/m3)Compression Strength/MPaTensile Strength/MPaElastic Modulus/MPa
7.324.150.422.25 × 103
See Figure 5 for the model preparation of the specimens.
Figure 5. The fabrication of the specimens. (a) The preparation of the MRL wall; (b) The making of the specimens in stages.
Applsci 06 00021 g005
The test setup shown in Figure 6 was used. The horizontal loading was exerted repetitively by the vertical oil-pumped jacks starting with a fixed force of 1000 kN. The prototype—a six-layered structure—is put under an external force of 1000 kN on a layer basis, with the top four floors loaded to the two layers in the bottom. With its scale reduced by half, the model bears a loading of 1000 kN—1000 × 4 × 1/4 at the vertical direction). It needs to be noted that the low-reversed cyclic loading test can be viewed as a quasi-static loading test where the loading rates can be slow. One single cyclic takes 10–15 min, which is then followed by a 5–10 min break to view the results. When the displacement sensor read a stable value, the horizontal loading was increased by a margin of 30 kN repeatedly until yielding of the steel reinforcing bars in each specimen. Then, a new type of loading pattern was applied, as the experimental parameters changed from force to displacement with a fixed increase of 5 mm each time, and the operation was repeated immediately. See Figure 7 for the horizontal loading curves for the two specimens.
Figure 6. The loading device.
Applsci 06 00021 g006
Figure 7. Low-reversed cyclic loading curve. (a) The horizontal-loading curve for FSMRL-1; (b) The horizontal-loading curve for FSMRL-2.
Applsci 06 00021 g007
The damage of the FSMRL wall structure goes through three stages, namely, the stage of preliminary development (with the force control at 0.40 to 0.55 times the yield limit—Py), the stage of rapid development (with the force control at 0.55 to 1.10 times the Py) and the stage of destruction (displacement control). While the previous two stages are service states, and the destruction stage is the ultimate state.
At the stage of preliminary development, cracks are first found at the blocks, which then tend to close under reversed loading. At this point, the blocks, the ribbed beams, and the ribbed columns work cooperatively. In the lower part of the structure, minor cracking occurs at the FS columns and the FS beams. As the loading continues, the cracks at the above-mentioned locations increase in quantity; during the stage of rapid development that follows, the existing cracks extend via the frame grids accompanied by exfoliation (of the blocks) as plastic hinges are formed at the joints of the ribbed beams and the ribbed columns. In the lower structure, cracks appear equidistantly on the FS columns, and cracks increase in quantity in the FS beams. As the destruction occurs, the experiment reaches an enduring stage. As the displacement amplitude increases, the load-bearing capacity of the walls decrease. More cracks can be noticed at the block-grid interface, and exfoliation occurs on a large-scale, which results in the destruction of some blocks. Finally, concrete crushing at the FS column bases, yielding of the longitudinal steels, and inter-layer sliding occur (See Figure 8).
Figure 8. Three stages of accumulative damage. (a) Preliminary development damaged stage; (b) Rapid development damaged stage; (c) Destruction stage.
Applsci 06 00021 g008

4. Theoretical Determination of the Interim Stiffness Ratio for Frame-Supported Multi-Ribbed Lightweight Walls

4.1. The Regulations of Stiffness Ratio at the Interim Layer

The Technical Specification for the Concrete Structure of Tall Building (JGJ3-2010) regulations in the appendix E [26], where the interim structural member is defined as the component set due to layout or structural change(s) among the upper and lower floor, with some typical examples being interim beam, interim slab, interim truss, etc. The located floor of such a component is referred to as interim layer
On this basis, the paper focuses on the up-and-down stiffness ratio at the interim layer of the FSMRL wall structure (hereinafter refers to as stiffness ratio at the interim layer) and discusses the optimal numerical range accordingly. The stiffness ratio at the interim layer γe can be calculated by using Equation (1).
γ e = Δ 1 H 1 Δ 2 H 2

4.2. Stiffness Calculation for the FSMRL Wall Structure

(1)
For MRL walls, the elastic stiffness in the lateral force resistance (or K) can be calculated using Equations (2)–(5) (shown in section 6) [27]
Based on previous wall-related experiments, the equations incorporate bending deformation and structural destruction and take into account the influence of concerned variables, such as the axial compressive ratio, minor cracks, and the construction procedure.
K 1 = 0.3 η c ( 2 μ N + 0.4 ) H 3 12 E c I eq + μ H G c A eq
A eq = A c + E q E c A q
b eq = A eq / h
I eq = 1 12 b eq h 3
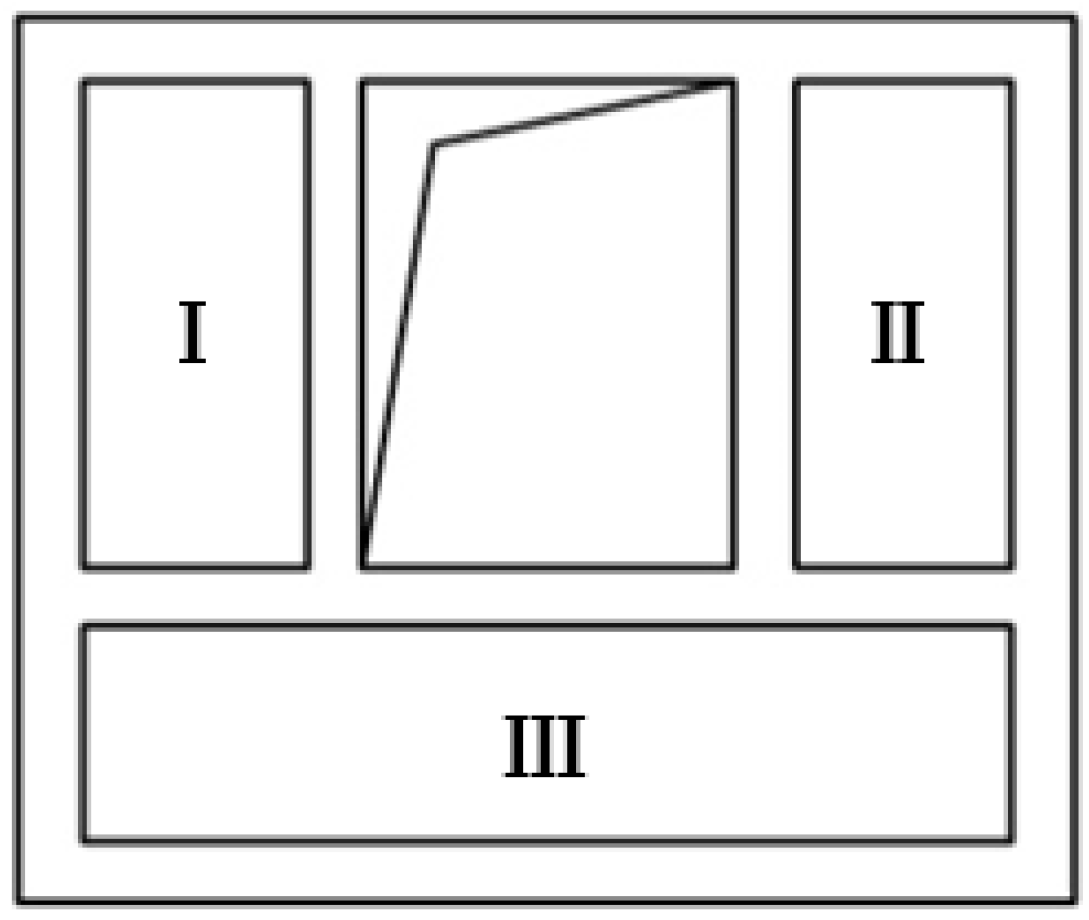
For MRL walls with holes, the calculation of the elastic stiffness in the lateral force resistance can be conducted using Equation (6) (see Figure 9).
K 1 = 1 1 K Ι Ι Ι + 1 K Ι + K Ι Ι
Figure 9. Sketch of the stiffness calculation for MRL walls with holes.
Applsci 06 00021 g009
Note: KI, KII and KIII stand for the piece-by-piece calculation results of the specimen stiffness in lateral force resistance, whereas the layer height H represents the height of the embrasure or windowsill.
(2)
Stiffness calculation for reinforced concrete frame and seismic wall
The authors introduced the D-value method which can be expressed by Equation (7).
K 2 = α c 12 i c h 2
(3)
Calculation of layer stiffness
The calculated value for the layer stiffness is derived from the linear superposition of the frame stiffness and the MRL wall stiffness (see Equation (8)).
K = K 1 + K 2
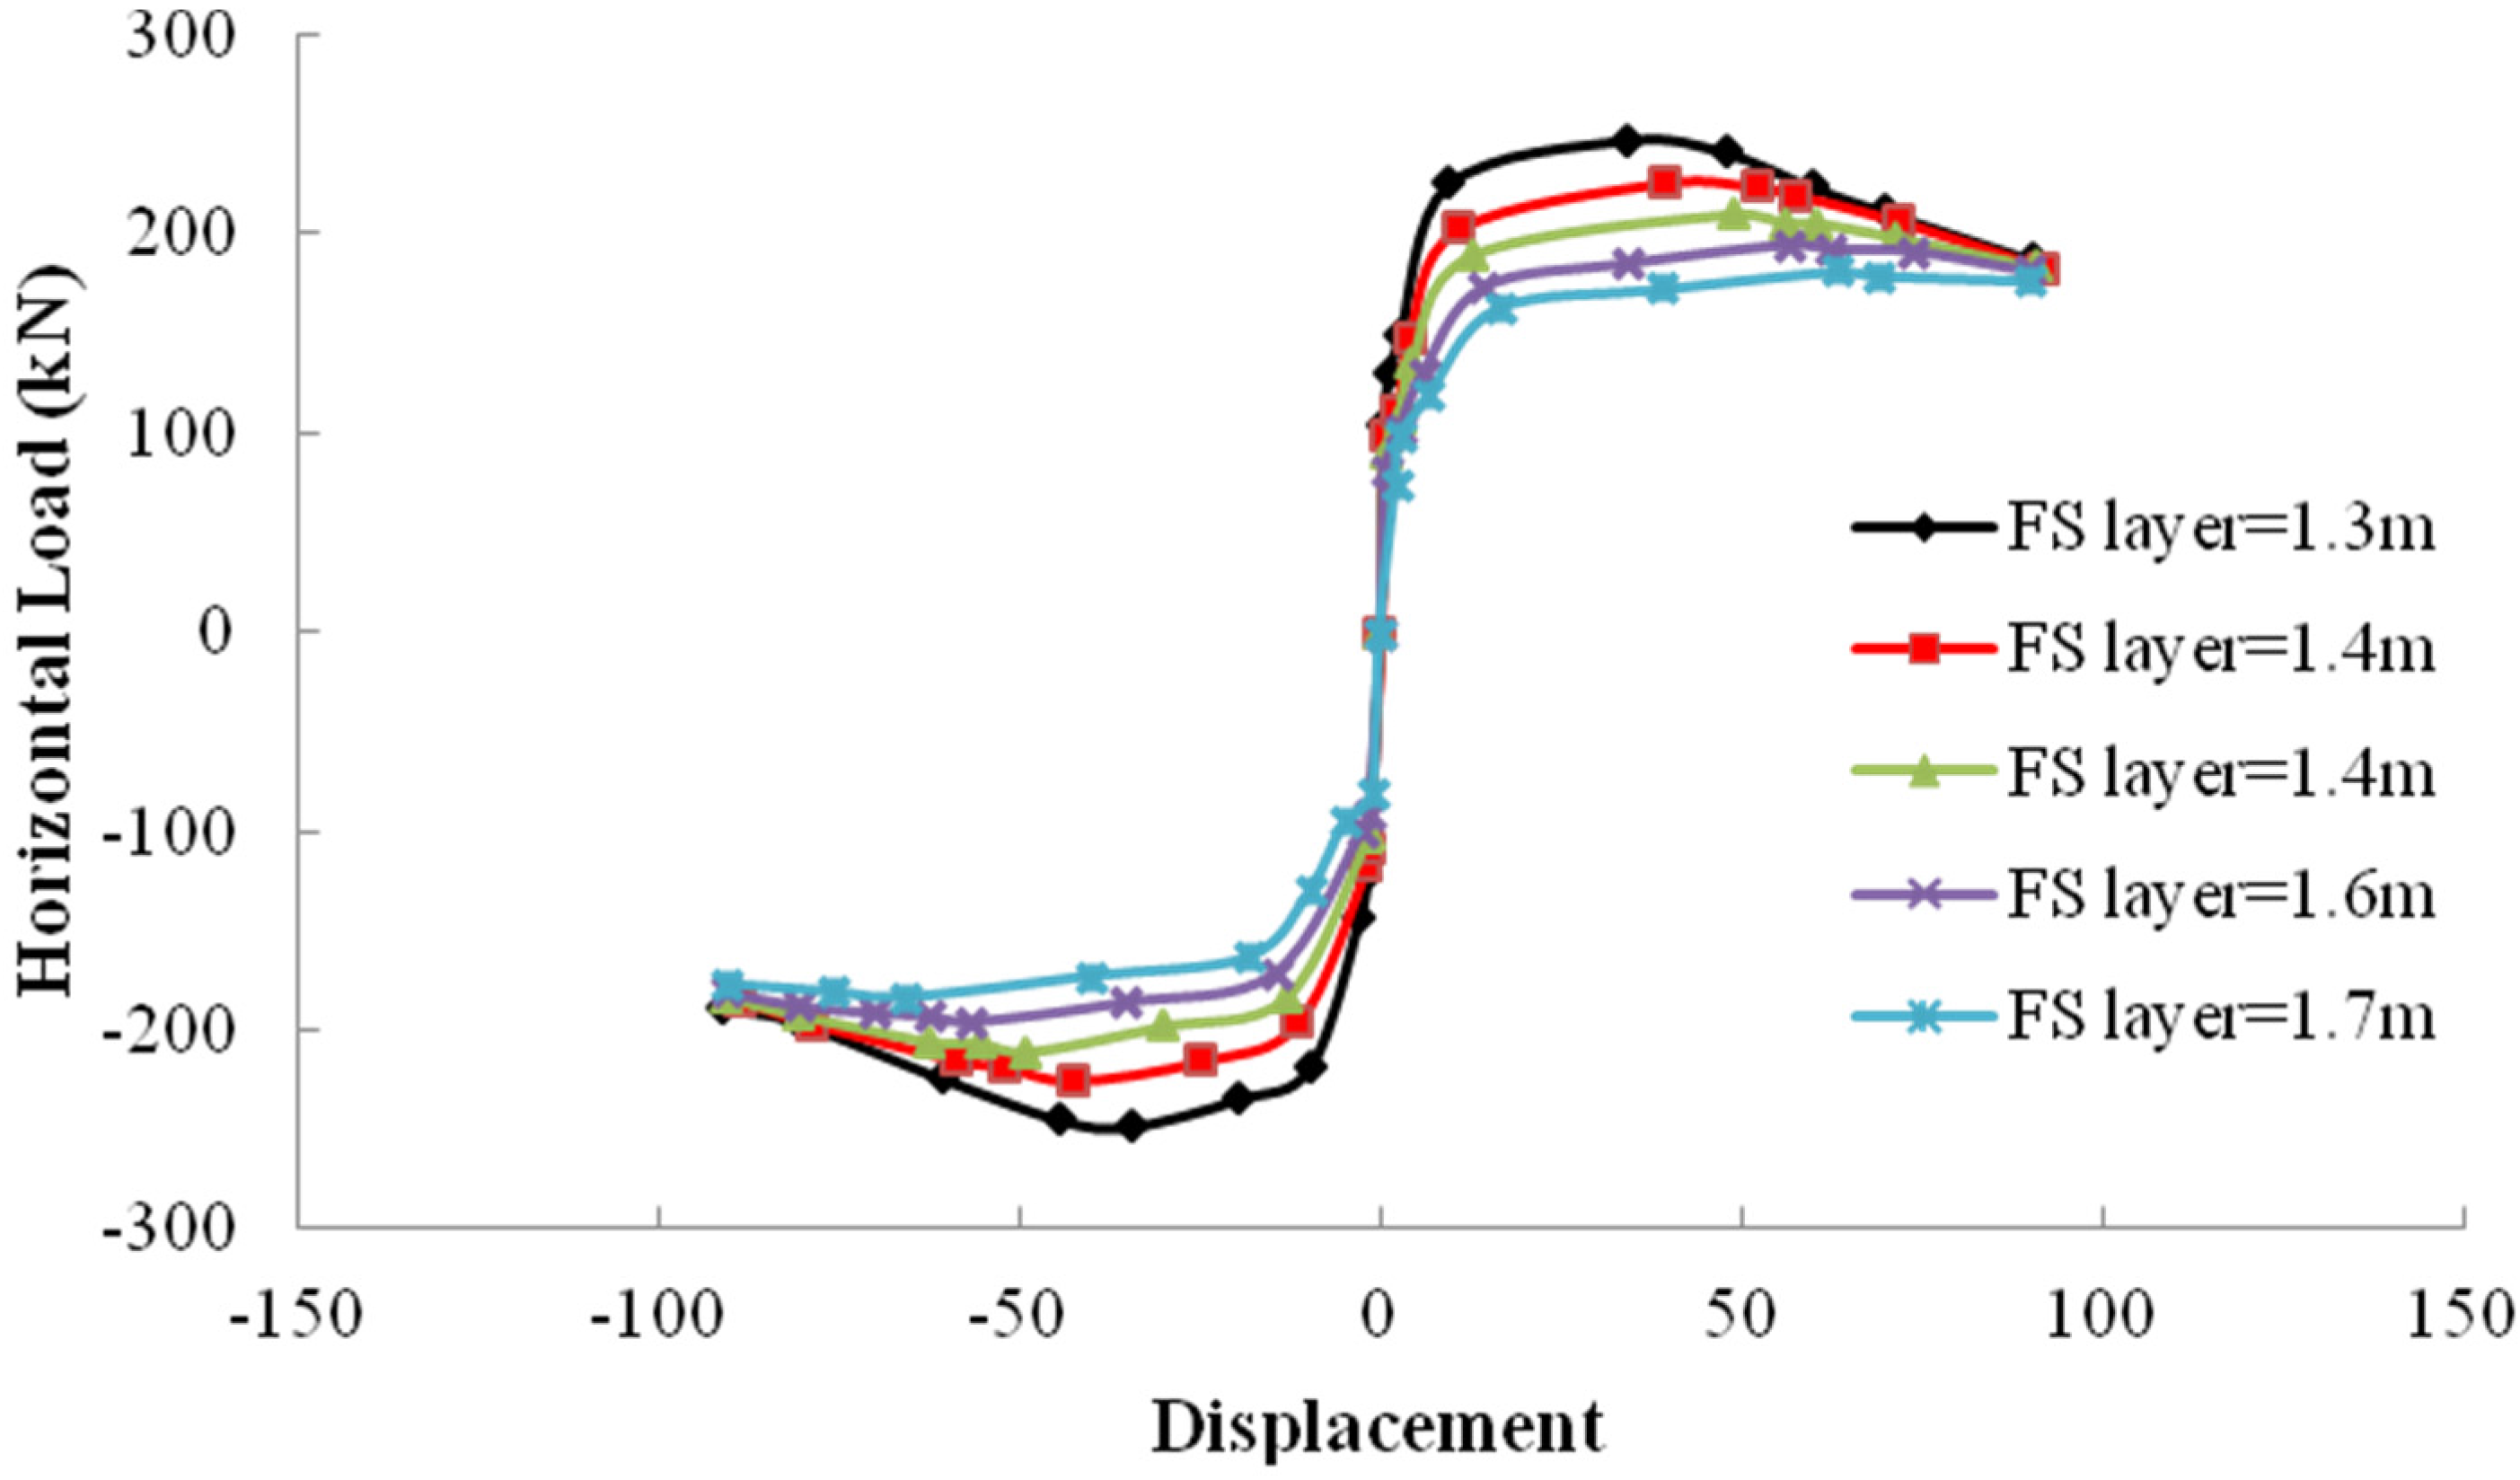
Engineering practice normally reserves a large space in the lower layer of the FSMRL wall structure. However, to avoid the early occurrence of FS column failure, this paper shortens the columns and introduces reinforcement measures. The height cut is conducted proportionally; the layer height—which is 2.6 m in practice—is 1.3 m in this paper. The paper makes use of the finite-element software OpenSees ([16]) to simulate the influence of height changes in the FS layer on the load-bearing performance of the overall structure. The height of the FS layer is set at 1.3 m, 1.4 m, 1.5 m, 1.6 m, or 1.7 m to simulate an actual structure with a layer height of 2.6 m, 2.8 m, 3.0 m, 3.2 m, or 3.4 m respectively. The model provides a comparative diagram for skeleton curves, which are displayed as follows (see Figure 10).
Figure 10. Comparative diagram for the skeleton curves of the models.
Applsci 06 00021 g010
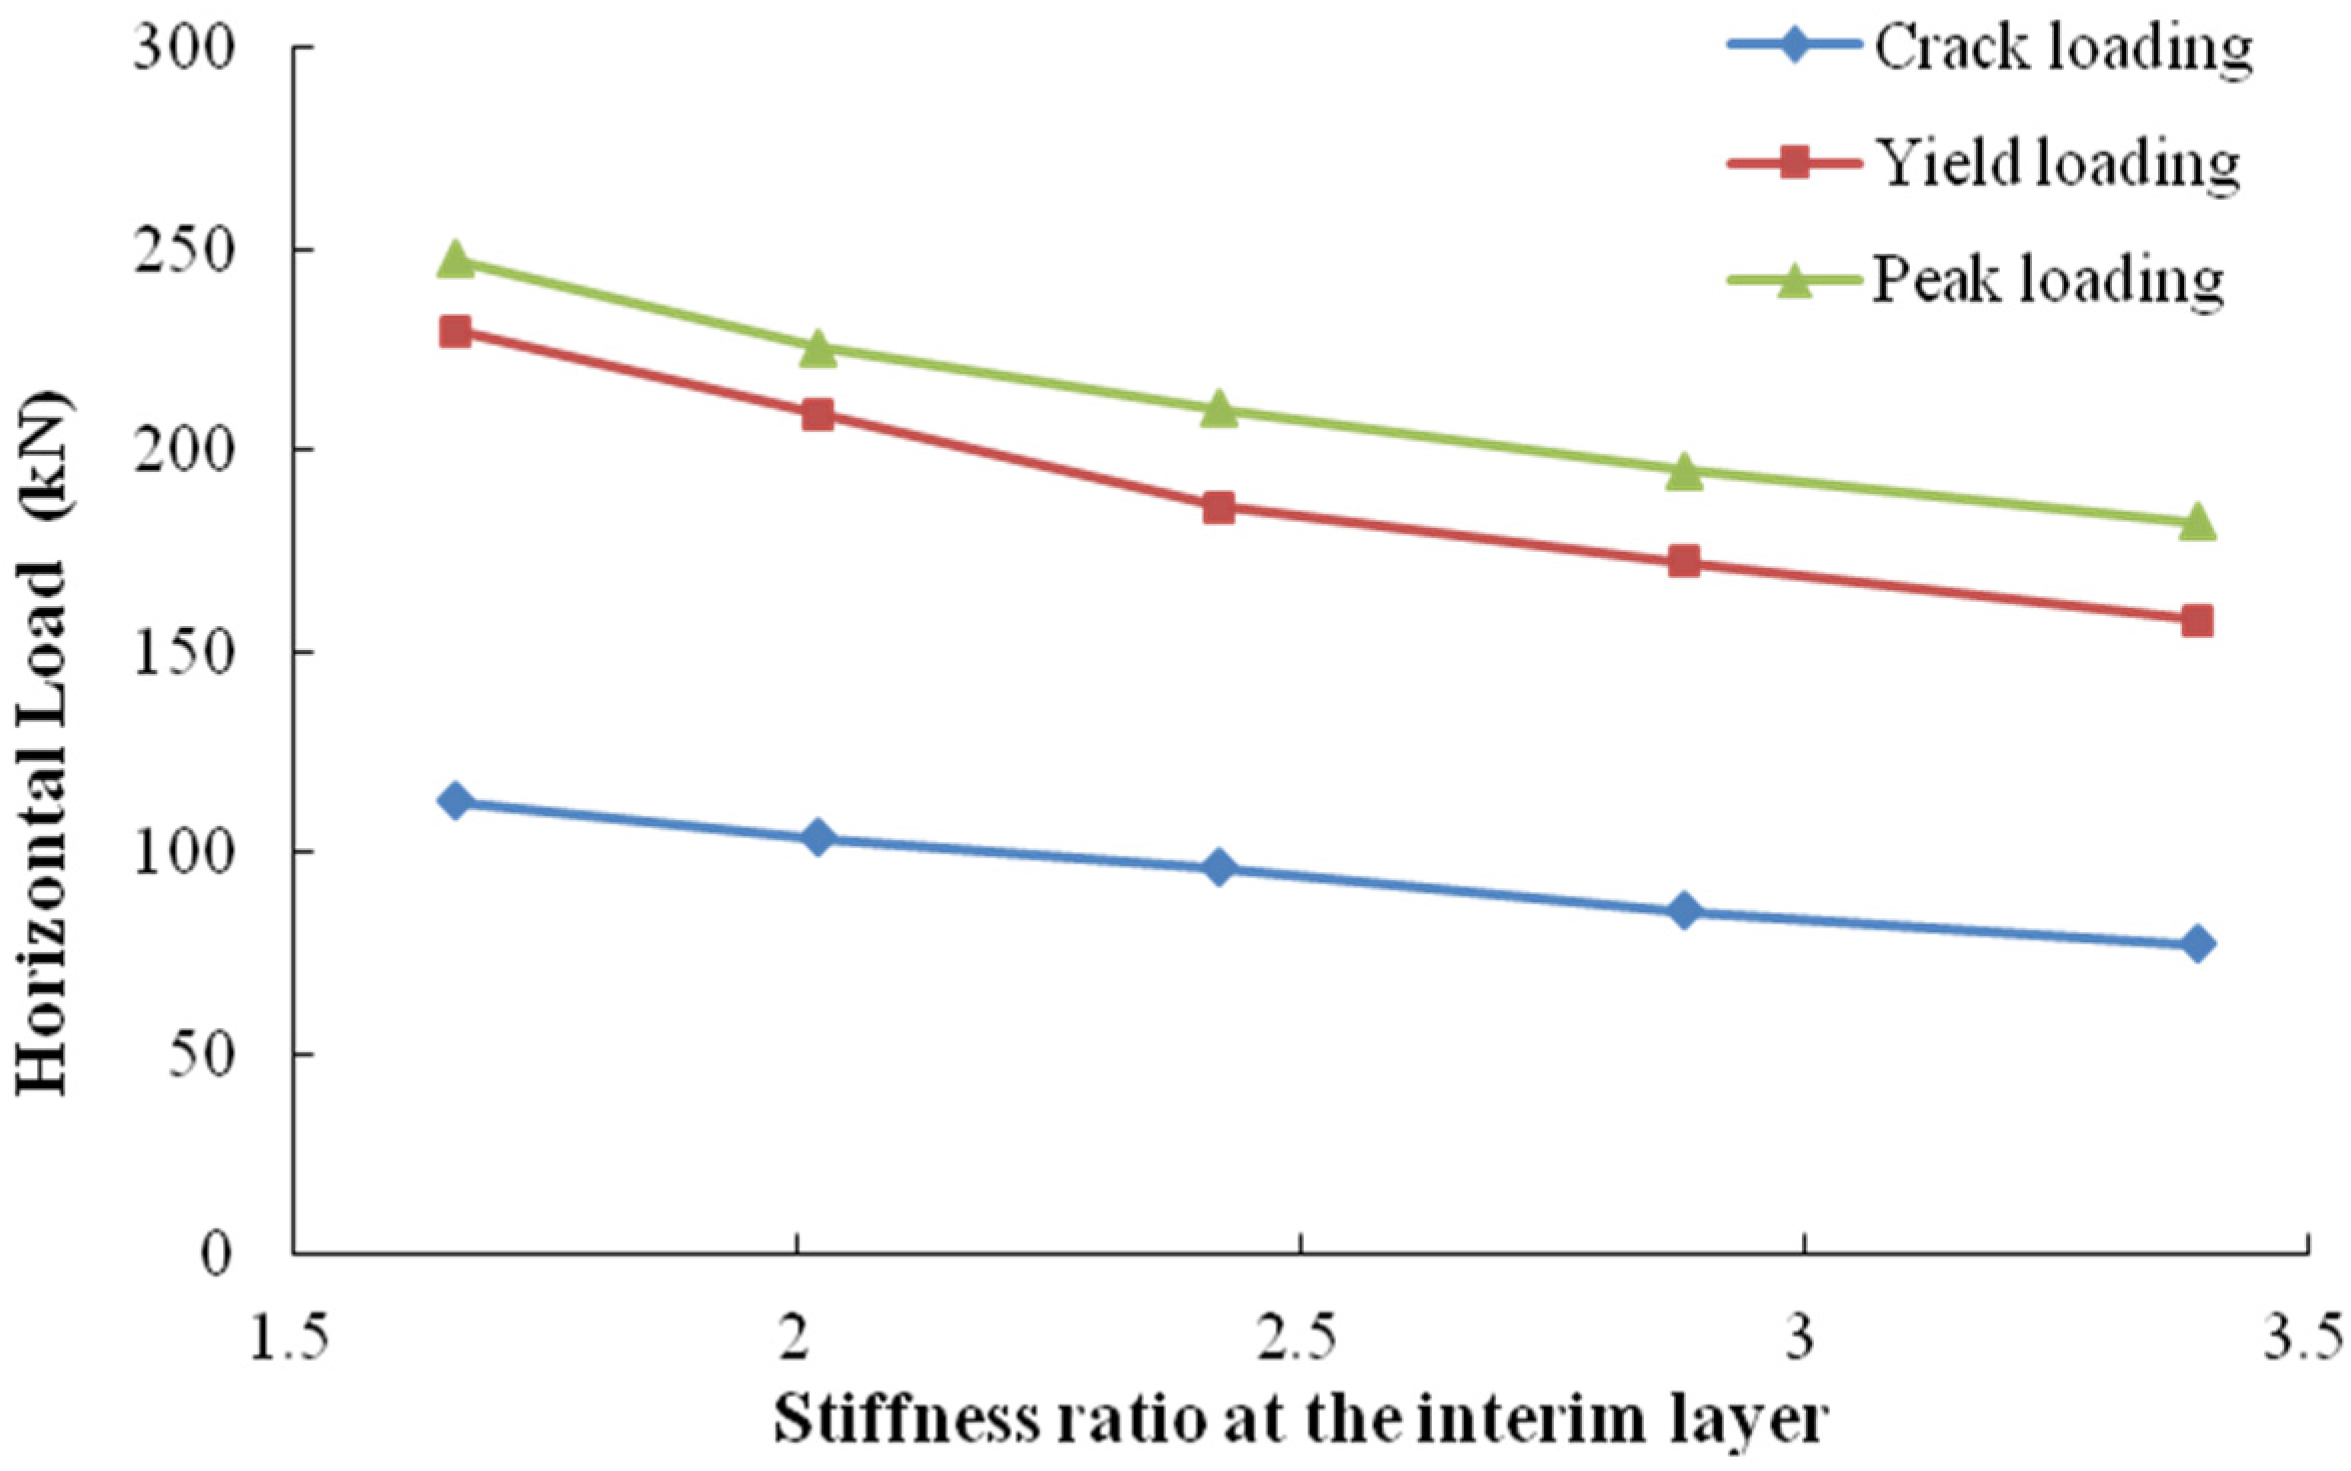
Using Equation (2) to Equation (8), the stiffness ratio (at the interim layer) can be determined for specimens with different frame heights. Table 4 shows the relation between the stiffness ratio and the structure’s crack, yield, and peak loading (see Figure 11).
Table 4. Stiffness ratio at the interim layer with different frame supported (FS) layer heights.
Height of FS Layer (mm)13001400150016001700
Stiffness ratio at the interim layer1.662.022.422.883.39
Figure 11. Relation between the interim stiffness ratio and load-bearing performance.
Applsci 06 00021 g011
Figure 11 shows that the overall curves for the crack, yield, and peak loading decrease with increasing stiffness ratio. A closer look shows that, comparatively, the crack-loading curve follows a more steady variation pattern, whereas the decrease of the other two variables is steeper, which indicates that the stiffness ratio has a stronger influence on the structural strength at the yielding stage and under peak loading.
Stiffness adjustment of the FS layer and hole opening of the MRL wall are performed in an effort to obtain different stiffness ratios, either greater than or smaller than 1. The authors again use OpenSees to simulate the load bearing process to identify the preferable stiffness ratio for the interim layer of the FSMRL wall structure [16,
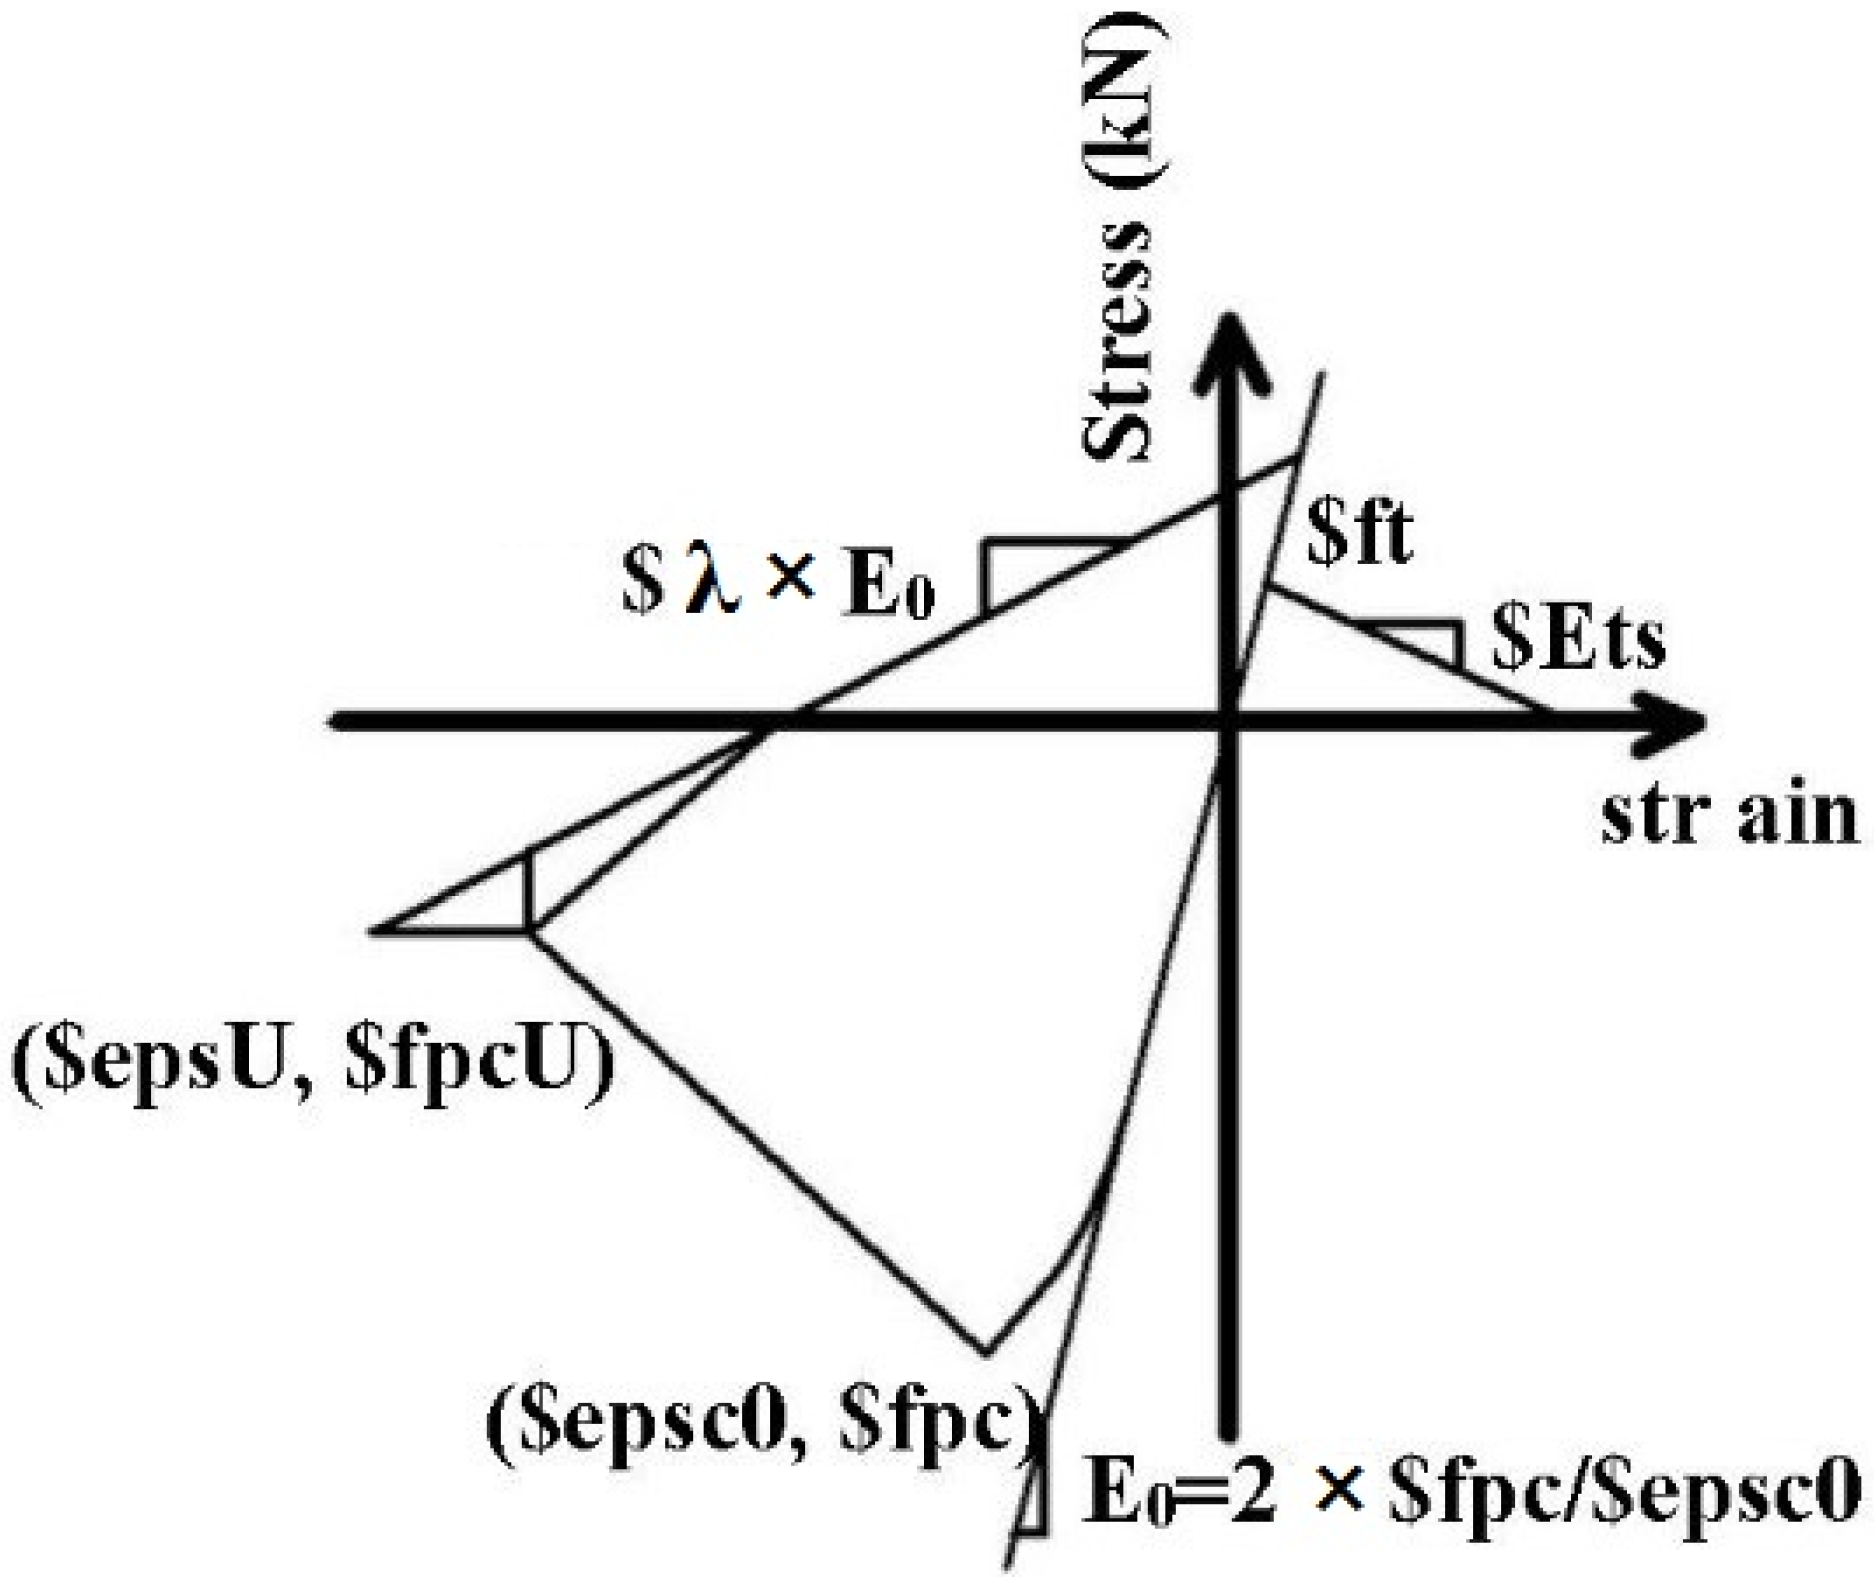
28]. In the simulation of the specimen’s physical performance, the material-specialized model Concrete02 (provided by OpenSees [16])—which takes into account the concrete’s strength and linear tensile emollescence—is applied in the study of the constitutive relation of the concrete (see Figure 12). The uniaxial material model (Hysteretic Material) is chosen for the simulation of rebar, because the model does not eliminate the stiffness degradation upon the removal of the external force, and it is fully able to reflect the pinching effect, (see 
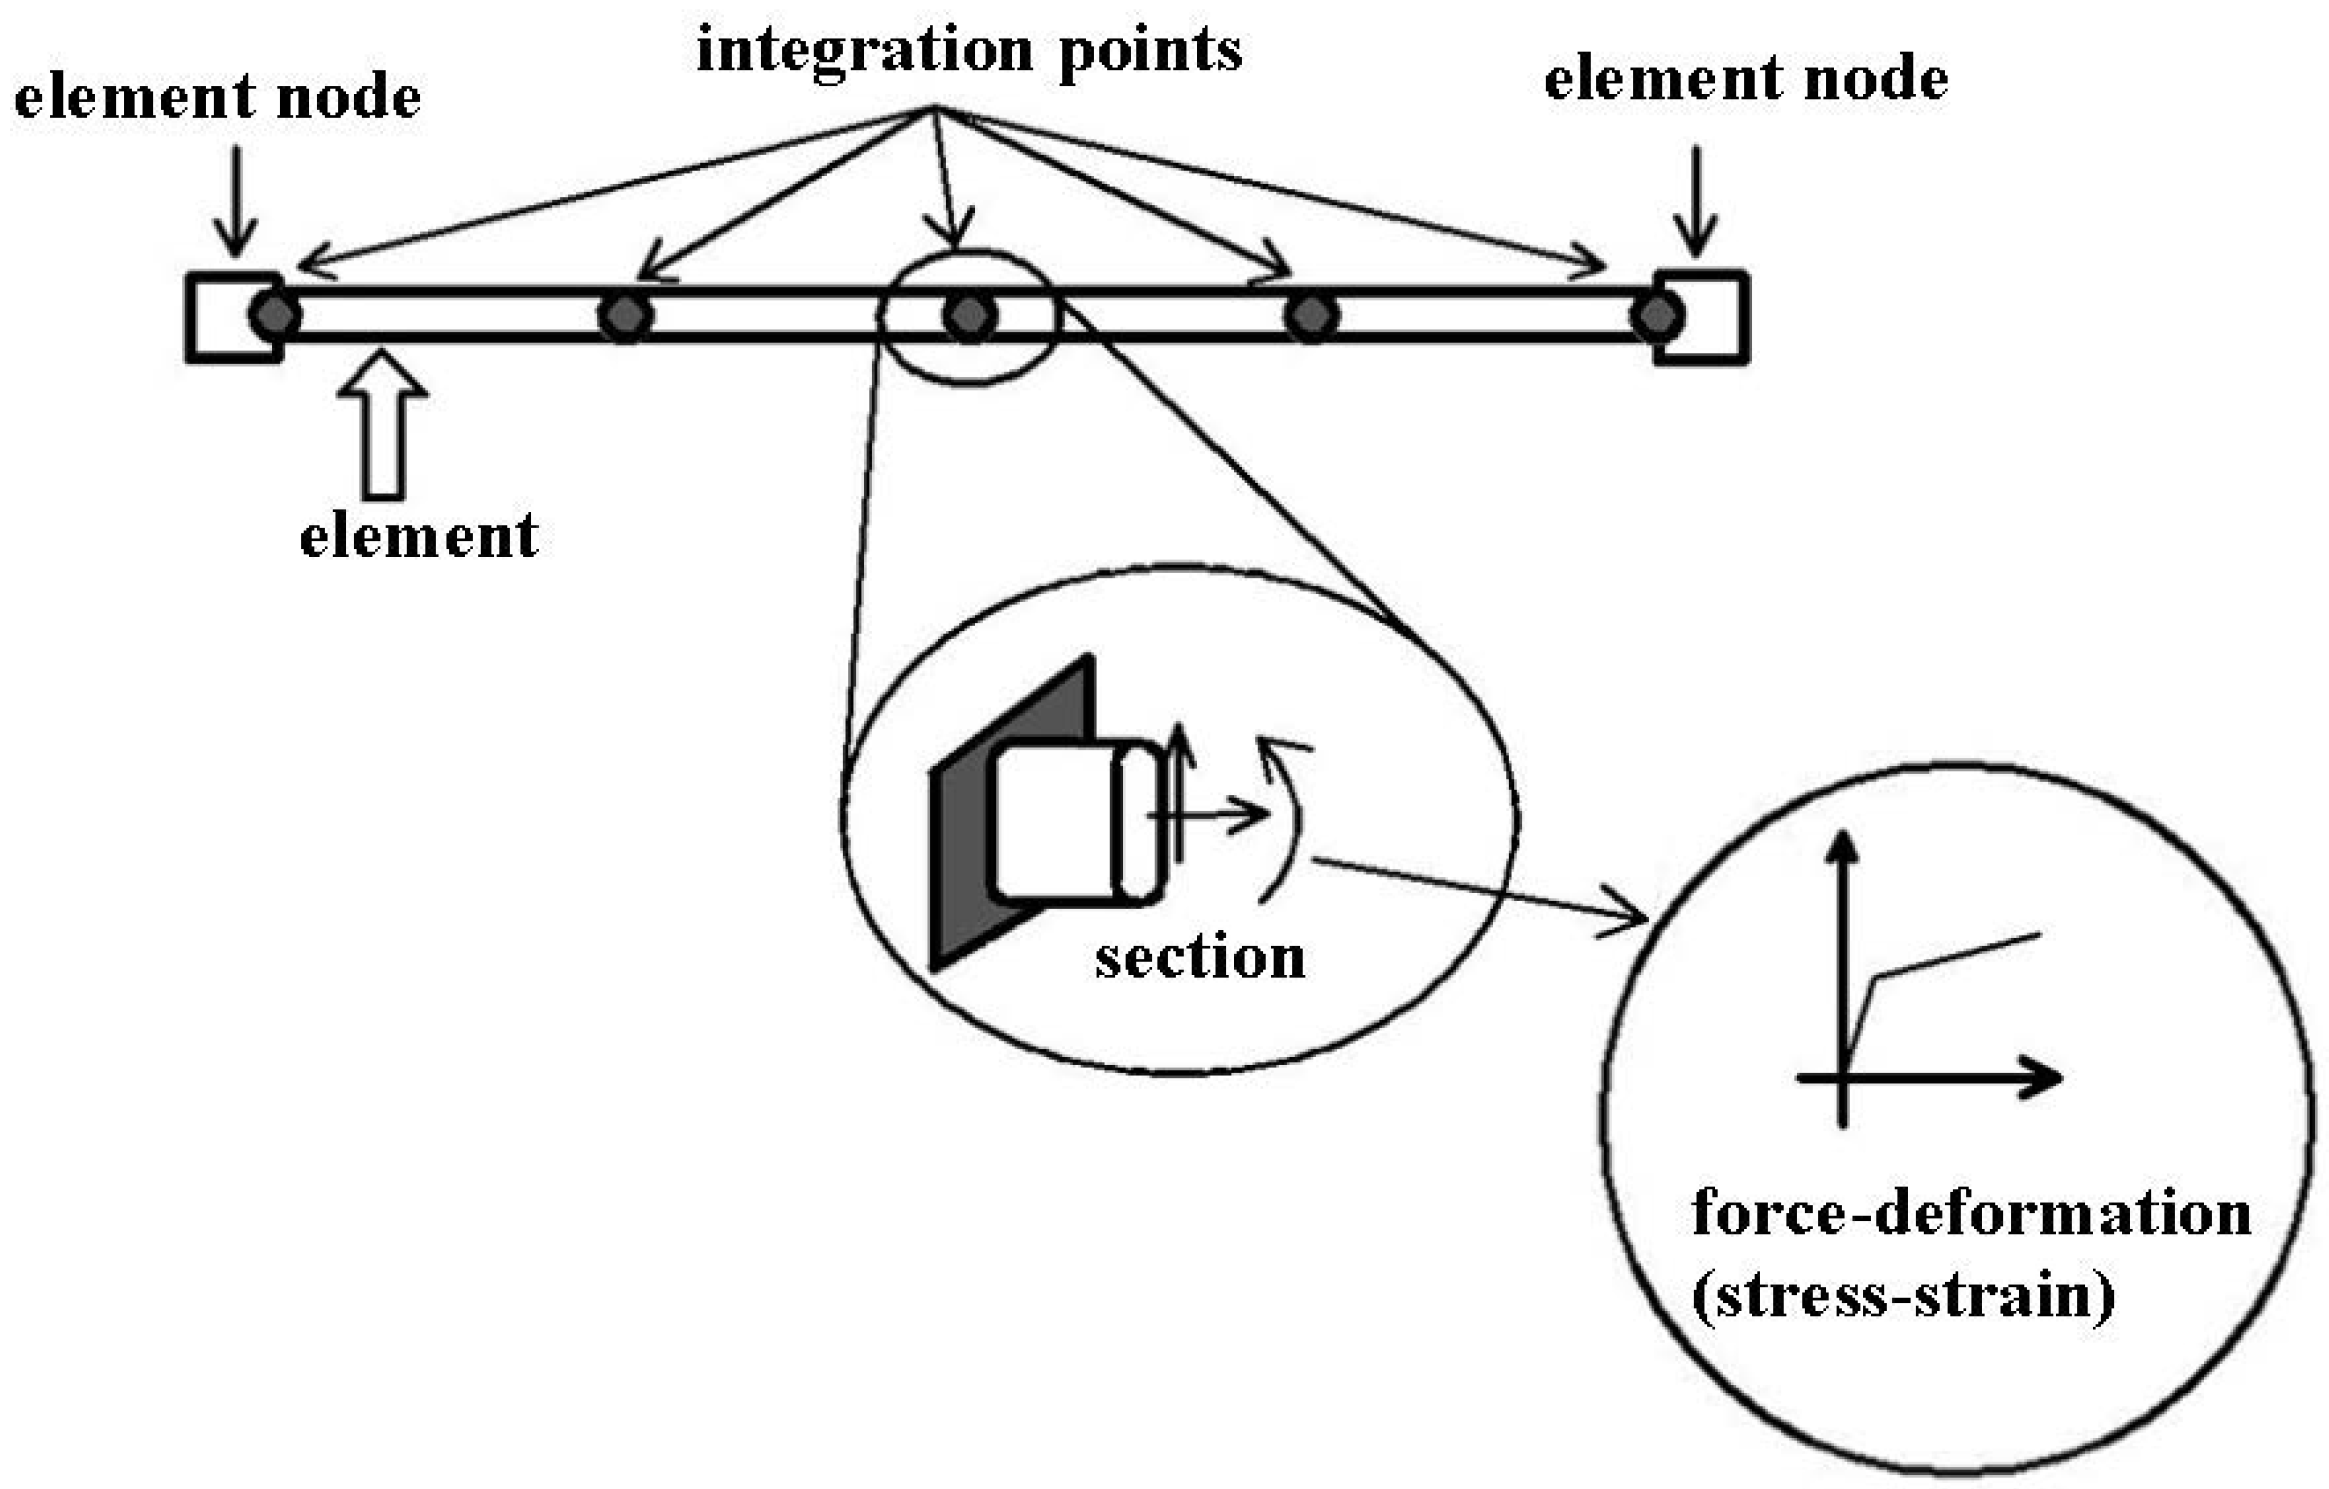
Figure 13). The beam-column unit makes use of the non-linear fiber model that OpenSees provides in its simulation (see Figure 14). In accordance with the equivalent principle of compressive stiffness and bending stiffness, the MRL wall is analyzed as a reinforced concrete plate, where the ShellMITC4 unit (model provided by OpenSees) is defined by a multi-layered shell element [29,30].
Figure 12. Stress-strain relation of concrete.
Applsci 06 00021 g012
Figure 13. Skeleton curve of the hysteretic material.
Applsci 06 00021 g013
Figure 14. The composite of beam and column element.
Applsci 06 00021 g014
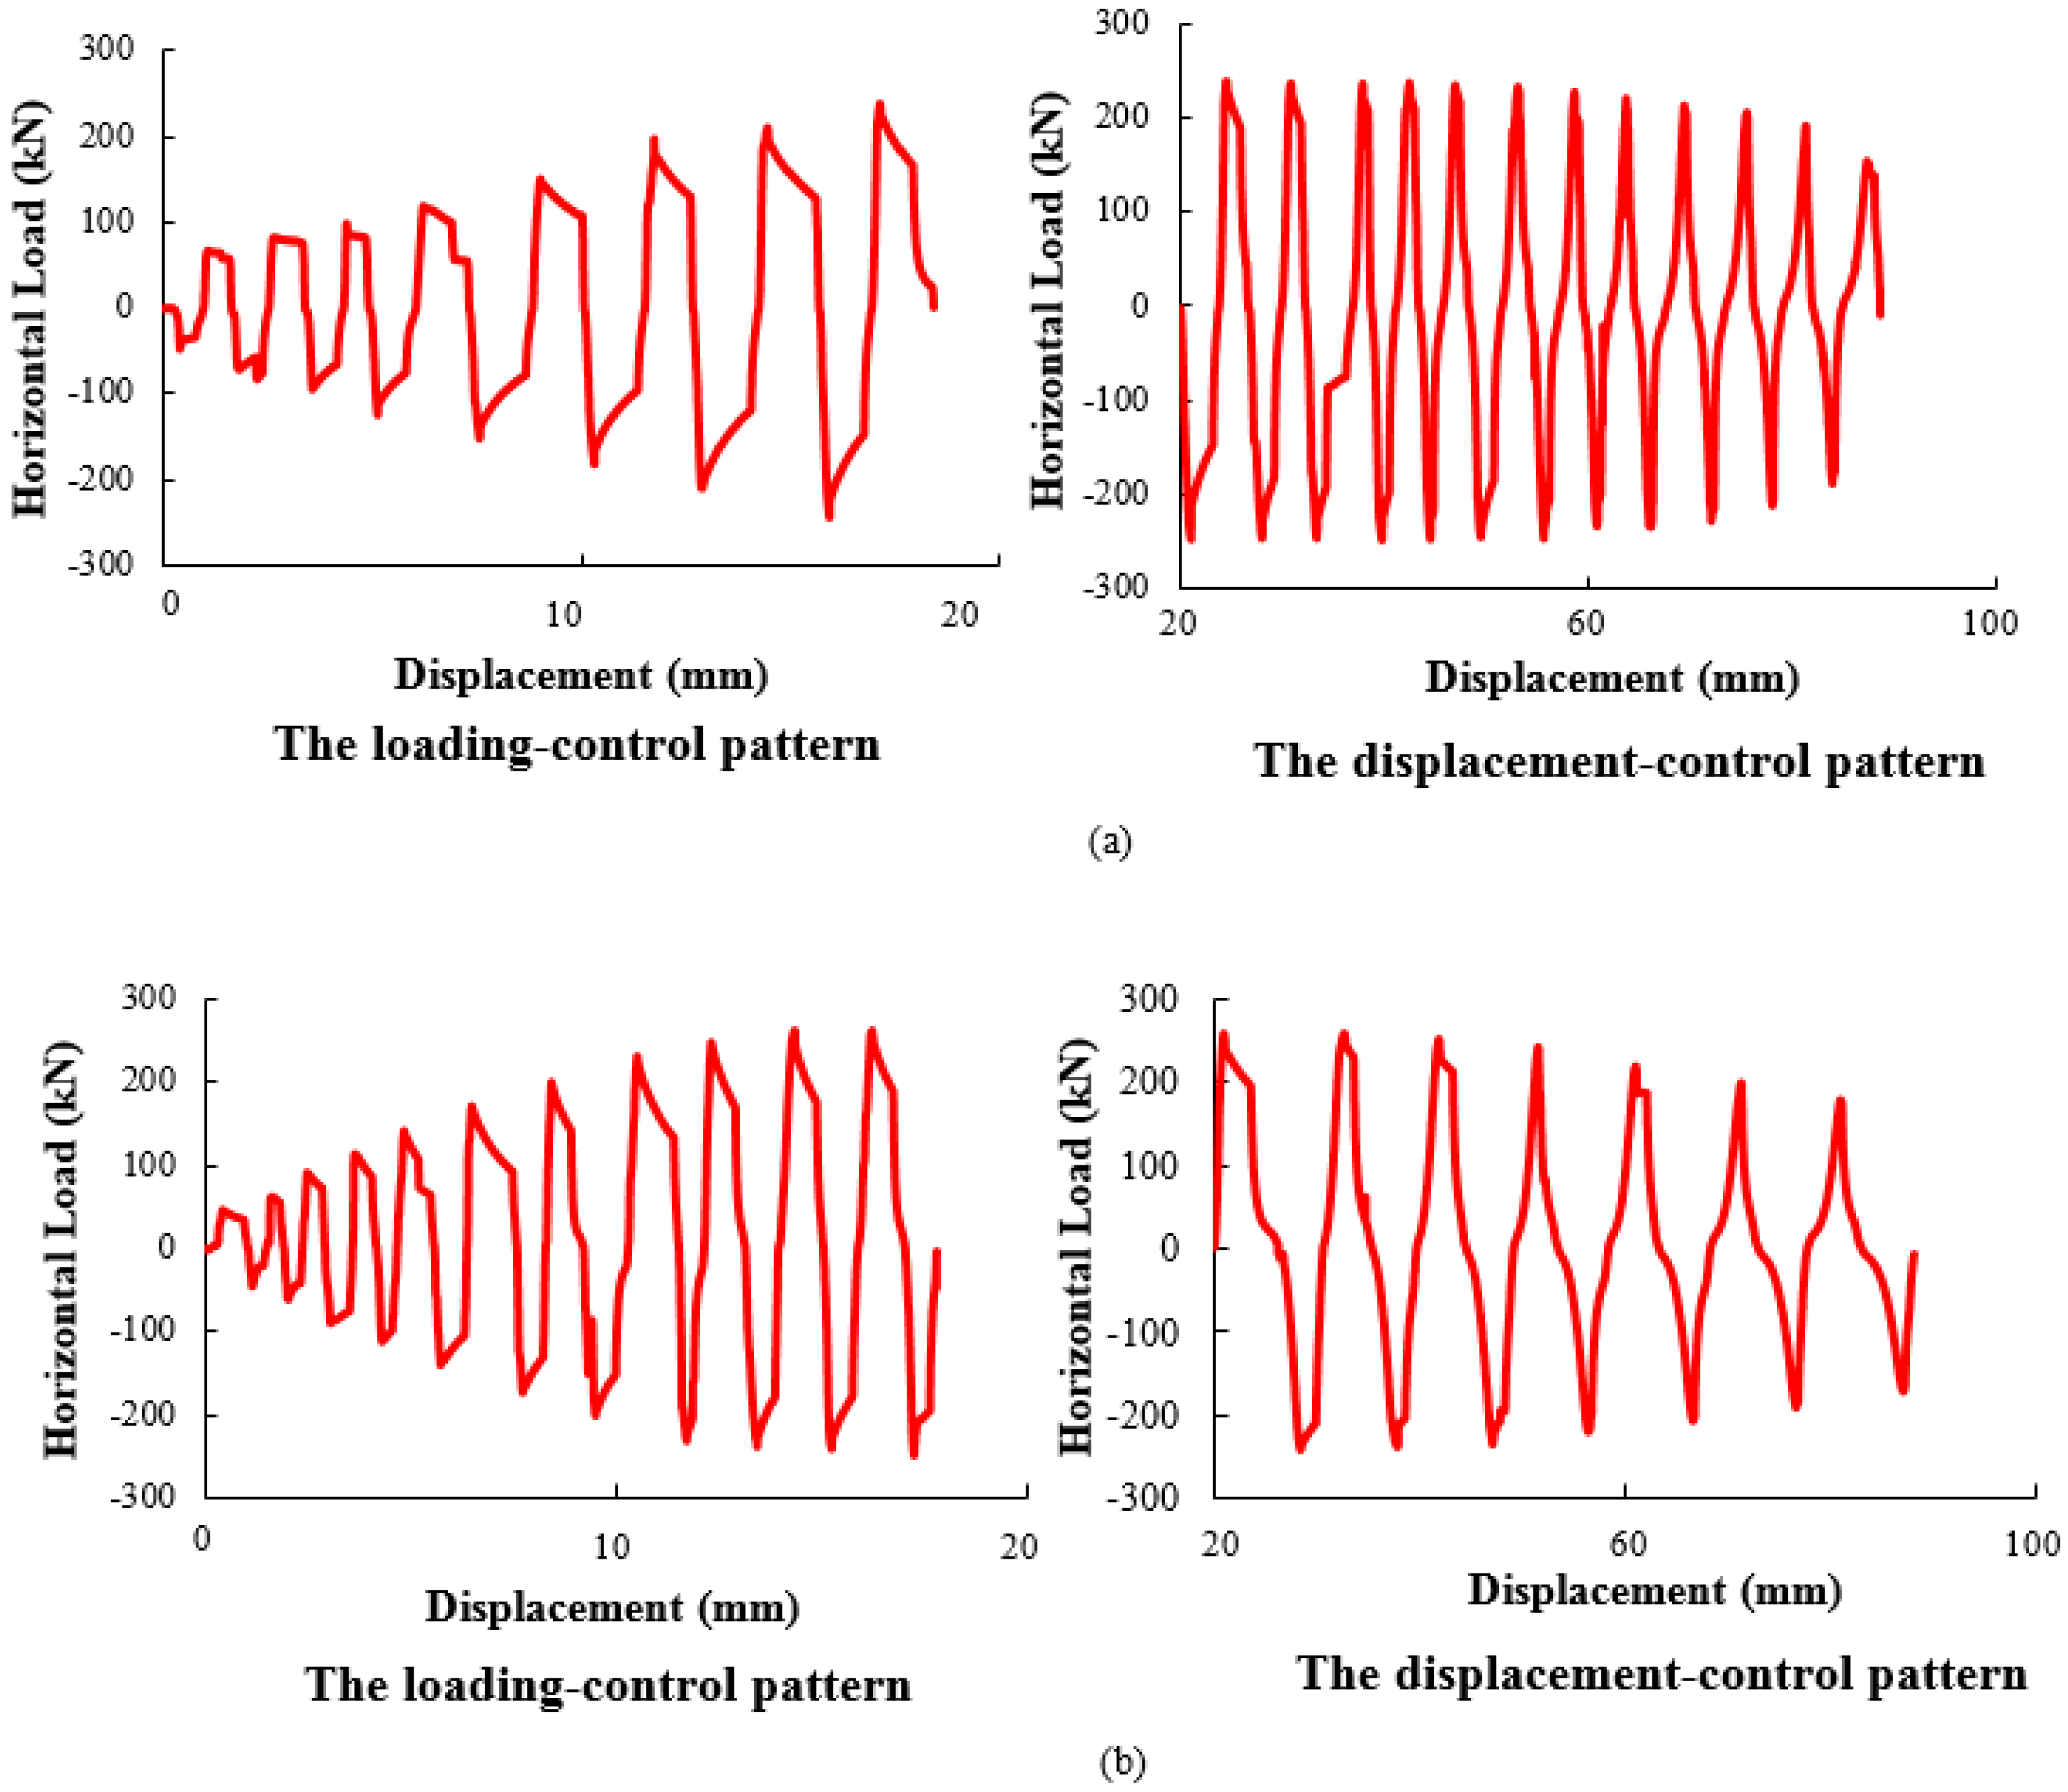
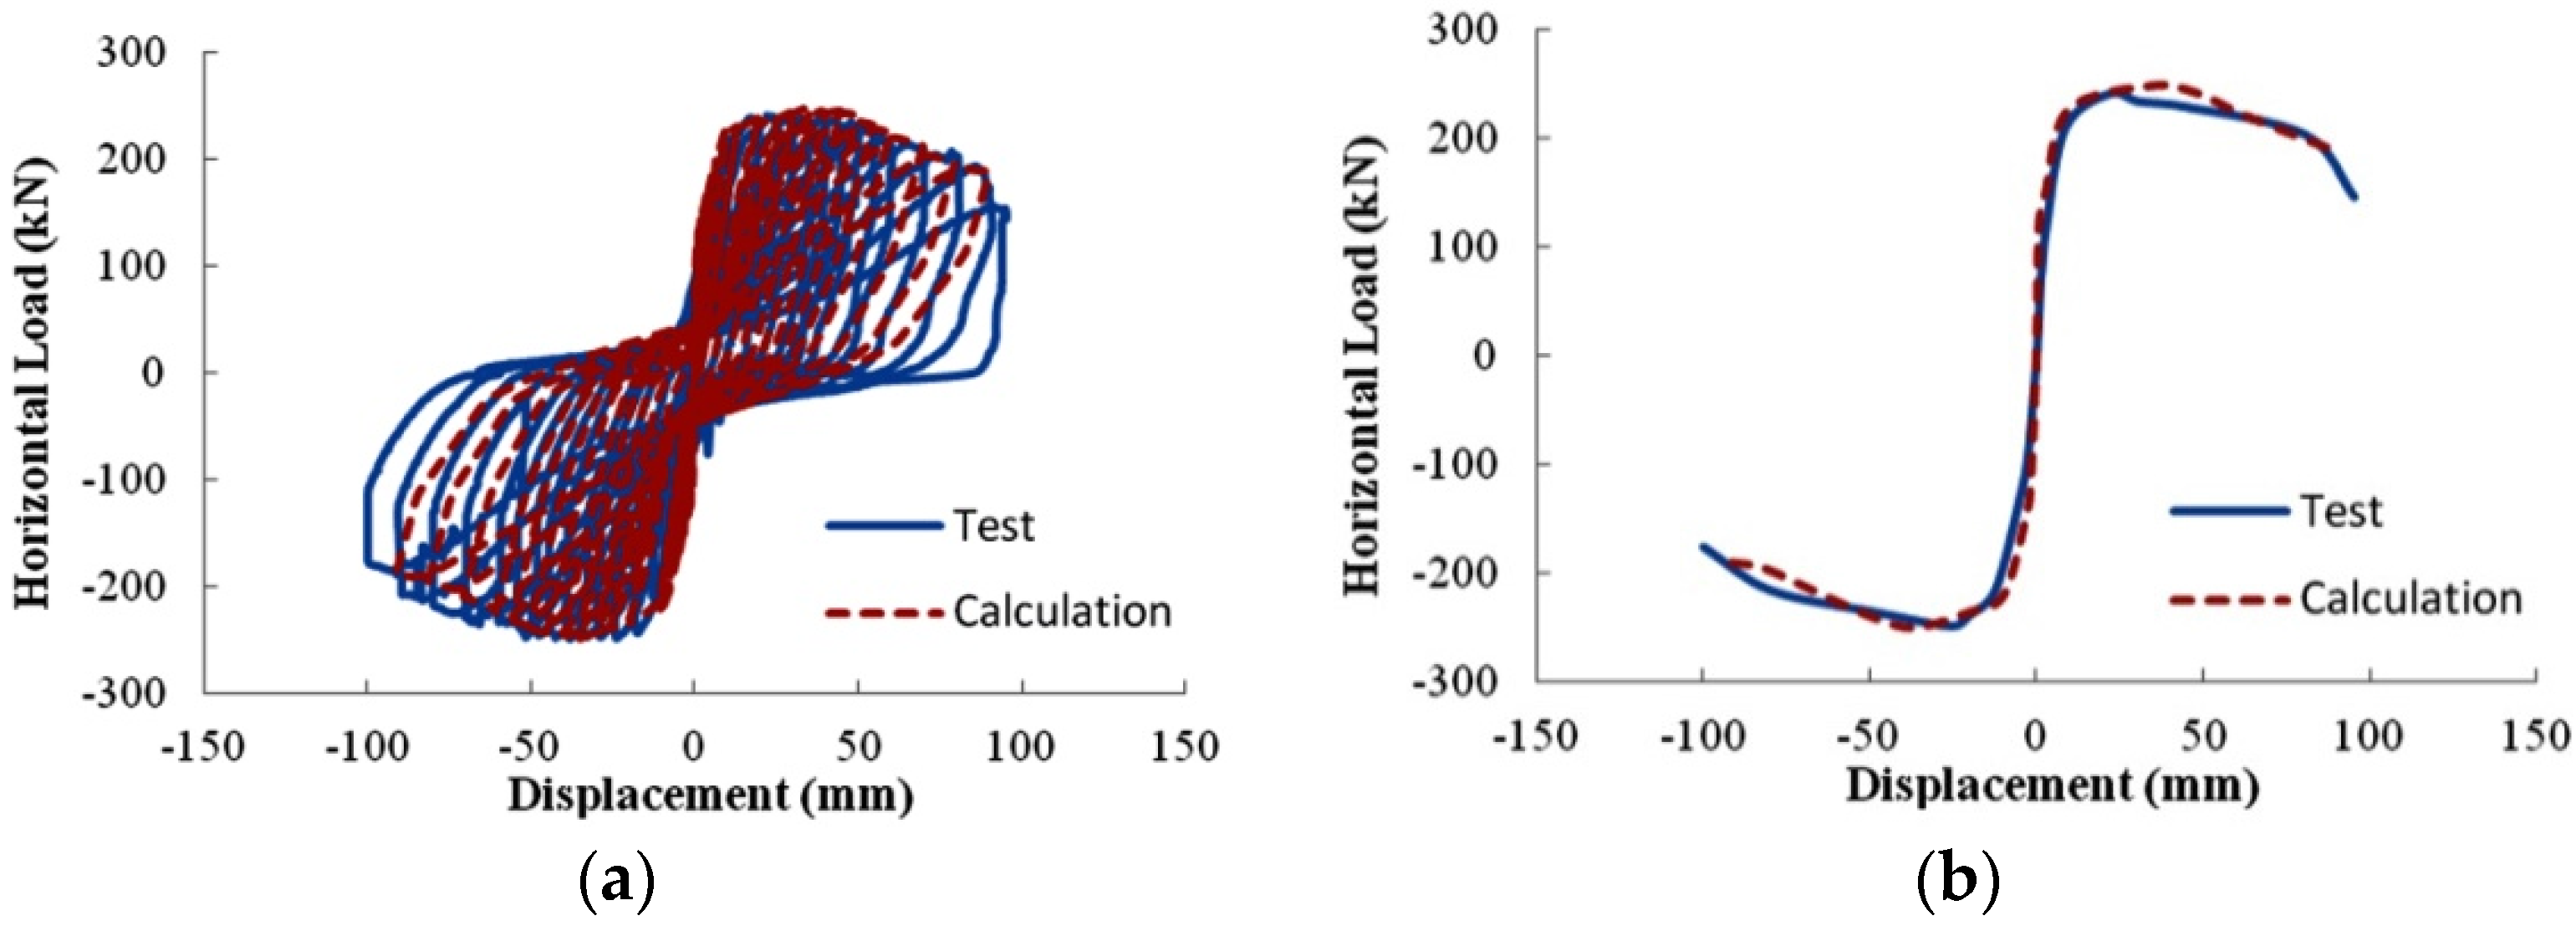
The test data collected were compared with the calculation results of the hysteretic curve and the skeleton curve to verify the model, refer to Figure 15 for comparison of hysteretic curves and skeleton curves of the calculated values and the test data for FSMRL-2.
Figure 15. Comparative diagrams for hysteretic and skeleton curves (calculated values and test data). (a) hysteretic curve; (b) skeleton curve.
Applsci 06 00021 g015
From Figure 15, it can be concluded that the calculated values of both hysteretic curves and skeleton curves are consistent with the corresponding data collected from the test. The hysteretic loops tend to expand horizontally, which indicates a fairly good capacity for energy dissipation. Due to block and concrete exfoliation and the yielding of the reinforced steel, the hysteretic loops starts to “pinch” in the middle in the later stages of loading, whereas sliding occurs between the upper and the lower layers. The skeleton curves are consistent in terms of the trends, and the loading simulation was proven accurate from the cracking, yielding, and peaking of the damage to the specimens.

4.3. Analysis of the Load-Bearing Performance when the Stiffness Ratio Exceeds 1

As 
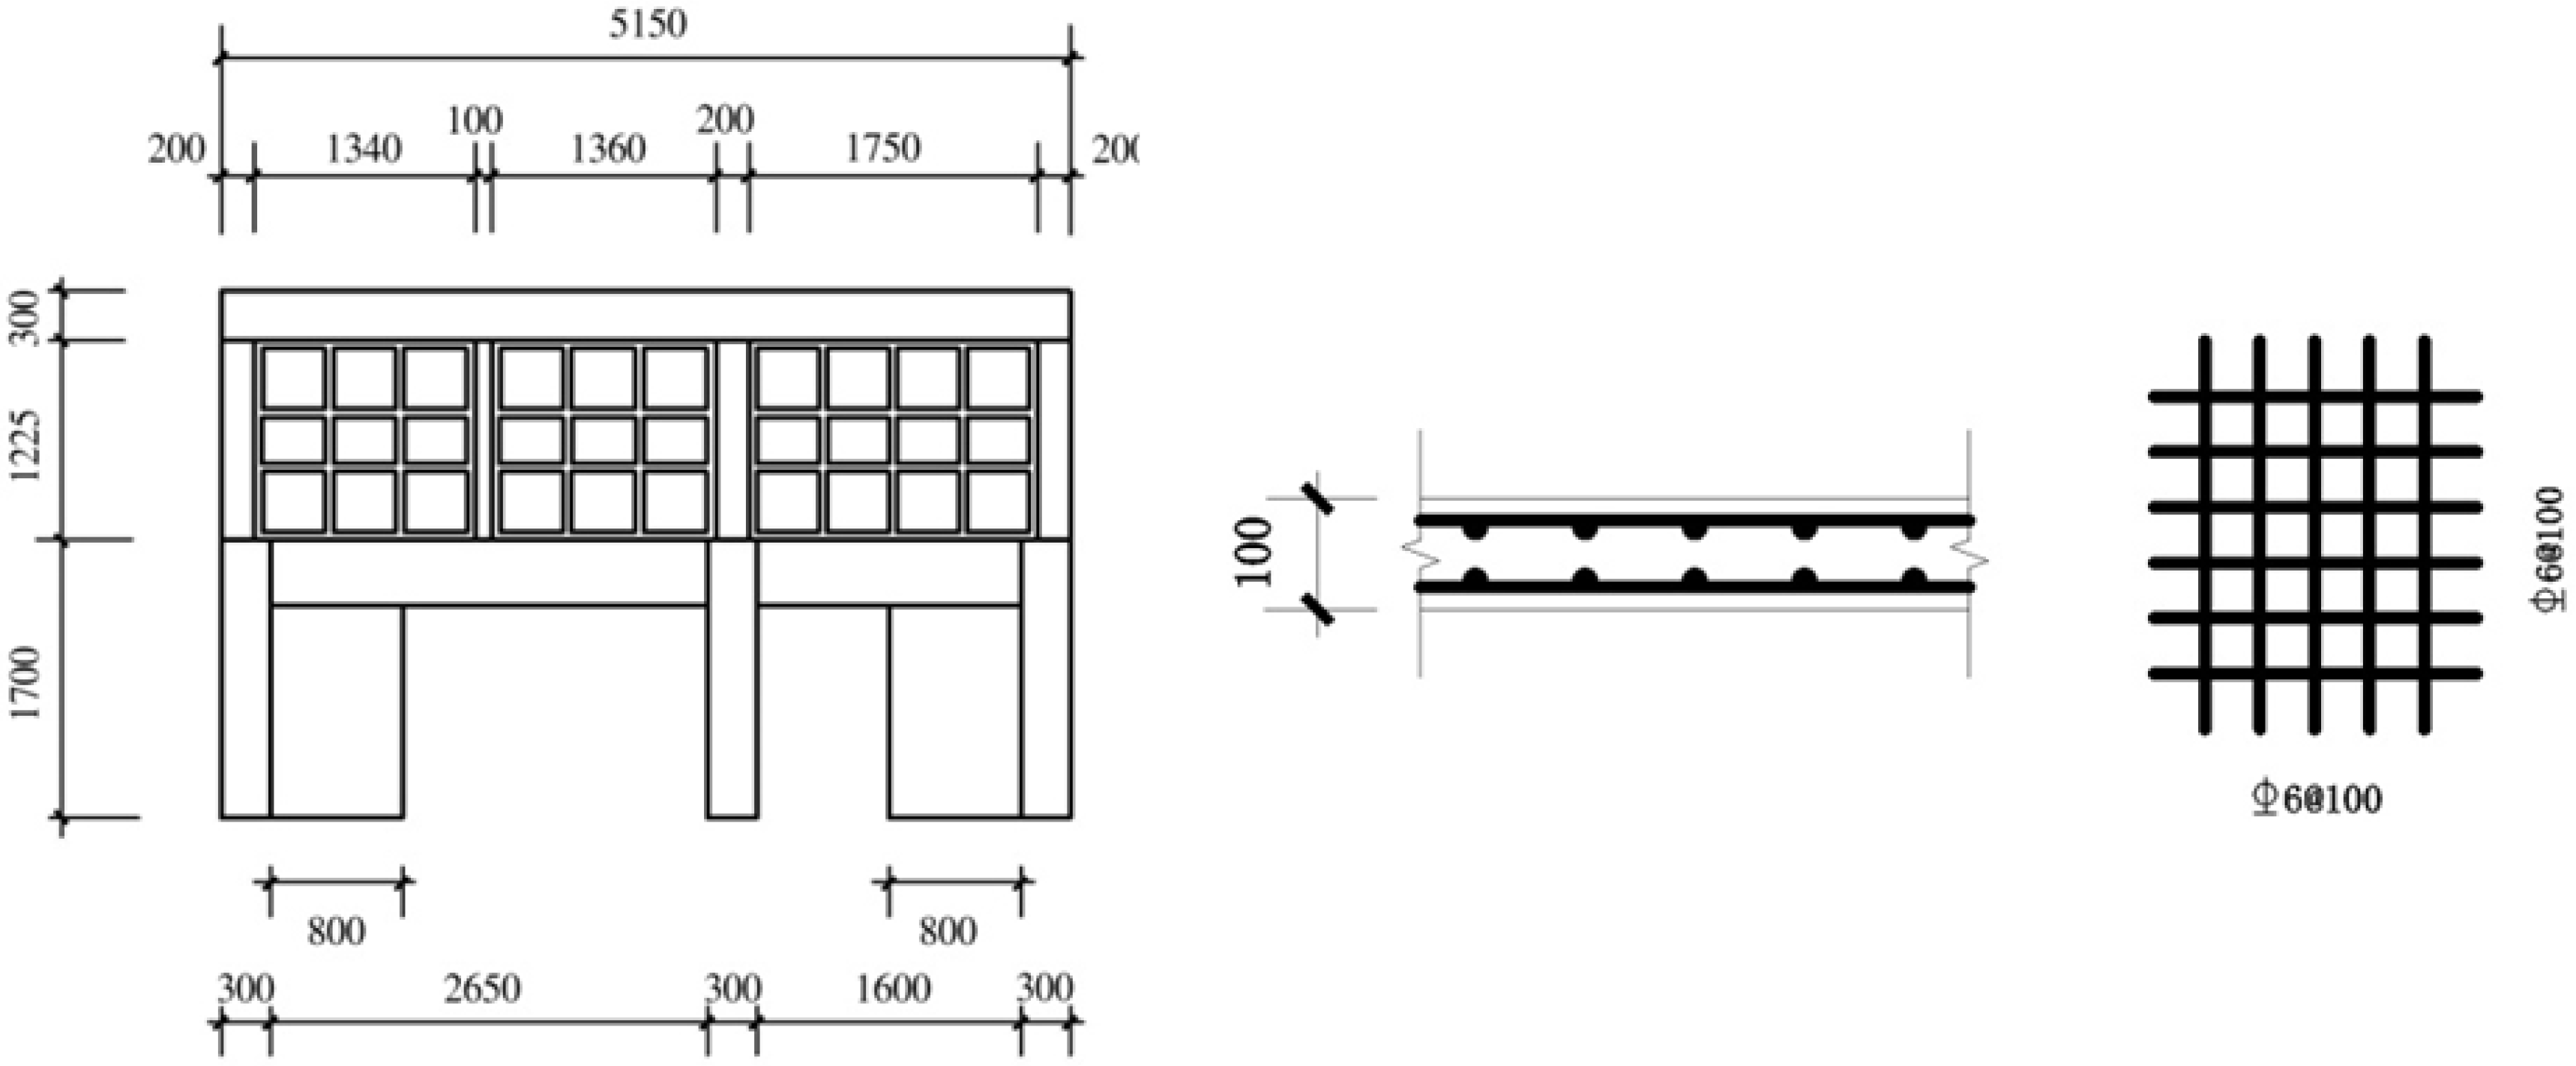
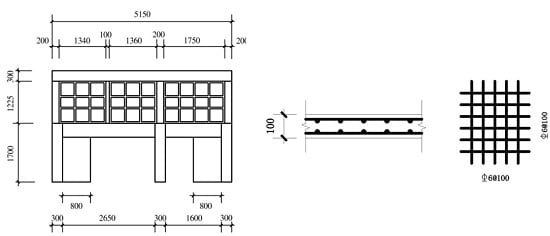
Table 1 shows, the height increase of the FS layer results in a stiffness decrease, indicating the deterioration of the load-bearing performance of the overall structure. In practice, because a large space is generally reserved for the lower layer, the layer height tends to be considerable. In this regard, shear wall structures can be introduced—when necessary—to lower the stiffness ratio at the interim layer, which helps to improve the load-bearing performance of the structure at large. Here, the paper takes the FSMRL wall structures with an FS layer height of 1700 mm as the study object, both sides of which are enhanced by shear walls of different widths, namely 0 mm for MX-1, 200 mm for MX-2, 300 mm for MX-3, 400 mm for MX-4, 500 mm for MX-5, 600 mm for MX-6, 700 mm for MX-7, and 800 mm for MX-8. With a uniformed thickness of 100 mm, the shear walls applied for this experiment—both horizontal and vertical—use φ6 reinforcement with an interval of 100 mm (See Figure 16). The detailed reinforcement is shown in Figure 4. The calculated results of stiffness ratio are summarized in Table 5.
Figure 16. The study model.
Applsci 06 00021 g016
Table 5. Stiffness ratio at the interim layer (with shear wall width as variable).
ModelMX-1MX-2MX-3MX-4MX-5MX-6MX-7MX-8
Stiffness ratio at the interim layer3.393.263.002.622.191.781.421.13
Figure 17. 
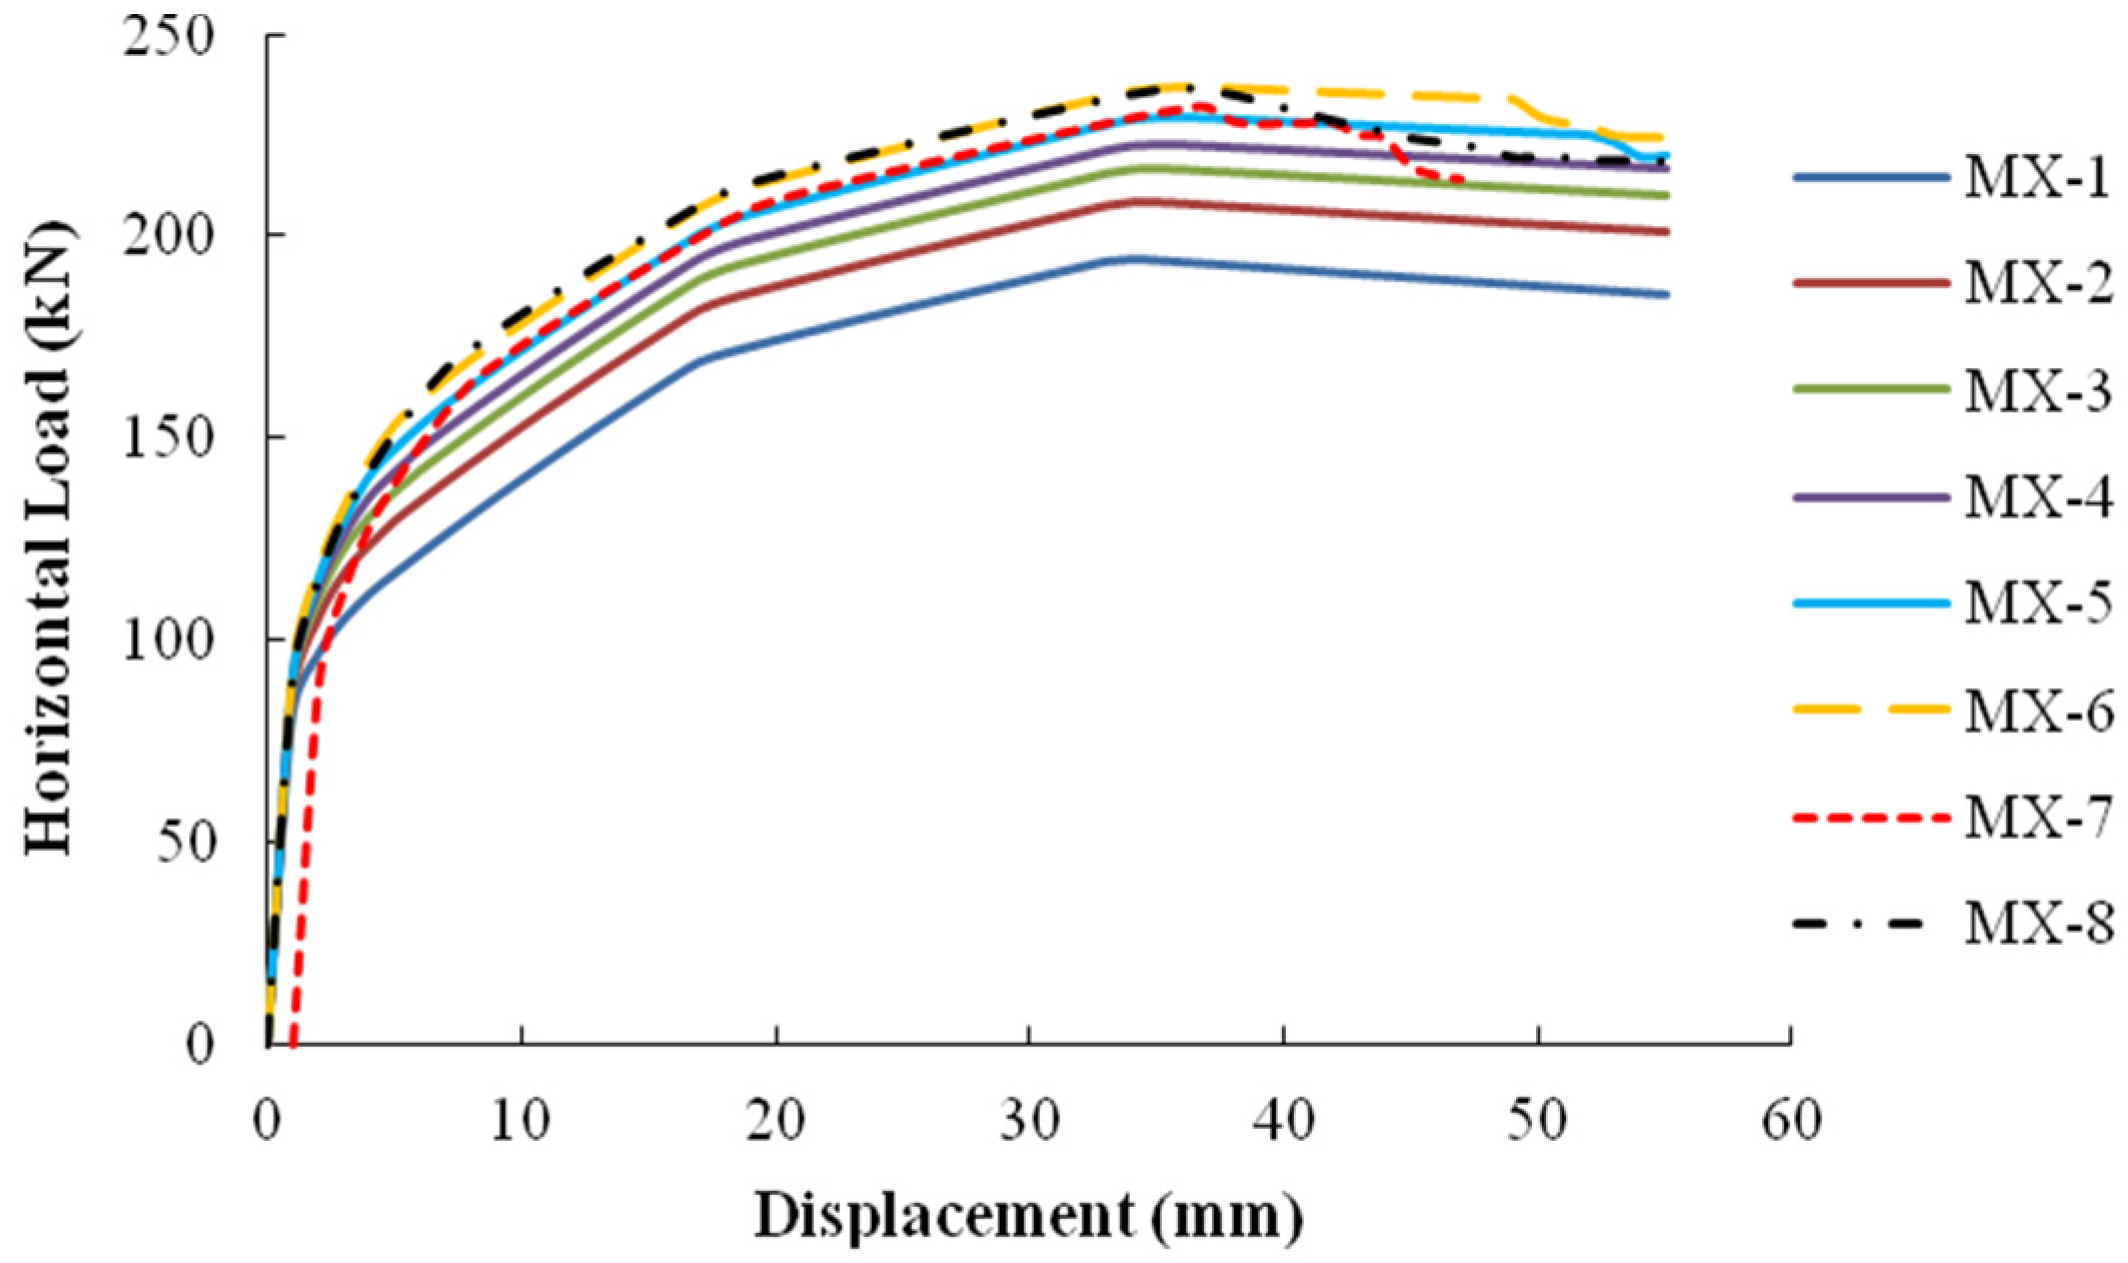
Force exerted on the FSMRL wall structures (with shear wall width as variable).
Applsci 06 00021 g017
The simulation of the load-bearing performance is conducted using OpenSees. To streamline the calculation process, the authors conduct monotone loading to obtain loading-displacement curves, which are displayed in Figure 17.
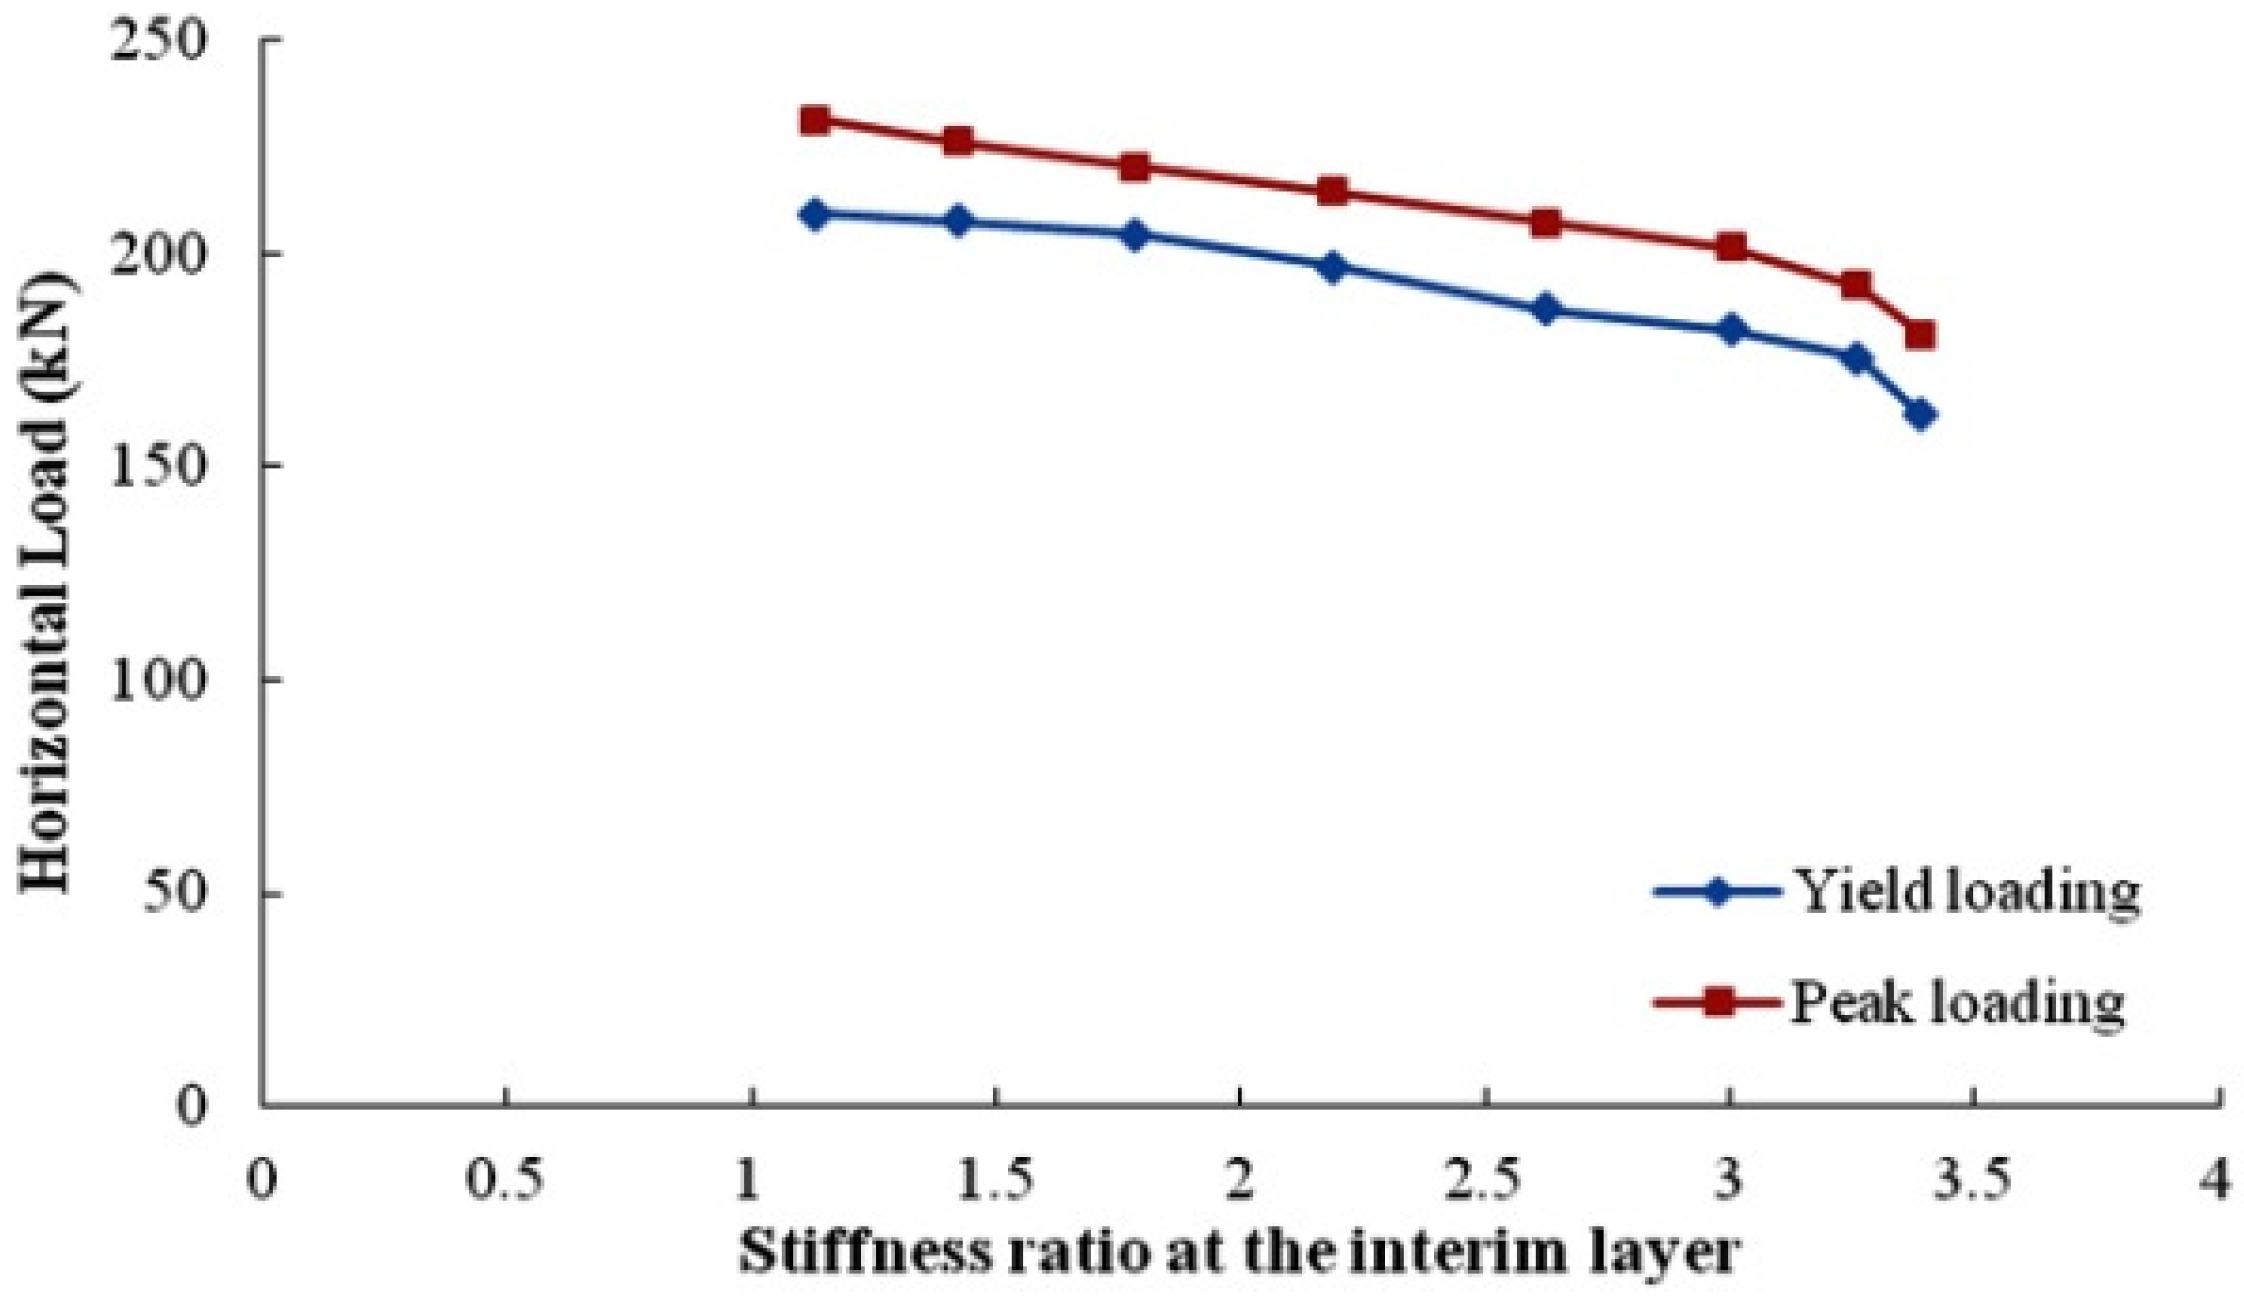
Based on the force-displacement curves, the relation between the yield loading and peak loading exerted and the stiffness ratio at the interim layer were identified (See Figure 18).
It can be concluded from Figure 18 that the increase in the interim stiffness ratio triggers a decline in the yield and peak loading. When the stiffness ratio exceeds 2.5, the decrease of the peak loading increases in speed, whereas the loading exerted at the yield of the specimen drops dramatically after the ratio exceeds 3. The paper recommends a not-less-than 2.5 interim stiffness ratio for the FSMRL wall structure, because the yield strength needs to be maintained at a certain level without compromising the overall structural reliability (The higher the interim stiffness ratio grows, the faster the frame-supported-layer stiffness decreases. In the meantime, the drop of the yield loading influences the overall structural reliability).
Figure 18. Relation between the interim stiffness ratio and load-bearing performance.
Applsci 06 00021 g018

4.4. Analysis of the Load-Bearing Performance when the Stiffness Ratio Falls Below 1

Due to the shear wall added for this experiment and the hole opening of a large amount at the upper structure (for functional purposes), the stiffness ratio falls below 1. Therefore, it is possible that the upper structure may encounter premature failure caused by the extremely low stiffness in the lateral force resistance. To this end, the paper adjusts the location and the dimensions of the hole opening in an attempt to obtain a host of stiffness ratios below 1. The simulation is performed using OpenSees, which provides the variation pattern for the influence of the stiffness ratio on the overall structure.
The FSMRL wall structures with 100 mm thick and 800 mm wide shear walls at both sides (whose reinforcement is displayed in 
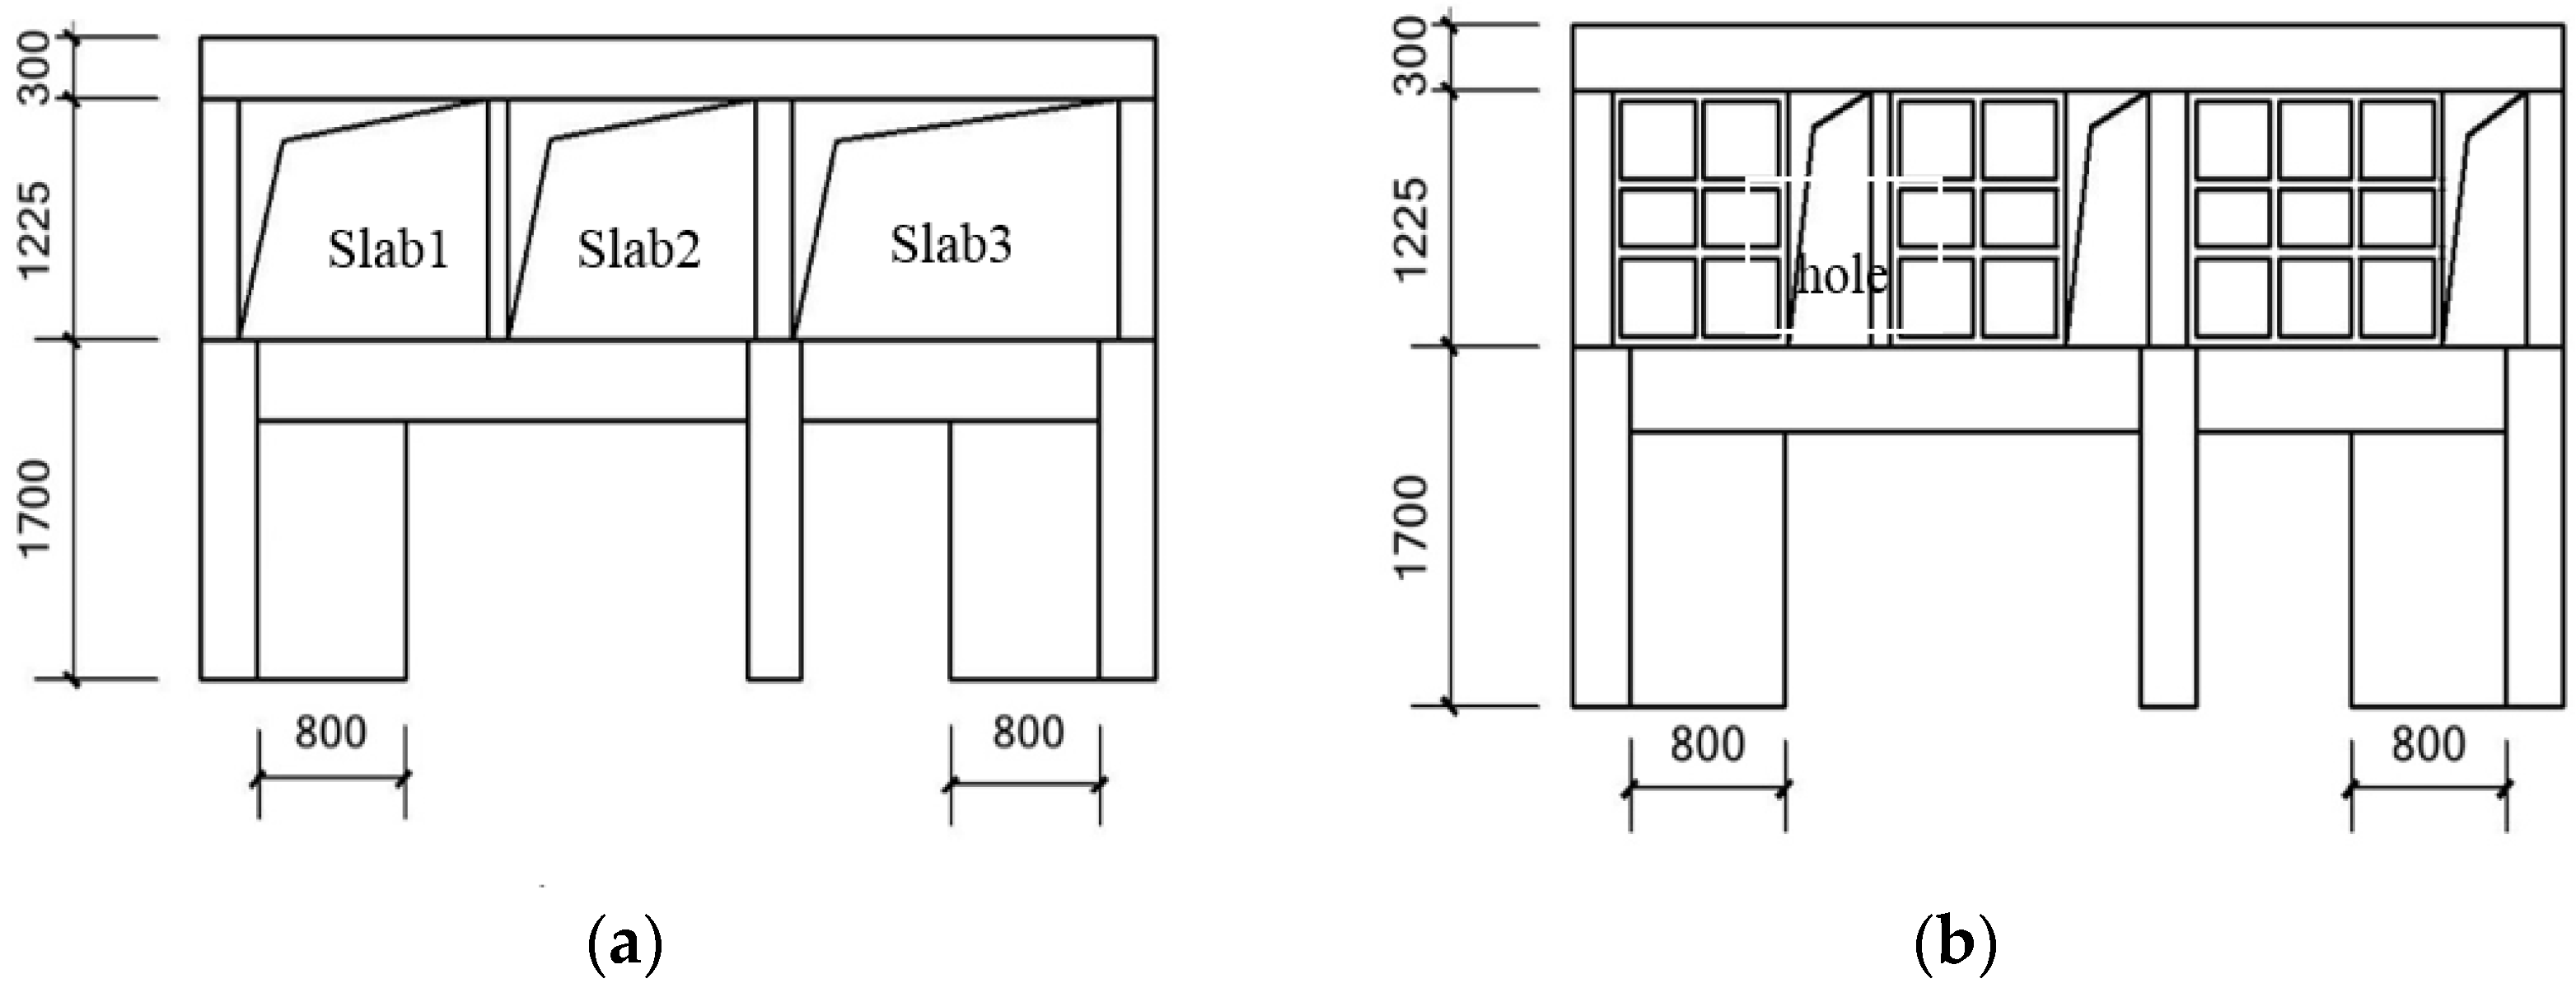
Figure 16) use a 1700 mm FS layer height, and the upper structure varies in MX-9 to MX-16 from a frame with no blocks embedded to MRL walls of different widths (see Figure 19 and Table 6). The detailed reinforcement and dimensions for the opening are shown in Figure 4. The interim stiffness ratios for the different structural layouts are calculated, and the results are listed in Table 7.
Table 6. FSMRL wall structure with different hole opening.
Model NumberMX-9MX-10MX-11MX-12MX-13MX-14MX-15MX-16
The Opening Rate
Slab 112/32/32/31/31/31/31/3
Slab 2112/32/32/31/31/31/3
Slab 31113/43/43/41/21/4
Figure 19. Partial FSMRL wall structure with different hole opening. (a) MX-9 (a frame with no blocks at the upper structure) (b) MX-16 (blocks embedded to slab 1, 2, and 3 with different opening rates at the upper structure).
Applsci 06 00021 g019
Table 7. Stiffness ratio at the interim layer (with hole as variable).
Model NumberMX-9MX-10MX-11MX-12MX-13MX-14MX-15MX-16
Interim stiffness ratio0.110.210.320.420.520.620.720.82
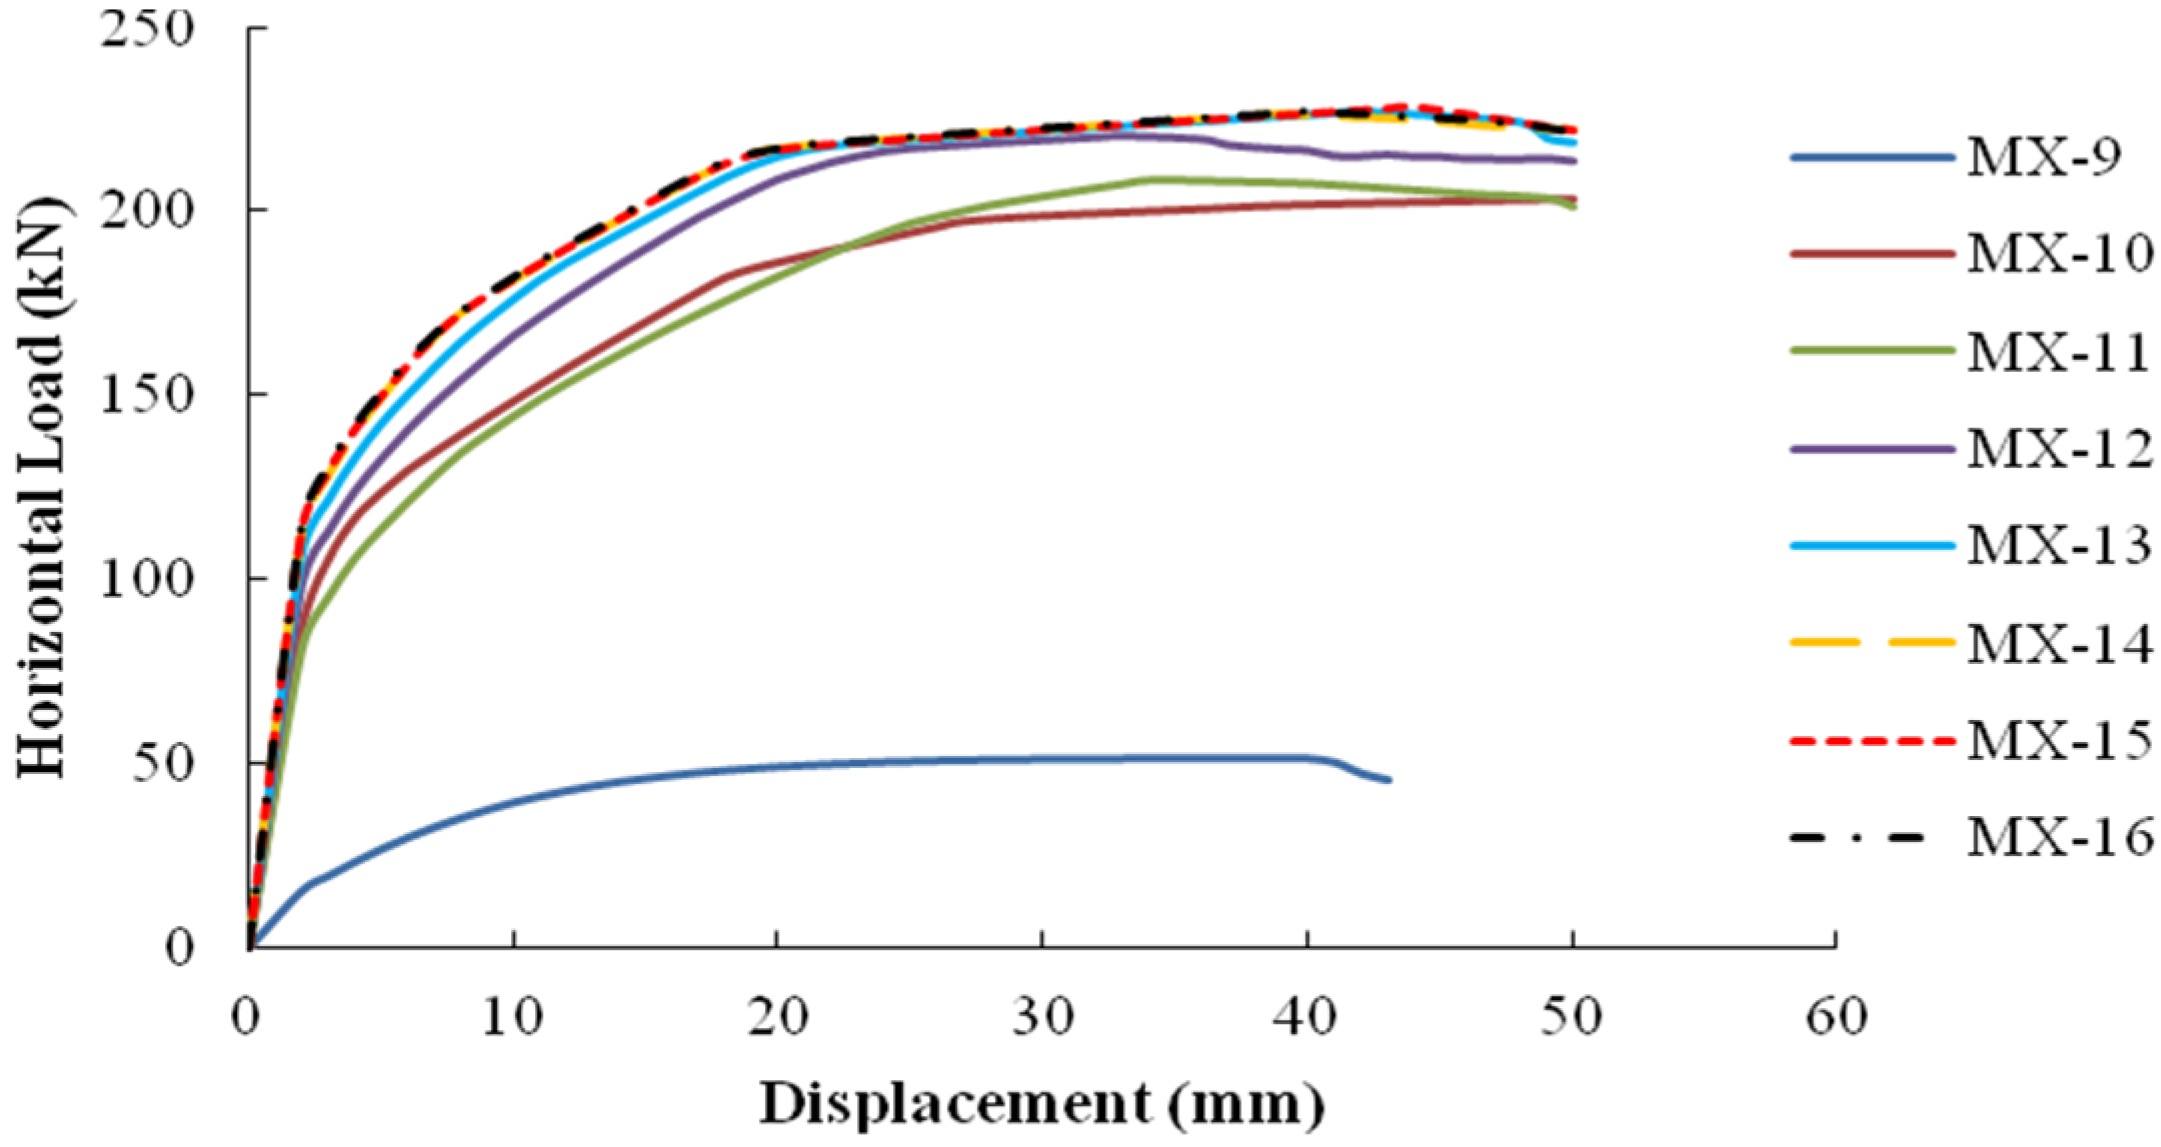
Figure 20 depicts the load-bearing performances of the specimens.
Figure 20. Force exerted on the FSMRL wall structures (with hole as variable).
Applsci 06 00021 g020
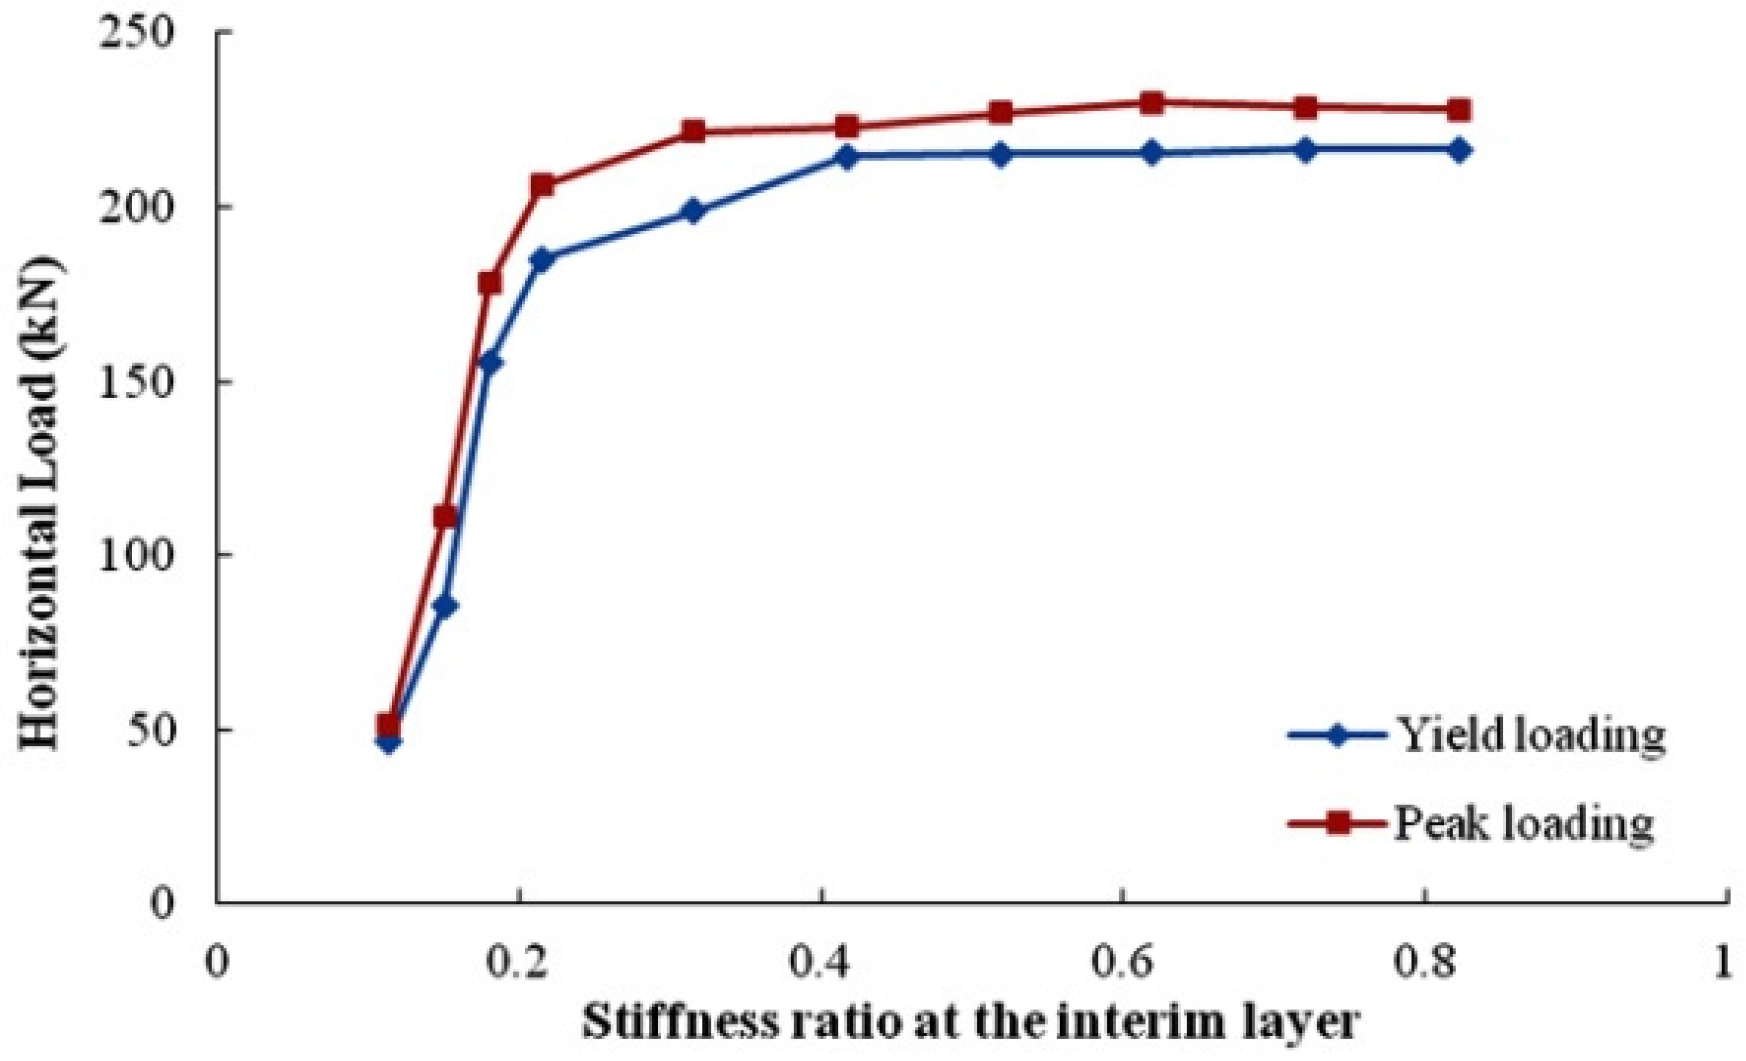
Based on the force-displacement curves listed above, the relation between the yield and peak loading and the interim stiffness ratio are identified for each specimen (see Figure 21).
Figure 21. Relation between interim stiffness ratio and load bearing performance.
Applsci 06 00021 g021
Figure 21 shows that when the stiffness ratio falls below 0.4, the yield and peak loading limit drop at an alarming rate due to the MRL wall’s relatively low stiffness level in lateral force resistance. The premature failure undermines the overall bearing capacity; therefore, an interim stiffness ratio of at least 0.4 must be guaranteed for the structure.

4.5. Suggested Numerical Range for the Interim Stiffness Ratio in the Engineering Design Stage

This paper integrates the findings of Figure 18 and Figure 21 on the influence of the interim stiffness ratio on the specimen’s load-bearing performance, and presents Figure 22 as a conclusive summary.
Figure 22. Relation between interim stiffness ratio and load bearing performance.
Applsci 06 00021 g022
The following can be concluded from Figure 22:
(1)
When the stiffness ratio is approximately 1, the yield and peak loading reach a maximum, which can be interpreted as fairly good load-bearing performance with even distribution of stiffness between the upper and the lower structure.
(2)
Based on the variation pattern of the yield and peak loading, the paper takes into consideration the seismic performance required and identifies the numerical range for the interim stiffness ratio, which falls between 0.4 and 2.5. The maximum displacements for MX-12, MX-13, MX-14, MX-15, and MX-16 are 1/300, 1/433, 1/555, 1/820, and 1/900, respectively, but the inter-layer displacement angle does not exceed 1/800. On this basis, the paper suggests a numerical range of 0.7 to 2.5 for engineering design.

5. Summary and Conclusions

The paper studied the influence of the interim stiffness ratio on the load-bearing performance of the FSMRL wall structure and presented evenly-distributed figures by adding shear walls with different widths to the FS layer or by using various hole opening approaches; the load-bearing process is then simulated using OpenSees software, which provides relationship curves for the stiffness ratio and the yield and/or peak loading.
(1)
The paper recommends a not-less-than 2.5 interim stiffness ratio for the FSMRL wall structure, because the yield strength needs to be maintained at a certain level without compromising the overall structural reliability. At the same time, an interim stiffness ratio of at least 0.4 must be guaranteed for the structure, because if the stiffness ratio falls below 0.4, the yield and peak loading limit drop at an alarming rate.
(2)
The increase of hole opening ratio—the area of the hole to the area of the slab—brings up the maximum displacement angle, based on the limit of the inter-layer displacement angle, which does not exceed 1/800, the range is adjusted to 0.7 to 2.5 for reasonable engineering design in practice.

Notation

γe: equivalent stiffness ratio at the interim layer
H1: height of the interim layer (frame-supported layer)
Δ1: elative displacement at the interim layer
H2: eight of the upper storey (MRL wall layer)
Δ2: relative displacement of the upper storey
H: wall height; Ieq: inertia moment of equivalent wall section
H: height of wall section; Ae: area of equivalent wall section
beq: width of equivalent wall section; Gc: shear modulus for concrete
μN: axial compressive ratio (when μN falls below 0.3, μN is 0.3; likewise if μN exceeds 0.6, then μN is 0.6)
Ac: sum of the cross-section area of concrete used for ribbed columns, connected columns and edge members (flange concrete excluded)
Aq: sum of the cross-section area for embedded blocks
μ: non-uniform coefficient for the shear stress distribution at the cross-section (for a rectangle cross-section, μ = 1.2)
ηc: coefficient that reflects the restraint of the ribbed beams and the ribbed columns on the embedded blocks, which can be set to 1.05 (or ηc = 1.05)
Ec: elastic modulus of concrete; Eq: elastic modulus of embedded block
αc: modified coefficient for the lateral-resistant stiffness; ic: frame stiffness or the stiffness of seismic wall
$fpc: concrete compressive strength at 28 days (compression is negative)
$epsc0: concrete strain at maximum strength
$fpcu: concrete crushing strength
$epsU: concrete strain at crushing strength
$λ: ratio between unloading slope at $epsU and initial slope (The initial slope for this model is 2 × $fpc/$epsc0)
$s1p $e1p: stress and strain (or force & deformation) at first point of the envelope in the positive direction
$s2p $e2p: stress and strain (or force & deformation) at second point of the envelope in the positive direction
$s3p $e3p: stress and strain (or force & deformation) at third point of the envelope in the positive direction (optional)
$s1n $e1n: stress and strain (or force & deformation) at first point of the envelope in the negative direction
$s2n $e2n: stress and strain (or force & deformation) at second point of the envelope in the negative direction
$s3n $e3n: stress and strain (or force & deformation) at third point of the envelope in the negative direction (optional)
K0: initial elastic stiffness
µ: exponent of non-linear hardening component
$β: power used to determine the degraded unloading stiffness based on ductility, µ−$β (optional, default = 0.0)
In cases $s3p > $s2p and abs ($s3n) > abs ($s2n), the envelope of the hysteretic material after $e3p or $e3n follows the slope defined by the 2nd and 3rd points of the envelope.
In cases $s3p <= $s2p and abs ($s3n) <= abs($s2n), the envelope of the hysteretic material after $e3p or $e3n is a flat line with a constant stress (or force) equal to $s3p or $s3n

Acknowledgments

This research was conducted with the financial support of the National Natural Science Foundation of China (NO. 51508009) and the Project was supported by the Beijing Postdoctoral Research Foundation (2015ZZ-29). National Science and technology support program of China (NO. 2015BAL03B01).

Author Contributions

Suizi Jia performed the experiments, analyzed the data, and wrote the manuscript; Suizi Jia, Wanlin Cao and Quan Yuan designed the experiments; Suizi Jia and Yuchen Zhang modified the final paper.

Conflicts of Interest

The authors declare no conflict of interest.

References

  1. Wang, T.; Lei, Y.; Zhang, Y.; Kong, Z. Seismic damage analysis of school buildings in Lushan earthquake. J. Earthq. Eng. Eng. Vib. 2013, 33, 36–47. [Google Scholar]
  2. Wang, Y.R.; Feng, X.G.; Fu, B. The influence of pier stiffness ratio on the failure modes of masonry structures. Shork Vib. 2015, 2015, 1–15. [Google Scholar] [CrossRef]
  3. Ghorbanie-Asl, M. Performance-Based Seismic Design of Building Structures. Ph.D. Thesis, Carleton University, Ottawa, ON, Canada, 2007. [Google Scholar]
  4. Liang, X.W.; Li, B.; Li, X.W. Lateral load-carrying capacity of continuous masonry wall supported on RC frame. Adv. Struct. Eng. 2009, 10, 305–317. [Google Scholar] [CrossRef]
  5. Polyakow, S.V. Design of Earthquake Resistant Structure; Mir Publishers: Moscow, Germany, 1985. [Google Scholar]
  6. Paula, T.; Prieystley, M.J.N. Seismic Design of Reinforced Concrete and Masonry Buildings; John Wiley and Sons, Inc.: New York, NY, USA, 1992. [Google Scholar]
  7. Narendra, T. Design of Reinforced Masonroy Structure; McGraw-Hill. Inc.: New York, NY, USA, 2010. [Google Scholar]
  8. Li, X.J.; Zhou, Z.H.; Yu, H.Y. Strong motion observations and recordings from the great Wenchuan Earthquake. Earthq. Eng. Eng. Vib. 2008, 7, 235–246. [Google Scholar] [CrossRef]
  9. Gao, X.W.; Xiao, W.; Wang, J. The anlysis method of lateral stiffness for the first and second storey of masonry building with two stories frame and wall at the bottom. Build. Struct. 1999, 11, 9–11. (In Chinese) [Google Scholar]
  10. Zhao, B.; Fabio, T.; Tiziana, R. Field investigation on the performance of building structures during the 12 May 2008 Wenchuan earthquake in China. Eng. Struct. 2009, 31, 1707–1732. [Google Scholar] [CrossRef]
  11. Kaushik, H.B.; Rai, D.C.; Jain, S.K. Effectiveness of some strengthening options for masonry-infilled RC frames with open first story. J. Struct. Eng. 2009, 135, 925–937. [Google Scholar] [CrossRef]
  12. Mohammadi, M.; Nikfar, F. Strength and stiffness of masonry-infilled frames with central openings based on experimental results. J. Struct. Eng. 2013, 139, 974–984. [Google Scholar] [CrossRef]
  13. Wang, Z.J.; Liu, W.Q.; Wang, J.; Jing, Y.S.; Xu, C. Shaking table test for a mid-highrise big-bay RC frame model with special-shaped columns. Earthq. Eng. Eng. Vib. 1999, 19, 59–64. [Google Scholar]
  14. Ahmad, R. Lateral stiffness of concrete shear walls for tall buildings. Struct. J. 2011, 108, 755–765. [Google Scholar]
  15. Burton, H.; Deierlein, G. Simulation of seismic collapse in nonductile reinforced concrete frame buildings with masonry infills. J. Struct. Eng. 2014, 140. [Google Scholar] [CrossRef]
  16. Mazzoni, S.; Mckenna, F.; Scott, M.H. OpenSees Users Manual; University of California: Berkeley, CA, USA, 2006. [Google Scholar]
  17. Liu, P.; Guo, M. An experimental study of multi-grid composite walls. Adv. Struct. Eng. 2012, 15, 495–507. [Google Scholar] [CrossRef]
  18. Sun, J.; Xiong, Y.Q.; Chang, P. Damage analysis of multi-ribbed wall structures under monotonic lateral loads. Eng. Struct. 2015, 89, 37–48. [Google Scholar] [CrossRef]
  19. Liu, P.; Yao, Q.F. Dynamic reliability of structures: The example of multi-grid composite walls. Struct. Eng. Mech. 2010, 36, 463–479. [Google Scholar] [CrossRef]
  20. Sun, J.; Jia, Y.J.; Mo, Y.L. Evaluation of elastic properties and lateral stiffness of multi-ribbed walls based on equivalent elastic model. Eng. Struct. 2014, 72, 92–101. [Google Scholar] [CrossRef]
  21. Zhang, Y.; Zhang, C.Y.; Zhang, Q.; Zhang, D.F. The interaction analysis of the middle-high multi-ribbed composite wall-shear wall structures and pile-raft foundation. Appl. Mech. Mater. 2012, 170, 434–438. [Google Scholar] [CrossRef]
  22. Li, S.C.; Dong, J.X.; Li, L.F. Experimental hysteretic behavior of in-plane loaded reinforced grouted multi-ribbed aerated concrete blocks masonry walls. Struct. Eng. Mech. 2012, 41, 95–112. [Google Scholar] [CrossRef]
  23. Chang, P.; Sun, J. Finite element model and numerical simulation of multi-ribbed slab structure. Int. J. Adv. Comput. Technol. 2012, 4, 385–394. [Google Scholar]
  24. Jia, S.Z.; Cao, W.L.; Yuan, Q. An experimental study of frame-supported multi-ribbed composite walls. Adv. Struct. Eng. 2015, 18, 497–511. [Google Scholar] [CrossRef]
  25. Jia, S.Z.; Cao, W.L.; Yuan, Q.; Zhang, Y.C. Experimental study on frame-supported multi-ribbed composite walls under low-reversed cyclic loading. Eur. J. Environ. Civil Eng. 2015, 6, 1–18. [Google Scholar]
  26. Ministry of Housing and Urban-Rural Development of the People’s Republic of China. JGJ3-2010. In Technical Specification for Concrete Structure of Tall Building; China Architecture & Building Press: Beijing, China, 2011. (In Chinese) [Google Scholar]
  27. Ministry of Housing and Urban-Rural Development of the People’s Republic of China. JGJ/T275-2013. In Directive Rules for Ribbed-Grid Composite Wall Structure; China Architecture & Building Press: Beijing, China, 2014. (In Chinese) [Google Scholar]
  28. Zhu, M.; Scott, M.H. Modeling fluid-structure interaction by the particle finite element method in OpenSees. Comput. Struct. 2014, 132, 12–21. [Google Scholar] [CrossRef]
  29. Lu, X.Z.; Jiang, J.J.; Teng, J.G.; Ye, L.P. Finite element simulation of debonding in FRP-to-concrete bonded joints. Constr. Build. Mater. 2006, 20, 412–424. [Google Scholar] [CrossRef]
  30. Lu, X.Z.; Teng, J.G.; Ye, L.P.; Jiang, J.J. Bond-slip models for FRP sheets/plates externally bonded to concrete. Eng. Struct. 2005, 27, 920–937. [Google Scholar] [CrossRef]

