Article

Enhancement of Spatial Resolution Using a Metamaterial Sensor in Nondestructive Evaluation †

1
Nondestructive Testing Department, National Institute of R&D for Technical Physics, Iasi 700050, Romania
2
CRISMAT Laboratory, Ecole Nationale Superieure d’Ingenieurs de Caen, Universite de Caen Basse Normandie, 6 Blvd Marechal Juin, Caen 14050, France
3
Faculty of Physics, University Al.I. Cuza, 11 Carol I Blvd, Iasi 700506, Romania
4
Faculty of Electrical Engineering, University of Žilina, Univerzitná 1, Žilina 010 26, Slovakia
*
Authors to whom correspondence should be addressed.
This paper is an extended version of paper published in the 6th International Conference on Emerging Technologies in Non-destructive Testing, ETNDT6 held in Brussels, 27–29 May 2015.
Appl. Sci. 2015, 5(4), 1412-1430; https://doi.org/10.3390/app5041412
Submission received: 17 September 2015 / Revised: 10 November 2015 / Accepted: 11 November 2015 / Published: 27 November 2015
(This article belongs to the Special Issue Acoustic and Elastic Waves: Recent Trends in Science and Engineering)

Abstract

:
The current stage of non-destructive evaluation techniques imposes the development of new electromagnetic methods that are based on high spatial resolution and increased sensitivity. Printed circuit boards, integrated circuit boards, composite materials with polymeric matrix containing conductive fibers, as well as some types of biosensors are devices of interest in using such evaluation methods. In order to achieve high performance, the work frequencies must be either radiofrequencies or microwaves. At these frequencies, at the dielectric/conductor interface, plasmon polaritons can appear, propagating between conductive regions as evanescent waves. Detection of these waves, containing required information, can be done using sensors with metamaterial lenses. We propose in this paper the enhancement of the spatial resolution using electromagnetic methods, which can be accomplished in this case using evanescent waves that appear in the current study in slits of materials such as the spaces between carbon fibers in Carbon Fibers Reinforced Plastics or in materials of interest in the nondestructive evaluation field with industrial applications, where microscopic cracks are present. We propose herein a unique design of the metamaterials for use in nondestructive evaluation based on Conical Swiss Rolls configurations, which assure the robust concentration/focusing of the incident electromagnetic waves (practically impossible to be focused using classical materials), as well as the robust manipulation of evanescent waves. Applying this testing method, spatial resolution of approximately λ/2000 can be achieved. This testing method can be successfully applied in a variety of applications of paramount importance such as defect/damage detection in materials used in a variety of industrial applications, such as automotive and aviation technologies.

1. Introduction

In recent years, several nondestructive evaluation (NDE) techniques have been developed for detecting the effect of damages/embedded objects in homogeneous media.
The electromagnetic nondestructive evaluation (eNDE) of materials consists in the application of an electromagnetic (EM) field with frequencies ranging from tens of Hz to tens of GHz, to the examined object and evaluating the interaction between the field and the eventually material discontinuities. A generic NDE system is presented in Figure 1.
Figure 1. Principles of nondestructive evaluation operation.
Applsci 05 01412 g001
Effective data acquisition and display capabilities have led to developments in extraction and recording information about discontinuities and material properties. Fundamentally, these methods were involved with the evolution of reflected and/or transmitted waves after interacting with the test part. If the examined object is electrically conductive, under the action of the incident EM field, eddy currents will be induced in the material, according to Faraday’s Law [1].
If the incident EM field has low frequency, usually created by coils circulated by alternating current [2,3,4,5,6,7,8,9] or current impulses [10,11,12,13], different shapes of coils [14] assure the detection of the secondary EM field. In order to obtain a better signal/noise ratio [15,16,17,18,19], it is necessary to use the smallest possible lift-off (distance between the EM transducer and the controlled piece). This requires working in the near field because the generated and scattered EM waves are evanescent waves (waves that are rapidly attenuated with distance [20] and are difficult to be focalized using classical materials).
Recently, a new approach to the design of EM structures has been introduced, where the paths of EM waves are controlled by modifying constitutive parameters through a variation of space features. The interaction of the EM field with periodical metallic structures constitutes an interesting domain, both from a theoretical point of view as well as experimentally [21,22,23,24]. The metallic strip gratings (MSG) can act as filters and polarizers [25], also representing the basic elements in rigid and flexible printed circuits boards, serving to supply and to the transmission of the signals. MSGs present special properties when they are excited with a transversal electric/magnetic along the z axis (TEz/TMz) polarized EM field. These structures are intensively studied from a theoretical point of view [26,27], for obtaining complex information about their behavior in electronic applications [28] and the design of new types of metamaterials (MMs) starting from the existence of surface plasmons polaritons (SPPs) [29]. These applications impose a rigorous and rapid quality control.
Extending the study to composite materials, carbon fiber reinforced plastics (CFRP) with uniaxial symmetry [30], as well in the case of reinforcement with carbon fibers woven [7,31], the possibility of manipulating the evanescent waves that appear in the space between fibers indicates the necessity to improve the spatial resolution of the sensors, to emphasize microscopic flaws.
The composite materials found wide usage in modern technologies due to the development of industries [32], ranging from medicine and sporting goods to aeronautics components. These composite components can have various dimensions, from very small panels used in satellite structures to large ones used in miniature naval vessels as hulls, 30 m long and 25 mm thick.
Fiber-reinforced polymer composites (FRPC) have superior mechanical properties to metallic structures, assuring simple manufacturing of layered products [33]. FRPCs are classified by the type of reinforcement fibers (carbon, glass, or aramids) or the type of matrix (thermoset or thermoplastic). Despite the fact that thermoplastic composites are more expensive, they have been preferred in the construction of complex structures, due to the advantages of thermoplastic matrix such as recyclability, aesthetic finishing, high impact resistance, chemical resistance, hard crystalline or rubbery surface options, and eco-friendly manufacturing, making the entire process cost less [34]. Woven carbon fibers are recommended due to their high strength-to-weight ratio. Polyphenylene sulfide (PPS) has excellent properties [35], tying into the advantages described above. Woven carbon fibers/PPS laminates are characterized by reduced damages but are susceptible to impacts with low energies, leading to delaminations, desbonding of carbon fibers, and/or matrix cracking [36]. The aerospace industry requires the highest quality control and product release specifications [37,38]. The raw material standard, prepreg materials, require mechanical property testing (i.e., interlaminar strength and tensile strength) from specimens. Final parts also require NDE [39] and structural health monitoring (SHM) [40,41]. The presence of different types of defects such as voids, inclusions, desbondings, improper cure, and delaminations are common during the manufacture and use of composite materials.
Alternative techniques based on phenomenological changes in the composite materials were developed to measure damage due to impacts: acoustic emission [42,43], infrared imaging [44,45], electrical resistance [46,47], or non-contact techniques such as digital image correlation [48] and X-ray tomography [49,50], but these methods have their limitations, being complementary. Nowadays, NDE methods are developed for post-damage inspection and assessment such as thermography [51,52], ultrasonic C-scan [53,54], eddy current [55,56], and optical fiber [57,58], offering quantitative results. Other techniques can be used for online health monitoring of CFRP structures, embedding external sensors or additional fiber input in CFRPs.
This paper proposes the possibility to enhance the spatial resolution of eNDE methods applied to MSG and to CFRP, using a sensor with MM lenses. For this, special attention is granted to the sensor based on a lens [59,60] with conical Swiss rolls, which allows for the manipulation of evanescent waves created in slits and in the dielectric insulating the carbon fibers, respectively, and can reach a spatial resolution for visualization of carbon fibers’ layout and eventually of flaws such as delamination created by impact.

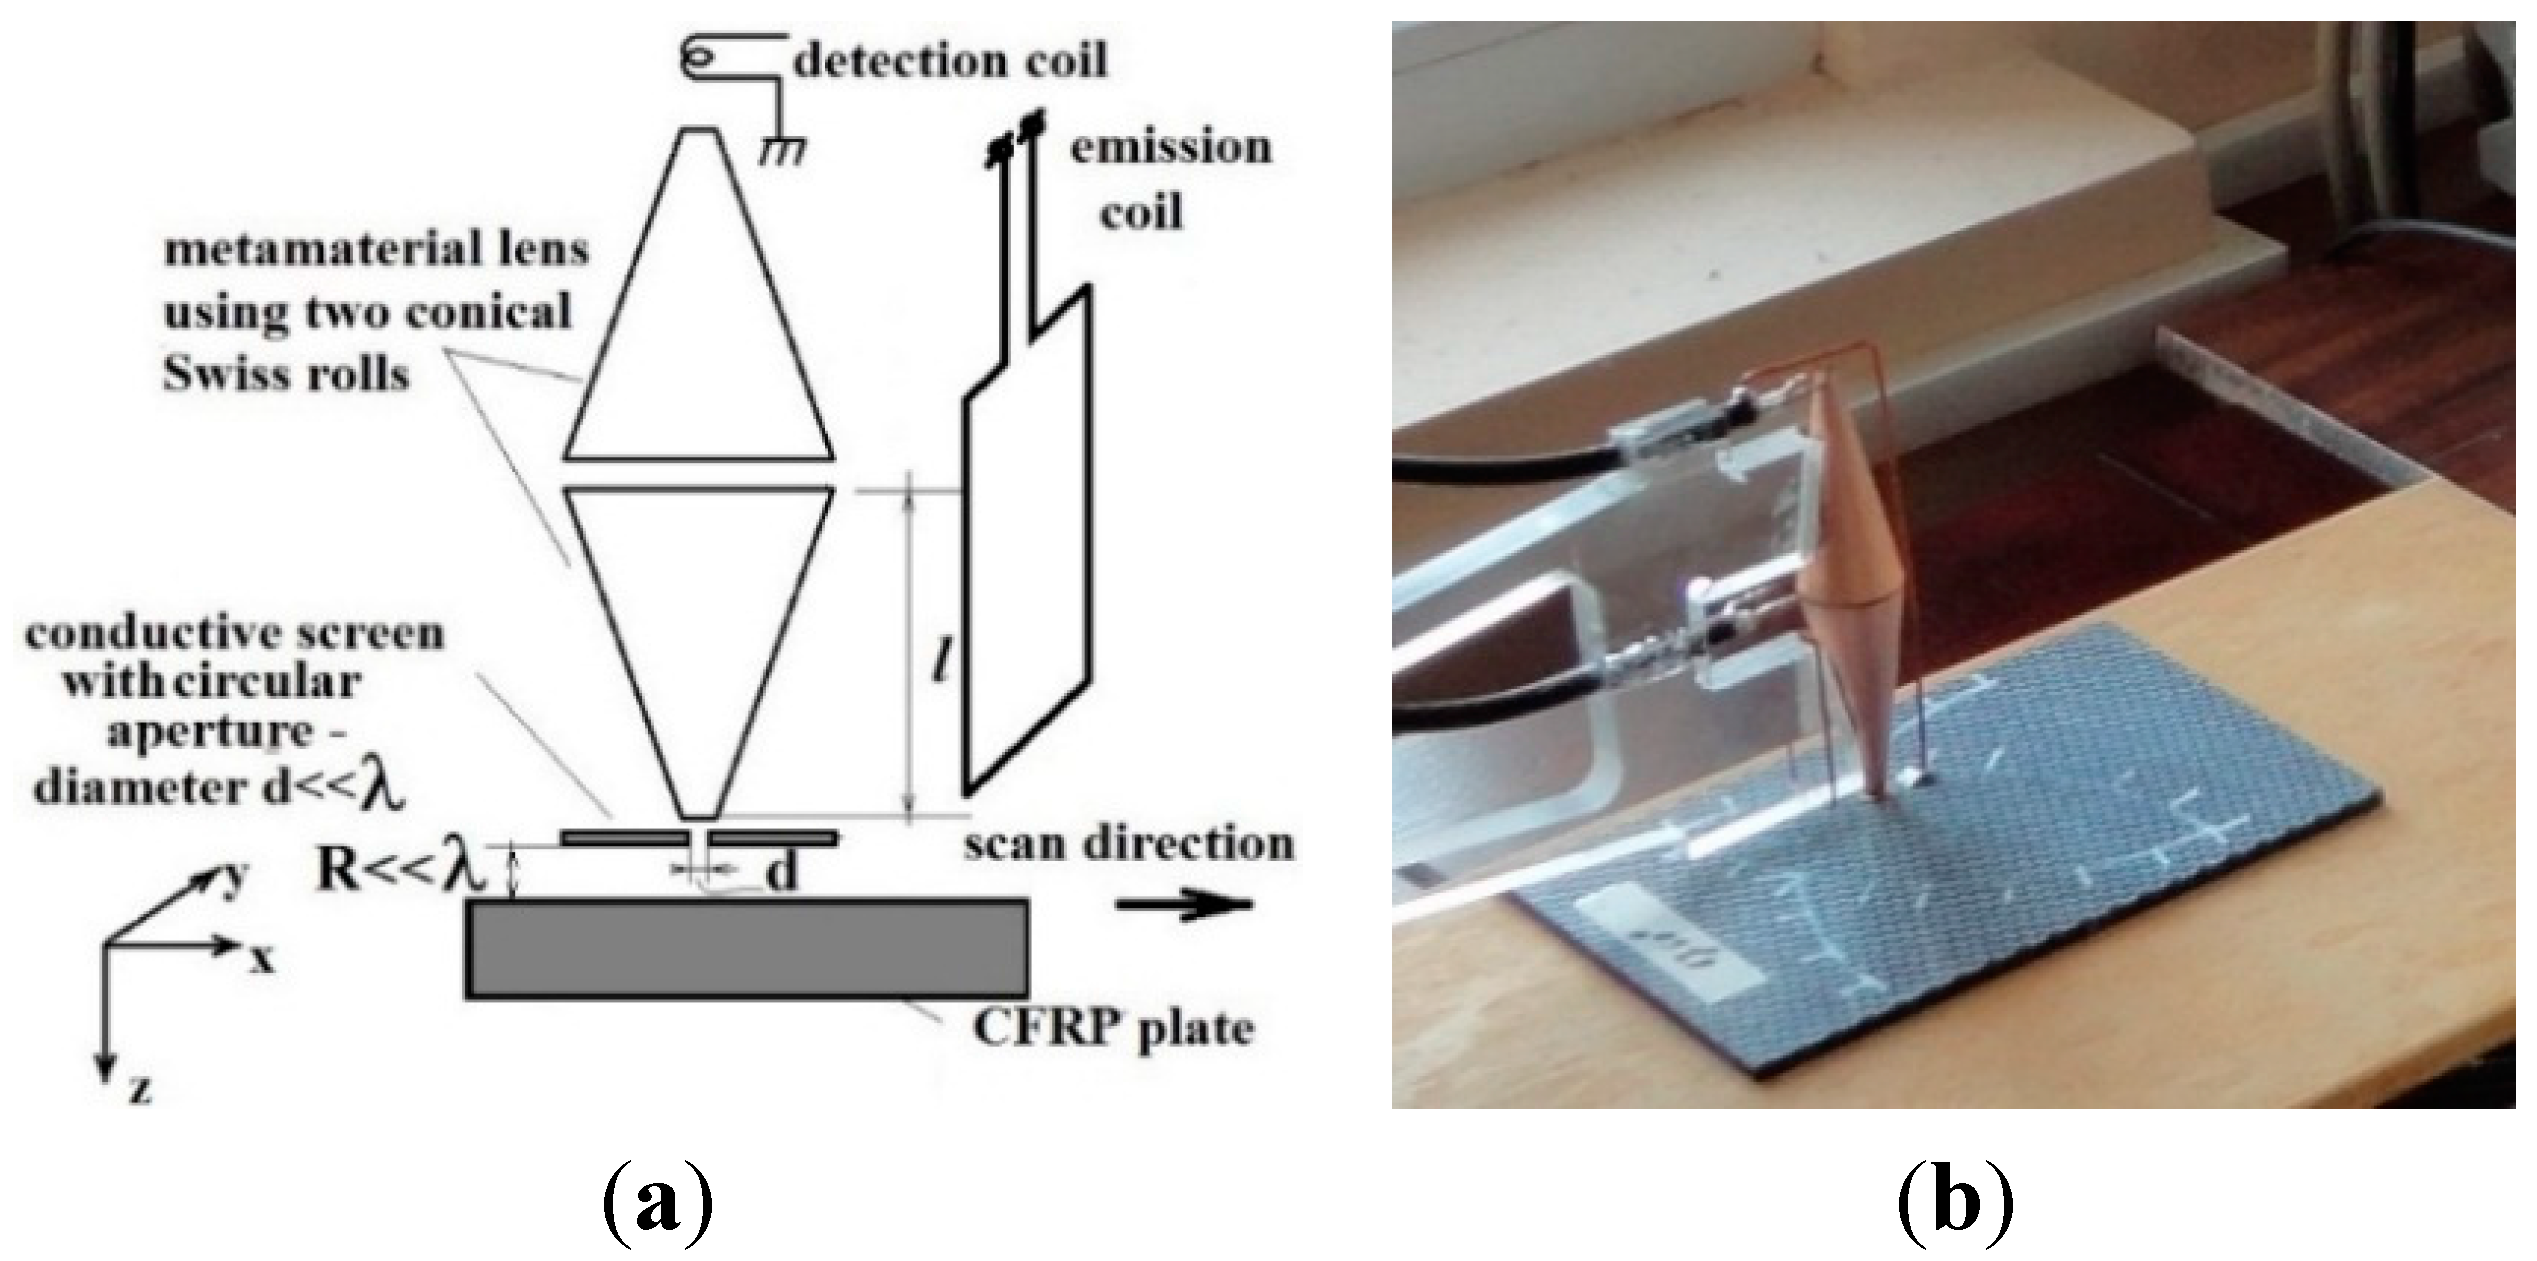
2. Metamaterial Sensor for eNDE and Theory

MMs, EM structures with distinguished properties, have started to be studied especially in the last few years. EM MMs belong to the class of artificially engineered materials, which can provide an engineered response to EM radiation, not available from naturally occurring materials. These are often defined as the structures of metallic and/or dielectric elements, periodically arranged in two or three dimensions [61]. The size of the structure is typically smaller than the free space wavelength of incoming EM waves. Nowadays, multitudes of MM structural elements type are known, conferring special EM properties. Depending on the frequency of the incident EM field, the type and geometrical shape of the MM may have a high relative magnetic permeability, either positive or negative [61]. Also, MM lenses allow the amplification of evanescent waves [62]. These properties strongly depend on the geometry of MM rather than their composition [63], and were experimentally demonstrated [64]. MMs have started to interest engineers and physicists due to their wide application in perfect lens [65], slow light [66], data storage [67], etc.
In order to find the effective permittivity and permeability of a slab of MM, the material has to be homogeneous. The permittivity and permeability can be found from the S parameters data. For a MM slab characterized by effective permittivity εeff and effective magnetic permeability μeff, the refractive index is:
n = ε eff μ eff
and the impedance is given by:
Z = μ eff ε eff
The relationship between ε and µ for a medium as well as the wave propagation through it can categorize the media into the following classes [68,69]:
(a)
Double positive medium (DSP) when ε > 0 and μ > 0; Only propagating waves;
(b)
Single negative medium-electric negative (ENG), when ε < 0 and μ > 0; only evanescent waves;
(c)
Double negative medium (DNG) when ε < 0 and μ < 0; propagating waves and evanescent waves;
(d)
Single negative medium-magnetic negative (MNG), when ε > 0 and μ < 0; only propagating waves.
When the effective electrical permittivity εeff, and the effective magnetic permeability μeff of a MM slab are simultaneously −1, the refractive index of the slab is n = −1 [70]. Therefore, the surface impedance of such an MM is Z = 1, there is no mismatch and consequently no reflection at the slab-air interface [64]. This MM slab forms a perfect lens [62] and is not only focusing the EM field, but also focuses the evanescent waves [62].
Due to experimental difficulties in obtaining a perfect lens, the manipulation of the evanescent modes can be made with an EM sensor with MM lenses that have, at the operation frequency, either εeff = −1 when electric evanescent modes can be manipulated, or µeff = −1 when the lens can focus magnetic evanescent modes [61]. Moreover, working at a frequency that ensures µeff = −1 for the same lens, the magnetic evanescent modes can be manipulated [20,71].
According to the above classes, as shown in Ref. [30], the electric evanescent modes can be manipulated with a sensor made from a special MM, named Conical Swiss Roll (CSR) [31], functioning in a frequency range that ensures the maximum µeff [60]; it did not accomplish the conditions imposed for a perfect lens but will lead to the substantial enhancement of spatial resolution. The spatial resolution of the system (the distance between two distinctively visible points) was verified according to [59] and the analysis of data obtained shows that the realization of MM lenses in the RF range is possible using the CSR, whose distortions are minimal and whose calculation is made based on Fourier optic principles.
EM sensors with MM lenses have been made using two CSRs, the operation frequencies depending both on the constitutive parameters of MM and the polarization of the incident EM field (TEz or TMz). Figure 2 shows the developed sensor with MM [7,59,60]. A CSR consists of a number of spiral-wound layers of an insulated conductor on a conical mandrel [31]. The EM sensor is absolute send-receive type; it has the emission part made from one-turn rectangular coil with 35 × 70 mm dimensions, using Cu wire with a 1 mm diameter. When an EM TMz polarized waves acts, at normal incidence, the magnetic field being parallel with the y axis such that Hx = Hz = 0 and Hy0, in very near field, between carbon fibers similar with MSG, evanescent waves can appear. In the focal image point a reception coil with MM lens is placed, having one turn with 1 mm average diameter made of Cu wire with 0.1 mm diameter, to convert localized energy in electromotive force (e.m.f.). An optimized work frequency of 476 MHz assures magnetic effective permeability of 22. At this frequency, the property of CSR to act as an alternative magnetic flux concentrator has been verified.
Figure 2. Sensor with MM lens: (a) schematic representation; (b) photograph.
Applsci 05 01412 g002
The calculus of the MM lens based on CSR was presented in Ref. [31]; the field in the focal plane of the lens is given by
H ( x , y , z 0 + 2 l ) = H 0 π 2 e j ( k b + k a 2 x + k b + k a 2 y ) sin ( k b k a 2 x ) x sin ( k b k a 2 y ) y ,
where z0 = R (Figure 2a) with R << λ, and H0 is the amplitude of incident magnetic field.
The principle scheme of sensor for the evanescent wave’s detection is shown in Figure 2a. In order to enhance the spatial resolution of the sensor, a conductive screen having a circular aperture made from perfect electric conductor (PEC) material with a very small diameter is placed in front of the lens. The circular aperture serves for the diffraction of the evanescent waves that can occur on slits. This ensures paraxial incident beam. The diameter of focal spot provided by MM lens is given by [72]:
D = 4 π k b k a
and is equal with the diameter of the small basis of the conical Swiss roll, i.e., 3.2 mm. The MM lens with CSR will be displaced along the x-axis (Figure 2a). When ka = 0 and this value is inserted into Equation (4), kb is obtained and the field in the focal plane is calculated with Equation (3). The detection principle is similar with near-field EM scanning microscopy (NFESM). NFSEM imaging is a sampling technique, i.e., the sample (in our case MSG or carbon fibers) is probed point by point by raster scanning with the sensor over the sample surface and recording for energy image pixel a corresponding EM signature.
Selecting a region with dimensions (xc + xd) ⋅ (xc + xd), (where xc and xd are coordinates for conducting/dielectric material), using the Fourier optics methods [72,73], an object O(x,y) that can represent the eigenmodes in function of the polarization of an incident EM field, has, while passing through the circular aperture and the lens, an image I(, ), given by [68]:
I ( x , y ) = 1 λ 2 d 1 d 2 exp [ i k ( ( x x 1 ) 2 + ( y y 1 ) 2 ) 2 d 2 ] P ( x , y ) exp [ i k ( x 1 2 + y 1 2 ) 2 f ] × ( O ( x , y ) exp [ i k ( ( x 1 x ) 2 + ( y 1 y ) 2 ) 2 d 1 ] d x d y ) d x 1 d y 1
where P(x,y) is the pupil function defined as [73]:
P ( x , y ) = { 1 x 2 + y 2 d 2 0 otherwise
O(x,y) is the object defined as:
O ( x , y ) = { e v ( x , y ) for TEz polarized incident waves h v ( x , y ) for TMz polarized incident waves
f is the focal distance of the lens equal with the height of CSR; λ is the wavelength in a vacuum; k = 2π/λ is the wave number; d1 = R + l is the distance from the object to the center of the lens; and d2 = l is the distance from the center of the lens to the detecting coil.
The most convenient method from an experimental point of view is to measure S parameters for the MM that fill a waveguide or in free space, using an emission and reception antennas. The relation between S11 and S21, applying the effective method [74] using a 4395A Network/Spectrum/Impedance Analyzer Agilent (Agilent Technologies, Santa Clara, CA, USA) coupled with an Agilent 87511A S Parameters Test kit and effective refractive index n, is given by [75,76]:
S 11 = R 0 1 ( 1 e j 2 n k 0 d ) 1 R 0 1 2 e j 2 n k 0 d   S 21 = ( 1 R 0 1 2 ) e j 2 n k 0 d 1 R 0 1 2 e j 2 n k 0 d
where R 0 1 = Z 1 Z + 1 and the impedance Z is obtained by inverting Equation (8) yielding:
Z = ± ( 1 + S 11 ) 2 S 21 2 ( 1 S 11 ) 2 S 21 2   e j n k 0 d = X ± j 1 X 2
where X = 1 2 S 21 ( 1 S 11 2 + S 21 2 ) .
The focal distance of the lens using an MM is given in Ref. [31] with f ≅ 1, where l is the height of a CSR. Assuming that the passive MM slab has an effective refractive index n and impedance Z, according to Ref. [74] the effective permittivity εeff and permeability μeff are directly μeff = nZ and ε eff = n Z .

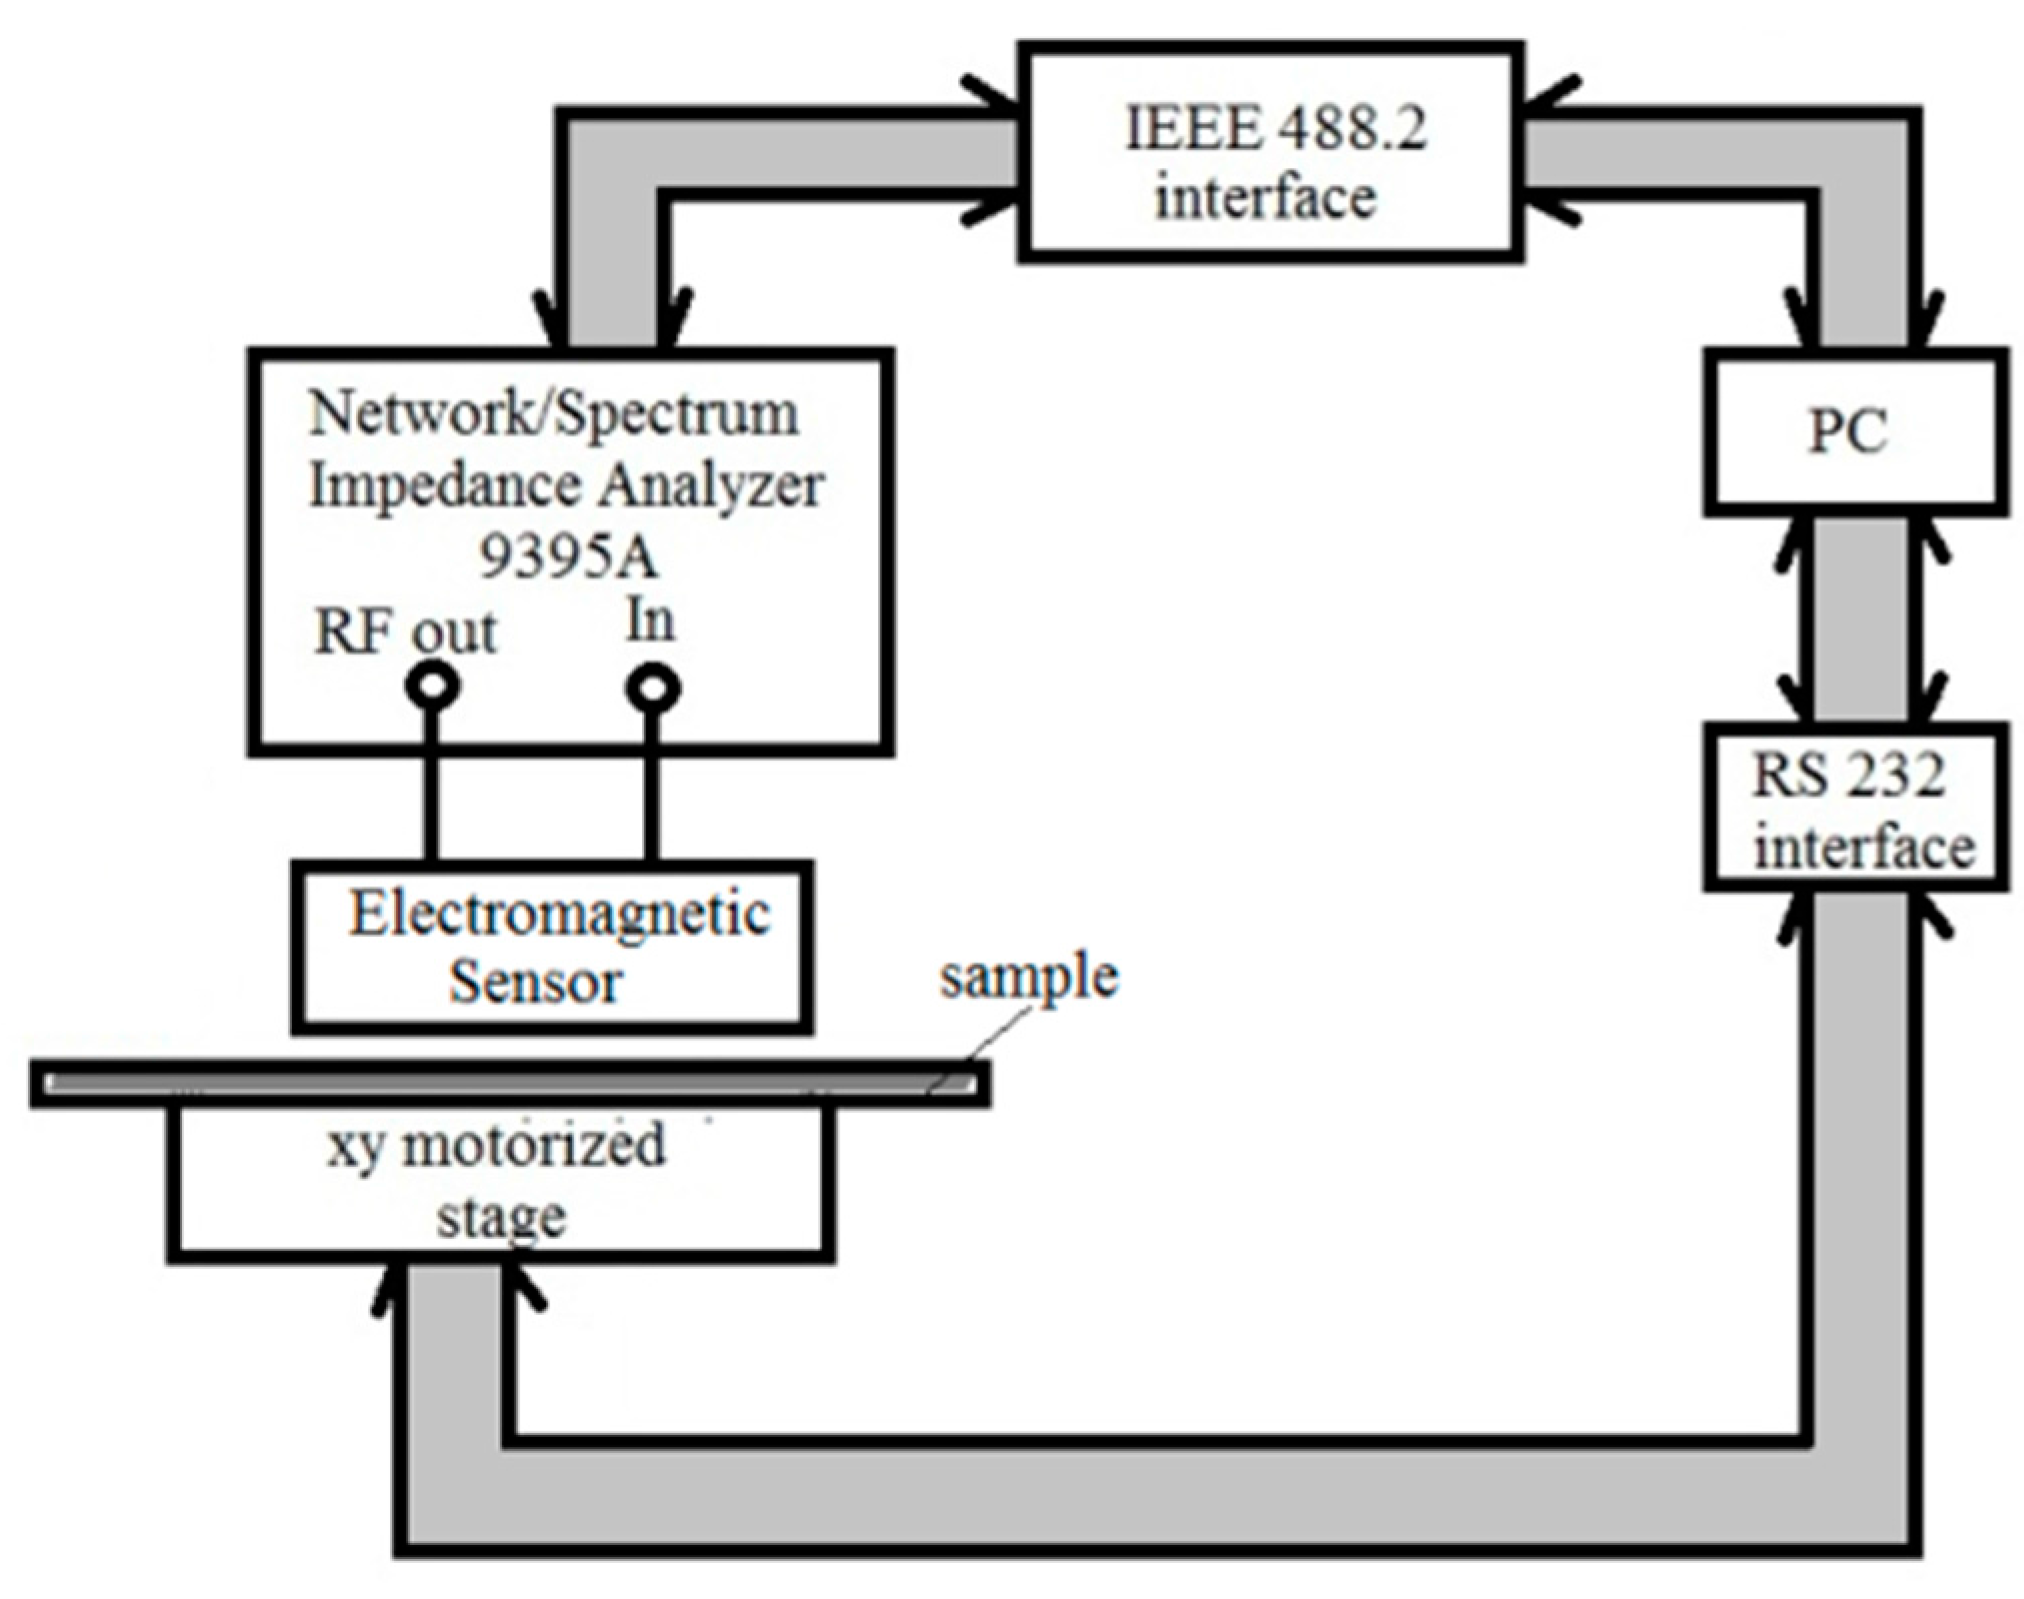
3. Studied Samples and Experimental Setup

The functioning of the MM sensor has been verified using two types of materials, MSGs and FRPC.

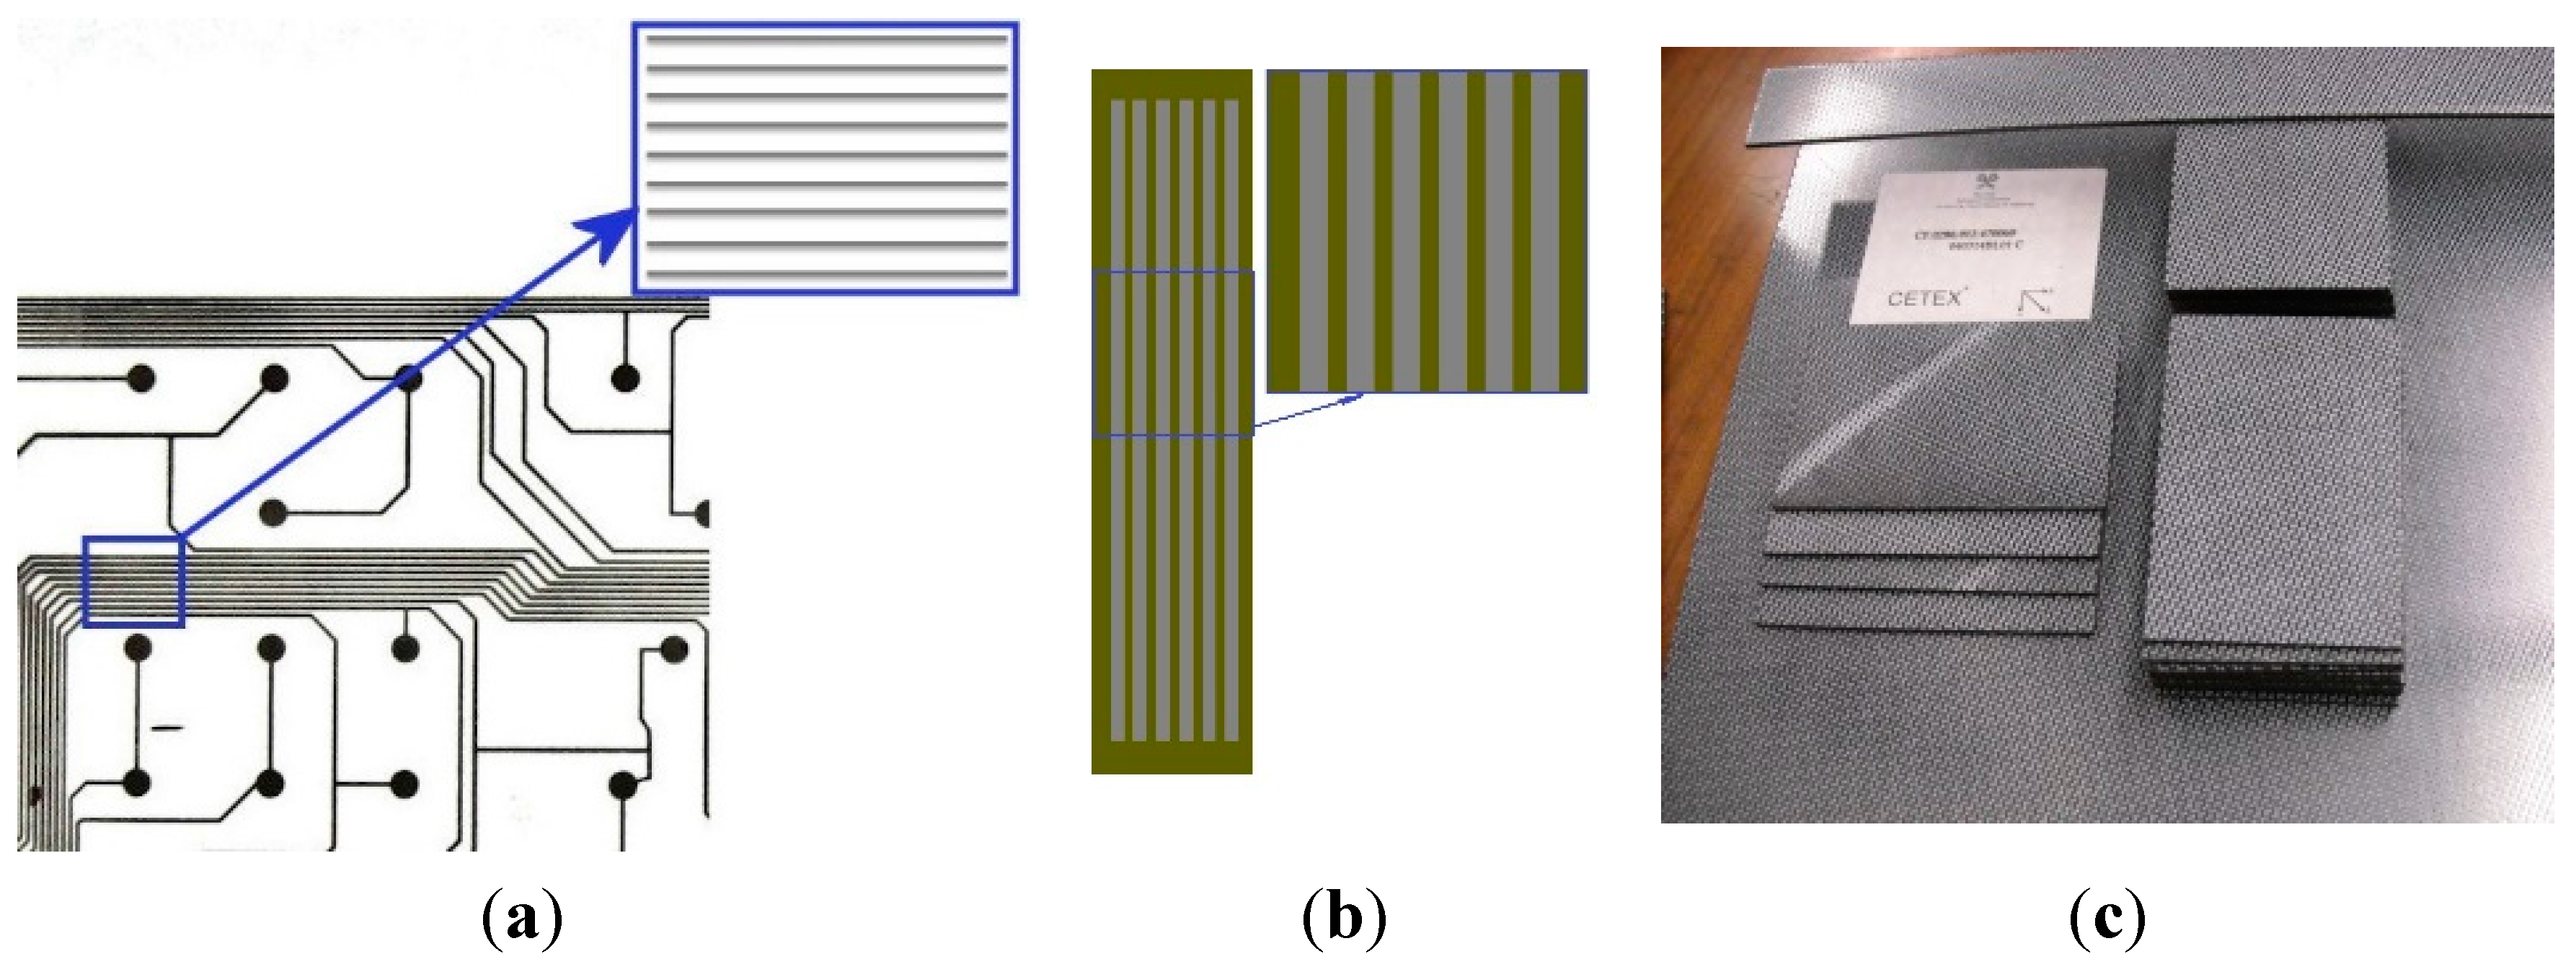
3.1. Metallic Strip Gratings (MSGs)

Metallic films on flexible substrates (polyimide or plastic) currently have superior mechanical properties compared to ones deposited on glass, in many aspects. Although the glass substrate is hard, the polyimide or plastic substrate is lighter, less expensive, flexible, and more suitable for use in small devices [77]. Other applications include protective coatings, EM shielding, and electric current conductors for microelectronic applications.
Two types of MSG were taken into consideration:
Flexible printed circuit with transparent polyimide support, 80 µm thickness, with silver conductive strip of 10 µm thickness, the width of the strips being xc = 0.6 mm and the width of the slits being xd = 0.4 mm;
Silver strips realized with polyimide support of 65 µm thickness made from a silver strip having 14 µm thickness, the width of the strips being xc = 1.2 mm and the width of the slits being xd = 0.8 mm.
For strips having xc = 1.2 mm, we have taken into account interruptions as well as non-alignments. Silver strips were realized by successive deposition of silver paste, using an adequate stencil by screen printed method. The adhesion of silver on polyimide has been done with a thin film of resin. The conductive silver paste made from microparticles with concentration >80%, density 10.49 g/cm3, resistivity 1 ÷ 3 × 10⁻⁵ Ω cm was used [78]. The silver paste has good adhesion and fast drying speed at room temperature. At frequencies around the value of 500 MHz, the permittivity of silver [79] is εm = −48.8 + j⋅3.16.
The polyimide as flexible substrate can be easily embedded in 3D structures, also ensuring retention of bioactive species in the developed structure. They satisfy just about all the requirements for electronics applications, being lightweight, flexible, and resistant to heat and chemicals [80]. The flexible MSG structures are presented in Figure 3a,b.
Figure 3. Studied samples: (a) MSGs from flexible printed circuit; (b) MSGs realized with polyimide support; (c) Plates from FRPC.
Applsci 05 01412 g003
For the MSG having the width of strips xc = 0.6 mm, the study is focused on the appearance of abnormal and/or evanescent modes for the cases where various dielectric fluids fill the gaps between the strips, and also improvement of the EM images to obtain a better spatial resolution in order to exceed the limit imposed by diffraction.

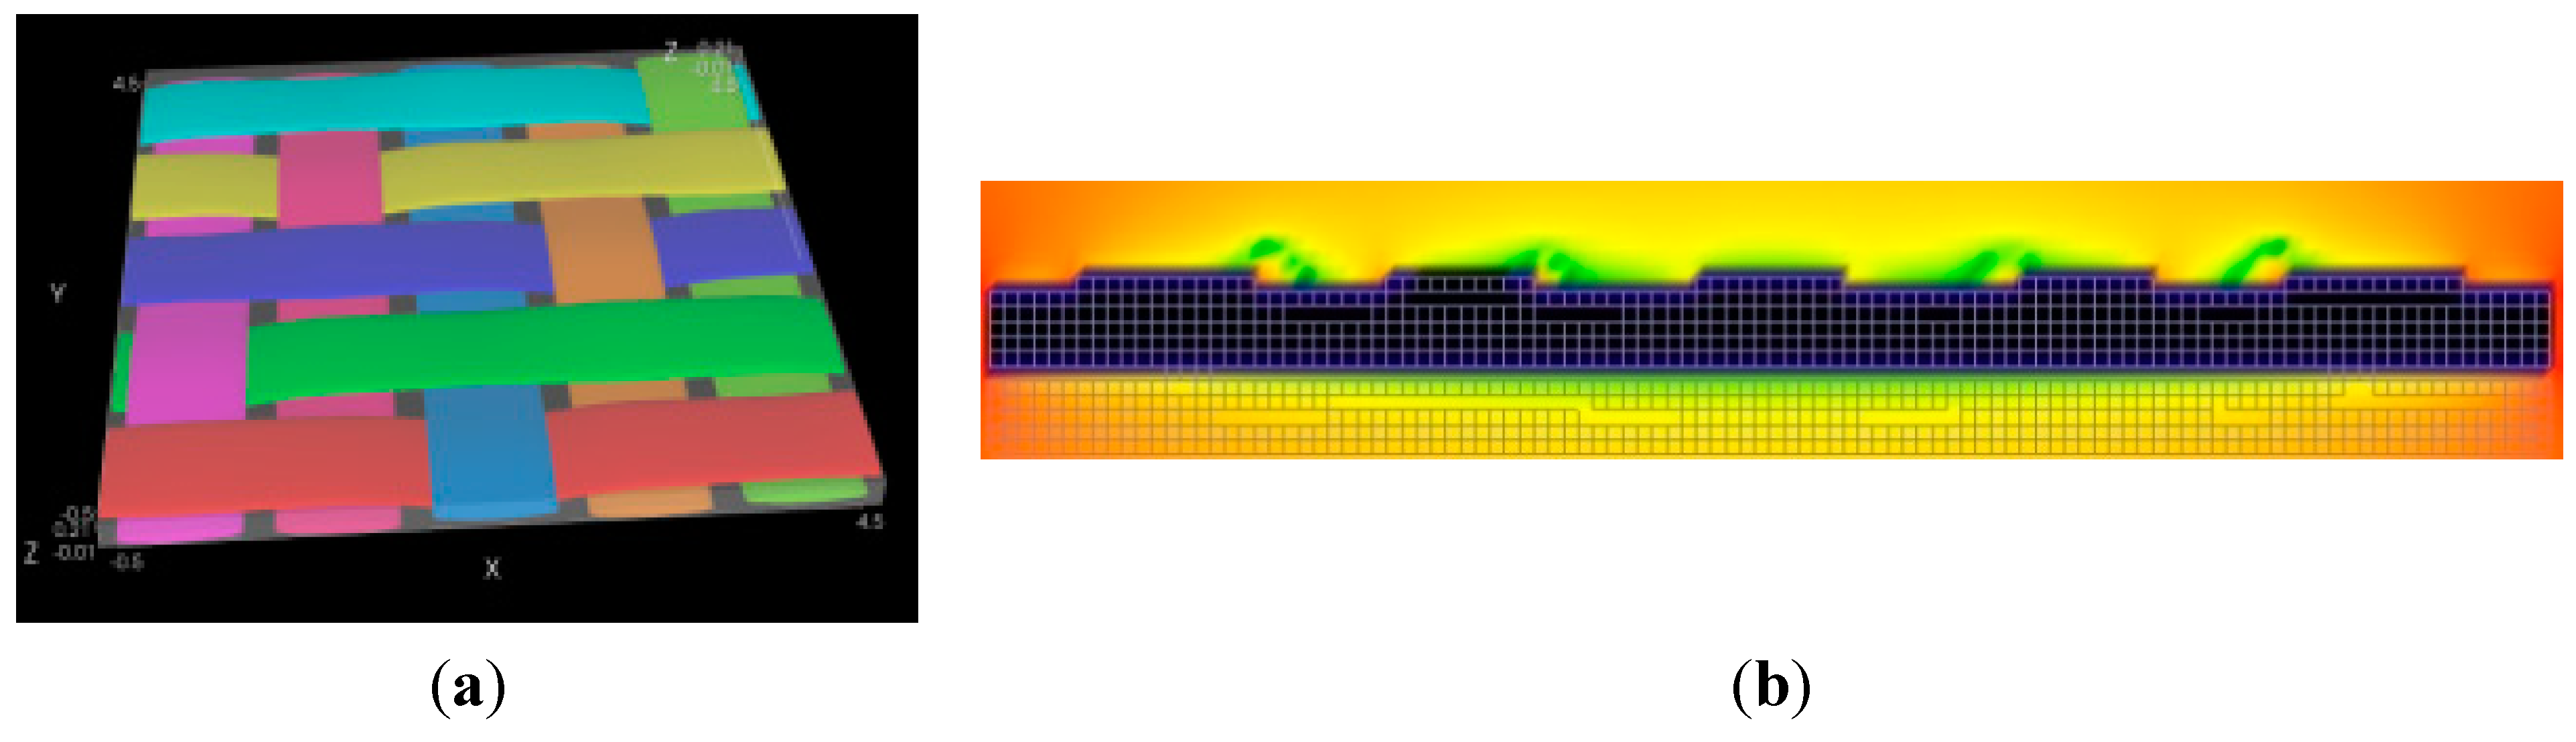
3.2. Plates from FRPC Composite Materials

The study involved quasi-isotropic FRPC plates produced by Tencate [35] (Almelo, The Netherlands), having 150 × 100 × 4.2 mm3, containing 12 layers of 5 harness satin (5HS) carbon fibers woven with balanced woven fabric [81] (Figure 3c). The matrix is made of PPS, a thermoplastic polymer consisting of aromatic rings linked with sulfide moieties. It is resistant to chemical and thermal attack, and the amount of gas released due to matrix ignition is low. The carbon fibers are T300JB type (TORAYCA, Santa Ana, CA, USA); their volume ratio is 0.5 ± 0.03 and the density is 1460 kg/m3.
Carbon fiber woven embedded into PPS offers strength of composite to impact. The FRPC has the transverse electric conductivity between 10 S/m and 100 S/m and longitudinal conductivity ranging between 5 × 10³ S/m and 5 × 10⁴ S/m and is paramagnetic, allowing eNDE. The samples were impacted with an energy of 8 J [59], in order to induce delaminations. The impacts are induced with FRACTOVIS PLUS 9350 CEAST (Instron, Nordwood, MA, USA), which allows the modification of impact energies as well as the temperature during impact. The conditions of the impact are designed according to ASTM D7136 [82] at a temperature of 20 °C. Under impact, the FRPCs suffer delamination, usually accompanied by a dent, deviation, and/or breaking of the carbon fibers. In all cases, a reduction in the space between fibers in the thickness direction appears and this causes an increase in fiber contact, leading to a decrease of electrical resistance in the thickness direction and modifying the local electrical conductivity both in the plane of the fibers and perpendicularly on fibers [83]. The energy absorbed by the composite serves as the plastic deformation of the composite in the contact zone, being dissipated through internal friction between the matrix’s molecules, carbon fibers, and matrix-carbon fibers, as well as at the creation of delaminations. Typical records of force vs. time during impact can give information about the FRPC status (delaminated or not) [84].
The generation and detection of evanescent waves from slits/fibers has been made using a sensor with MM lens and the equipment presented in Figure 4. The rectangular frame used for the generation of the TMz polarized EM field has 35 × 70 mm dimensions, from a 1 mm diameter Cu wire. This represents the excitation part of the transducer. The lens is constructed from two CSRs with the large bases being placed face to face. The insulated conductor is a copper foil with 18 μm thickness laminated adhesiveless with a polyimide foil (LONGLITE™200, produced by Rogers Corporation (Connecticut, CT, USA)), in order to reduce the losses at high frequencies, with 12 μm thickness (Figure 2b). Each CSR has 1.25 turns, 20 mm diameter large base, 3.2 mm diameter small base, aperture angle of 20°, and 50 mm height. The reception coil with 1 mm diameter and one turn from 0.1 mm diameter Cu wire was placed in the focal plane of the lens. A grounded screen made from the same insulated conductor as the CSR, having a circular aperture with diameter d = 100 µm, is placed in front of the lens (Figure 2a). The distance between screen aperture and the surface to be examined has been maintained at 20 ± 1 µm.
Figure 4. Experimental setup.
Applsci 05 01412 g004
The EM sensor with MM lens, presented above, is connected to a Network/Spectrum/Impedance Analyzer type 4395A Agilent USA Analyzer (Agilent Technologies, Santa Clara, CA, USA). During the measurements, the transducer was maintained in fixed position and samples were displaced with a XY displacement system, type Newmark—Newmark Systems Inc. (Santa Margarita, CA, USA) that ensures the raster scanning in plane with ±10 µm precision and rotation with ±2″.
The measurement system is commanded via PC through an RS232 interface (National Instruments, Mopac Expwy, Austin, TX, USA) for displacement system and IEEE 488.2 for Network/Spectrum/Impedance Analyzer (National Instruments, Mopac Expwy, Austin, TX, USA). The data acquisition and storage are made by software developed in Matlab 2012b (The MathWorks, Inc., Natick, MA, USA). The e.m.f. induced in the reception coil of the measurement system is the average of 10 measurements at the same point in order to reduce the effects of the white noise, the bandwidth of the analyzer being set to 10 Hz, also to diminish the noise level.
The measurements of S parameters were carried out with Agilent S Parameters Test kit 87511A (Agilent Technologies, Santa Clara, CA, USA) coupled to Agilent 4395A Analyzer.

4. Results and Discussion

The EM sensor used in eNDE must accomplish two roles:
Induce eddy current into the conductive material to be examined, and
Emphasize their flow modifications due to material degradation.
The simplest method to create time-variable magnetic fluxes that can induce eddy current into the material to be examined is represented by the coils circulated by alternative currents, by current impulses, or more alternative currents with different frequencies. The emission part of the EM sensor has this role.
To emphasize the induced eddy current and effect of material degradation over their propagation, sensors sensitive to variation of magnetic field can be used, in our case a sensor with MM lens. The theoretical and experimental study of eigenmodes [71] that appear in the studied MSGs open new domains of applications in the eNDE of stratified structures.
The method and the developed sensor can serve as the eNDE of conductive strips, in order to eventually detect interruptions as well as non-alignments of silver strips or short-circuits between the traces.
According to [59], in the case of MSG with silver strips and sub-wavelength features, excited with TMz polarized incident EM field, causing a single evanescent mode to appear in the space between strips but disappearing when water is inserted (εwater = 81). This mode could be detected and visualized using the sensor described above.
For MSG with features compatible with the λ value of incident EM field, TMz polarized; the structure presents known selective properties of transmission and reflection [85]. When an EM TMz polarized waves acts, at normal incidence, for MSG, according to Ref. [27], the reflection coefficient for a strip grating with x0 << λ0 is practically 1.
When MSG represents a layered structure having the features xc = 0.6 mm, xd = 0.4 mm, and thickness of 10 µm deposited on polyimide having a relative permittivity of 4.8, the study focuses on the appearance of abnormal and/or evanescent modes for the cases where dielectric fluids fill the gaps between the strip.
Using the sensors with MM lenses, it is experimentally confirmed that, in the space between the strips, evanescent and abnormal modes appear in the case of modes excited with a TMz polarized EM wave with λ = 0.6 m. The images present an increasing of the amplitude of the signal induced in the reception coil of the evanescent and abnormal modes created in slits at the scanning of a 1 × 1 mm2 region with a 10 µm step in both directions. When the slits are filled with air, only the evanescent mode will be generated; the amplitude of the signal induced in the reception coil has the shape presented in Figure 5a.
Figure 5. Image of evanescent and abnormal modes generated in slits for TMz polarized excitation at frequency of 476 MHz: (a) slits filled with air; (b) slits filled with isopropyl alcohol.
Applsci 05 01412 g005
In the central zone of the slits the amplitude is maximum, followed by an accentuated decreasing towards the flanks of the metallic strips. The existence of a single evanescent mode, foreseen theoretically [7], is experimentally confirmed by the existence of a local maximum in the middle zone of the slits, with maximum amplitude on the middle of the slits, followed by an accentuated decreasing, symmetrically on the flanks of the strip. The two secondary maxima with smaller amplitude are at ±42 µm from the vertical strip wall.
In slits abnormal modes are generated, in the case of excitation with a TMz polarized wave, for large values of the liquid dielectric constants larger than 10, when εd = 17.9, (isopropyl alcohol) (Figure 5b). Because the real component of the propagation constant βν for isopropyl alcohol is smaller (βν = 4.2 + i·104.321) than the imaginary component, abnormal modes will be generated in slits; the EM image of these modes shows a similar behavior to the case of air in the slits. The amplitude of the signal is smaller and has a central maximum that is more flat (Figure 5b). This gives new ways for MSGs in sub-subwavelength regime to be used as sensors (as biosensors using evanescent modes generated space between strips and extremely low frequency plasmons).
In order to obtain a silver strip with different widths and thickness in the range of micrometers, different masks/stencils with different microstrip widths were used. Once a metal coating has been applied to a surface, it is critical to determine the adhesion properties of the deposit.
In the case of an MSG made from silver strip having 14 µm thickness, the width of strips where xc = 1.2 mm and the width of slits is xd = 0.8 mm is analyzed, considering that the wavelength of incident field is λ = 0.6 m (corresponding to a 500 MHz frequency).
A region of 16 × 16 mm2 from MSG has been scanned with 0.1-mm steps in both directions. The scanning along the x direction was done to correspond with a few periods of gratings, x0 = xc + xd. The working frequency was 476 MHz.
For MSG excitation with EM field TMz polarized, the simulation was performed using XFDTD 6.3 software produced by REMCOM (State College, PA, USA) [86]. According to Ref. [79], the value of dielectric permittivity of silver is εm = −48.8 + j·3.16. Figure 6 shows the dependency of e.m.f. amplitude induced in the reception coil of a sensor on the scanning of the MSG taken into study, the image showing that this type of sensor correctly relies on conductive strips with 14 µm thickness and eventual non-adherence to support and/or interruptions.
Figure 6. Amplitude of e.m.f. induced in the reception coil at the scanning of silver strip grating.
Applsci 05 01412 g006
These results are in good concordance with theoretical estimations. They confirm a good adhesion of the silver paste on polyimide, as well as good alignment of the strips. It is known that the biosensing characteristic is strongly dependent on the deposition condition, which affects the physical properties of the thin film. Using the procedure and sensor described earlier for eNDE of MSG, interruption of a strip stopped the propagation of evanescent waves in the nearest slit so that the amplitude of e.m.f induced in the reception coil practically decreased to zero when the aperture’s sensor was in the corresponding region of the slit. The roughness feature is emphasized by the propagation of surface polaritons [29].
For the second type of material taken into study (FRPC), the EM behavior of the composite was simulated by FDTD software; the samples were CAD designed following textiles features, and compared with eNDE tests. One cell of woven carbon fiber has been designed in the TexGenTextile Geometric modeler software (University of Nottingham, Nottingham, UK) (Figure 7a) and exported in CAD format in order to be used in FDTD software (XFDTD REMCOM, State College, PA, USA). The 5 × 5 tows were represented in different colors in order to easily follow their intersection when woven. The cell dimension in FDTD simulation is 0.04 mm, and the grid size is 146 × 146 × 45 cells. The perfectly matched layer boundary condition was applied at the grid boundaries.
Figure 7. Simulation of one woven carbon cell: (a) TexGen—different colors show the intersections in the woven 5HS; (b) XFDTD—Hy propagation in a plane orthogonal at composite.
Applsci 05 01412 g007
The result of the simulation presented in Figure 7b is a snapshot from a field sequence, showing the Hy field progress at a particular slice of the geometry. In this case, the role of conductive strips is taken by carbon fibers, which act as MSG [71]; the apparition of evanescent waves can also be emphasized.
The detection of eventual delamination or the characterization of carbon fibers’ woven structure using the eNDE method and the sensors with MM lens is an emerging nondestructive technique combining the advantages of conventional eddy current testing and evanescent wave detection, giving a higher resolution than a classical eddy current.
The results are shown in Figure 8, which presents a scan with 1-mm step of a 60 × 60 mm2 region from the FRPC sample impacted with 8 J, scanned in both directions.
Figure 8. Sensor data with MM lens for 8 J impact.
Applsci 05 01412 g008
It can be shown that the MM lens allow the enhancement of spatial resolution, with the layout of the woven being emphasized. The proposed method can thus be extended not only for the evaluation of MSG but also for the eNDE of FRPC in order to evaluate delaminations as well as the woven layout.

5. Conclusions

The structures’ conductive grating allows, by extension, the estimation of results from eNDE of few real situations such as evaluation of metallic strips in printed circuit, MSG in the sub-wavelength regime as a biosensor, and FRPC.
In order to significantly enhance the spatial resolution of the EM method, the use of evanescent waves that can appear in slits, in the space between FRPC and on the edge of open microscopic cracks, is proposed. Special attention is granted to the MM lens based on CSR configurations, with an optimal frequency that assures the concentration of the incident electromagnetic field as well as the effective manipulation of the evanescent waves. The EM field TMz polarized can be created with a rectangular frame, having the plane perpendicular on the plane of MSG/FRPC and fed with an alternating current.
The use of evanescent waves and sensors with MM lens allows for the manipulation of evanescent waves to reach a spatial resolution of approximately λ/2000.
The performance of the EM sensors with MM lens is improved regarding sensitivity and spatial resolution by using the evanescent wave that can appear in the space between slits for structures excited with a polarized TMz plane wave.

Acknowledgments

This paper is partially supported by a grant from the Romanian Ministry of Education CNCS-UEFISCDI, project number PN-II-ID-PCE-2012-4-0437.

Author Contributions

Adriana Savin has analyzed the experimental data and wrote of the paper. Adriana Savin, Alina Bruma have contributed to development of the theoretical aspects of the EM sensor with MM lens and functioning principle. Adriana Savin and Rozina Steigmann have designed and realized the EM sensor with MM lens. Nicoleta Iftimie and Dagmar Faktorova performed the experiment and used the EM sensor with MM lens on different MSG in the sub-wavelength regime to involve them as biosensors, and on FRPC to evaluate delamination as well as the woven layout. All of the authors read and approved the final manuscript.

Conflicts of Interest

The authors declare no conflict of interest.

References

  1. Bladel, V. Electromagnetic Fields, 2nd ed.; IEEE Press: Piscataway, NJ, USA, 2007. [Google Scholar]
  2. Theodoulidis, T.P.; Kriezis, E.E. Impedance evaluation of rectangular coils for eddy current testing of planar media. NDT E Int. 2002, 35, 407–414. [Google Scholar] [CrossRef]
  3. Sablik, M.J.; Burkhardt, G.L.; Kwun, H.; Jiles, D.C. A model for the effect of stress on the low frequency harmonic content of the magnetic induction in ferromagnetic materials. J. Appl. Phys. 1988. [Google Scholar] [CrossRef]
  4. Harfield, N.; Yoshida, Y.; Bowler, J.R. Low-frequency perturbation theory in eddy-current non-destructive evaluation. J. Appl. Phys. 1996, 80, 4090–4100. [Google Scholar] [CrossRef]
  5. Theodoulidis, T.P.; Bowler, J.R. Eddy-current interaction of a long coil with a slot in a conductive plate. IEEE Trans. Magn. 2005, 41, 1238–1247. [Google Scholar] [CrossRef]
  6. Grimberg, R.; Udpa, L.; Savin, A.; Steigmann, R.; Palihovici, V.; Udpa, S.S. 2D eddy current sensor array. NDT E Int. 2006, 39, 264–271. [Google Scholar] [CrossRef]
  7. Grimberg, R.; Savin, A.; Steigmann, R. Electromagnetic imaging using evanescent waves. NDT E Int. 2012, 46, 70–76. [Google Scholar] [CrossRef]
  8. Auld, B.A.; Moulder, J.C. Review of advances in quantitative eddy current non-destructive evaluation. J. Nondestruct. Eval. 1999, 18, 3–36. [Google Scholar] [CrossRef]
  9. Li, Y.; Theodoulidis, T.; Tian, G.Y. Magnetic field based multi-frequency eddy current for multilayered specimen characterization. IEEE Trans. Magn. 2007, 43, 4010–4015. [Google Scholar] [CrossRef]
  10. Wang, L.; Xie, S.; Chen, Z.; Li, Y.; Wang, X.; Takagi, T. Reconstruction of stress corrosion cracks using signals of pulsed eddy current testing. Nondestruct. Test Eva. 2013, 28, 145–154. [Google Scholar] [CrossRef]
  11. He, Y.; Pan, M.; Luo, F.; Tian, G. Pulsed eddy current imaging and frequency spectrum analysis for hidden defect nondestructive testing and evaluation. NDT E Int. 2011, 44, 344–352. [Google Scholar] [CrossRef]
  12. Tai, C.C.; Yang, H.C.; Liang, D.S. Pulsed eddy current for metal surface cracks inspection: Theory and experiment. AIP Conf. Proc. 2002, 21, 388–395. [Google Scholar]
  13. Wilson, J.W.; Tian, G.Y. Pulsed electromagnetic methods for defect detection and characterization. NDT E Int. 2007, 40, 275–283. [Google Scholar] [CrossRef]
  14. Mook, G.; Hesse, O.; Uchanin, V. Deep penetrating eddy currents and probes. Mater. Test 2007, 49, 258–264. [Google Scholar] [CrossRef]
  15. Wong, B.S. Non-Destructive Testing-Theory, Practice and Industrial Applications; Lap-Lambert Publishing GmbH KG: Saarbrücken, Germany, 2014. [Google Scholar]
  16. Dodd, C.V.; Deeds, W.E. Analytical Solutions to Eddy-Current Probe-Coil Problems. J. Appl. Phys. 1968, 39, 2829–2838. [Google Scholar] [CrossRef]
  17. Grimberg, R.; Savin, A.; Radu, E.; Mihalache, O. Nondestructive evaluation of the severity of discontinuities in flat conductive materials by an eddy-current transducer with orthogonal coils. IEEE Trans. Magn. 2000, 36, 299–307. [Google Scholar] [CrossRef]
  18. Bowler, J.R.; Jenkins, S.A.; Sabbagh, L.D.; Sabbagh, H.A. Eddy-current probe impedance due to a volumetric flaw. J. Appl. Phys. 1991, 70, 1107–1114. [Google Scholar] [CrossRef]
  19. Bihan, Y.L. Study on the transformer equivalent circuit of eddy current nondestructive evaluation. NDT E Int. 2003, 36, 297–302. [Google Scholar] [CrossRef]
  20. Grbic, A.; Eleftheriades, G.V. Growing evanescent waves in negative-refractive-index transmission-line media. Appl. Phys. Lett. 2003, 82, 1815–1817. [Google Scholar] [CrossRef]
  21. Petit, R.L.; Botten, L.C. Electromagnetic Theory of Gratings; Springer-Verlag: Berlin, Germany, 1980. [Google Scholar]
  22. Collin, R.E. Field Theory of Guided Waves; IEEE Press: New York, NY, USA, 1991. [Google Scholar]
  23. Munk, B. Frequency Selective Surfaces: Theory and Design; John Wiley & Sons, Inc.: New York, NY, USA, 2000. [Google Scholar]
  24. Balanis, C.A. Antenna Theory: Analysis and Design, 3rd ed.; John Wiley & Sons, Inc.: Hoboken, NJ, USA, 2005. [Google Scholar]
  25. Brand, G.I. The strip grating as a circular polarizer. Am. J. Phys. 2003, 71, 452–457. [Google Scholar] [CrossRef]
  26. Arnold, M.D. An efficient solution for scattering by a perfectly conducting strip grating. J. Electromagnet. Wave 2006, 20, 891–900. [Google Scholar] [CrossRef]
  27. Peterson, A.F.; Ray, S.L.; Mittra, R. Computational Methods for Electromagnetics; IEEE Press: New York, NY, USA, 1998. [Google Scholar]
  28. Porto, J.A.; Garcia-Vidal, F.J.; Pendry, J.B. Transmission resonances on metallic gratings with very narrow slits. Phys. Rev. Lett. 1999, 83, 2845–2849. [Google Scholar] [CrossRef]
  29. Kolomenski, A.; Kolomenskii, A.; Noel, J.; Peng, S.; Schuessler, H. Propagation length of surface plasmons in a metal film with roughness. Appl. Opt. 2009, 48, 5683–5691. [Google Scholar] [CrossRef] [PubMed]
  30. Grimberg, R. Electromagnetic metamaterials. Mater. Sci. Eng. B 2013. [Google Scholar] [CrossRef]
  31. Grimberg, R.; Savin, A.; Steigmann, R.; Serghiac, B.; Bruma, A. Electromagnetic non-destructive evaluation using metamaterials. Insight 2011, 53, 132–137. [Google Scholar] [CrossRef]
  32. Pilato, L.A.; Michno, M.J. Advanced Composite; Springer Verlag: Berlin, Germany, 1994. [Google Scholar]
  33. Morgan, P. Carbon Fibers and Their Composites; CRC Press: Boca Raton, FL, USA, 2005. [Google Scholar]
  34. Vieille, B.; Taleb, L. About the influence of temperature and matrix ductility on the behavior of carbon woven-ply PPS or epoxy laminates: Notched and unnotched laminates. Compos. Sci. Technol. 2011, 71, 998–1007. [Google Scholar] [CrossRef]
  35. TenCate Advanced Composites. Available online: http://www.tencate.com/ (accessed on 10 September 2015).
  36. Kaw, A.K. Mechanics of Composite Materials, 2nd ed.; CRC Press: Boca Raton, FL, USA, 2006. [Google Scholar]
  37. Standard AS 9100/2009. In Quality Systems-Aerospace-Model for Quality Assurance in Design, Development, Production, Installation and Servicing; SAE: Warrendale, PA, USA, 1999.
  38. Boller, C.; Meyendorf, N. State-of-the-art in Structural Health monitoring for aeronautics. In Proceedings of the International Symposium on NDT in Aerospace, Fürth/Bavaria, Germany, 3–5 December 2008; pp. 1–8.
  39. Elmarakbi, A. Advanced Composite Materials for Automotive Applications: Structural Integrity and Crashworthiness. John Wiley & Sons Ltd.: Chichester, West Sussex, UK, 2013. [Google Scholar]
  40. Boller, C. Next generation structural health monitoring and its integration aircraft design. Int. J. Syst. Sci. 2000, 31, 1333–1349. [Google Scholar] [CrossRef]
  41. Salvado, R.; Lopes, C.; Szojda, L.; Araújo, P.; Gorski, M.; Velez, F.J.; Krzywon, R. Carbon Fiber Epoxy Composites for Both Strengthening and Health Monitoring of Structures. Sensors 2015, 15, 10753–10770. [Google Scholar] [CrossRef] [PubMed]
  42. Kordatos, E.Z.; Aggelis, D.G.; Matikas, T.E. Monitoring mechanical damage in structural materials using complimentary NDE techniques based on thermography and acoustic emission. Compos. Part B Eng. 2012, 43, 2676–2686. [Google Scholar] [CrossRef]
  43. Adden, S.; Pfleiderer, K.; Solodov, I.; Horst, P.; Busse, G. Characterization of stiffness degradation caused by fatigue damage in textile composites using circumferential plate acoustic waves. Compos. Sci. Technol. 2008, 68, 1616–1623. [Google Scholar] [CrossRef]
  44. He, Y.; Tian, G.Y.; Pan, M.; Chen, D. Impact evaluation in carbon fiber reinforced plastic (CFRP) laminates using eddy current pulsed thermography. Compos. Struct. 2014, 109, 1–7. [Google Scholar] [CrossRef]
  45. Mian, A.; Han, X.; Islam, S.; Newaz, G. Fatigue damage detection in graphite/epoxy composites using sonic infrared imaging technique. Compos. Sci. Technol. 2004, 64, 657–666. [Google Scholar] [CrossRef]
  46. Vavouliotis, A.; Paipetis, A.; Kostopoulos, V. On the fatigue life prediction of CFRP laminates using the electrical resistance change method. Compos. Sci. Technol. 2011, 71, 630–642. [Google Scholar] [CrossRef]
  47. Park, J.M.; Kwon, D.J.; Wang, Z.J.; DeVries, K. Nondestructive sensing evaluation of surface modified single-carbon fiber reinforced epoxy composites by electrical resistivity measurement. Compos. Part B Eng. 2006, 37, 612–626. [Google Scholar] [CrossRef]
  48. Seon, G.; Makeev, A.; Cline, J.; Shonkwiler, B. Assessing 3D shear stress-strain properties of composites using Digital Image Correlation and finite element analysis based optimization. Compos. Sci. Technol. 2015, 117, 371–378. [Google Scholar]
  49. Nikishkov, Y.; Airoldi, L.; Makeev, A. Measurement of voids in composites by X-ray Computed Tomography. Compos. Sci. Technol. 2013, 89, 89–97. [Google Scholar] [CrossRef]
  50. Schilling, P.J.; Karedla, B.R.; Tatiparthi, A.K.; Verges, M.A.; Herrington, P.D. X-ray computed microtomography of internal damage in fiber reinforced polymer matrix composites. Compos. Sci. Technol. 2015, 65, 2071–2078. [Google Scholar] [CrossRef]
  51. Ren, W.; Liu, J.; Tian, G.Y.; Gao, B.; Cheng, L.; Yang, H. Quantitative non-destructive evaluation method for impact damage using eddy current pulsed thermography. Compos. Part B Eng. 2013, 54, 169–179. [Google Scholar] [CrossRef]
  52. Hung, Y.Y.; Chen, Y.S.; Ng, S.P.; Liu, L.; Huang, Y.H.; Luk, B.L.; Ip, R.W.L.; Wu, C.M.L.; Chung, P.S. Review and comparison of shearography and active thermography for nondestructive evaluation. Mater. Sci. Eng. R Rep. 2009, 64, 73–112. [Google Scholar] [CrossRef]
  53. Solodov, I.; Döring, D.; Rheinfurth, M.; Busse, G. New Opportunities in Ultrasonic Characterization of Stiffness Anisotropy in Composite Materials. In Nondestructive Testing of Materials and Structures; Springer: Dordrecht, The Netherlands, 2013; Volume 6, pp. 599–604. [Google Scholar]
  54. Kolkoori, S.; Hoehne, C.; Prager, J.; Rethmeier, M.; Kreutzbruck, M. Quantitative evaluation of ultrasonic C-scan image in acoustically homogeneous and layered anisotropic materials using three dimensional ray tracing method. Ultrasonics 2014, 54, 551–562. [Google Scholar] [CrossRef] [PubMed]
  55. Cacciola, M.; Calcagno, S.; Megali, G.; Pellicano, D.; Versaci, M.; Morabito, F.C. Eddy current modeling in composite materials. PIERS Online 2009, 5, 591–595. [Google Scholar]
  56. Grimberg, R.; Savin, A.; Steigmann, R.; Bruma, A.; Barsanescu, P. Ultrasound and eddy current data fusion for evaluation of carbon-epoxy composite delaminations. Insight 2009, 51, 1–25. [Google Scholar] [CrossRef]
  57. Lamberti, A.; Chiesura, G.; Luyckx, G.; Degrieck, J.; Kaufmann, M.; Vanlanduit, S. Dynamic Strain Measurements on Automotive and Aeronautic Composite Components by Means of Embedded Fiber Bragg Grating Sensors. Sensors 2015, 15, 27174–27200. [Google Scholar] [CrossRef] [PubMed]
  58. Takeda, S.; Okabe, Y.; Takeda, N. Delamination detection in CFRP laminates with embedded small-diameter fiber Bragg grating sensors. Compos. Part A 2002, 33, 971–980. [Google Scholar] [CrossRef]
  59. Savin, A.; Steigmann, R.; Bruma, A.; Šturm, R. An Electromagnetic Sensor with a Metamaterial Lens for Nondestructive Evaluation of Composite Materials. Sensors 2015, 15, 15903–15920. [Google Scholar] [CrossRef] [PubMed]
  60. Grimberg, R.; Savin, A. Electromagnetic Transducer for Evaluation of Structure and Integrity of the Composite Materials with Polymer Matrix Reinforced with Carbon Fibers. Patent RO126245-A0, 2011. [Google Scholar]
  61. Pendry, J.; Holden, A.J.; Robbins, D.J.; Stewart, W.J. Magnetism from conductors and enhanced non-linear phenomena. IEEE Trans. Microw Theory Tech. 1999, 47, 47–58. [Google Scholar] [CrossRef]
  62. Pendry, J.B. Negative Refraction makes a perfect lens. Phys. Rev. Lett. 2000, 85, 3966–3969. [Google Scholar] [CrossRef] [PubMed]
  63. Cai, W.; Chettiar, U.K.; Kildishev, A.V.; Shalaev, V.M. Optical cloaking with metamaterials. Nat. Photonics 2007, 1, 224–227. [Google Scholar] [CrossRef] [Green Version]
  64. Smith, D.R.; Pendry, J.B.; Wiltshire, M.C.K. Metamaterials and negative refractive index. Science 2004, 305, 788–792. [Google Scholar] [CrossRef] [PubMed]
  65. Shelby, R.A.; Smith, D.R.; Schultz, S. Experimental Verification of a Negative Index of Refraction. Science 2001, 6, 77–79. [Google Scholar] [CrossRef] [PubMed]
  66. Bai, Q.; Liu, C.; Chen, J.; Cheng, C.; Kang, M. Tunable slow light in semiconductor metamaterial in a broad terahertz regime. J. Appl. Phys. 2010. [Google Scholar] [CrossRef]
  67. Wuttig, M.; Yamada, N. Phase-change materials for rewriteable data storage. Nat. Mater. 2007, 6, 824–832. [Google Scholar] [CrossRef] [PubMed]
  68. Engheta, N.; Ziolkowski, R.W. Electromagnetic Metamaterials: Physics and Engineering Explorations; John Wiley & Sons, Inc.: New York, NY, USA, 2006. [Google Scholar]
  69. Zouhdi, S.; Sihvola, A.; Vinogradov, A.P. Metamaterials and Plasmonics: Fundamentals, Modelling, Applications; Springer: New York, NY, USA, 2008. [Google Scholar]
  70. Veselago, V.G. The electrodynamics of substances with simultaneously negative values of ϵ and μ. Phys. Uspekhi 1968, 10, 509–514. [Google Scholar] [CrossRef]
  71. Grimberg, R.; Tian, G.Y. High Frequency Electromagnetic Non-destructive Evaluation for High Spatial Resolution using Metamaterial. Proc. R. Soc. A 2012, 468, 3080–3099. [Google Scholar] [CrossRef]
  72. Born, M.; Wolf, E. Principle of Optics, 5th ed.; Pergamon Press: Oxford, UK, 1975. [Google Scholar]
  73. Goodman, J.W. Introduction to Fourier Optics, 3rd ed.; Roberts and Company: Englewood, CO, USA, 2005. [Google Scholar]
  74. Kong, J.A. Electromagnetic Wave Theory; EMW Publishing: Cambridge, MA, USA, 2000. [Google Scholar]
  75. Shelby, R.A.; Smith, D.R.; Nemat-Nasser, S.C.; Schultz, S. Microwave transmission through a two-dimensional, isotropic, left-handed metamaterial. Appl. Phys. Lett. 2001, 78, 489–491. [Google Scholar] [CrossRef]
  76. Chen, X.; Grzegorczyk, T.M.; Wu, B.I.; Pacheco, J., Jr.; Kong, J.A. Robust method to retrieve the constitutive effective parameters of metamaterials. Phys. Rev. E 2004. [Google Scholar] [CrossRef] [PubMed]
  77. Prentice, G.A.; Chen, K.S. Effects of current density on adhesion of copper electrodeposits to polyimide substrates. J. Appl. Electrochem. 1998, 28, 971–977. [Google Scholar] [CrossRef]
  78. SPI Supplies. Available online: http://www.2spi.com/ (accessed on 10 October 2015).
  79. Palik, E.D. Handbook of Optical Constants of Solids; Academic Press: London, UK, 1985. [Google Scholar]
  80. Schlesinger, M. Deposition on Nonconductors, Chapter 15 on Modern Electroplating, 5th ed.; John Wiley & Sons: Hoboken, NJ, USA, 2010; pp. 413–420. [Google Scholar]
  81. Akkerman, R. Laminate mechanics for balanced woven fabrics. Compos. Part B Eng. 2006, 37, 108–116. [Google Scholar] [CrossRef]
  82. Standard Test Method for Measuring the Damage Resistance of a Fiber-Reinforced Polymer Matrix Composite to a Drop-Weight Event. ASTM International: West Conshohocken, PA, USA, 2005.
  83. Menana, H.; Féliachi, M. Electromagnetic characterization of the CFRPs anisotropic conductivity: Modeling and measurements. Eur. Phys. J. Appl. Phys. 2011. [Google Scholar] [CrossRef]
  84. Ullah, H.; Abdel-Wahab, A.A.; Harland, A.R.; Silberschmidt, V.V. Damage in woven CFRP laminates subjected to low velocity impacts. J. Phys. Conf. Ser. 2012. [Google Scholar] [CrossRef]
  85. Balanis, C. Advanced Engineering Electromagnetics; John Wiley & Sons: Hoboken, NJ, USA, 1989. [Google Scholar]
  86. Kunz, K.S.; Luebbers, R.J. The Finite Difference Time Domain Method for Electromagnetics; CRC Press: Boca Raton, FL, USA, 1993. [Google Scholar]

