Article

Sum-Frequency-Generation-Based Laser Sidebands for Tunable Femtosecond Raman Spectroscopy in the Ultraviolet

1
Department of Chemistry and the Center for Sustainable Materials Chemistry, Oregon State University, 153 Gilbert Hall, Corvallis, OR 97331, USA
2
Department of Physics, Oregon State University, 301 Weniger Hall, Corvallis, OR 97331, USA
*
Author to whom correspondence should be addressed.
Appl. Sci. 2015, 5(2), 48-61; https://doi.org/10.3390/app5020048
Submission received: 11 March 2015 / Revised: 8 April 2015 / Accepted: 13 April 2015 / Published: 16 April 2015

Abstract

:
Femtosecond stimulated Raman spectroscopy (FSRS) is an emerging molecular structural dynamics technique for functional materials characterization typically in the visible to near-IR range. To expand its applications we have developed a versatile FSRS setup in the ultraviolet region. We use the combination of a narrowband, ~400 nm Raman pump from a home-built second harmonic bandwidth compressor and a tunable broadband probe pulse from sum-frequency-generation-based cascaded four-wave mixing (SFG-CFWM) laser sidebands in a thin BBO crystal. The ground state Raman spectrum of a laser dye Quinolon 390 in methanol that strongly absorbs at ~355 nm is systematically studied as a standard sample to provide previously unavailable spectroscopic characterization in the vibrational domain. Both the Stokes and anti-Stokes Raman spectra can be collected by selecting different orders of SFG-CFWM sidebands as the probe pulse. The stimulated Raman gain with the 402 nm Raman pump is >21 times larger than that with the 550 nm Raman pump when measured at the 1317 cm−1 peak for the aromatic ring deformation and ring-H rocking mode of the dye molecule, demonstrating that pre-resonance enhancement is effectively achieved in the unique UV-FSRS setup. This added tunability in the versatile and compact optical setup enables FSRS to better capture transient conformational snapshots of photosensitive molecules that absorb in the UV range.

Graphical Abstract

1. Introduction

The advent of femtosecond lasers has ushered in an exciting era of modern quantum chemistry and molecular spectroscopy [1,2] which has provided previously unavailable or hidden insights about structural dynamics, chemical reactivity, and biological functionality [2,3,4,5,6,7]. The ultrafast time duration of the incident laser pulses is key to dissect the electronic potential energy surface of the molecular system under investigation, and a time-delayed pump-probe setup is typically implemented to measure the system response on the intrinsic molecular timescale. In comparison to the widely used transient absorption technique that records the electronic responses as a function of time, vibrational spectroscopy is intimately related to molecular structure and the associated normal modes, making the observed vibrational frequencies highly sensitive to the local environment of the chemical bond. By incorporating a preceding actinic pump pulse that induces photochemistry or other chemical reactions, vibrational transitions of the molecular system can be tracked in real time via IR absorption or Raman processes with ultrafast IR or visible laser pulses, typically on the femtosecond (fs) to picosecond (ps) timescale which can report on the incipient stage of photoinduced processes.
To exploit the full potential of ultrafast vibrational spectroscopy to characterize functional materials and biomolecules, we have developed femtosecond stimulated Raman spectroscopy (FSRS) as an emerging structural dynamics technique that has simultaneously high spectral and temporal resolutions [7,8,9,10,11,12,13]. The approach measures the ensemble average of system response so the observed structural evolution is insensitive to stochastic fluctuations but useful to report on functional atomic motions that are previously challenging to measure experimentally [2,7]. The conventional FSRS technique consists of an ~800 nm, ps Raman pump pulse from a grating-based spectral filter and a ca. 840–920 nm, fs Raman probe pulse from supercontinuum white light (SCWL) generation [9,10,11]. A preceding ~400 nm or 520–660 nm actinic pump pulse from second harmonic generation or noncollinear optical parametric amplification needs to be incorporated when the excited state molecular transformation is studied. One limiting factor for wider applications of FSRS is the wavelength tunability of incident pulses, particularly concerning the ps pump-fs probe pair that performs the stimulated Raman scattering process either in the electronic ground state (S0) or excited state (e.g., S1). Notably, different molecules have different potential energy landscapes so the vibrational energy levels and resonance Raman conditions vary greatly [14]. To turn FSRS into a more powerful and versatile spectroscopic toolset readily accessible to tackle a wide range of problems in energy and biology related fields, more technical innovations and optical advances are warranted.
In our earlier work, we reported the implementation of cascaded four-wave mixing (CFWM) in a thin transparent medium such as BK7 glass to generate broadband up-converted multicolor array (BUMA) signals [15]. One of these tunable, ultrabroad laser sidebands was used as the Raman probe in conjunction with an 800 nm Raman pump to collect the anti-Stokes Raman spectrum of a 1:1 v/v carbon tetrachloride:ethanol mixed standard solution [16] with high signal-to-noise ratio. We have also reported the BUMA sidebands in a 0.1-mm-thick BBO crystal at phase-matching condition for maximal second harmonic generation (SHG) [17]. The resultant SHG/sum-frequency-generation(SFG) assisted cascaded four-wave mixing processes lead to fs sideband signals from ca. 350–490 nm that are simultaneously enhanced due to χ(2) and χ(3)-based four-wave optical parametric amplification [18]. Can this expanded versatility and tunability help expand the available optical methods for fs Raman probe generation? Can we investigate sample systems that primarily absorb in the UV, such as DNA/RNA molecules, metal-organic complexes that undergo ligand-metal charge transfer upon photoexcitation, and the functionally relevant amino acids (e.g., Trp and Tyr) in proteins and enzymes? Notably, the near-UV probe pulse can work well in conjunction with a ps Raman pump pulse, which is available from a second harmonic bandwidth compressor (SHBC) using the commercially available femtosecond 800 nm laser source [19]. In addition, the UV photoexcitation pulse at 267 nm can be readily generated from third harmonic generation of the 800 nm fundamental pulse.
In this article, we build on our previous results and report the construction and characterization of a versatile UV-FSRS setup incorporating both home-built second harmonic bandwidth compressor and SFG-based cascaded four-wave mixing. We demonstrate the feasibility of this setup in capturing the ground-state FSRS spectra of a laser dye Quinolon 390 (7-Dimethylamino-1-methyl-4-methoxy-8-azaquinolone-2, C12H15N3O2; Exciton Catalog No. 03900, or LD390) that has an absorption/emission peak at 355/390 nm in methanol. By tuning the ps Raman pump wavelength from visible (e.g., 550, 487 nm) to UV (e.g., 402 nm) and fs Raman probe wavelength in tandem based on supercontinuum white light generation as well as the broadband up-converted multicolor array technology, we achieve the pre-resonance enhancement factor of >21 for the stimulated Raman modes over a wide spectral window of >1400 cm–1. These new results showcase the utility of tunable BUMA laser pulses in advancing the emerging FSRS technique, broadening its application potential to expose equilibrium and transient vibrational signatures of a wider array of photosensitive molecular systems that absorb in the UV to near-IR range [10,12].

2. Experimental Section

Our main optical setup to achieve tunable FSRS in the UV range uses a portion of the fundamental pulse (FP) output from a Ti:sapphire-based fs laser regenerative amplifier (Legend Elite-USP-1K-HE, Coherent, Inc.) seeded by a mode-locked Ti:sapphire oscillator (Mantis-5, Coherent). The FP of ~1 W at 800 nm center wavelength with 35 fs time duration (full-width-half-maximum, or fwhm) and 1 kHz repetition rate is split into two parts with a 9:1 ratio to pump the home-built second harmonic bandwidth compressor and the broadband up-converted multicolor array setup, respectively (see Figure 1). In the second harmonic bandwidth compressor section, the input beam is separated evenly into two arms, which go through reflective grating and cylindrical lens pairs and are stretched from fs to ps pulses with opposite chirps tuned to have the same magnitude [20]. After recombining the two arms at a 1-mm-thick Type-I BBO crystal (θ = 29.2°) we achieve the chirp-free narrowband ps pulse centered at ~402 nm as a result of the chirp elimination effect [21]. The time duration of the second harmonic pulse is characterized by the optical Kerr effect (OKE) measurement with another 400 nm pulse from second harmonic generation of the FP followed by prism compression (40 fs, acting as the gate pulse), yielding a temporal profile with ~1.45 ps fwhm (Figure 2). To obtain the spectral width, we disperse the pulse with a 1200 grooves/mm, 500 nm blaze ruled reflective grating and image onto a CCD camera. After wavelength calibration with a mercury argon source (HG-1, Ocean Optics) across the UV/Vis range, the fwhm of the picosecond 402 nm pulse is measured to be ~11 cm–1. This represents a time-bandwidth product of ~15.9 ps·cm–1 that is close to the Fourier-transform limit of a Gaussian-profile pulse (~14.7 ps·cm–1), indicating that the 402 nm pulse is largely chirp-free and can be used as the narrowband Raman pump pulse in FSRS.
In the broadband up-converted multicolor array setup, an FP and an SCWL (alternatively referred to as WL) pulse are loosely focused onto a 0.1-mm-thick BBO crystal to generate multiple sidebands via SFG-based cascaded four-wave mixing [17]. The crossing angle between the two incident fs pulses is ~6° to achieve balance between conversion efficiency and spatial separation of nascent sidebands [15,22,23]. The phase-matching condition of the BBO crystal is set to favor SFG. The first sideband on either the FP (S+1) or WL (S–1) side is selected with an iris diaphragm and used as the Raman probe (Figure 1). The pulse-to-pulse intensity stability is within 5%, which can be effectively averaged out by repeatedly collecting FSRS signals over several minutes (see below). Notably, the highly nonlinear pulse generation does not incur substantial intensity noise because we use low pump power to generate laser sidebands in the background-free directions (see Figure 1) so the interference effect with fundamental incident pulses is much reduced. Furthermore, the bandwidth of S+1 and S–1 is measured to be ca. 1400 and 1700 cm–1, respectively, which supports the self-compression of these CFWM-induced sidebands to fs pulses [15,17]. To potentially achieve transform-limited pulses, further compression with accurate chirp compensation is needed [24,25].
The selected BUMA sideband and the SHBC output pulse are focused onto a 1-mm-thick quartz sample cell by an f = 12 cm off-axis parabolic mirror to avoid introducing additional chirps (e.g., if we use a focusing lens instead). Both incident beams pass through the sample solution containing 15 mM LD390 laser dye in methanol (Figure 1). The Raman pump is then blocked while the Raman probe pulse carrying the stimulated Raman scattering signal is re-collimated and focused into the spectrograph with a 1200 grooves/mm, 500 nm blaze ruled reflective grating. The dispersed signal is collected by a CCD array camera (Princeton Instruments, PIXIS 100F) that is synchronized with the laser at 1 kHz repetition rate to achieve shot-to-shot spectral acquisition. A phase-stable optical chopper (Newport 3501) in the Raman pump beampath at 500 Hz (also synchronized with the laser) ensures that one Raman spectrum can be collected within 2 ms through dividing the Raman probe profile with “Raman pump on” by “Raman pump off” (see Equation (1)).
Therefore, the recorded FSRS signal strength is typically expressed in the stimulated Raman gain:
Raman Gain = Probe_spectrumpump-on/Probe_spectrumpump-off – 1
We routinely collect the Raman spectrum with 3000 laser shots per point and 100 sets, so 150,000 Raman spectra are averaged to yield the final Raman spectrum as shown in Figure 3a and Figure 4a with much improved signal-to-noise ratio. Experimentally we do not observe sharp noises that affect the detection sensitivity of the system, and the highly efficient data averaging within ~3 s for each recorded data trace largely removes the broad baseline fluctuations of the probe pulse (e.g., mostly up and down in intensity profile, not left and right along the frequency axis). All the experiments are performed at room temperature (21.9 °C) and ambient pressure (1 atm). To investigate the resonance Raman enhancement effect, we use the previously developed tunable FSRS in the visible to generate the ps Raman pump pulse (at 487 and 550 nm) in conjunction with an fs Raman probe pulse (to the red side of the pump) based on supercontinuum white light generation in a 2-mm-thick Z-cut sapphire plate followed by prism compression. Figure 3a displays the detailed comparison between ground-state FSRS spectra collected at various Raman pump-probe wavelengths, wherein the intensity noise level does not increase significantly as Raman pump wavelength approaches the electronic absorption peak. Figure 3b shows the computed Raman modes from density functional theory (DFT) B3LYP calculations in the electronic ground state using 6-311G+(d, p) basis sets for LD390 in methanol solution and the integral equation formalism polarizable continuum model (IEFPCM-methanol), performed by the Gaussian 09 program [26].
Figure 1. Schematic of the UV-Femtosecond stimulated Raman spectroscopy (FSRS) experimental setup. The fundamental laser output is split to separately pump a home-built second harmonic bandwidth compressor (SHBC, light blue shaded area) and a broadband up-converted multicolor array (BUMA, light violet shaded area) based on the unique sum-frequency-generation-based (SFG-based) cascaded four-wave mixing (CFWM) in a thin BBO crystal. A photograph of SFG-CFWM sideband signals on a sheet of white paper is shown with the first sideband on either side of SFG highlighted by black dotted circles. The first sideband either on the FP side (S+1) or on the WL side (S–1) is used as the Raman probe pulse in conjunction with the narrowband SHBC output as the Raman pump to record anti-Stokes and Stokes stimulated Raman spectrum, respectively. The 20:80 BS represents 20% Reflection and 80% Transmission.
Applsci 05 00048 g001

3. Results and Discussion

The FSRS technology has been successfully applied to a number of important photosensitive molecular systems including rhodopsin [27], bacteriorhodopsin [28], phytochrome [29], organic dyes in solar cells [30], Fe(II) spin crossover in solution [31], fluorescent proteins [7,32,33], and calcium-ion-sensing protein biosensors [34,35,36]. The main goal of this work is to construct a versatile, tunable FSRS setup that extends the wavelength detection window to the UV regime with desired resonance Raman enhancement. As a result, a wider range of photochemical reaction pathways can be elucidated particularly for metal-organic complexes in solution (absorption peak below 300 nm) and tyrosine residues in proteins (max absorption at ~276 nm) in conjunction with a femtosecond actinic pump pulse. Because FSRS is a stimulated Raman technique, the concomitant generation of a pair of ps-Raman-pump and fs-Raman-probe pulses is required.

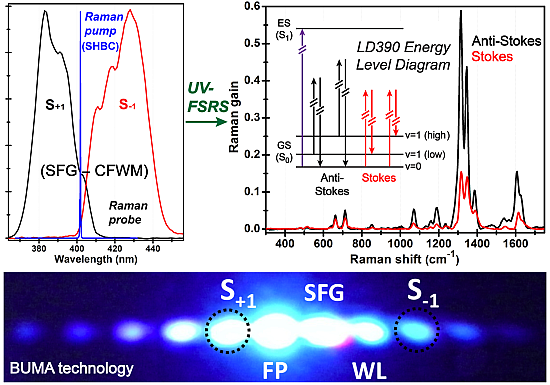
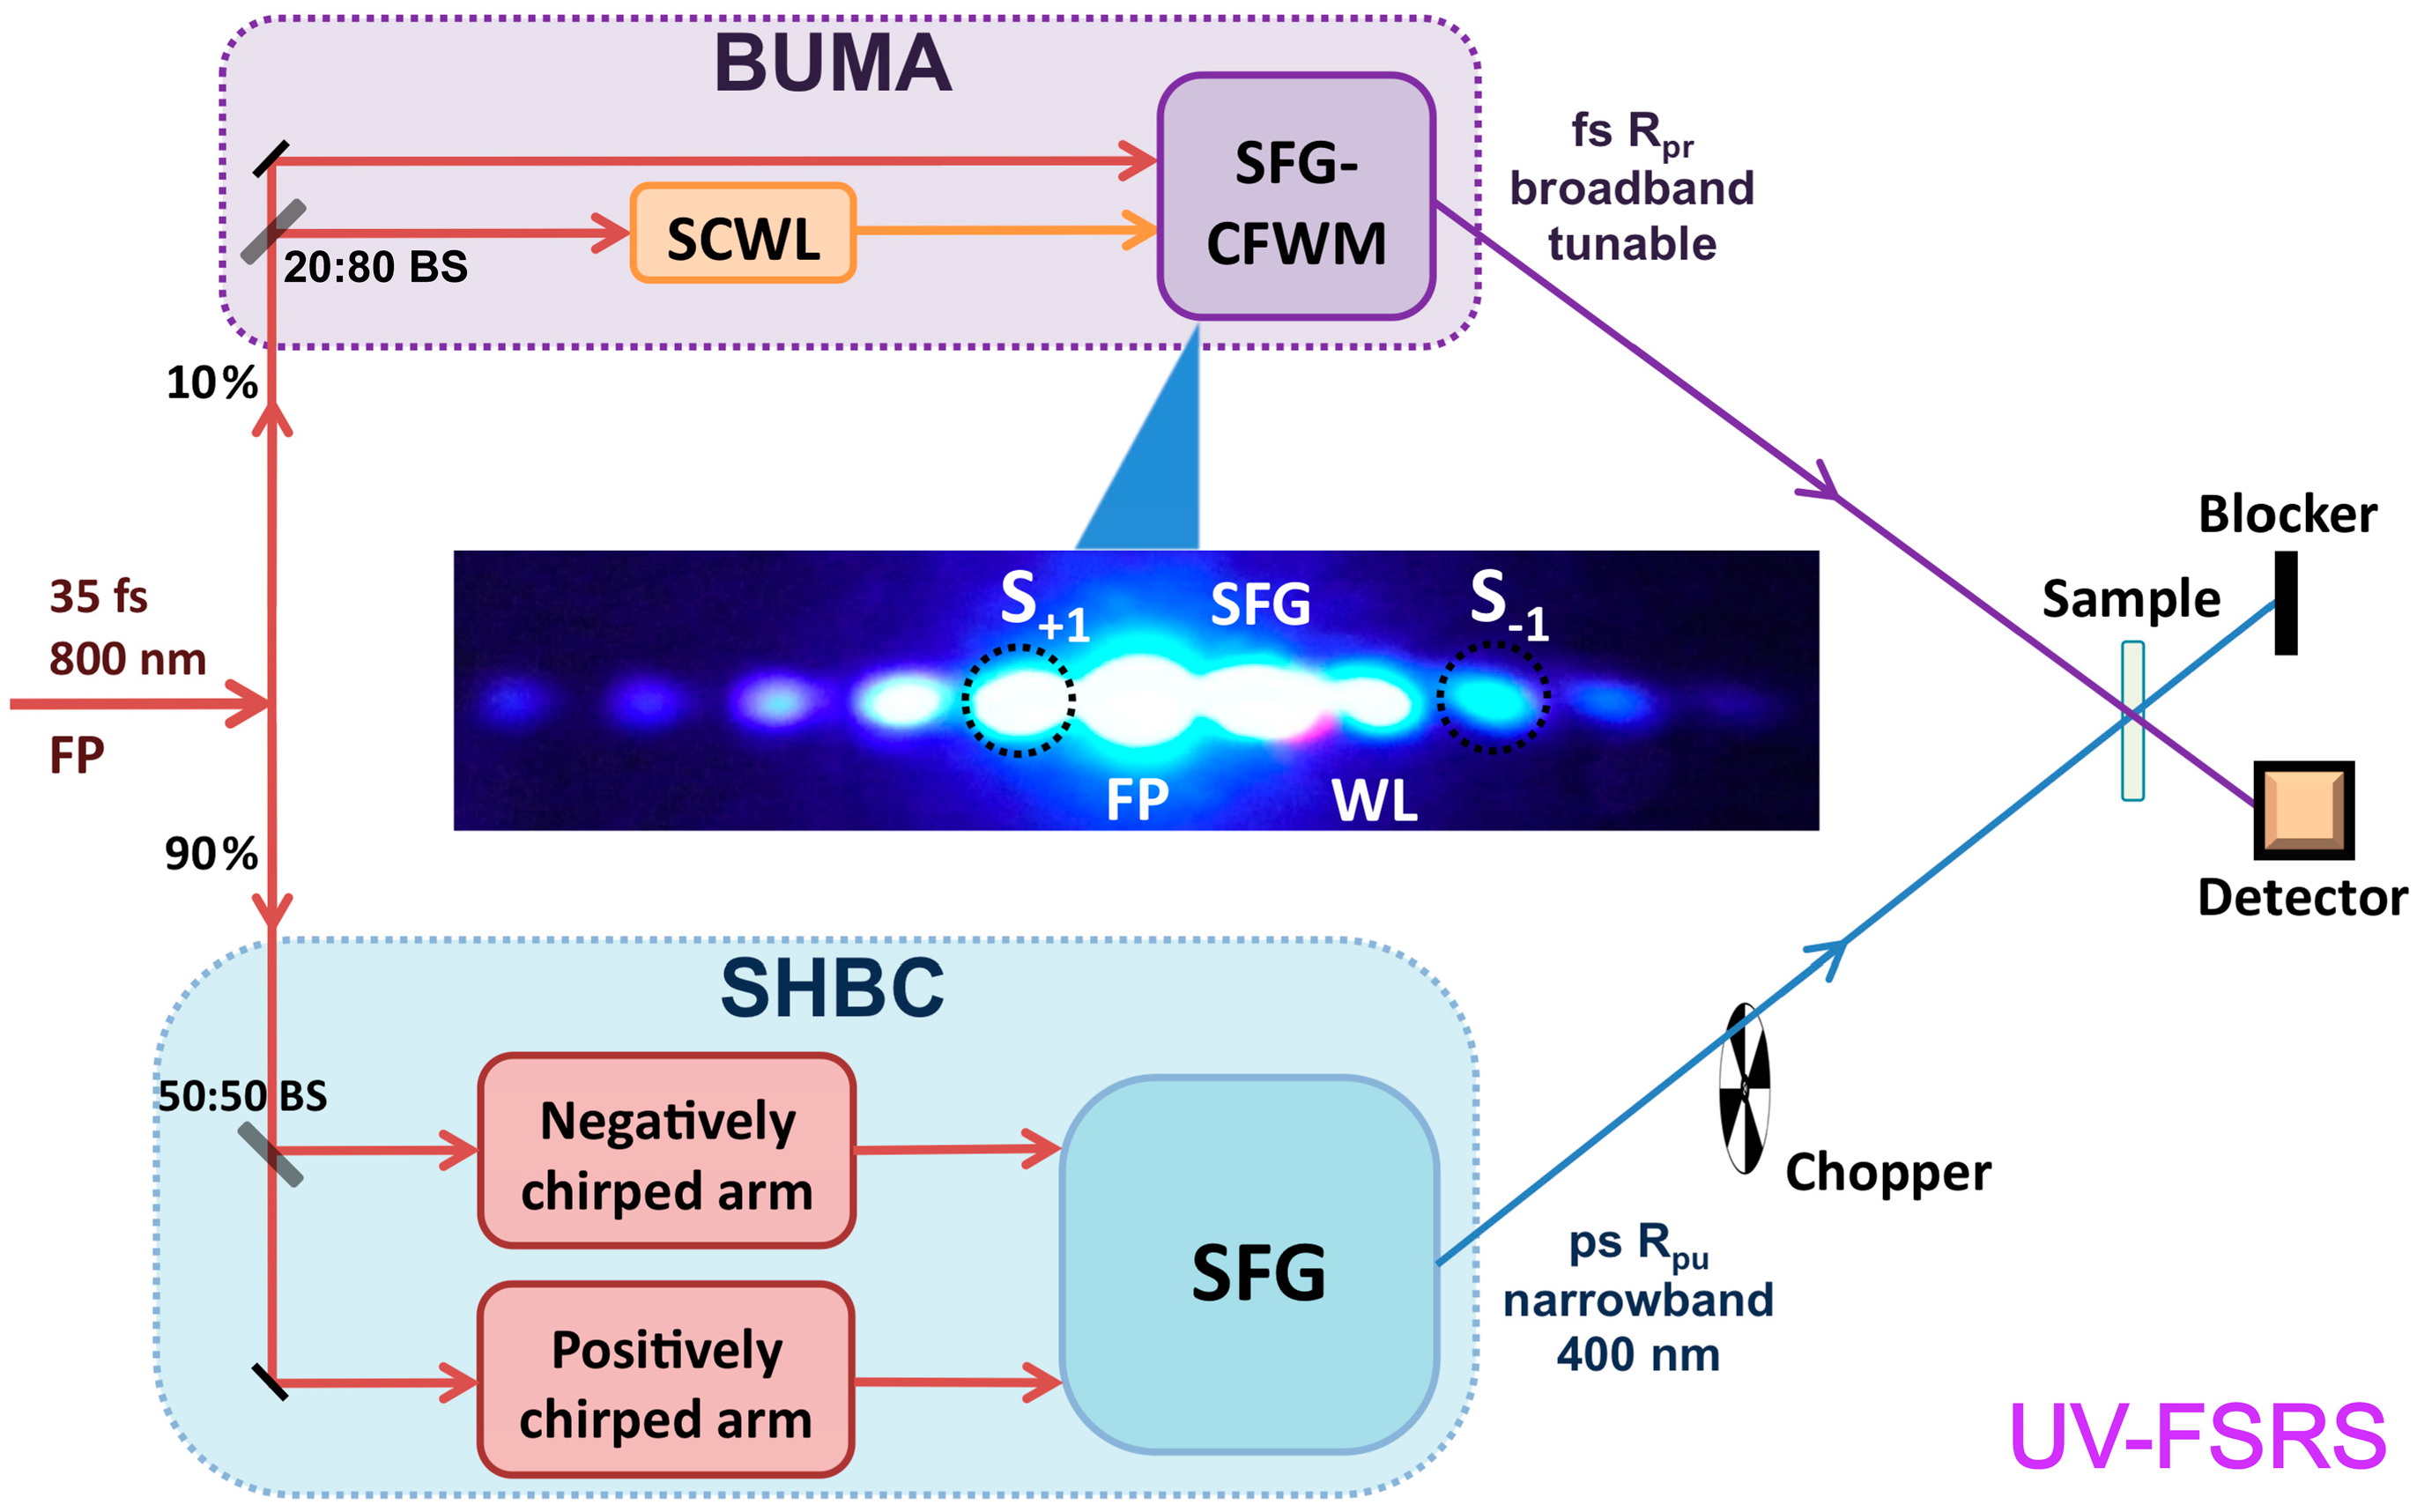
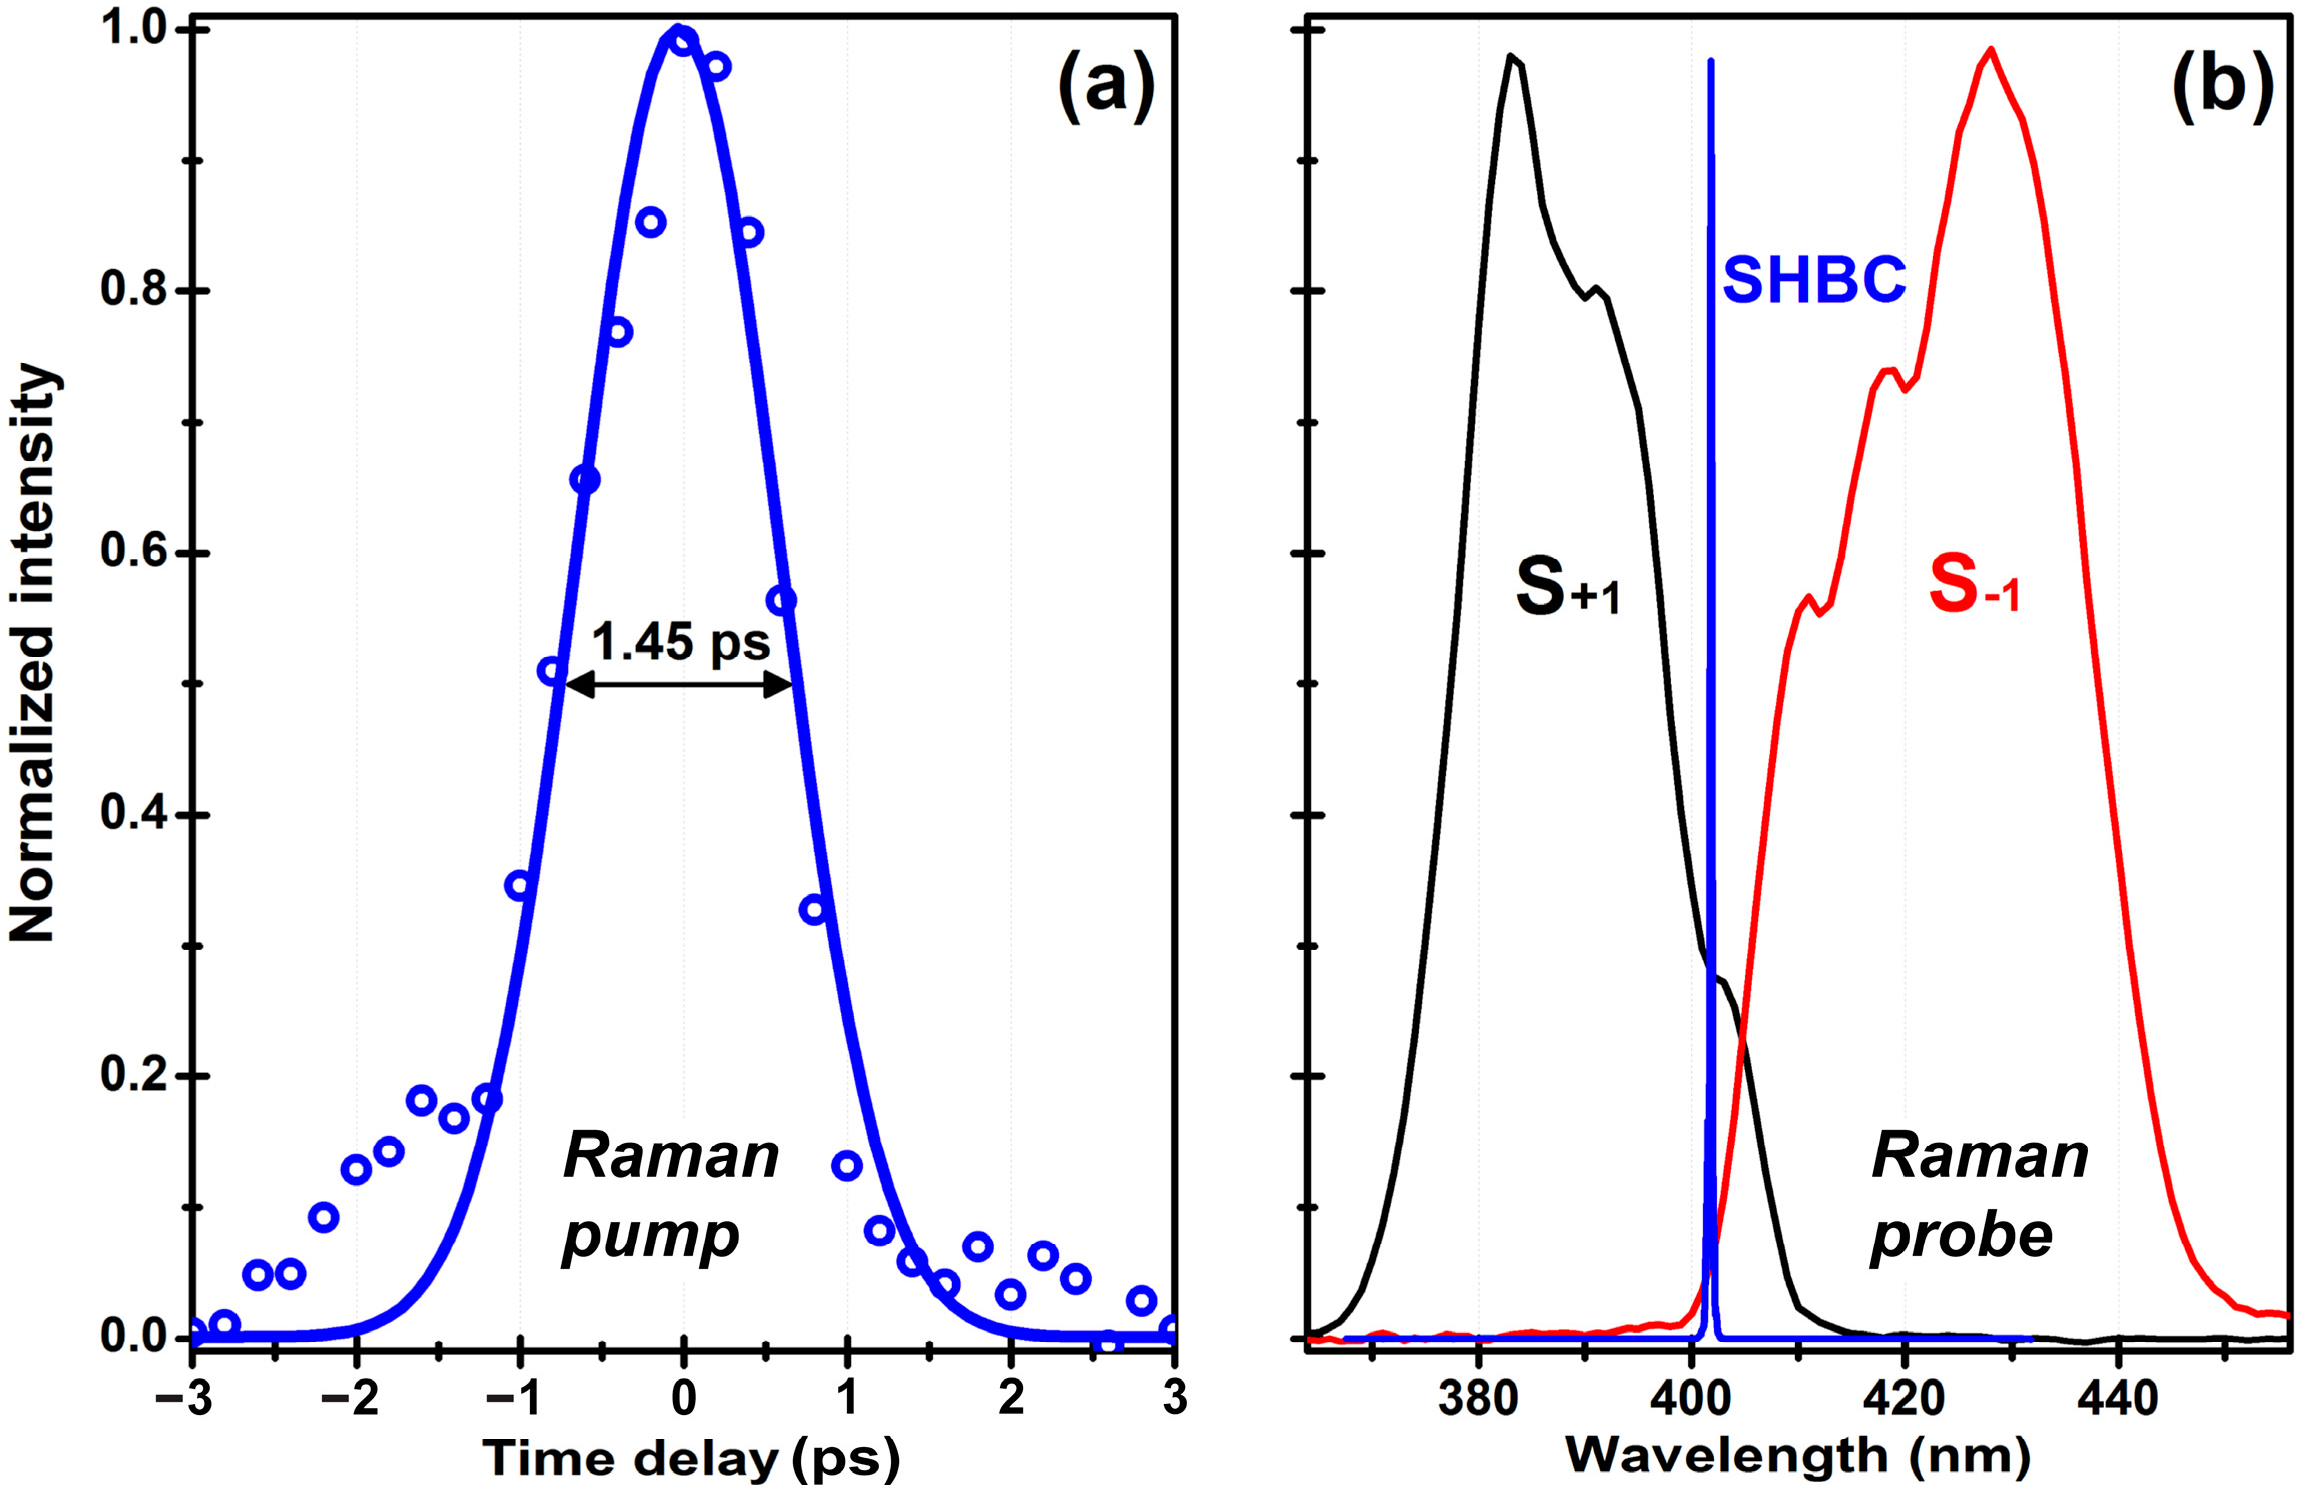
3.1. UV-FSRS Setup with SHBC and SFG-CFWM

Starting from the fs 800 nm laser amplifier system, we choose to exploit a home-built single-grating-based second harmonic bandwidth compressor to produce a ~400 nm, ps pulse [20] as the Raman pump. To conveniently generate an accompanying Raman probe, we rely on the SFG-CFWM method that can be readily tuned by varying the time delay between the two incident pulses or selecting a different sideband on either side of the FP beam (see Figure 1, middle). The wavelength tunability of those sidebands has been discussed in our previous reports [15,17]. Figure 2a shows temporal characterization of the second harmonic bandwidth compressor output at 402 nm with ~1.45 ps pulse duration (fwhm). Figure 2b displays the relative spectral position of the narrowband Raman pump and two distinct femtosecond BUMA sidebands from SFG-CFWM processes in a thin BBO crystal, S+1 and S-1, which enable the collection of anti-Stokes and Stokes Raman spectrum, respectively. Furthermore, we have demonstrated the SFG-CFWM sidebands spanning a broad UV to visible spectral range from ca. 350–490 nm [17], which can be potentially pushed toward shorter wavelengths upon increasing the pump power and/or reducing the incident beam crossing angle [23,24].
Figure 2. Spectral characterization of the Raman pump and probe pulse pair for FSRS. (a) Temporal profile of the narrowband Raman pump measured from optical Kerr effect (OKE). The pulse duration of ~1.45 ps is obtained from the fwhm of the Gaussian fit (blue solid curve) to the time-resolved experimental data points (blue open circles). (b) Spectra of the SHBC output as the Raman pump in (a) (blue) and the first two BUMA sidebands as the Raman probe, S+1 on the FP side (black) and S−1 on the WL side (red), respectively.
Applsci 05 00048 g002

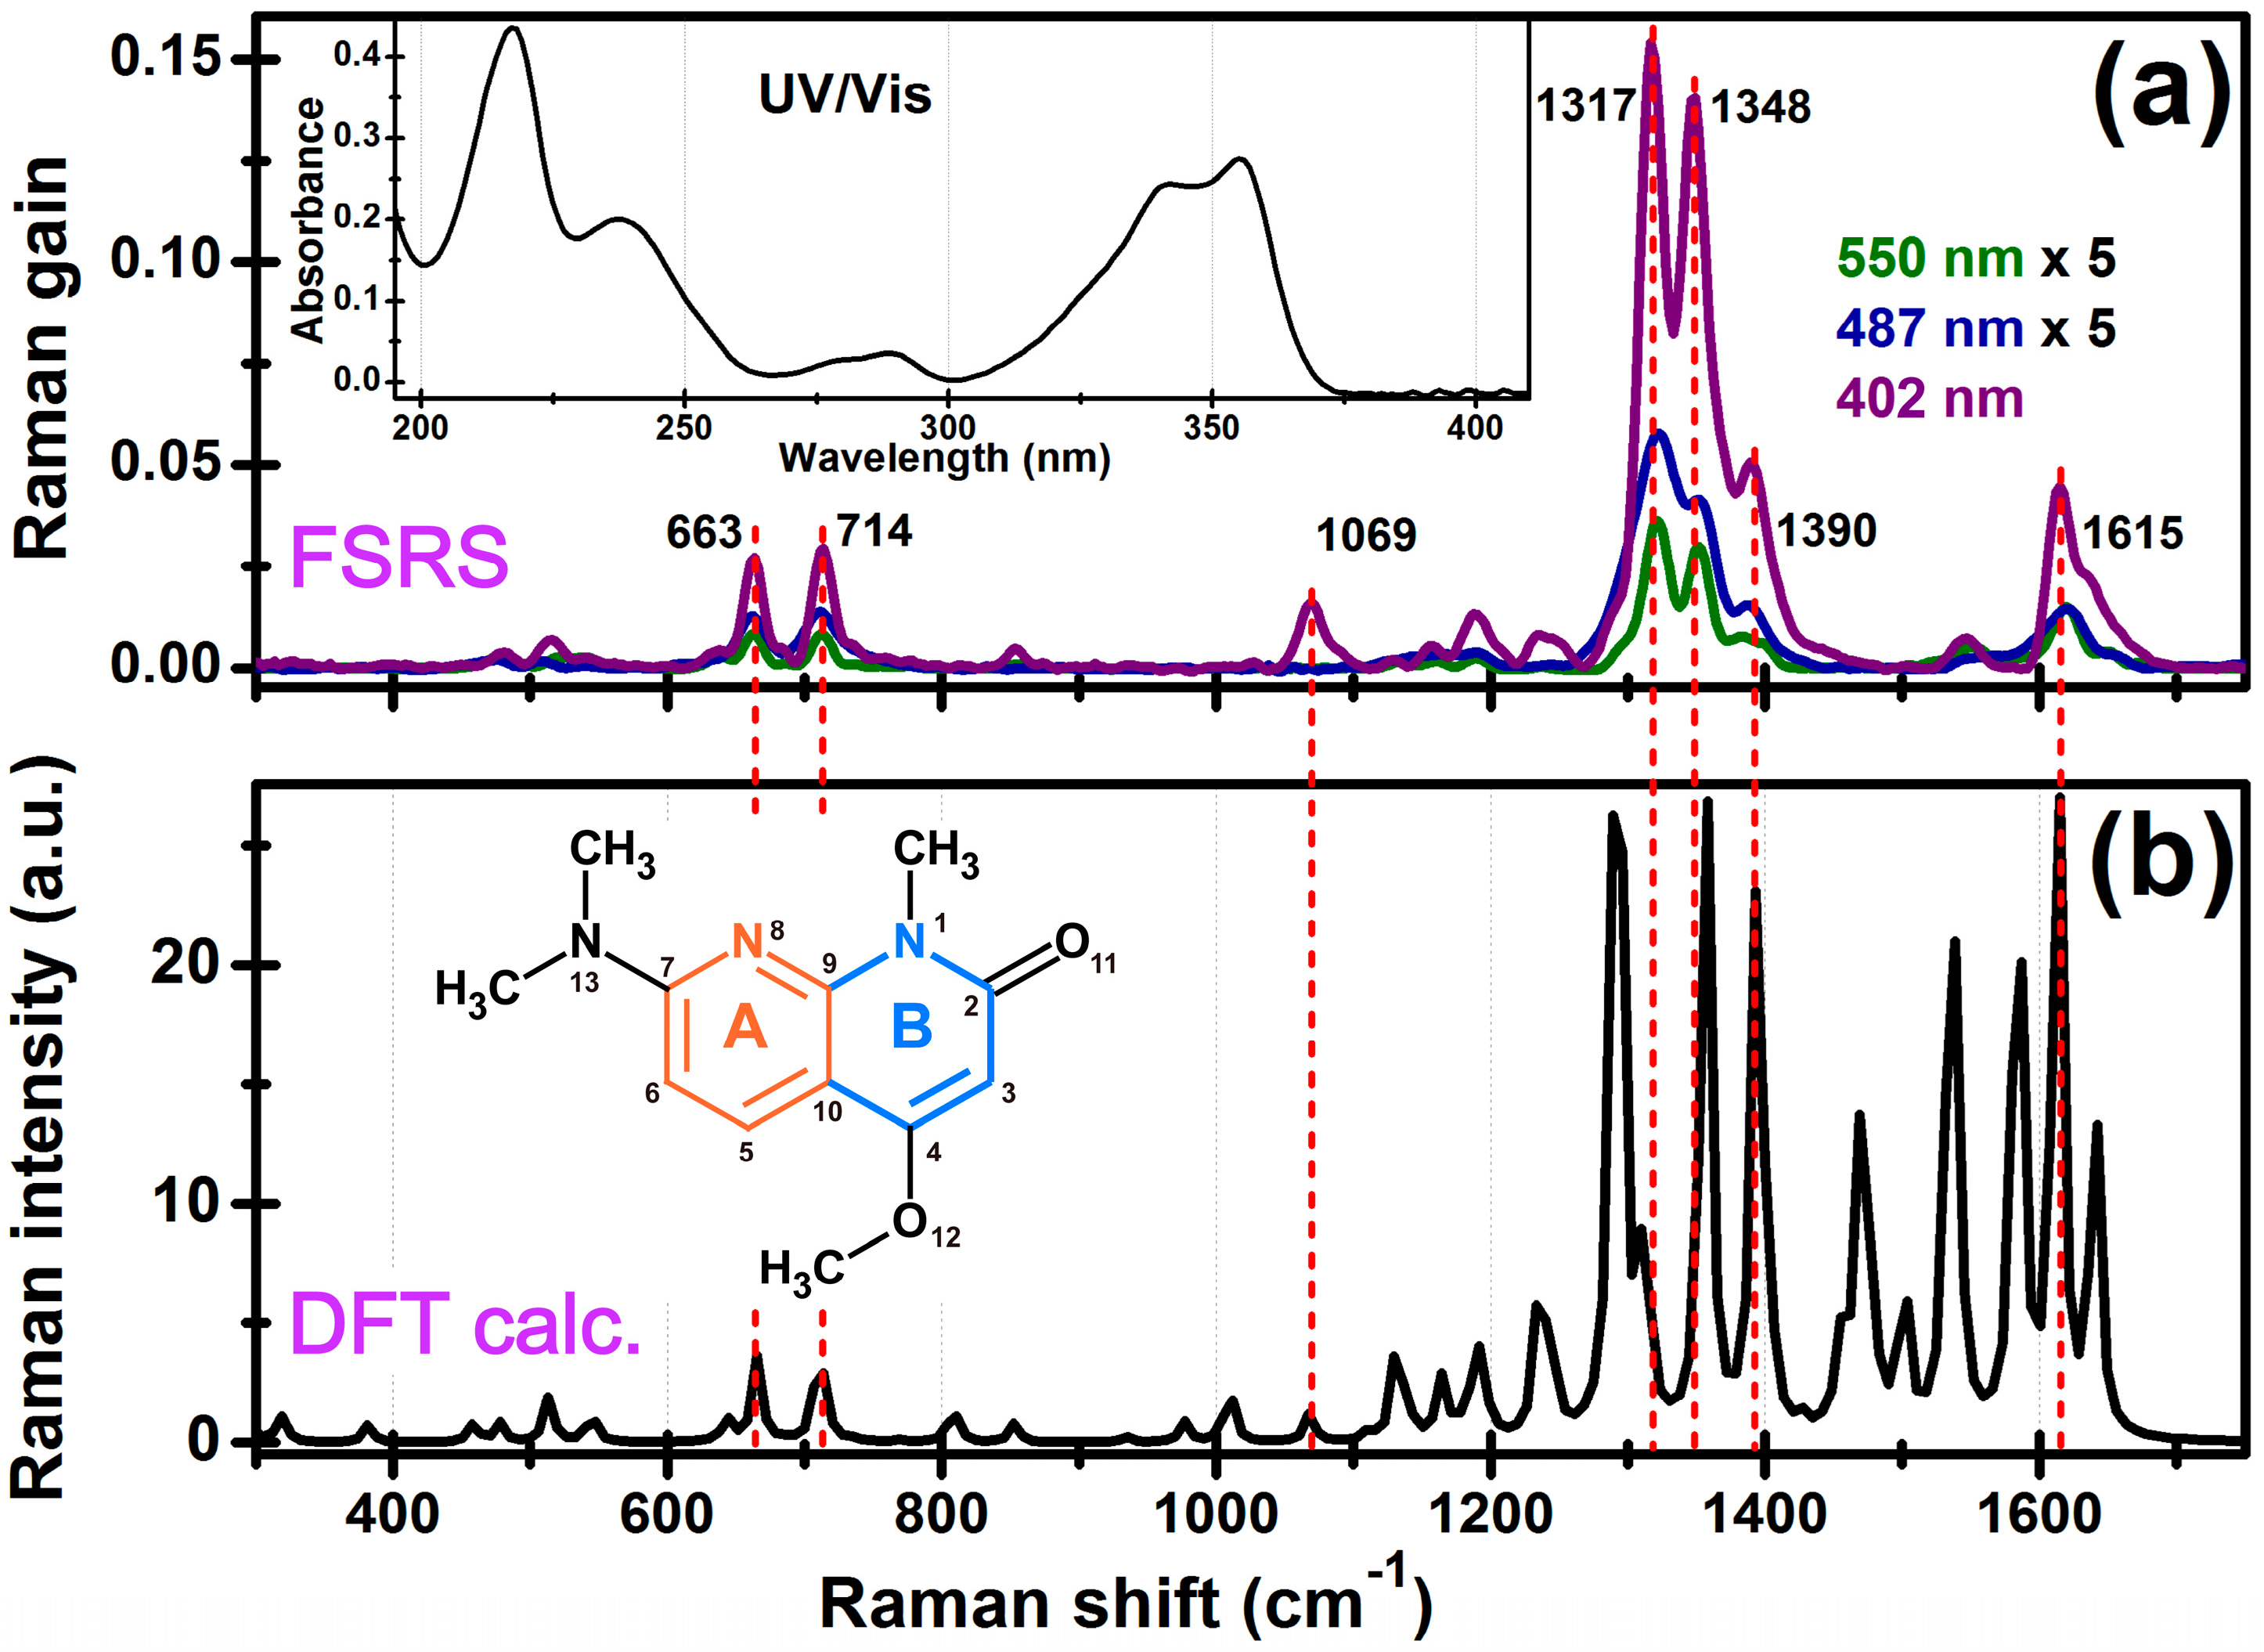
3.2. Ground-State FSRS of Laser Dye LD390

To demonstrate the feasibility of the aforementioned UV-FSRS setup, we select LD390 as the molecular sample system because this laser dye in methanol strongly absorbs 355 nm light, while the solvent only has two major Raman peaks at ~1033 and 1460 cm–1. To our best knowledge, the standard or spontaneous Raman spectrum of LD390 has not been reported, so the measurement here represents a new spectroscopic characterization of this commercial laser dye molecule and its vibrational motions in solution. After equal amount of solution and solvent data collection, average and subtraction which remove most of the systematic noise and laser fluctuation effect, the pure ground-state Raman spectrum of LD390 is shown in Figure 3a that has a number of prominent peaks between ca. 300–1700 cm–1. These are Stokes Raman spectra because the probe pulse is S–1 on the WL side (Figure 1) and to the red of the pump pulse (Figure 2b). Based on the UV/Vis spectrum in Figure 3a insert, the 402 nm Raman pump represents the closest frequency position to the electronic absorption peak (i.e., 355 nm) among the three Raman pump wavelengths being used, and the pre-resonance enhancement factor reaches >21 at the 1317/1348 cm–1 peak doublet while all the other experimental conditions are unchanged. The observed peak intensity decreases if the Raman pump wavelength is tuned away from the electronic absorption peak position. Notably, minimal interference below 400 cm–1 makes it feasible to study lower frequency regime of the Raman spectrum. This likely arises from good solubility of the dye molecule in methanol and less Raman pump scattering into the Raman probe beampath (i.e., FSRS signal direction) [11,13].
Table 1. Ground-state FSRS vibrational peak frequencies and mode assignments aided by calculations.
S0 calc. a (cm–1)S0 FSRS b (cm–1)Vibrational mode assignment c
665663Ring in-plane asymmetric deformation
711714Ring asymmetric breathing with N1–CH3 stretching
10681069A-ring deformation and H rocking, B-ring small-scale breathing, and N13–(CH3)2 H twisting
13121317N1–C2 stretching with ring asymmetric deformation and ring-H rocking, and (N1)–CH3 methyl group bending
13571348C7–N8 stretching and A-ring H rocking, A-ring in-plane deformation with some C9–C10 stretching
13931390N1–CH3 stretching and methyl group symmetric bending, A-ring in-plane deformation, and ring-H rocking
16131615Ring C=C and C=N stretching, ring-H rocking with C2=O11 stretching
a Vibrational normal mode frequencies are obtained from DFT B3LYP calculations in S0 using 6-311G+(d, p) basis sets for LD390 in methanol with Gaussian 09 program [26]. The scaling factor of 0.99 is used to compare the calculated frequency with experimental result. b The experimentally observed frequencies of the ground-state Raman peaks of 15 mM LD390 in pure methanol using tunable FSRS technology in the UV to visible range. c Vibrational motions are assigned based on DFT calculation results. Only major vibrational modes are listed with the atomic numbering defined in Figure 3b insert.
Figure 3. Ground-state Stokes FSRS of LD390 in methanol. (a) Experimental stimulated Raman spectra in S0 with the Raman pump at 550 nm (green), 487 nm (blue), and 402 nm (violet) and Raman probe to its red side, respectively. The former two spectral traces are enlarged by 5 times for direct comparison with the spectrum collected with 402 nm pump. Prominent vibrational peaks are marked with frequencies labeled in black. The UV/Vis electronic absorption spectrum is shown in the insert. (b) Density functional theory (DFT)-based Gaussian calculated spectrum of LD390 in methanol with a uniform peak width of 8 cm–1 (i.e., default fwhm in the program). The molecular structure of the dye is depicted in the insert with two aromatic rings labeled in A (orange) and B (cyan). The key atomic sites are numbered from 1–13.
Applsci 05 00048 g003
Since the standard Raman spectrum of LD390 is not readily available from literature and it is useful to correlate observed peaks to characteristic nuclear motions, we perform electronic ground-state DFT calculations in Gaussian program [26] to facilitate vibrational normal mode assignment. The overall match between the experimental and calculated spectrum is very good with a frequency scaling factor of 0.99 [37]. The major vibrational modes are listed in Table 1. Notably, the correspondence between the calculated Raman spectrum and the measured one is not exact (Figure 3). This is understandable because the Gaussian DFT calculation concerns an “unrestricted” single molecule in a polarizable continuum to model solvation effects (i.e., we used IEFPCM-methanol, see above). In the real spectroscopic measurement, the ensemble average of solvated dye molecules LD390 in methanol solution is measured and the Raman mode polarizability is intimately determined by the extensive hydrogen (H)-bonding network around the chromophore. For example, the calculated strong modes between ca. 1450–1600 cm–1 (see Figure 3b) become much weaker in the ground-state FSRS spectrum (Figure 3a), suggesting that the corresponding mode polarizability decreases significantly and/or mode frequency shifts as a result of H-bonding matrix. It is also notable that the two strongest peaks observed at ~1317, 1348 cm–1 both consist of C–N stretching and ring-H rocking motions plus ring in-plane deformations on both aromatic rings of the dye molecule. The large change in conjugation and electronic polarizability over the two-ring system leads to the observed strong Raman gain in comparison to other vibrational modes. Moreover, the amplification of the Stokes Raman spectrum primarily applies to the solute signal but not to spectral noise, so the experimental signal-to-noise ratio is greatly enhanced with the ~400 nm Raman pump and should be beneficial to characterize functional materials and molecular systems with intrinsically small electric polarizabilities [20,38].

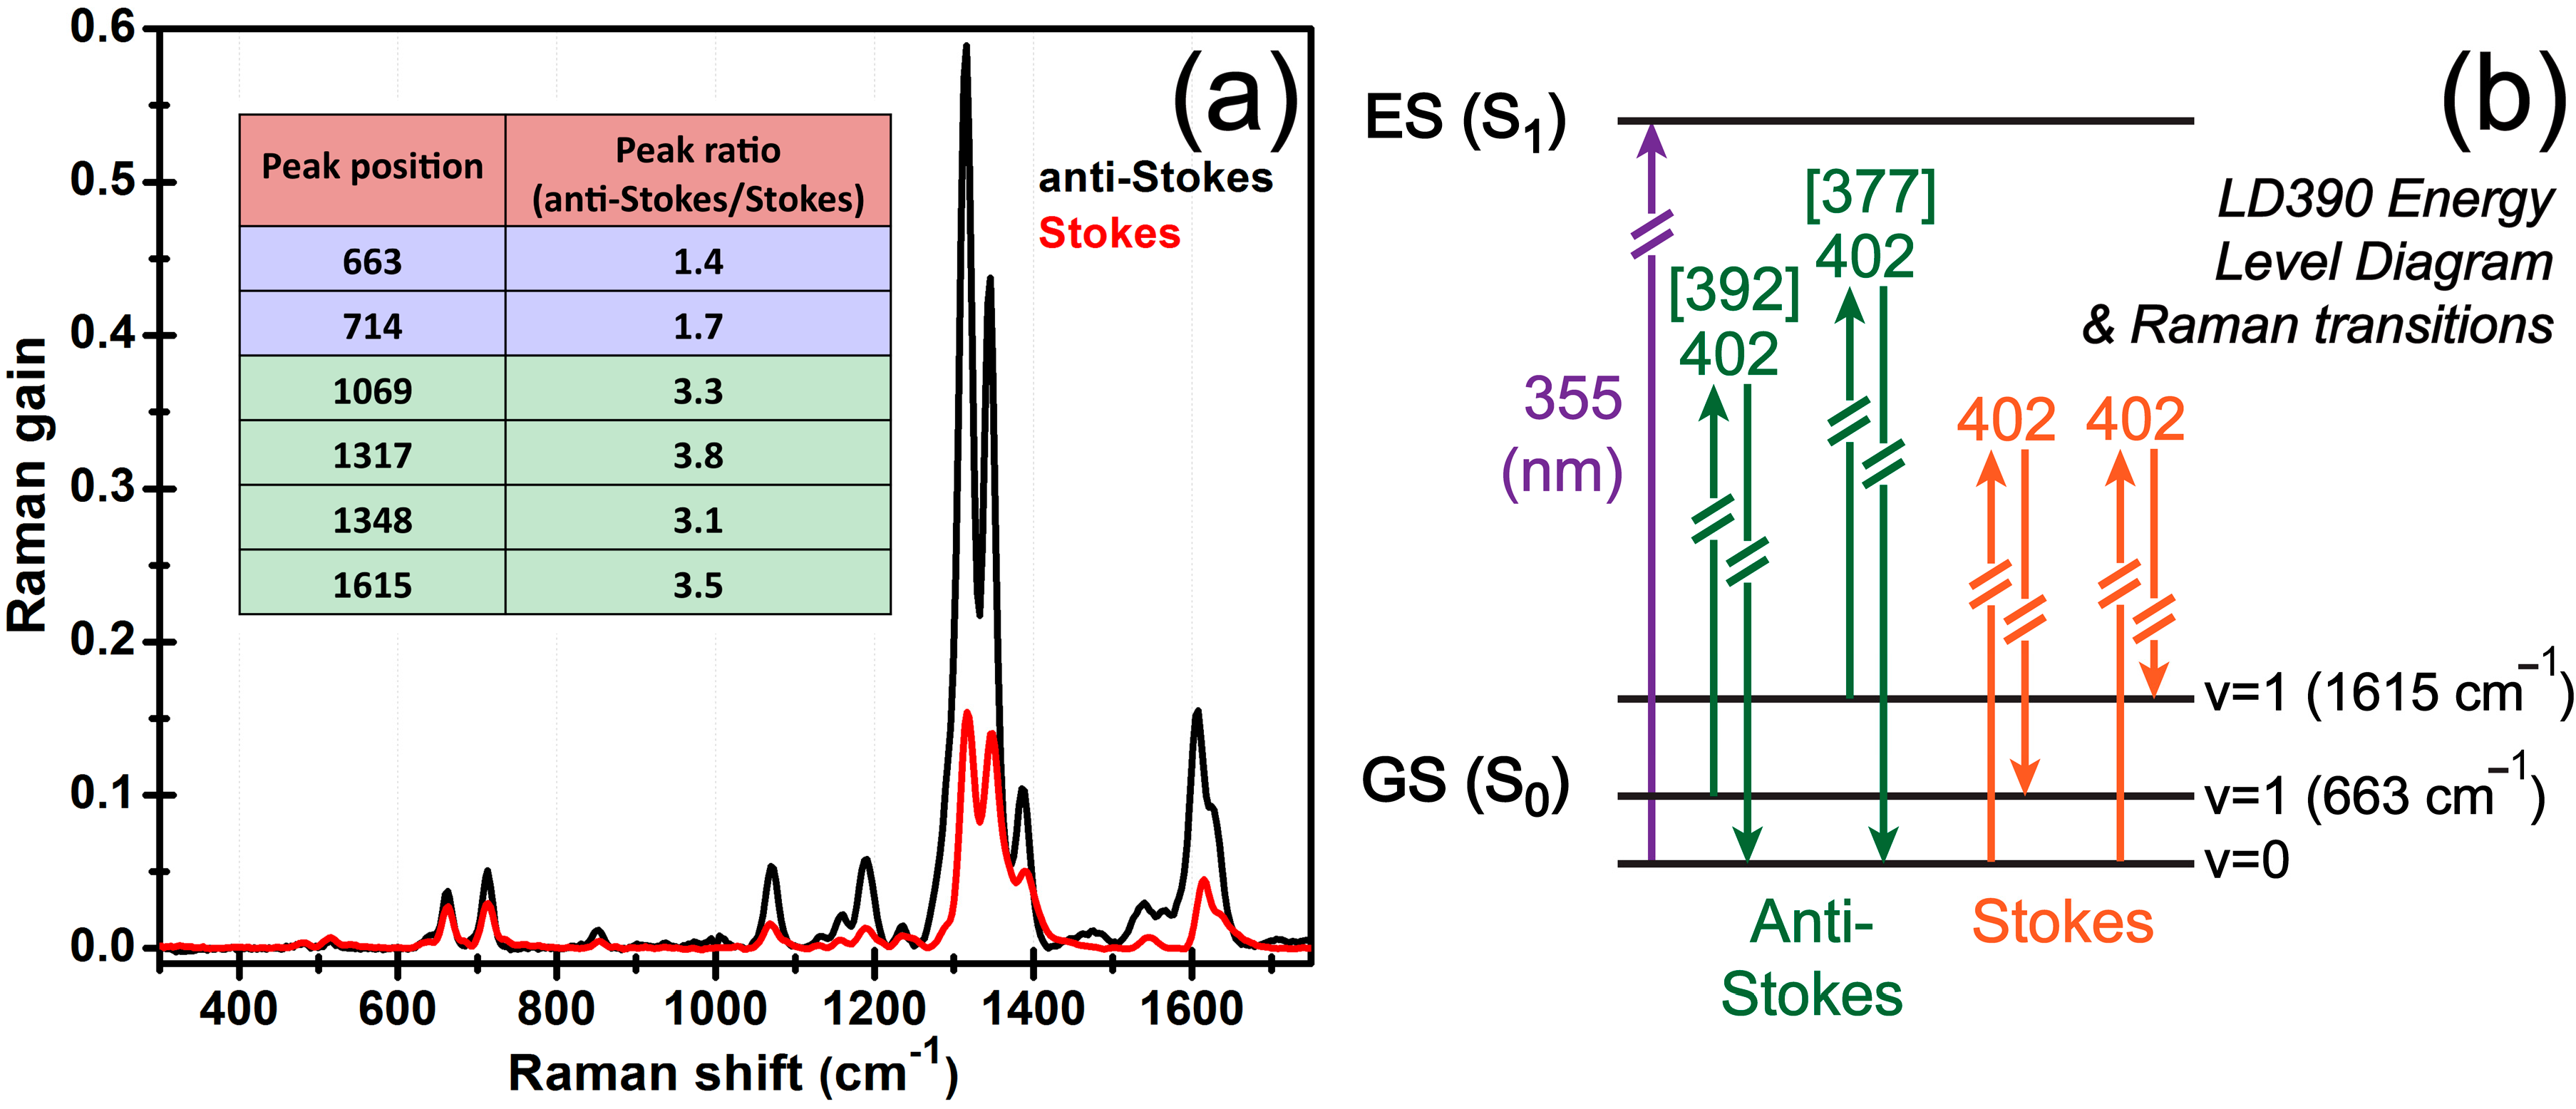
3.3. Comparison between the Stokes and Anti-Stokes FSRS

It is notable that both the Stokes and anti-Stokes Raman spectra can be conveniently captured by FSRS gain/loss measurement depending upon the relative wavelengths of the Raman pump and probe pulses, while the latter can be switched between various BUMA sidebands (e.g., shifting the pinhole position) or tuned within the same sideband (e.g., varying the time delay between FP and WL) with ease (see Figure 1). Based on partition functions in thermodynamics, there is less population on the first excited vibrational state (i.e., quantum number v = 1) than that on the ground state (v = 0). At room temperature the thermal energy 1 kBT amounts to ~200 cm–1 so all the vibrational modes (e.g., >300 cm–1 in Figure 3a) should display weaker anti-Stokes spontaneous Raman peaks than the corresponding Stokes peaks particularly for high-frequency modes. In contrast, FSRS signal strength is normalized by the probe intensity (see Equation (1)) but is typically proportional to Raman pump power [9,39] and to the square of the SRS nonlinear coefficient for either the Stokes or anti-Stokes signal [40,41]. Figure 4a shows that the ground-state FSRS anti-Stokes Raman spectrum we collected using S+1 on the FP side as the probe (i.e., to the blue of the 402 nm pump pulse in Figure 2b) is much stronger than the Stokes spectrum. This unusual, opposite trend indicates that some other factors contribute to the Raman signal strength beyond the Raman pump power and third-order nonlinear polarizabilities [41]. Can it arise from resonance enhancement because this is a stimulated Raman technique [14,42]? If so, how does the Raman pump wavelength compare to the 0–0 vertical transition energy between the electronic ground state and excited state of LD390 in both FSRS measurements?
We list all the anti-Stokes over Stokes peak intensity ratios in Figure 4a insert and it becomes apparent that the two modes below 750 cm–1 have a ratio below 1.8 while the modes above 1000 cm–1 all have a ratio above 3.0. The overall trend is that the Raman peak gets stronger as the vibrational frequency increases. Given that the anti-Stokes process originates from the higher-lying vibrational state (e.g., v = 1) and terminates at the lower-lying vibrational state (e.g., v = 0), this experimental trend can be explained by the principle of resonance Raman enhancement because the 402 nm pump pulse being used still falls short of the LD390 electronic absorption peak of ~355 nm (Figure 4b). As a result, for the anti-Stokes transition, the 663 (1615) cm–1 modes correspond to an “effective” Raman pump wavelength of 392 (377) nm, making the latter Raman mode much stronger because a 377 nm pump is in closer proximity to the 355 nm electronic gap than a 392 nm pump. This reasoning is further corroborated by experimental data in Figure 3a, and paves the way to enhance higher-frequency Raman modes regardless of their intrinsic electronic polarizability. For the Stokes spectrum that starts from the ground state and ends on the v = 1 state in S0, the vibrational transition frequency does not affect the energy relation between the 402 nm Raman pump and the 355 nm electronic energy gap (i.e., no addition of the vibrational frequency can occur to bring the 402 nm Raman pump closer to the solute S1 state, see Figure 4b), hence the intensity ratio between Raman peaks is mostly determined by the mode-dependent polarizability [13,43].
Figure 4. (a) Comparison between the Stokes (red) and anti-Stokes (black) ground-state FSRS data for LD390 in methanol solution. The first-order UV-BUMA sideband S+1/S–1 on the fundamental pulse (FP)/white light (WL) side acts as the Raman probe for anti-Stokes/Stokes FSRS with the 402 nm Raman pump pulse, respectively. The frequency axes are calibrated and for direct spectral comparison, the anti-Stokes Raman shift axis as well as the Raman peak intensities are multiplied by –1. The insert tabulates the observed peak intensity ratios of several major vibrational modes between 600–1700 cm–1. (b) The spectroscopic origin of the observed Raman intensity ratios can be understood by the molecular energy level diagram of LD390. Two characteristic vibrational modes are shown (vibrational quantum number v = 1) with the relative energy differences between various Raman transition configurations depicted by colored vertical arrowed lines. The numbers in brackets represent effective Raman pump wavelengths in nm unit (see Section 3.3.).
Applsci 05 00048 g004

4. Conclusions

In summary, we have developed a unique UV-FSRS setup with a home-built second harmonic bandwidth compressor output (~400 nm center wavelength, 1.5 ps fwhm) as the Raman pump and various broadband up-converted multicolor array (BUMA) sideband laser pulses (ca. 360—460 nm, fs) as the Raman probe to obtain the stimulated Raman spectrum. The BUMA signals in this work arise from SFG/SHG-based cascaded four-wave mixing processes in a thin BBO crystal. Two other Raman pump wavelengths are achieved using a tunable FSRS setup in the visible range and the resultant Stokes spectrum of 15 mM LD390 in methanol is >21 times weaker due to larger mismatch between the Raman pump wavelength and the electronic absorption peak frequency of the laser dye. This manifests the advantage of using tunable ps pulses to study molecules with different absorption profiles over a wide spectral range. The Raman spectrum of LD390 is collected over a ~1400 cm–1 detection window for the first time with vibrational mode assignments aided by Gaussian DFT calculations. Using a ~400 nm ps Raman pump, the anti-Stokes Raman spectrum turns out to be much stronger than the Stokes spectrum mainly due to pre-resonance enhancement involving the vibrational energy gap in S0, which is confirmed by the relative intensity ratio change between the low- and high-frequency vibrational modes.
The versatile and compact approach of generating tunable probe pulses in the UV should make the FSRS technology more accessible to many laboratories for elucidation of molecular conformational dynamics in the electronic ground state, as well as excited state upon incorporation of a preceding fs photoexcitation pulse [10,11,13]. This methodology also paves the way to harness the broadband tunability of multi-color laser sidebands to study molecules that primarily absorb in the UV which include metal-organic complexes such as triphenylbismuth in methanol solution and biomolecules such as DNA and tyrosine derivatives in water. Related studies are currently underway.

Acknowledgments

This project is supported by the Oregon State University Faculty Startup Research Grant and Research Equipment Reserve Fund (to C.F.) and the National Science Foundation (NSF) CAREER award (grant number CHE-1455353, to C.F. since Feb. 2015). We thank Joseph Nibler for the laser dye sample. We also acknowledge graduate research assistantship (to L.Z.) from the NSF Center for Sustainable Materials Chemistry (grant number CHE-1102637).

Author Contributions

C.F. designed and supervised research; L.Z., W.L., and C.F. contributed new analytic tools; L.Z. and W.L. performed research; L.Z., Y.W., and C.F. analyzed data; and C.F. wrote the paper with discussions from all the authors.

Conflicts of Interest

The authors declare no conflict of interest.

References

  1. Zewail, A.H. Femtochemistry: Ultrafast Dynamics of the Chemical Bond; World Scientific: Singapore, 1994. [Google Scholar]
  2. Hochstrasser, R.M. Two-dimensional spectroscopy at infrared and optical frequencies. Proc. Natl. Acad. Sci. USA 2007, 104, 14190–14196. [Google Scholar] [CrossRef] [PubMed]
  3. Zheng, J.; Kwak, K.; Asbury, J.; Chen, X.; Piletic, I.R.; Fayer, M.D. Ultrafast dynamics of solute-solvent complexation observed at thermal equilibrium in real time. Science 2005, 309, 1338–1343. [Google Scholar] [CrossRef] [PubMed]
  4. Fang, C.; Senes, A.; Cristian, L.; DeGrado, W.F.; Hochstrasser, R.M. Amide vibrations are delocalized across the hydrophobic interface of a transmembrane helix dimer. Proc. Natl. Acad. Sci. USA 2006, 103, 16740–16745. [Google Scholar] [CrossRef] [PubMed]
  5. Engel, G.S.; Calhoun, T.R.; Read, E.L.; Ahn, T.-K.; Mancal, T.; Cheng, Y.-C.; Blankenship, R.E.; Fleming, G.R. Evidence for wavelike energy transfer through quantum coherence in photosynthetic systems. Nature 2007, 446, 782–786. [Google Scholar] [CrossRef] [PubMed]
  6. Fang, C.; Bauman, J.D.; Das, K.; Remorino, A.; Arnold, E.; Hochstrasser, R.M. Two-dimensional infrared spectra reveal relaxation of the nonnucleoside inhibitor TMC278 complexed with the HIV-1 reverse transcriptase. Proc. Natl. Acad. Sci. USA 2008, 105, 1472–1477. [Google Scholar] [CrossRef] [PubMed]
  7. Fang, C.; Frontiera, R.R.; Tran, R.; Mathies, R.A. Mapping GFP structure evolution during proton transfer with femtosecond Raman spectroscopy. Nature 2009, 462, 200–204. [Google Scholar] [CrossRef] [PubMed]
  8. Yoshizawa, M.; Kurosawa, M. Femtosecond time-resolved Raman spectroscopy using stimulated Raman scattering. Phys. Rev. A 1999, 61, 013808. [Google Scholar] [CrossRef]
  9. McCamant, D.W.; Kukura, P.; Yoon, S.; Mathies, R.A. Femtosecond broadband stimulated Raman spectroscopy: Apparatus and methods. Rev. Sci. Instrum. 2004, 75, 4971–4980. [Google Scholar] [CrossRef] [PubMed]
  10. Frontiera, R.R.; Fang, C.; Dasgupta, J.; Mathies, R.A. Probing structural evolution along multidimensional reaction coordinates with femtosecond stimulated Raman spectroscopy. Phys. Chem. Chem. Phys. 2012, 14, 405–414. [Google Scholar] [CrossRef] [PubMed] [Green Version]
  11. Liu, W.; Han, F.; Smith, C.; Fang, C. Ultrafast conformational dynamics of pyranine during excited state proton transfer in aqueous solution revealed by femtosecond stimulated Raman spectroscopy. J. Phys. Chem. B 2012, 116, 10535–10550. [Google Scholar] [CrossRef] [PubMed]
  12. Dasgupta, J.; Frontiera, R.R.; Fang, C.; Mathies, R.A. Femtosecond stimulated Raman spectroscopy. In Encyclopedia of Biophysics; Roberts, G.C.K., Ed.; Springer: Berlin, Germany, 2013; pp. 745–759. [Google Scholar]
  13. Han, F.; Liu, W.; Fang, C. Excited-state proton transfer of photoexcited pyranine in water observed by femtosecond stimulated Raman spectroscopy. Chem. Phys. 2013, 422, 204–219. [Google Scholar] [CrossRef]
  14. Myers, A.B.; Mathies, R.A. Resonance Raman intensities: A probe of excited-state structure and dynamics. In Biological Applications of Raman Spectroscopy; Spiro, T.G., Ed.; John Wiley & Sons, Inc.: New York, NY, USA, 1987; Volume 2, pp. 1–58. [Google Scholar]
  15. Liu, W.; Zhu, L.; Wang, L.; Fang, C. Cascaded four-wave mixing for broadband tunable laser sideband generation. Opt. Lett. 2013, 38, 1772–1774. [Google Scholar] [CrossRef] [PubMed]
  16. Zhu, L.; Liu, W.; Fang, C. Tunable sideband laser from cascaded four-wave mixing in thin glass for ultra-broadband femtosecond stimulated Raman spectroscopy. Appl. Phys. Lett. 2013, 103, 061110. [Google Scholar]
  17. Liu, W.; Zhu, L.; Fang, C. Observation of sum-frequency-generation-induced cascaded four-wave mixing using two crossing femtosecond laser pulses in a 0.1 mm beta-barium-borate crystal. Opt. Lett. 2012, 37, 3783–3785. [Google Scholar]
  18. Zhu, L.; Liu, W.; Wang, L.; Fang, C. Parametric amplification-assisted cascaded four-wave mixing for ultrabroad laser sideband generation in a thin transparent medium. Laser Phys. Lett. 2014, 11, 075301. [Google Scholar] [CrossRef]
  19. Laimgruber, S.; Schachenmayr, H.; Schmidt, B.; Zinth, W.; Gilch, P. A femtosecond stimulated Raman spectrograph for the near ultraviolet. Appl. Phys. B 2006, 85, 557–564. [Google Scholar] [CrossRef]
  20. Zhu, L.; Liu, W.; Fang, C. A versatile femtosecond stimulated Raman spectroscopy setup with tunable pulses in the visible to near infrared. Appl. Phys. Lett. 2014, 105, 041106. [Google Scholar]
  21. Raoult, F.; Boscheron, A.C.L.; Husson, D.; Sauteret, C.; Modena, A.; Malka, V.; Dorchies, F.; Migus, A. Efficient generation of narrow-bandwidth picosecond pulses by frequency doubling of femtosecond chirped pulses. Opt. Lett. 1998, 23, 1117–1119. [Google Scholar] [CrossRef] [PubMed]
  22. Crespo, H.; Mendonca, J.T.; Dos Santos, A. Cascaded highly nondegenerate four-wave-mixing phenomenon in transparent isotropic condensed media. Opt. Lett. 2000, 25, 829–831. [Google Scholar] [CrossRef] [PubMed]
  23. Liu, J.; Kobayashi, T. Cascaded four-wave mixing and multicolored arrays generation in a sapphire plate by using two crossing beams of femtosecond laser. Opt. Express 2008, 16, 22119–22125. [Google Scholar] [CrossRef] [PubMed]
  24. Weigand, R.; Mendonca, J.T.; Crespo, H.M. Cascaded nondegenerate four-wave-mixing technique for high-power single-cycle pulse synthesis in the visible and ultraviolet ranges. Phys. Rev. A 2009, 79, 063838. [Google Scholar] [CrossRef]
  25. Shitamichi, O.; Kida, Y.; Imasaka, T. Chirped-pulse four-wave Raman mixing in molecular hydrogen. Appl. Phys. B 2014, 117, 723–730. [Google Scholar] [CrossRef]
  26. Frisch, M.J.; Trucks, G.W.; Schlegel, H.B.; Scuseria, G.E.; Robb, M.A.; Cheeseman, J.R.; Scalmani, G.; Barone, V.; Mennucci, B.; Petersson, G.A.; et al. Gaussian 09; Revision B.1; Gaussian, Inc.: Wallingford, CT, USA, 2009. [Google Scholar]
  27. Kukura, P.; McCamant, D.W.; Yoon, S.; Wandschneider, D.B.; Mathies, R.A. Structural observation of the primary isomerization in vision with femtosecond-stimulated Raman. Science 2005, 310, 1006–1009. [Google Scholar] [CrossRef] [PubMed]
  28. Shim, S.; Dasgupta, J.; Mathies, R.A. Femtosecond time-resolved stimulated Raman reveals the birth of bacteriorhodopsin’s J and K intermediates. J. Am. Chem. Soc. 2009, 131, 7592–7597. [Google Scholar] [CrossRef] [PubMed]
  29. Dasgupta, J.; Frontiera, R.R.; Taylor, K.C.; Lagarias, J.C.; Mathies, R.A. Ultrafast excited-state isomerization in phytochrome revealed by femtosecond stimulated Raman spectroscopy. Proc. Natl. Acad. Sci. USA 2009, 106, 1784–1789. [Google Scholar] [CrossRef] [PubMed]
  30. Frontiera, R.R.; Dasgupta, J.; Mathies, R.A. Probing interfacial electron transfer in Coumarin 343 sensitized TiO2 nanoparticles with femtosecond stimulated Raman. J. Am. Chem. Soc. 2009, 131, 15630–15632. [Google Scholar] [CrossRef] [PubMed]
  31. Smeigh, A.L.; Creelman, M.; Mathies, R.A.; McCusker, J.K. Femtosecond time-resolved optical and Raman spectroscopy of photoinduced spin crossover: Temporal resolution of low-to-high spin optical switching. J. Am. Chem. Soc. 2008, 130, 14105–14107. [Google Scholar] [CrossRef] [PubMed]
  32. Kuramochi, H.; Takeuchi, S.; Tahara, T. Ultrafast structural evolution of photoactive yellow protein chromophore revealed by ultraviolet resonance femtosecond stimulated Raman spectroscopy. J. Phys. Chem. Lett. 2012, 3, 2025–2029. [Google Scholar] [CrossRef]
  33. Creelman, M.; Kumauchi, M.; Hoff, W.D.; Mathies, R.A. Chromophore dynamics in the PYP photocycle from femtosecond stimulated Raman spectroscopy. J. Phys. Chem. B 2014, 118, 659–667. [Google Scholar] [CrossRef] [PubMed]
  34. Oscar, B.G.; Liu, W.; Zhao, Y.; Tang, L.; Wang, Y.; Campbell, R.E.; Fang, C. Excited-state structural dynamics of a dual-emission calmodulin-green fluorescent protein sensor for calcium ion imaging. Proc. Natl. Acad. Sci. USA 2014, 111, 10191–10196. [Google Scholar] [CrossRef] [PubMed]
  35. Tang, L.; Liu, W.; Wang, Y.; Zhao, Y.; Oscar, B.G.; Campbell, R.E.; Fang, C. Unraveling ultrafast photoinduced proton transfer dynamics in a fluorescent protein biosensor for Ca2+ imaging. Chem. Eur. J. 2015, 21, 6481–6490. [Google Scholar] [CrossRef] [PubMed]
  36. Wang, Y.; Tang, L.; Liu, W.; Zhao, Y.; Oscar, B.G.; Campbell, R.E.; Fang, C. Excited state structural events of a dual-emission fluorescent protein biosensor for Ca2+ imaging studied by femtosecond stimulated Raman spectroscopy. J. Phys. Chem. B 2015, 119, 2204–2218. [Google Scholar] [CrossRef] [PubMed]
  37. Tozzini, V.; Nifosì, R. Ab initio molecular dynamics of the green fluorescent protein (GFP) chromophore:  An insight into the photoinduced dynamics of green fluorescent proteins. J. Phys. Chem. B 2001, 105, 5797–5803. [Google Scholar] [CrossRef]
  38. Wang, W.; Liu, W.; Chang, I.-Y.; Wills, L.A.; Zakharov, L.N.; Boettcher, S.W.; Cheong, P.H.-Y.; Fang, C.; Keszler, D.A. Electrolytic synthesis of aqueous aluminum nanoclusters and in situ characterization by femtosecond Raman spectroscopy & computations. Proc. Natl. Acad. Sci. USA 2013, 110, 18397–18401. [Google Scholar] [CrossRef] [PubMed]
  39. Frontiera, R.R.; Shim, S.; Mathies, R.A. Origin of negative and dispersive features in anti-Stokes and resonance femtosecond stimulated Raman spectroscopy. J. Chem. Phys. 2008, 129, 064507. [Google Scholar] [CrossRef] [PubMed]
  40. Lee, S.Y.; Heller, E.J. Time-dependent theory of Raman scattering. J. Chem. Phys. 1979, 71, 4777–4788. [Google Scholar] [CrossRef]
  41. Lee, S.-Y.; Zhang, D.; McCamant, D.W.; Kukura, P.; Mathies, R.A. Theory of femtosecond stimulated Raman spectroscopy. J. Chem. Phys. 2004, 121, 3632–3642. [Google Scholar] [CrossRef] [PubMed]
  42. Shim, S.; Stuart, C.M.; Mathies, R.A. Resonance Raman cross-sections and vibronic analysis of Rhodamine 6G from broadband stimulated Raman spectroscopy. ChemPhysChem 2008, 9, 697–699. [Google Scholar] [CrossRef] [PubMed]
  43. McHale, J.L. Molecular Spectroscopy; Prentice-Hall: Upper Saddle River, NJ, USA, 1999. [Google Scholar]

