
Thermal Image and Inverter Data Analysis for Fault Detection and Diagnosis of PV Systems
1
Institute of Natural and Applied Sciences, Department of Mechatronics Engineering, Dokuz Eylul University, 35390 İzmir, Turkey
2
Faculty of Engineering, Department of Mechanical Engineering, Dokuz Eylul University, 35390 İzmir, Turkey
3
ZENA Energy, 34734 İstanbul, Turkey
*
Author to whom correspondence should be addressed.
Appl. Sci. 2024, 14(9), 3671; https://doi.org/10.3390/app14093671
Submission received: 27 March 2024
/
Revised: 20 April 2024
/
Accepted: 23 April 2024
/
Published: 25 April 2024
(This article belongs to the Topic Advances in Renewable Energy Technologies and Systems Solutions)
Abstract
:The world’s energy demand is on the rise, leading to an increased focus on renewable energy options due to global warming and rising emissions from fossil fuels. To effectively monitor and maintain these renewable energy systems connected to electrical grids, efficient methods are needed. Early detection of PV faults is vital for enhancing the efficiency, reliability, and safety of PV systems. Thermal imaging emerges as an efficient and effective technique for inspection. On the other hand, evidence indicates that monitoring inverters within a solar energy farm reduces maintenance expenses and boosts production. Optimizing the efficiency of solar energy farms necessitates comprehensive analytics and data on every inverter, encompassing voltage, current, temperature, and power. In this study, our objective was to perform two distinct fault analyses utilizing image processing techniques with thermal images and machine learning techniques using inverter and other physical data. The results show that hotspot and bypass failures on the panels can be detected successfully using these methods.
1. Introduction
The global demand for energy is steadily rising each year, primarily relying on fossil fuels for the majority of energy consumption. Fossil fuels are both limited and contribute to greenhouse gas emissions. In 2022, fossil fuels accounted for 82% of the total primary energy consumption, while hydro and other renewable energy sources made up about 14% (Figure 1) [1]. The burning of oil, natural gas, and coal releases around 35 billion tons of carbon dioxide into the atmosphere annually. To address this issue, it is essential to replace fossil fuels with renewable alternatives [2,3]. In addition, it is stated that the utilization rate of renewable energy sources in the world for 2022 increased by 13%, and the installed PV power capacity increased by 22.2% compared to 2021 [1]. It is an acceptable prediction that this increase will continue in the coming years.
As developing countries continue to industrialize, the need for energy is expected to rise. Hence, numerous nations have made energy conservation and efficiency enhancements central to their strategies for tackling climate change and ensuring energy security, as they have initiated and advocated various measures to achieve these goals [4]. This has led to the installation of more alternative energy units, such as solar fields and wind turbines, resulting in a growing need for economic and efficient maintenance.
Solar photovoltaic (PV) technology is a widely accepted and cost-effective method for generating clean energy by converting sunlight into electricity [5]. It is an environmentally friendly system that operates silently with no moving parts, making it highly reliable and requiring minimal maintenance [6]. It offers a highly modular technology that can be manufactured in large plants or deployed in small quantities for various applications.
The most common figure handed out for the lifespan of solar PV panels is 25–30 years [7,8]. That is, they technically do not have an expiration date. But the situation is slightly different from a usage perspective. Various environmental elements like wind, salt, snow, and dust can compromise the efficiency of PV modules, leading to substantial declines in power generation as well as reducing the effective lifespan by almost half the planned time [9]. Some panels can also break due to physical damage from extreme weather conditions and extreme contrasts in temperature. They can also have manufacturing defects, or become damaged beyond repair [10,11]. Additionally, concerns like corrosion and short circuits may arise. They experience a decrease in energy yield due to various factors over time, including single-cell breakdown and inefficiencies in important components like inverters. Furthermore, the potential for a single PV cell to overheat emerges in cases of connector damage or reverse bias effects [12].
With these facts, as the need for solar PV increases, two basic issues become important for the continuity and sustainability of the system: monitoring of the arrays and methods for fault detection and diagnosis.
1.1. Monitoring of the PV Arrays
With the increasing demand for solar energy worldwide, there is an urgent need for advanced monitoring methods. Monitoring involves observing and recording parameters from solar PV power plants in real time. A reliable monitoring technology enhances performance efficiency by providing up-to-date information and implementing preventive measures when flaws are detected. Additionally, this monitoring approach alerts users to unexpected events in the solar PV system [13].
One approach to real-time monitoring is using Internet of Things (IoT) technology. IoT represents a breakthrough in electronics, employing sensor technology connected to the internet either through wired or wireless means. This enables users to access data and control the system remotely from anywhere at any time via the Internet [14]. The IoT technology allows users to monitor the performance of the PV systems in terms of produced power, evaluating the voltage, current, produced energy, ambient and module temperatures, wind velocity, humidity, and irradiance value [15,16].
The primary objective of the monitoring system for the PV power plant is to transmit data reliably, securely, and efficiently. However, various challenges can significantly impact the performance of monitoring technologies in terms of efficiency, security, range, data processing capability, sampling rate, and signal interference. For instance, any disruptions in real-time communication can lead to interruptions in data reception, thereby affecting performance predictions.
To address the above-mentioned challenges, the use of unmanned aerial vehicles (UAVs) and thermography is increasing as an alternative monitoring approach. This tool provides valuable information to maintenance workers, planners, and engineers, enabling timely decision-making. Thermal imaging allows for non-intrusive assessment of the temperature distribution across PV panels, aiding in identifying hotspots and inefficient regions that may impact overall efficiency. Anomalies and defects in PV cells can result in localized heating. It also helps in identifying these irregularities, enabling timely maintenance and repair [17,18]. During manufacturing and installation, thermal imaging can ensure uniform temperature distribution and detect potential defects, contributing to higher-quality PV panels. Continuous thermal monitoring provides insights into panel performance, facilitates predictive maintenance, and reduces downtime.
1.2. Methods for Fault Detection and Classification
Detecting anomalies in PV modules holds paramount importance due to their capacity to induce significant power losses and performance degradation. Predicting equipment faults and failures helps reduce maintenance costs, avoid total failures, and prevent unwanted repair and replacement expenses. Such predictive analytics also safeguard against financial losses, indirect impacts on customer confidence, and the deterioration of a company’s image, ensuring long-term profitability and customer retention.
Broadly, faults within PV systems can be categorized into two primary types: irreparable faults stemming from mechanical or electrical issues like open circuits, short circuits, and PV cell deterioration, and momentary power loss faults attributed to factors like shading, such as cloud-induced shadows [19]. Common permanent defects encountered in PV systems include mismatches, arising from the integration of cells with dissimilar physical traits or operating conditions; cracks, prevalent and varying in formations, directions, and sizes; discolorations caused by internal factors like lower mechanical properties, high temperatures, and humidity; soiling, which pertains to the accumulation of dirt on the surface; delamination of bonds over time; and snail tracks or trails—black or brown lines of discoloration on cell surfaces—emerging after months or years of panel operation [20]. According to the study of Constantin et al., three categories of PV system faults exist: (i) module-related faults, (ii) string- and system-related faults, and (iii) racking and system balance issues [21]. In the case of module faults, they encompass concerns such as cell hotspots, diode malfunctions, fractured or soiled modules, coating, and fogging complications, as well as junction box overheating. For the string and systems faults, there are wiring issues (reversed polarity, frayed cables), charge controller issues, and inverter and fuse failures. On the other hand, Chen et al. [22] stated that typical faults in a PV system include irradiance change, ground faults, line–line faults, arc faults, and so on.
No matter how the faults are classified by researchers and field experts, the important thing is the rapid detection using the monitoring systems and diagnosis and solution of the fault. Among the diverse PV faults, this study focuses on the hotspot phenomenon, recognized as the principal module defect, and bypass diode failure. Therefore, both have garnered considerable attention as a prominent research subject within the photovoltaic systems domain. Hotspots are created mainly because cracked PV cells with broken contacts conduct electric current only on part of their surface area, hence they can be mentioned as localized heat sources that can be present in part of the PV module, leading to locally increased temperature in the solar cells. Dhimish [23,24] highlighted the significance of hotspotting, where a cell or group of cells heats up significantly compared to adjacent solar cells, decreasing the optimum power generated. A solitary fault within a cell holds the potential to propagate neighboring modules, culminating in a complete operational breakdown [25,26].
On the other hand, the purpose of using diodes in photovoltaic panels is to provide unidirectional current flow. Diode failures are mostly caused by incorrect connection and overheating [27]. Xiao et al. [28] emphasized that defective bypass diodes are often the largest factor leading to power loss in solar modules and reported on failure mechanisms by investigating shunted bypass diodes from a rooftop installation.
Over the past decade, various methods have been developed for detecting and diagnosing the above-mentioned faults in PV systems. Amiri et al. made an introduction to different methods including a model-based approach, procedures using current and voltage indicators, a method by setting a power residual threshold in their article [29]. However, it is important to understand that each approach comes with its own advantages and drawbacks.
In addition, in recent years, different artificial intelligence techniques have been accepted as the basic methods for fault detection [30]. Studies in this area mostly include Neural Networks [31], Convolutional Neural Networks [32], Support Vector Machine [33], k-Nearest Neighbor, Decision Tree, and Fuzzy Logic. On the other hand, computer vision applications have an important impact and represent efficient findings for classification of and localizing faults for PV systems, as in other engineering fields, such as the motor system. Long et al. proposed a motor fault diagnosis method based on visual knowledge for improving the feature extraction ability, showing that the limitations of traditional signal analysis have been overcome [34]. In another study aiming to eliminate the limits in existing studies, a continual learning framework was developed to diagnose the electric motor faults. Experimental results showed the effectiveness and superiority of the proposed approach for class-added fault diagnosis [35].
We organized our paper as follows. Firstly, in Section 2, we provide brief information about the status of the PV generation in the world and the significance of the maintenance issue. Also, thermal imaginary is introduced. Section 3 is the main part of the paper and describes methods for PV placement, thermal imaging, image processing, and fault detection and classification. In this section, the results of fault detection and classification using inverter data are also given and discussed. Section 4 constitutes the closing part of the study, and in this chapter, information about the study is given and the main findings obtained are stated.
2. Background and Motivation
Solar PV generation increased by a record 270 TWh (up to 26%) in 2022, reaching almost 1300 TWh. It demonstrated the largest absolute generation growth of all renewable technologies in 2022, surpassing wind for the first time in history. This generation growth rate matches the level envisaged from 2023 to 2030 in the Net Zero Emissions by 2050 Scenario [13].
The worldwide growth of photovoltaics is extremely dynamic and varies strongly by country. In 2022, the leading country for solar power was China, with about 393 GWp, accounting for nearly two-fifths of the total global installed solar capacity, as the total global solar capacity reached 1 TWh. As shown in Figure 2, Türkiye ranks 14th.
In 2022, fossil fuels, notably natural gas, continued to dominate Türkiye’s energy generation landscape. Additionally, hydroelectric power plants, categorized as renewable energy sources, significantly contribute to electricity generation. Over the past two decades, there has been a steady increase in both overall electricity generation and the capacity for renewable energy generation including solar energy as well. In other words, solar energy is a very new energy source for our country, and it also leads to the development of technology and ease of use in this field. One of the most important eases of use in question is the locally and nationally developed systems for maintenance and repair.
Today, due to the growing capacity of PV systems, there has been an increase in the power conversion units, monitoring systems, communication equipment, and protection devices being added to PV installations [37]. As a result, massive PV data, both instantaneous and historical, become available. Various PV data are available from PV arrays, PV inverters, and the utility grid. IoT technology has various benefits for PV monitoring, predictive maintenance, and real-time data collection. Reliability and maintenance are just the two downsides that have been stated; there may be other issues as well.
To overcome this and also maintenance challenges, the use of UAVs and thermography is increasing. Thermal imaging allows for non-intrusive assessment of the temperature distribution across PV panels, aiding in identifying hotspots and inefficient regions that may impact overall efficiency. Anomalies and defects in PV cells can result in localized heating. Thermal imaging helps in identifying these irregularities, enabling timely maintenance and repair. During manufacturing and installation, thermal imaging can ensure uniform temperature distribution and detect potential defects, contributing to higher-quality PV panels. Continuous thermal monitoring provides insights into panel performance, facilitating predictive maintenance and reducing downtime. Drones equipped with thermal cameras provide a larger-scale view of PV arrays, enabling efficient inspection and monitoring.
3. Method and Analysis
In PV systems, hotspot faults and bypass diode failures are just two of the many possible fault types. These flaws reduce the PV system’s generated output power and impair system performance. This study will provide a native and national solution for hotspot and bypass diode problems, starting with panel architecture and ending with analysis results. Two distinct verifications will be made using both the images obtained from thermal images with image processing techniques and the numerical data obtained from the real-time monitoring system.
3.1. Thermal Imaging, Panels Settlement, and Fault Detection
In this study, a DJI Matrice 300 drone equipped with a DJI Zenmuse H20 T camera developed by FLIR (Wilsonville, OR, USA) was used to capture the thermal images with 640 × 512 pixel resolution, at a relative flight height of 35 to 65 m. In the study, varied quantities of images were employed for each site, with the quantity of photos differing based on factors like field size and overlay rates. The drone operated at altitudes of either 35 or 65 m, contingent on the field’s features such as slope. The mapping process was facilitated by the utilization of the WebODM 1.9.16 software. Image processing was coded in the Python 3 language using the principal libraries of NumPy, OpenCV, Pillow, and the Detectron 2 package was used for object detection. To conduct an aerial thermal inspection for testing our proposed algorithm, and detect potential faults, the data collected from a total of 10 MWp PV farms in Malatya, Türkiye, will hereinafter be referred to as Site-1.
Panel detection primarily revolves around the task of recognizing rectangular structures. But as mentioned by Diaz et al. [38], accomplishing this task becomes challenging when applied to thermal images. This difficulty arises due to the partial visibility of panel edges, coupled with the interference of irregularities like shadows from weeds, reflections caused by sunlight, and thermal hot spots. These diagnostic challenges are compounded by various other factors, including variations in flight altitudes, shifts in lighting conditions, the presence of structures resembling panels, the existence of energy lines, and the occurrence of lens distortion in images, as shown in Figure 3. All these factors collectively contribute to the complexity of the background against which the panel detection must be performed.
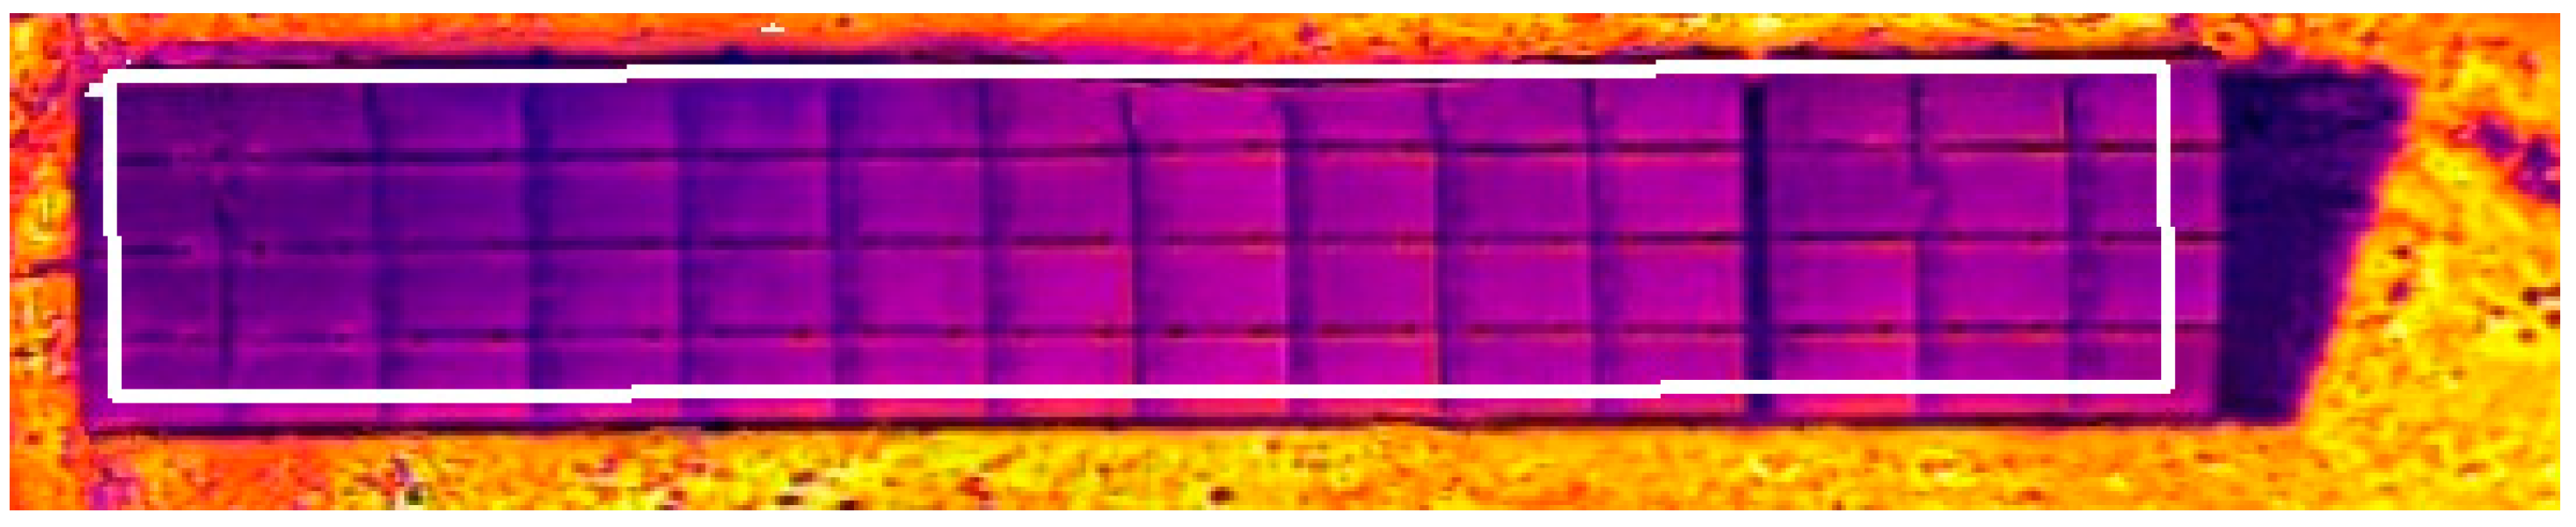
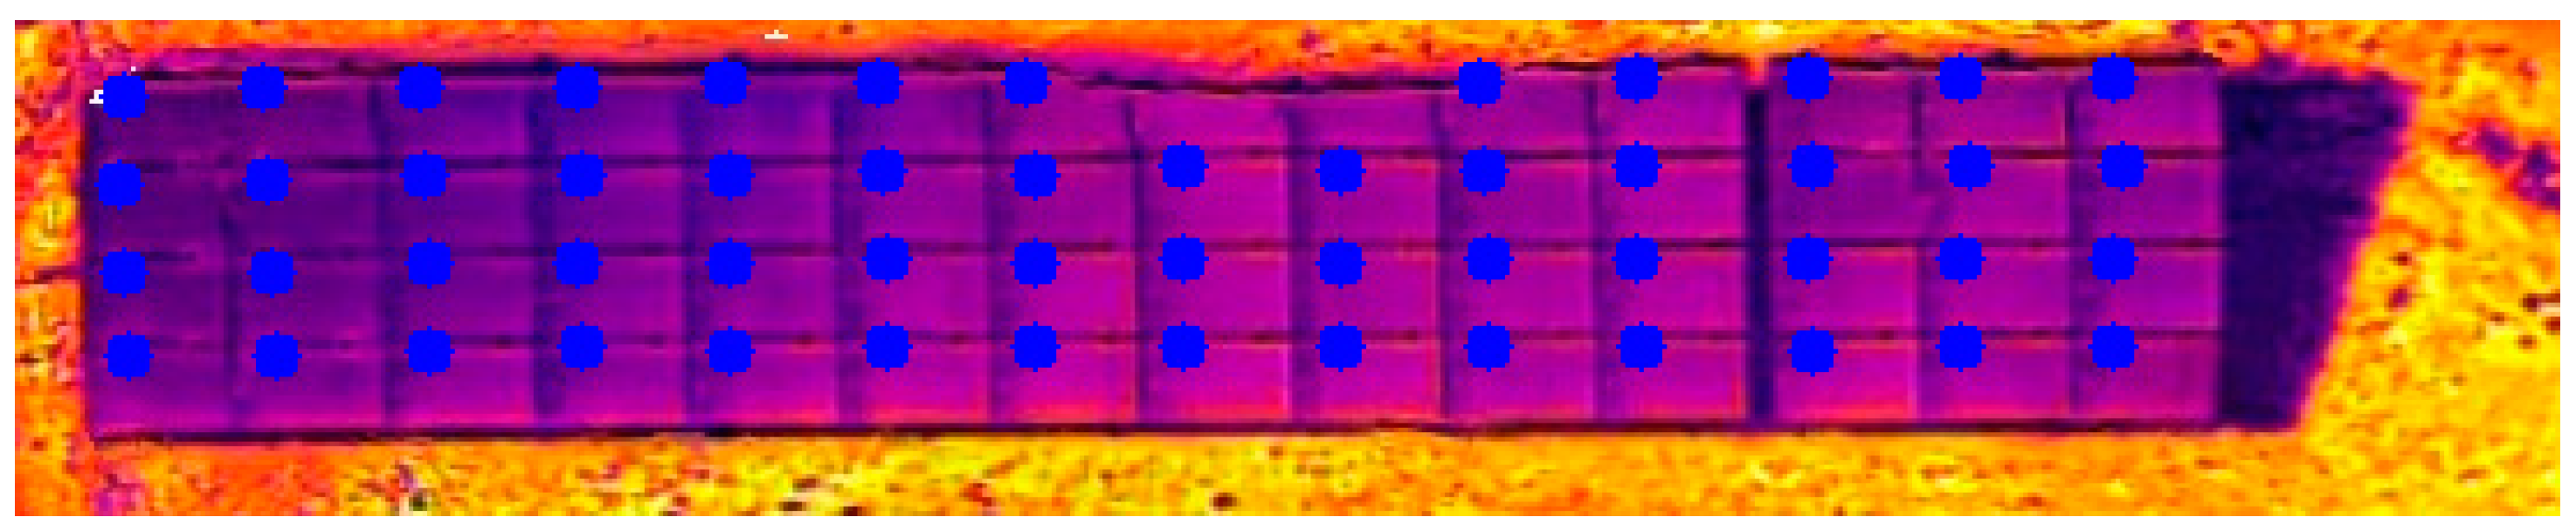
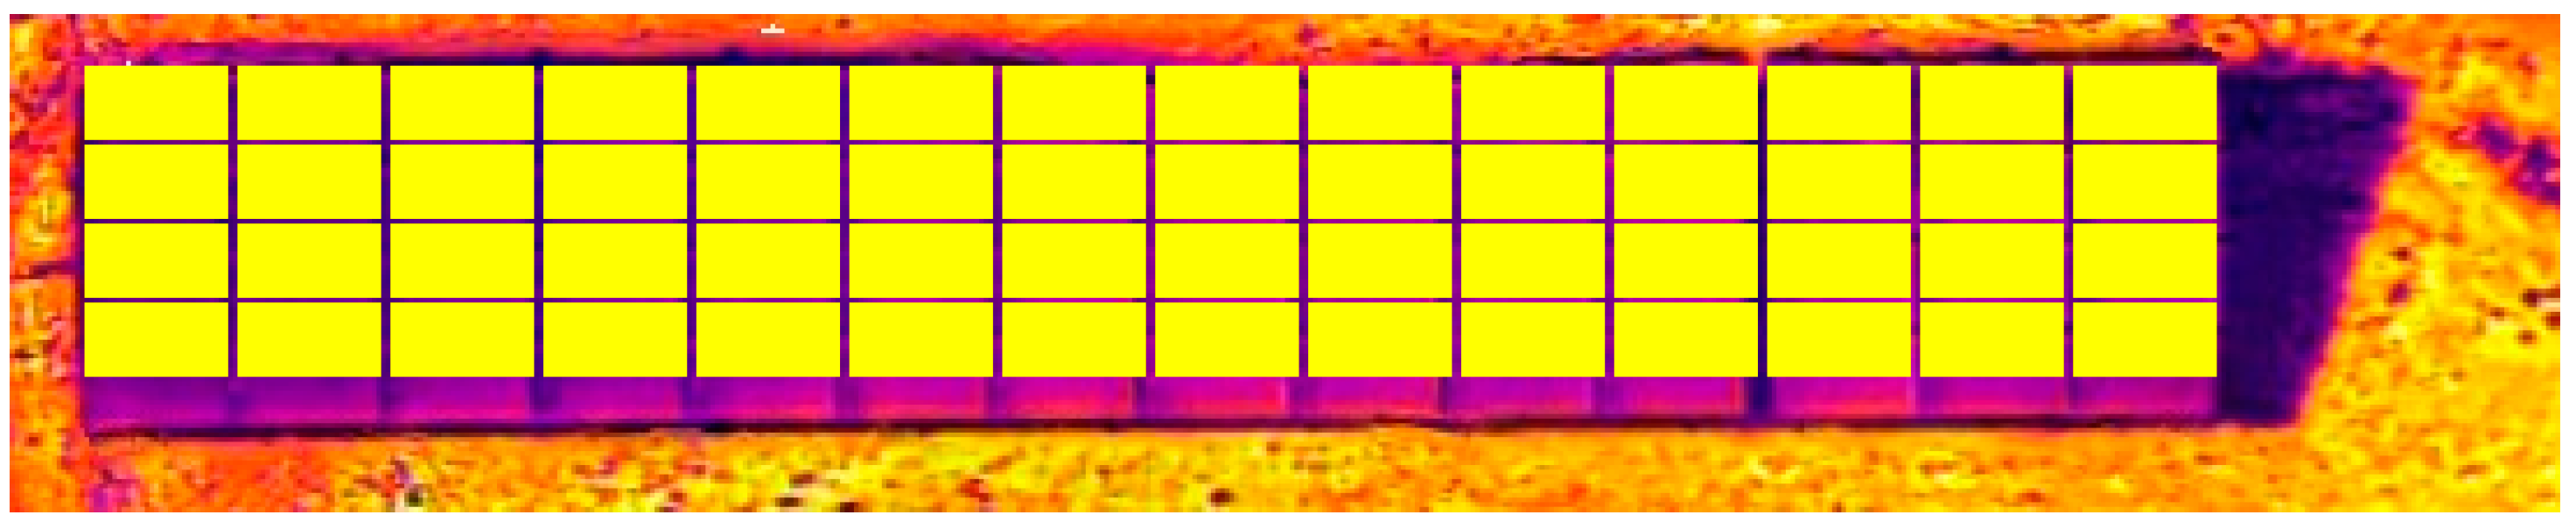
Panel detection is essential for defining the region of interest required in identifying and categorizing anomalies. This is because accurate classification relies on the geometric characteristics within panels or the spaces between them. Rectangular structures are detected and roughly fixed as panels (Figure 4). Since thermal images are raw, that is, under real conditions, they are of poor quality, and therefore, some corners and edges are not fully visible. Therefore, to obtain the exact corner coordinates is needed (Figure 5). In order to attain an accurate estimation, a geometric model for the PV modules is established. The segmented contour is then adjusted to conform to this assumed model, as shown in Figure 6. The resulting rectangular shape possesses distinctive attributes like its longer/shorter edges, center point, and angle. The angle value holds significant importance in this context. It is used to properly find coordinates of each panel. In this rectangular structure, a center point is assigned for each panel with the help of the mask (Figure 7) used from the OpenCV library as in Figure 8. Nevertheless, it is evident that there exists a discrepancy among the designated centers for each panel within the panel block. Despite the accurate count of center points, they fail to accurately represent the actual layout. As can be seen from Figure 9, panel dimensions need to be harmonized with the image. The panel drawing is rearranged to reflect the real situation by using the upper left and lower right corner coordinates of the rectangular structure covering the block and the number of center points assigned to each panel (Figure 10). Hence, the arrangement of the panels is established using thermal images acquired through drone assistance.
After placing the panels on the map, the existing faulty panels are marked. The examination of hotspot and bypass diode failures relies on color identification with the aid of OpenCV. Initially, colors are categorized into distinct color groups, and color histograms are generated for a detailed color analysis. To create this histogram, the images are converted to HSV (Hue, Saturation, Value) color space. The hue component represents the actual color information of the image. A process known as filtering is employed to isolate the HSV format panel images from their consistent background clutter. Through this, a threshold value is determined by examining the output vector of each filter. By comparing these threshold values to the characteristics of each panel, we select the higher value, thereby identifying the defective panels. Furthermore, the coordinate values were calculated to establish the correspondence between the defective panel and its respective string order.
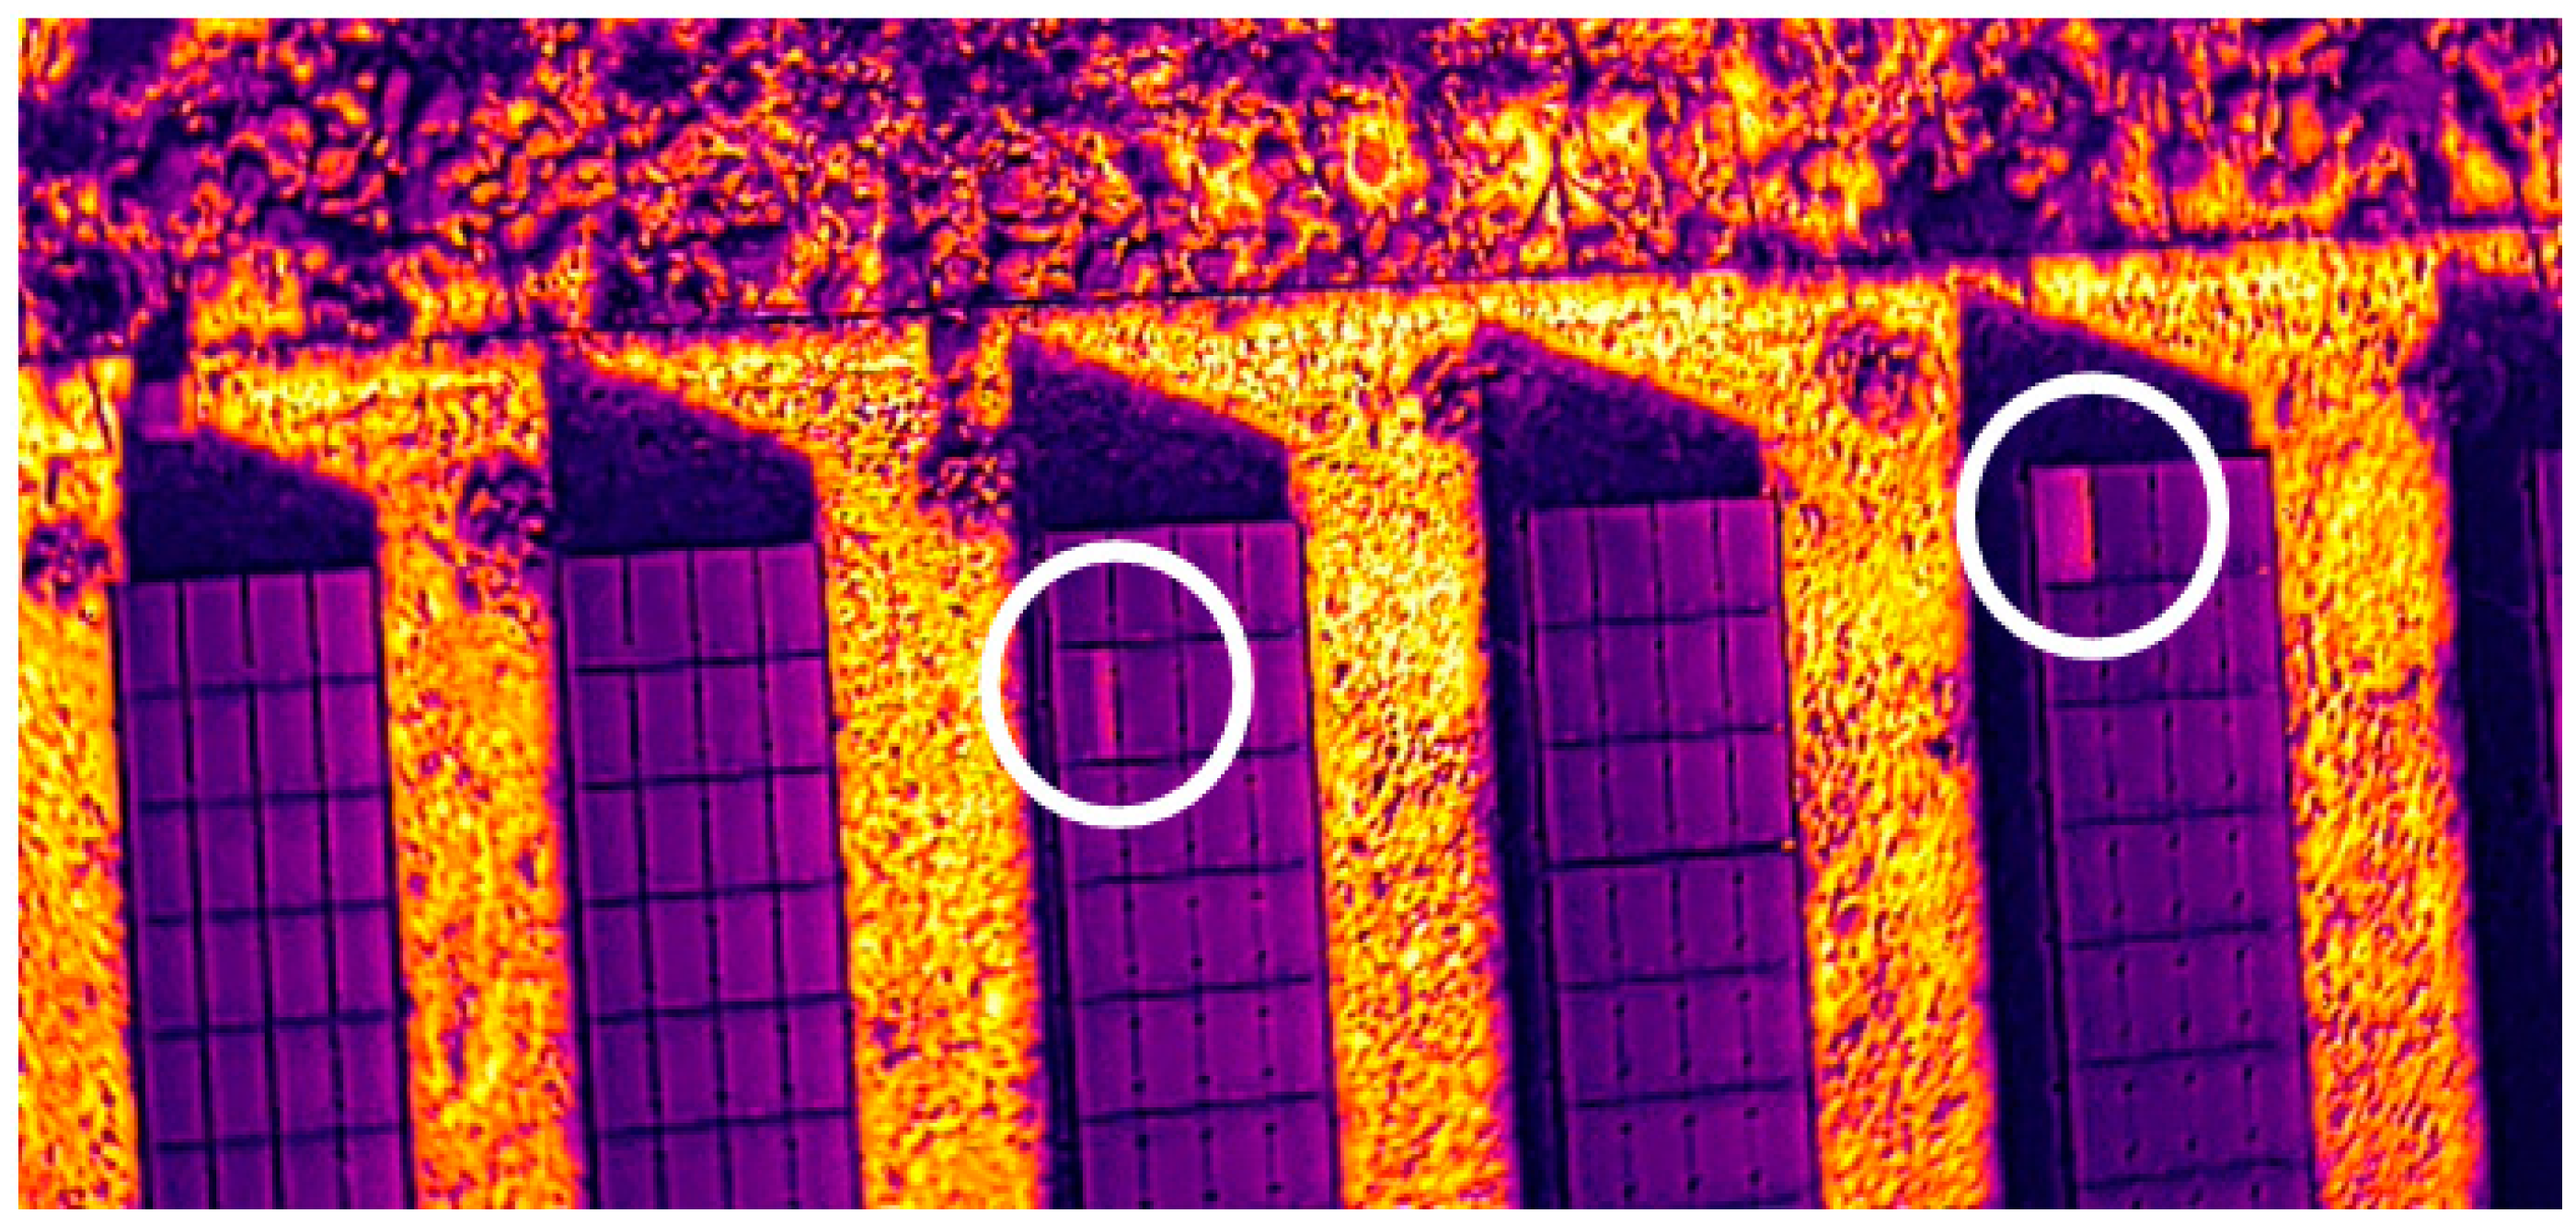
Detectron2 is a flexible computer vision model package implemented by PyTorch 1.0.0. In the proposed algorithm, Detectron2 is used with Faster R-CNN Mask for faulty object detection, and then faults are categorized. Faults that show continuity throughout the predefined area are considered as bypass diode failure (Figure 11), and point faults that are seen as regional and scattered in this area are considered as hotspot faults (Figure 12).
The model proposed in this study was implemented and tested using the images of Site-1 shown in Figure 13. The general information about the thermal inspection and the inspection hardware is given in Table 1 and Table 2, respectively. There are six different power plants (TK-1 to TK-6) on this PV farm; five of them consist of 160 strings with 22 panels each, and the last one consists of 125 strings with 22 panels.
As reported in [39], accuracy assessment is performed to evaluate the detection results of the testing dataset from the ML algorithms. Three precision metrics, namely precision, recall, and F1-score, are defined as Equations (1)–(3):
where True Positive (TP), False Positive (FP), True Negative (TN), and False Negative (FN) indicate the correctly detected, the incorrectly detected, the correctly rejected, and the incorrectly rejected objects, respectively.
The area under the receiver operating characteristics (ROC) curve (AUC) value and the above-mentioned accuracy metrics obtained for PV settlements of Site-1 are as follows: AUC of 0.911, Precision of 0.849, Recall of 0.848, and F1-score of 0.848. The actual and predicted results of defects for the Site-1 solar PV plant are given in Table 3.
With the thermal images at hand, the identification of defective panels and the characterization of the faults were reiterated employing an application known as Orange data mining platform. It is an open-source and component-based visual programming software package for data visualization, machine learning, data mining, and data analysis. From the thermal images acquired, panels were chosen, and individual panel images were captured at a resolution of 24 × 40 pixels and 96 dpi.
In the real situation, 127 bypass diode faults and 38 hotspot faults were detected throughout Site-1. By making use of these determinations, a sample of the system was tried to be created and the sample in question includes a total of 415 images, including all images of defective panels and 250 randomly selected no-fault panel images. Hierarchical clustering of images was performed on the Orange platform. The image transformation was made with the help of the image embedding algorithm, then the distance metrics were applied for calculating the distances. Once the data are passed to the hierarchical clustering, the widget displays a dendrogram, a tree-like clustering structure. According to the branches of the dendrogram, the data are divided into several clusters. Table 4 shows the number of clusters needed to group each state under consideration with different distance metrics. Comparative representation of the actual and the predicted values is given in Table 5.
Table 5 reveals that the cosine distance metric yields the most successful results. While all three metrics achieved a 100% success rate in detecting hotspot fault, the algorithm should exhibit greater sensitivity to differentiate between a defect-free panel and bypass diode failure. This observation is consistent with the recorded results, which indicate a correct prediction rate of 96.9% for bypass failure malfunctions and 99.6% for panels without faults.
3.2. Processing Historical Inverter Data
Within this section, we have undertaken a mathematical examination of both hotspot faults and bypass diode failures using the current and voltage measurements obtained from the inverters of Site-1. For this purpose, four different machine learning methods, namely Neural Network, Random Forest, kNN, and Gradient Boosting, were used.
According to thesis study of Kaloorazi and Yazdi [40], the simulation results show deviation from measurements of 2% in summer and 25% in winter conditions. The reasons for the higher inaccuracy in the wintertime are lower production, higher uncertainty in the albedo values, and more diffuse irradiation. In this study, data from the March–August period collected for 3 years were used. Thus, the effect of seasonal deviations was minimally reflected in the dataset. The dataset consists of instantaneous data obtained from Site-1 and there are also missing data and extraordinary instantaneous data. Therefore, the dataset was revised, and missing and meaningless data lines were excluded.
As is known, bypass diodes are wired within the PV module and provide an alternate current when a cell or panel becomes shaded or faulty. They are used to enhance the output power production during partial shading conditions and to protect partially shaded PV cells from fully operating cells in full sun within the same solar panel when used in high-voltage series arrays.
The three inputs, percentage of voltage drop, percentage of open-circuit voltage, and percentage of short-circuit current, employed by Dhimish et al. [41] to investigate bypass diode failure, were also incorporated into this study. On the other hand, hotspot faults events have a percentage of 50% compared to all fault events in the PV modules, according to Pramana et al. [42]. Hotspots in solar panels refer to localized areas on the panel experiencing elevated temperatures compared to the surrounding regions. While they are frequently encountered, predicting their occurrence poses a considerable challenge. Cell temperatures within these hotspots can often soar to 150 degrees Celsius, resulting in permanent and irreversible damage. For this reason, we used the temperature values of the panels as input parameters in this study.
Current and voltage (I–V) values obtaining from the inverters of Site-1 were utilized to create training and testing datasets including two fault types (hotspot faults and bypass diode failures) and a normal operation. The dataset consists of real-time data between March and August of the last three years, including 2021–2023. The reason for choosing the data covering the period in question is that Site-1 receives more sunlight in this period of the year due to its location.
The random sampling method was applied to test the fault detection ability of the algorithms employed and to measure the unbiased estimate of our proposed models. In this random sampling method, the dataset was randomly divided into a training set and a test set (i.e., 75% and 25% of the dataset, respectively). Accordingly, each set contained approximately the same percentage of samples of each class. The overall performance was obtained by determining the average for all 10 iterations. Hyperparameters used for the selected four machine learning algorithms are given in Table 6.
3.3. Results of Processing Historical Inverter Data
The ability of four algorithms to detect faults in PV plants was evaluated, and the results were achieved, as shown in Table 7.
Precision is defined as the ratio of the TP to all the positives, as stated in Section 3.1. That would be the measures of defective panels that, out of all the panels with a fault, our model accurately recognizes as faulting according to our problem statement. For example, in July 2021, the Neural Network achieved a precision score of 0.944. This means that when predicting a panel failure, it is accurate approximately 94%. Similarly, the recall rate is obtained as 0.951. Recall rate also gives a measure of how accurately our model can identify the relevant data. A faulty panel that is not intervened in is an undesirable situation for us. Deciding accuracy of the model requires a tradeoff between precision and recall. Both metrics are important for our classification problem, and the results showed that our model has balanced precision and recall rates giving a good F1-score.
Similar to the artificial neural network, the F1-score, precision, and recall values for the other three machine learning models were above 0.93, and there was a slight increase in these values compared to the artificial neural network. Looking at the averages of the performance values obtained from the data analyzed for three different years and a total of 18 different months, the highest numerical values were obtained for the kNN model.
Duranay [43] presented the performance metric results of the classification of PV faults and compared the results of different studies given in the literature using the same dataset [43]. The results reported in the study show that the average precision was in the range of 88.55–98.24%, and average F1-score was in the range of 84.45–97.51%. Based on the comparison between the results of our study and results published in the literature, our approach is successful for anomaly detection in PV plants and consistent with the currently ongoing studies.
4. Conclusions
The study’s objective is to conduct a thorough investigation with a view to fault detection in solar energy systems. The goal is to identify the defective panel by analyzing the thermal images in accordance with the malfunction predictions generated after using machine learning and/or artificial intelligence algorithms to interpret the real-time data collected from the fields.
Using both image processing and real-time inverter data analysis techniques, PV panel problems—particularly hotspot faults and bypass diode failures—that are commonly observed in solar power plants were detected. Drones were used to collect thermal images, which were then processed using a variety of algorithms to determine the panel settlement. The field’s rough terrain presented the main obstacle in this situation. In the beginning, when we were developing our algorithm, we used RGB and thermal images. However, we found that our application performed better (AUC = 0.911) when it only used thermal photos. As a result, we updated our software to only use thermal images in this investigation.
It was intended to process the recorded panel images using the Image Analytics add-in on the Orange platform, but here, with the increase in the number of images, the response time of the application increased greatly. For this reason, instead of processing all the images, all the defective panels and randomly selected non-defective panel images were used. The results showed that with the selected sample in question, a 100% accuracy rate for hotspot faults detection was achieved.
In the last part of the study, real-time inverter data were employed for the PV fault detection. Training and test datasets were constructed using the numerical data gathered from Site-1 instantaneously. Then the data were tested with four different machine learning algorithms offered by the Orange platform. Upon reviewing the literature, it becomes apparent that over the past five years, machine learning techniques have seen extensive utilization in research endeavors [44]. Notably, Neural Network algorithms emerge as prominent contenders within this domain with the percentage of 33.75 [45]. This is followed by the SVM method with a usage rate of 13.95%. In this study, the accuracy rates of predictions were recorded by comparing Neural Network, which is a method that has proven its maturity in the analysis of solar energy data and is accepted in the literature, with random forest, kNN, and gradient boosting algorithms, which are not frequently used in this field. The results showed that the mentioned random forest, kNN, and gradient boosting algorithms had sufficiently successful F1-score, precision, and recall rates in the field of detection of PV panel malfunctions.
Author Contributions
Methodology, Ö.B., Z.K., K.D. and O.K.; Software, Ö.B.; Validation, Ö.B.; Investigation, Ö.B.; Resources, K.D. and O.K.; Writing—original draft, Ö.B.; Writing—review & editing, Z.K.; Supervision, Z.K. All authors have read and agreed to the published version of the manuscript.
Funding
This research received no external funding.
Institutional Review Board Statement
Not applicable.
Informed Consent Statement
Not applicable.
Data Availability Statement
The data presented in this study are available on request from the corresponding author. The data are not publicly available due to privacy.
Conflicts of Interest
Authors Konuralp Dalkılınç and Oğulcan Karaman were employed by the company ZENA Energy. The remaining authors declare that the research was conducted in the absence of any commercial or financial relationships that could be construed as a potential conflict of interest.
References
- Rapier, R. 2023 Statistical Review of World Energy. Available online: https://www.forbes.com/sites/rrapier/2023/08/06/global-energy-trends-insights-from-the-2023-statistical-review-of-world-energy/?sh=773cc9463502 (accessed on 19 March 2024).
- Sun, V.; Asanakham, A.; Deethayat, T.; Kiatsiriroat, T. Increase of power generation from solar cell module by controlling its module temperature with phase change material. J. Mech. Sci. Technol. 2020, 34, 2609–2618. [Google Scholar] [CrossRef]
- Park, M.K.; Lee, J.M.; Kang, W.H.; Choi, J.M.; Lee, K.H. Predictive model for PV power generation using RNN (LSTM). J. Mech. Sci. Technol. 2021, 35, 795–803. [Google Scholar] [CrossRef]
- Fazlizan, A.; Abdulmula, A.; Amran, A.N.; Lim, C.H.; Sopian, K. Performance evaluation of maximum light detection solar tracking system in the tropics. J. Mech. Sci. Technol. 2019, 33, 1391–1397. [Google Scholar] [CrossRef]
- Cha, J.K.; Kim, S.H. Solar, fuel, and battery cell-based small-scale hybrid power systems for long-term environmental monitoring using wireless sensors. J. Mech. Sci. Technol. 2023, 37, 3675–3681. [Google Scholar] [CrossRef]
- Jordan, D.C.; Silverman, T.J.; Sekulic, B.; Kurtz, S.R. PV degradation curves: Non-linearities and failure modes. Prog. Photovolt. Res. Appl. 2017, 25, 583–591. [Google Scholar] [CrossRef]
- Tshemese, Z.; Dziike, F.; Linganiso, L.Z.; Roro, K. Reliability Study of Solar Photovoltaic Systems for Long-Term Use. In Electrode Materials for Energy Storage and Conversion; CRC Press: Boca Raton, FL, USA, 2021; pp. 309–320. [Google Scholar] [CrossRef]
- Kumar, M.; Kumar, A. Performance assessment and degradation analysis of solar photovoltaic Technologies: A review. Renew. Sustain. Energy Rev. 2017, 78, 554–587. [Google Scholar] [CrossRef]
- Libra, M.; Mrázek, D.; Tyukhov, I.; Severová, L.; Poulek, V.; Mach, J.; Šubrt, T.; Beránek, V.; Svoboda, R.; Sedláček, J. Reduced real lifetime of PV panels—Economic consequences. Sol. Energy 2023, 259, 229–234. [Google Scholar] [CrossRef]
- Pastuszak, J.; Wegierek, P. Photovoltaic cell generations and current research directions for their development. Materials 2022, 15, 5542. [Google Scholar] [CrossRef] [PubMed]
- Petrone, G.; Spagnuolo, G.; Teodorescu, R. Reliability issues in photovoltaic power processing systems. IEEE Trans. Ind. Electron. 2008, 55, 2569–2580. [Google Scholar] [CrossRef]
- Dong, Q.; Shi, Y.; Zhang, C.; Wu, Y.; Wang, L. Energetically favored formation of SnO2 nanocrystals as electron transfer layer in perovskite solar cells with high efficiency exceeding 19%. Nano Energy 2017, 40, 336–344. [Google Scholar] [CrossRef]
- Ansari, S.; Ayob, A.; Lipu, M.S.H.; Saad, M.H.M.; Hussain, A. A review of monitoring technologies for solar PV systems using data processing modules and transmission protocols: Progress, Challenges and Prospects. Sustainability 2021, 13, 8120. [Google Scholar] [CrossRef]
- Asnil, A.; Krismadinata, K.; Husnaini, I.; Hazman, H.; Astrid, E. Real-time monitoring system using IoT for photovoltaic parameters. TEM J. 2023, 12, 1316–1322. [Google Scholar] [CrossRef]
- Pozi, M.A.; Lim, H.S.; Lim, B.K.; Liew, K.W. IoT-based monitoring system for solar photovoltaics’ parameter analysis and prediction. In Proceedings of the Multimedia University Engineering Conference (MECON 2022); Springer Nature: Berlin/Heidelberg, Germany, 2023; pp. 401–412. [Google Scholar]
- Rezk, H.; Tyukhov, I.; Raupov, A. Experimental implementation of meteorological data and photovoltaic solar radiation monitoring system. Int. Trans. Electr. Syst. 2015, 25, 2573–3585. [Google Scholar] [CrossRef]
- Libra, M.; Daneček, M.; Lešetický, J.; Poulek, V.; Sedláček, J.; Beránek, V. Monitoring of Defects of a Photovoltaic Power Plant Using a Drone. Energies 2019, 12, 795. [Google Scholar] [CrossRef]
- Henry, C.; Poudel, S.; Lee, S.-W.; Jeong, H. Automatic detection system of deteriorated PV modules using drone with thermal camera. Appl. Sci. 2020, 10, 3802. [Google Scholar] [CrossRef]
- Pruthviraj, U.; Kashyap, Y.; Baxevanaki, E.; Kosmopoulos, P. Solar photovoltaic hotspot inspection using unmanned aerial vehicle thermal images at a solar field in south India. Remote Sens. 2023, 15, 1914. [Google Scholar] [CrossRef]
- World Energy Outlook 2016–Analysis–IEA. 2016. Available online: https://www.iea.org/reports/world-energy-outlook-2016 (accessed on 19 March 2024).
- Constantin, A.; Dinculescu, R.N. UAV development and impact in the power system. In Proceedings of the 2019 8th International Conference on Modern Power Systems (MPS), Cluj, Romania, 21–23 May 2019. [Google Scholar]
- Chen, L.; Li, S.; Wang, X. Quickest fault detection in photovoltaic systems. IEEE Trans. Smart Grid 2018, 9, 1835–1847. [Google Scholar] [CrossRef]
- Dhimish, M.; Lazaridis, P.I. An Empirical investigation on the correlation between solar cell cracks and hotspots. Sci. Rep. 2021, 11, 23961. [Google Scholar] [CrossRef]
- Dhimish, M. 70% decrease of Hot-Spotted photovoltaic modules output power loss using novel MPPT algorithm. IEEE Trans. Circuits Syst.—II Express Briefs 2019, 66, 2027–2031. [Google Scholar] [CrossRef]
- Jeon, H. Thermal Image Analysis for Fault Detection and Diagnosis of PV Systems. Master’s Thesis, Purdue University, West Lafayette, IN, USA, May 2020. [Google Scholar]
- Shimizu, R.; Ota, Y.; Nagaoka, A.; Araki, K.; Nishioka, K. Non-contact monitoring of operating conditions for solar cells in a photovoltaic module using a surface potential meter for detecting the risk of fire. Appl. Sci. 2023, 13, 10391. [Google Scholar] [CrossRef]
- Gökgöz, M.; Sağlam, Ş.; Oral, B. Investigation of failures during commissioning and operation in photovoltaic power systems. Appl. Sci. 2024, 14, 2083. [Google Scholar] [CrossRef]
- Xiao, C.; Hacke, P.; Johnston, S.; Sulas-Kern, D.B.; Jiang, C.S.; Al-Jassim, M. Failure analysis of field-failed bypass diodes. Prog. Photovolt. Res. Appl. 2020, 28, 909–918. [Google Scholar] [CrossRef]
- Amiri, A.F.; Oudira, H.; Chouder, A.; Kichou, S. Faults detection and diagnosis of PV systems based on machine learning approach using random forest classifier. Energy Convers. Manag. 2024, 301, 118076. [Google Scholar] [CrossRef]
- El-Banby, G.M.; Moawad, N.M.; Abouzalm, B.A.; Abouzaid, W.F.; Ramadan, E.A. Photovoltaic system fault detection techniques: A review. Neural Comput. Appl. 2023, 35, 24829–24842. [Google Scholar] [CrossRef]
- El-Rashidy, M.A. An efficient and portable solar cell defect detection system. Neural Comput. Appl. 2022, 34, 18497–18509. [Google Scholar] [CrossRef]
- Fu, L.; Sun, L.; Du, Y.; Meng, F. Fault diagnosis of radio frequency circuit using heterogeneous image fusion. Opt. Eng. 2023, 62, 034107. [Google Scholar] [CrossRef]
- Baltacı, Ö.; Kıral, Z.; Gürses, Y.Ç. Photovoltaic energy forecasting via artificial neural network and support vector machine approaches. In Proceedings of the IRENEC 2021, Istanbul, Turkey, 20–23 May 2021; pp. 161–173. [Google Scholar]
- Long, Z.; Zhang, X.; He, M.; Huang, S.; Qin, G.; Song, D.; Tang, Y.; Wu, G.; Liang, W.; Shao, H. Motor fault diagnosis based on scale invariant image features. IEEE Trans. Ind. Inform. 2022, 18, 1605–1617. [Google Scholar] [CrossRef]
- Ding, A.; Qin, Y.; Wang, B.; Cheng, X.; Jia, L. AN Elastic expandable fault diagnosis method of three-phase motors using continual learning for Class-Added sample accumulations. IEEE Trans. Ind. Inform. 2023, 71, 7896–7905. [Google Scholar] [CrossRef]
- Global Electricity Review 2022. Available online: https://ember-climate.org/insights/research/global-electricity-review-2022/ (accessed on 19 March 2024).
- Havrlík, M.; Libra, M.; Poulek, V.; Kouřím, P. Analysis of output signal distortion of galvanic isolation circuits for monitoring the mains voltage waveform. Sensors 2022, 22, 7769. [Google Scholar] [CrossRef] [PubMed] [PubMed Central]
- Diaz, J.J.V.; Vlaminck, M.; Lefkaditis, D.; Vargas, S.A.O.; Luong, H. Solar panel detection within complex Backgrounds using thermal images acquired by UAVs. Sensors 2020, 20, 6219. [Google Scholar] [CrossRef]
- Muhammed, E.; El-Shazly, A.; Morsy, S. Building rooftop extraction using machine learning algorithms for solar photovoltaic potential estimation. Sustainability 2023, 15, 11004. [Google Scholar] [CrossRef]
- Kaloorazi, M.F.; Yazdi, M.G. Design Optimization of Utility-Scale PV Power Plant. Master’s Thesis, Dalarna University, Falun, Sweeden, June 2021. [Google Scholar]
- Dhimish, M.; Holmes, V.; Mehrdadi, B.; Dales, M.; Mather, P. Detecting defective Bypass diodes in photovoltaic modules using Mamdani fuzzy logic system. Glob. J. Res. Eng. Electr. Electron. Eng. 2017, 17, 33–44. [Google Scholar]
- Pramana, P.A.A.; Dallimi, R. Hotspot detection method in large capacity photovoltaic (PV) Farm. IOP Conf. Ser. Mater. Sci. Eng. 2020, 982, 012019. [Google Scholar] [CrossRef]
- Duranay, B.Z. Fault detection in solar energy systems: A deep learning approach. Electronics 2023, 12, 4397. [Google Scholar] [CrossRef]
- Toche Tchio, G.M.; Kenfack, J.; Kassegne, D.; Menga, F.-D.; Ouro-Djobo, S.S. A comprehensive review of supervised learning algorithms for the diagnosis of photovoltaic systems, Proposing a new approach using an ensemble learning algorithm. Appl. Sci. 2024, 14, 2072. [Google Scholar] [CrossRef]
- Jobayer, M.; Shaikat, M.A.H.; Rashid, M.N.; Hasan, M.R. A systematic review on predicting PV system parameters using machine learning. Heliyon 2023, 9, e16815. [Google Scholar] [CrossRef]
Figure 1.
2022 Primary Global Energy Consumption [1].
Figure 1.
2022 Primary Global Energy Consumption [1].

Figure 2.
Top 15 countries in 2022 for annual installed PV capacity [36].
Figure 2.
Top 15 countries in 2022 for annual installed PV capacity [36].

Figure 3.
PV string from Site-1.

Figure 4.
Panels detected.

Figure 5.
Detected corners of panel blocks.

Figure 6.
Drawing of rectangular structure covering panel blocks.

Figure 7.
Rotated mask for finding the center point of each panel.

Figure 8.
Center points assigned to each panel.

Figure 9.
Panel dimensions requiring enhancement.

Figure 10.
Rearranged panel block.

Figure 11.
Example of activated and multiple activated bypass diode failures.

Figure 12.
Example of hotspot fault.

Figure 13.
Plant layout for Site-1.


Table 1.
Inspection Overview.
| Site Name | Site-1 (Malatya, Türkiye) |
|---|---|
| Inspection Location | 38.230585833, 38.049603833 |
| Irradiance | >600 W/m2 |
| Wind Speed | <5 m/s |
| Inspection Summary | 1 round of visual scanning 1 round of thermal scanning |
Table 2.
Inspection Hardware.
| Description | Specification |
|---|---|
| Drone | DJI Matrice 300 |
| Visual Camera | DJI Zenmuse H20T |
| Visual Camera Resolution | 4000 × 3000 |
| Thermal Camera | DJI Zenmuse H20T |
| Thermal Camera Resolution | 640 × 512 |
| Operating Range (0C) | −25 to 153 |
| Sensitivity (NEdT) | <50 mK |
Table 3.
Actual and predicted results of faults of Site-1.
| Block | Bypass Diode Failure | Hotspot Faults | Block Subtotal | |||
|---|---|---|---|---|---|---|
| Actual | Predicted | Actual | Predicted | Actual | Predicted | |
| TK-1 | 43 | 40 | 13 | 14 | 56 | 54 |
| TK-2 | 11 | 11 | 2 | 2 | 13 | 13 |
| TK-3 | 9 | 10 | 1 | 1 | 10 | 11 |
| TK-4 | 45 | 43 | 16 | 18 | 61 | 61 |
| TK-5 | 14 | 14 | 6 | 6 | 20 | 20 |
| TK-6 | 5 | 4 | 0 | 1 | 5 | 5 |
| Defect Subtotal | 127 | 122 | 38 | 42 | 165 | 164 |
Table 4.
Hierarchical cluster numbers under different distance metrics.
| Distance Metric | Number of Clusters | |
|---|---|---|
| Type | Description | |
| Cosine | Cosine distance | 14 |
| Euclidean | Square root of summed difference between values | 12 |
| Manhattan | Sum of difference between values | 10 |
Table 5.
Hierarchical clustering results of Site-1 with the different distance metrics.
| Distance Metric | Bypass Diode Failure | Hotspot Faults | No-Fault Panels | |||
|---|---|---|---|---|---|---|
| Actual | Predicted | Actual | Predicted | Actual | Predicted | |
| Cosine | 127 | 123 | 38 | 38 | 250 | 249 |
| Euclidean | 127 | 121 | 38 | 38 | 250 | 249 |
| Manhattan | 127 | 119 | 38 | 38 | 250 | 247 |
Table 6.
Hyperparameters for selected algorithms.
| Model | Hyper Parameters |
|---|---|
| Neural Network | Neuron in hidden layers = 100, maximum number of iterations = 1000 |
| Random Forest | Number of trees = 10, do not split subsets smaller than 5 |
| kNN | Number of neighbors = 5 |
| Gradient Boosting | Number of trees = 100, learning rate = 0.100 |
Table 7.
Results (F1-score, precision, and recall rates) of the Machine Learning Algorithms.
| Time Stamp (MM/YYYY) | Data Size (Number of Monthly Records) | Neural Network | Random Forest | kNN | Gradient Boosting | ||||||||
|---|---|---|---|---|---|---|---|---|---|---|---|---|---|
| F1 | Prec. | Rec. | F1 | Prec. | Rec. | F1 | Prec. | Rec. | F1 | Prec. | Rec. | ||
| 03/2021 | 103,860 | 0.961 | 0.968 | 0.946 | 0.966 | 0.968 | 0.952 | 0.970 | 0.969 | 0.972 | 0.959 | 0.958 | 0.967 |
| 04/2021 | 131,367 | 0.930 | 0.928 | 0.941 | 0.937 | 0.936 | 0.944 | 0.942 | 0.940 | 0.945 | 0.921 | 0.936 | 0.901 |
| 05/2021 | 116,413 | 0.936 | 0.933 | 0.917 | 0.942 | 0.940 | 0.923 | 0.943 | 0.941 | 0.946 | 0.934 | 0.931 | 0.942 |
| 06/2021 | 150,758 | 0.934 | 0.931 | 0.941 | 0.937 | 0.936 | 0.944 | 0.937 | 0.934 | 0.941 | 0.929 | 0.927 | 0.937 |
| 07/2021 | 87,006 | 0.945 | 0.944 | 0.951 | 0.951 | 0.952 | 0.956 | 0.952 | 0.951 | 0.954 | 0.947 | 0.954 | 0.937 |
| 08/2021 | 122,714 | 0.948 | 0.947 | 0.955 | 0.952 | 0.951 | 0.957 | 0.954 | 0.953 | 0.956 | 0.943 | 0.942 | 0.951 |
| 03/2022 | 120,125 | 0.942 | 0.941 | 0.951 | 0.945 | 0.946 | 0.953 | 0.948 | 0.946 | 0.952 | 0.939 | 0.938 | 0.948 |
| 04/2022 | 130,494 | 0.938 | 0.936 | 0.947 | 0.948 | 0.949 | 0.954 | 0.952 | 0.951 | 0.955 | 0.938 | 0.936 | 0.947 |
| 05/2022 | 121,763 | 0.942 | 0.942 | 0.950 | 0.947 | 0.946 | 0.953 | 0.953 | 0.949 | 0.953 | 0.939 | 0.939 | 0.948 |
| 06/2022 | 122,061 | 0.929 | 0.928 | 0.941 | 0.937 | 0.936 | 0.945 | 0.938 | 0.936 | 0.943 | 0.928 | 0.928 | 0.940 |
| 07/2022 | 128,063 | 0.919 | 0.917 | 0.925 | 0.923 | 0.922 | 0.928 | 0.926 | 0.925 | 0.928 | 0.914 | 0.911 | 0.921 |
| 08/2022 | 119,310 | 0.878 | 0.879 | 0.898 | 0.883 | 0.881 | 0.898 | 0.885 | 0.881 | 0.896 | 0.869 | 0.868 | 0.891 |
| 03/2023 | 123,599 | 0.927 | 0.925 | 0.938 | 0.934 | 0.943 | 0.915 | 0.934 | 0.932 | 0.938 | 0.925 | 0.926 | 0.936 |
| 04/2023 | 101,510 | 0.952 | 0.951 | 0.955 | 0.954 | 0.953 | 0.957 | 0.953 | 0.952 | 0.955 | 0.949 | 0.948 | 0.952 |
| 05/2023 | 153,517 | 0.967 | 0.967 | 0.969 | 0.969 | 0.970 | 0.972 | 0.970 | 0.972 | 0.961 | 0.966 | 0.965 | 0.969 |
| 06/2023 | 138,278 | 0.887 | 0.888 | 0.908 | 0.896 | 0.895 | 0.910 | 0.898 | 0.895 | 0.906 | 0.883 | 0.885 | 0.851 |
| 07/2023 | 147,045 | 0.930 | 0.930 | 0.941 | 0.936 | 0.935 | 0.944 | 0.936 | 0.934 | 0.941 | 0.928 | 0.928 | 0.940 |
| 08/2023 | 141,714 | 0.939 | 0.938 | 0.951 | 0.945 | 0.945 | 0.954 | 0.945 | 0.942 | 0.950 | 0.938 | 0.937 | 0.949 |
| Mean | 0.933 | 0.933 | 0.940 | 0.939 | 0.939 | 0.942 | 0.941 | 0.939 | 0.944 | 0.930 | 0.931 | 0.935 | |
Disclaimer/Publisher’s Note: The statements, opinions and data contained in all publications are solely those of the individual author(s) and contributor(s) and not of MDPI and/or the editor(s). MDPI and/or the editor(s) disclaim responsibility for any injury to people or property resulting from any ideas, methods, instructions or products referred to in the content. |
© 2024 by the authors. Licensee MDPI, Basel, Switzerland. This article is an open access article distributed under the terms and conditions of the Creative Commons Attribution (CC BY) license (https://creativecommons.org/licenses/by/4.0/).
Share and Cite
MDPI and ACS Style
Baltacı, Ö.; Kıral, Z.; Dalkılınç, K.; Karaman, O. Thermal Image and Inverter Data Analysis for Fault Detection and Diagnosis of PV Systems. Appl. Sci. 2024, 14, 3671. https://doi.org/10.3390/app14093671
AMA Style
Baltacı Ö, Kıral Z, Dalkılınç K, Karaman O. Thermal Image and Inverter Data Analysis for Fault Detection and Diagnosis of PV Systems. Applied Sciences. 2024; 14(9):3671. https://doi.org/10.3390/app14093671
Chicago/Turabian StyleBaltacı, Özge, Zeki Kıral, Konuralp Dalkılınç, and Oğulcan Karaman. 2024. "Thermal Image and Inverter Data Analysis for Fault Detection and Diagnosis of PV Systems" Applied Sciences 14, no. 9: 3671. https://doi.org/10.3390/app14093671
Note that from the first issue of 2016, this journal uses article numbers instead of page numbers. See further details here.