

The Synthesis and Characterization of Geopolymers Based on Metakaolin and on Automotive Glass Waste

Institute of Rock Structure and Mechanics, Czech Academy of Sciences, V Holešovičkách 41, 18209 Prague, Czech Republic
*
Author to whom correspondence should be addressed.
Appl. Sci. 2024, 14(8), 3439; https://doi.org/10.3390/app14083439
Submission received: 14 March 2024
/
Revised: 11 April 2024
/
Accepted: 16 April 2024
/
Published: 18 April 2024
(This article belongs to the Special Issue Development, Characterization, Application and Recycling of Novel Construction Materials)
Abstract
:The presented article studies a metakaolin-based geopolymer matrix for which two types of non-recyclable automotive glass waste (AGW) have been used as an alternative aggregate. Their composition and character, as well as their influence on the properties and structure of geopolymer composites (AGW-Gs), have been investigated by means of X-ray fluorescence and X-ray diffraction analyses, scanning electron microscopy, Fourier transform infrared spectrometry and gas chromatography/mass spectrometry. Infrared analysis has proven that the use of AGW does not affect the formation of geopolymer bonds. GC/MS analysis has revealed the presence of triethylene glycol bis(2-ethylhexanoate) in AGW and geopolymers, whose concentration varied according to the size of the fractions used. Preliminary compressive-strength tests have shown the promising potential of AGW-Gs. From the presented results, based on the study of two types of automotive glass waste, it is possible to assume that automotive glass will generally behave in the same or a similar manner in metakaolin-based geopolymer matrices and can be considered as potential alternative aggregates. The result is promising for the current search for new sources of raw materials, for ensuring resource security, for the promotion of sustainability and innovation and for meeting the needs of the growing world population while reducing dependence on limited resources.
1. Introduction
In the European Union (EU), more than 250,000 tons of glass waste (GW) per month were produced in 2021 [1]. Non-recyclable or hardly recyclable glass, such as automotive, TV-screen, monitor, mirror and solar-panel (photovoltaic) glass, is a type of waste material related to developments in a wide range of industries. Currently, the EU environmental policy is focused on waste recycling, although the process of waste recovery is sometimes complicated in some cases. The main objectives are to reduce landfill waste and increase recycling [1,2,3]. The inseparable additives that impede common glass recycling include resin protective films or tint foils (automotive glass), luminescence substances (TV-screen and monitor glass) and metal coatings (mirror, TV-screen, monitor and solar-panel glass) [4,5]. For example, automotive glass (usually windshield) could contain tint or acoustic foils or safety films (polyester—PE, polycarbonate—PC, polyvinyl butyral—PVB); in some cases, it also has heating elements incorporated (copper (Cu), silver (Ag) and contains conductive foils from metal oxides such as BaSnO3, TiO2, SnO2, ZnO and ZrO2) [4,5,6].
The eco-friendly solution concerning the reduction, reuse and recycling of non-recyclable or hardly recyclable GW is the use of geopolymer materials [7,8,9,10,11,12]. Geopolymers have received significant attention for their potential environmental benefits, including the possibility of using industrial by-products, their lower carbon-dioxide emissions during production and their increased resistance to certain types of degradation (e.g., chemical attack, thermal stress, freeze–thaw cycles) [13,14,15,16,17,18].
Geopolymers are typically formed through the chemical reaction of aluminosilicate materials with an alkaline activator (a solution of sodium, potassium or calcium silicates) [10,19]. A prerequisite is the presence of tetra- or penta-coordinated aluminum in the aluminosilicate precursor [7,19]. The most extensively utilized and well-examined aluminosilicate precursors are metakaolin [20,21], fly ash [22], different types of slag [23,24] and various secondary or waste materials [10,11,25]. The precursor used significantly impacts the resulting microstructure, and obtaining the typical microstructure of the geopolymer is also associated with a precursor with a low calcium content [26,27,28].
The properties of geopolymers, including mechanical properties, durability, porosity, thermal insulation and others, can easily be modified by judicious selection of the matrix and/or aggregate used [11,29,30,31]. In addition, geopolymers are capable of stabilizing many hazardous substances, including heavy metals or organics, in their structure [25,32,33]. On the other hand, the addition of organic additives to hybrid geopolymer-organic composites can help to improve their flexibility, tensile strength and overall durability [34].
Glass waste, a byproduct of various industries and municipal recycling programs, can be incorporated into geopolymer formulations as a partial or complete replacement for traditional precursors or aggregates [35,36]. Moreover, GW can be used in the preparation of alkaline activators [36,37].
The finely ground glass particles contribute supplementary sources of silica and alumina, enhancing the geopolymerization process. It has been demonstrated that GW serves as a feasible alternative to the commercial sodium silicate hydrates (commonly known as water glass) typically utilized in the activation of aluminosilicate materials like fly ash for geopolymer preparation [38]. The study by Tchakouté et al. has proven that sodium water glass derived from glass waste and rice husk ash can serve as viable alternative alkaline solutions in the production of metakaolin-based geopolymer binders [39]. Puertas and Torres-Carrasco have reached similar conclusions regarding alkali-activated slag (AAS) [40]. They found that solutions obtained by processing GW lead to the formation of compounds and microstructures similar to those observed for AAS prepared using water glass [40].
In the preparation of geopolymers based only on waste glass, it has been found that waste glass is suitable as a precursor because it produces geopolymer materials with suitable mechanical strength, but whose development is dependent on the curing conditions, namely relative humidity [38]. In the case of metakaolin-based geopolymer, El-Naggar and El-Dessouky have determined that substituting 3% of metakaolin with GW (finer than 38 μm) resulted in a 2% enhancement in the 28-day compressive strength of the reference sample, reaching 82.36 MPa [41]. However, additional incorporation of GW had a negative impact on strength [41].
Fine glass waste was confirmed by Hajimohammadi et al. as a suitable alternative to fine sand for use in fly ash/slag-based geopolymer concrete because fine glass particles increase the alkalinity of the matrix, which promotes a greater range of dissolution and reaction in the vicinity of aggregates [42]. However, it was found by Tahwia et al. that when GW was used as a partial replacement for fine sand aggregate, on the one hand, the flowability of the mixture improved with the glass content, but on the other hand, when 22.5% natural sand was replaced by waste glass, a slight decrease in strength from 126 MPa to 121 MPa was observed [43]. The research revealed that AGW can serve as a replacement for fine aggregate in the production of fly ash-based geopolymer mortar, offering outstanding thermal insulation and fire protection characteristics [44].
The utilization of waste glass as a coarse aggregate has been explored in research such as that conducted by Kuri et al., who investigated its impact on the properties of both portland cement (PC) concrete and geopolymer concrete [45]. It was observed that the 28-day compressive and tensile strengths of both PC concrete and geopolymer concrete decrease with an increase in the percentage of recycled glass coarse aggregate [45]. In contrast, a study by Srivastava et al. has demonstrated that GW can be effectively used as a replacement for coarse aggregate in concrete (up to 50%) without a significant change in strength [46].
Although it seems that the use of glass waste for the preparation of geopolymer materials has already been investigated, studies have mainly focused on the use of GW in the powdered state. Automotive glass waste is non- or hardly recyclable and, in contrast to ordinary broken glass, contains safety films and, in some cases, heating elements [47]. AGW materials have only been tentatively tested as a resource for silica in the production of ferrosilicon [48,49], silicon carbide [50] or ceramic [51]. However, there has been almost no study of automotive glass waste in the context of geopolymer materials. The present paper deals with the innovative use of automotive glass waste (AGW) as an aggregate in a metakaolin-based geopolymer matrix, and the characterization of leachable organic substances from AGW, and their behavior concerning the particle size applied. Two different AGW materials have been characterized, and the influence of alkaline solutions on pure glass waste has been examined. The effect of AGW in different granulometric fractions on the properties and microstructure of geopolymer composites (AGW-Gs) has been systematically investigated. The quality of the aluminosilicate network in geopolymer solids has been verified by Fourier-transform infrared spectrometry (FTIR). The release of organics from AGW and subsequently from AGW-G has been monitored by gas chromatography/mass spectrometry (GC/MS). The study has been complemented by scanning electron microscopy (SEM) images identifying the AGW, its microstructure affected by alkaline solutions and the AGW-G structure. Additionally, the indicative compressive strength has been measured.
2. Materials and Methods
2.1. Materials
The clay-based geopolymer matrix was prepared from the clay material, industrially supplied by ČLUZ a.s. (Nové Strašecí, Czech Republic) under the trade name L05, an aqueous solution of potassium silicate (Vodní sklo, a.s., Prague, Czech Republic) and potassium hydroxide (Penta, Prague, Czech Republic). The clay material L05 was calcined at 750 °C for four hours before being used to obtain metakaolin. Based on X-ray diffraction (XRD) analysis (not presented), the clay material L05 is primarily composed of amorphous phases, with quartz (SiO2) and anatase (TiO2) present in notable quantities, alongside minor amounts of muscovite (KAl2(AlSi3O10)(OH)2) and hematite (Fe2O3). The chemical composition determined by X-ray fluorescence (XRF) analysis, including a loss on ignition (LOI), and the particle size distribution of the clay material are listed in Table 1 and Table 2, respectively.
Automotive glass waste from two different car windshields was used as an aggregate. The first glass (AGW1), contained only a safety film, and the second one (AGW2) additionally contained heating elements (Figure S1 of the Supplementary Files). The collected car windshields were cut into smaller pieces with a chopping saw (Figure S2 of the Supplementary Files), which were further fragmented into finer particles using a jaw crusher. A representative sample of crushed AGW (<0.2 mm) was taken from the obtained glass fragments by quartering for subsequent analyses. The residue was separated by sieving into different fractions, which were evaluated in terms of particle-size distribution.
2.2. Geopolymer Sample Preparation
The geopolymer matrix was prepared by mixing the calcined L05 (100 g) with an alkaline solution (100 g; molar rates: SiO2/Al2O3 = 2.62, K2O/SiO2 = 0.19 and H2O/K2O = 12.43) for 20 min using a shaft mixer. The resulting material was transferred to a planetary mixer, where, after the addition of a defined fraction of crushed AGW, the mixture was mixed for another five minutes. The amount of AGW materials incorporated was 40 g per 100 g of the geopolymer matrix. The geopolymer mixture was poured into molds, vibrated on a vibrating table to remove air bubbles and covered until the next day to prevent water evaporation. After demolding, the geopolymer samples were stored in a plastic bag for 28 days and then left uncovered under laboratory conditions.
In order to be able to compare the influence of the different AGW fractions on the behavior of leachable organic substances in geopolymer solids, the ratio of AGW to the geopolymer matrix was kept at 40:100 (35 wt.% of AGW per dry L05) for all the samples prepared (AGW-G), even though the filling was not exactly ideal. In the case of larger fractions, the mixture was fluid, and there was partial sedimentation of the glass waste. Concerning smaller fractions, the consistency of the mixture was thicker to slightly pasty.
2.3. Methods
Chemical analyses of pure metakaolin, AGWs and AGW-G composites were performed using a Spectro IQ X-ray fluorescence (XRF) analyzer (SPECTRO Analytical Instruments GmbH., Kleve, Germany), which allows the analysis of major and trace elements of solid, powder and liquid materials. This instrument has a target made of palladium; the target angle was 90° from the central beam, and the focal size was 1 mm × 1 mm. The measurements were carried out in an inert helium atmosphere. The data obtained were evaluated using the computer program XLabPro, which enables automatic recalculation of the elemental content in the sample to the oxide form. The tested specimens were produced by the pressed-pellet method: 4.0 g of the material (particle size: 15–20 µm) were mixed for 10 min with 0.9 g of the binder (HWC Hoechst wax, FLUXANA® GmbH & Co., KG, Bedburg-Hau, Germany). The compaction pressure was 80 kN.
The samples were analyzed by X-ray diffraction (XRD) on a Bruker D8 Advance powder X-ray diffractometer in a Bragg–Brentano geometry using a Lynx Eye XE detector and CuKα radiation (Bruker AXS, Karlsruhe, Germany). The powder sample was mounted on a planar substrate (diffraction-free silicon). Diffraction was recorded in the angular range of 4–80° 2Θ with a step of 0.015° and a readout time of 0.8 s per step. The acquired X-ray diffraction patterns were qualitatively evaluated in the Diffrac.Eva 4.1. software (Bruker AXS, Karlsruhe, Germany, 2015) using the ICDD PDF-2 database (ICDD 2018).
The organic substances in the AGW and subsequently in the AGW-G composites were determined on gas chromatography/mass spectrometry (GC/MS) equipment, consisting of a Trace 1310 gas chromatograph coupled with an ISQ single quadrupole system (ThermoScientific, Waltham, MA, USA) equipped with a CP5 capillary column (30 m × 0.25 mm × 25 μm). Data were acquired and integrated using the Chromeleon system (ThermoScientific, Waltham, MA, USA). Dichloromethane and methanol (HPLC grade) were purchased from Sigma-Aldrich (St. Luis, MO, USA), and ethylene glycol from Penta (Prague, Czech Republic).
The ground samples (<0.2 mm) were extracted with a mixture of dichloromethane and methanol (93:7, v/v) using an accelerated solvent extractor (ASE 150, Dionex, Sunnyvale, CA, USA). The extracts were filtered through a glass-fiber filter and concentrated using a Christ RVC 2–18 rotator evaporator. The total extracts were re-dissolved in 1.0 mL of dichloromethane/methanol (97:3) and analyzed.
GC/MS analysis was performed using helium as the carrier gas with a constant flow rate of 1.5 mL/min. The extract solution (1 μL) was injected into the GC system in splitless mode for each analysis. The injection port and detector temperatures were set at 250 °C; the oven temperature program started at 40 °C and was maintained for 1 min, after which it increased to 120 °C at 15 °C/min, then to 250 °C at 6 °C/min and finally to 300 °C at 12 °C/min, being maintained for 5 min. The analyte detected was identified by comparing the spectrum with the NIST mass spectral library and data from the literature. Each sample was analyzed three times, and the mean and the relative standard deviation (RSD) were calculated.
The compound identified was quantified using ethylene glycol as a standard after its derivatization with bis(trimethylsilyl)trifluoroacetamide (BSTFA) in pyridine. Ethylene–glycol stock solutions were prepared in dichloromethane to achieve the five concentration levels of the calibrators: 1, 5, 10, 25 and 100 µg/mL. The derivatization reagent (BSTFA, 25 μL) and the catalytic reagent (pyridine, 25 μL) were added to an aliquot (200 μL) of the ethylene–glycol solutions in a vial, and the mixture was placed in a laboratory dryer at 40 °C for 20 min. After cooling to room temperature and the evaporation of excessive BSTFA, the resulting trimethylsilyl derivatives were diluted in dichloromethane (50 μL) and analyzed by GC/MS.
The effect of the alkaline activator on the waste glass was determined only for selected fractions of both types of AGW (0.16–0.25 mm, 0.4–0.63 mm, 1.25–2 mm and 2–5 mm), which were exposed to the alkaline solution in a ratio of 1:10 (glass:alkaline activator). The samples were stirred on a shaker once a day for 1 h. After 28 days, the waste glass was filtered, washed with demi-water and dried to a constant weight at 80 °C.
Infrared (FTIR) spectra were measured by an iS50 spectrometer (Thermo Nicolet Instruments Co., Madison, WI, USA) using the reflection method in the attenuated total reflection (ATR) mode (diamond crystal) in the spectral range of 400–4000 cm−1 with a resolution of 4 cm−1, averaging 32 scans. All samples were scanned directly as observed (in powder form with variable grain size). The resulting spectra were processed using OMNIC 9 software.
The thermal stability of the AGW samples was determined by thermogravimetric (TG) analysis using a SETARAM-Setsys Evolution 18 thermal analyzer (SETARAM Instrumentation, Caluire-et-Cuire, France) with an Omnistar GSD 320 O3 mass spectrometer (Pfeiffer Vacuum Austria GmbH, Wien, Austria) for gas analysis (1–300 amu).
The microstructure of AGW and AGW-G composites was studied on a STEM Apreo S LoVac scanning electron microscope (ThermoFisher Scientific, Waltham, MA, USA) equipped with an ETD detector (Everhart-Thornley SED) in the high-vacuum mode. AGW fragments were adjusted to an aluminum stab using a carbon target, plastic conductive-carbon cement and platinum coated in Ar atmosphere on a Leica EM ACE600 sputter coater (Specion s.r.o., Prague, Czech Republic). The coating thickness was 16.01 nm. Geopolymer composite samples were polished using standard materialographic methods prior to mounting and coating, with the coating thickness being 10.85 nm. The SE (secondary-electron) mode with an acceleration voltage of 5.00 kV at magnifications of 200×–10,000× was used to observe detailed surface information in Standard and OptiPlan use.
Compressive strength was determined on a test press (Matest, Arcore, Italy) according to the EN-196-1:2016 standard [52] on 4 × 4 × 4 cm specimens. The resulting values are the average of three measurements.
3. Results and Discussion
3.1. The Characterization of Automotive Glass Waste
3.1.1. Sieve Analysis
The sieve analysis (Table 3) has shown the predominance of the 2–5 mm fraction for both types of automotive glass (31.15 wt.% for AGW1 and 34.87 wt.% for AGW2), followed by the 1.25–2.0 mm fraction. The initial assumption that the glass shard would contain a high proportion of fine particles has not been confirmed for either glass examined, as the particle contents below 0.063 mm are only 3.97 wt.% for AGW1 and 2.28 wt.% for AGW2. The photographs of AGW1 and AGW2 glass fractions are presented as Figures S3 and S4 in the Supplementary Files, respectively.
To assess the impact of individual fractions, specific fractions were singled out for analysis. Priority was given to fractions with the predominant content, namely those in the range of 2–5 mm and 1.25–2 mm. Subsequently, the 0.4–0.63 mm fraction, ranking third in content for AGW1, was included. Finally, the 0.16–0.25 mm fraction was selected to explore the effect of smaller particles despite its lower content. Fractions below 0.16 mm were not used for further experiments due to the workability of the geopolymer mixture.
3.1.2. X-ray Fluorescence Analysis
The results of the chemical (XRF) analyses of AGW samples (Table 4) are almost identical in the main glass-forming oxides (Na2O, SiO2, MgO, CaO, K2O, etc.). The contents of Na2O, MgO, CaO, K2O, etc. are only marginally higher in AGW2 than in AGW1. In contrast, the content of SiO2 is slightly higher in AGW1 than in AGW2. The samples differ in Fe2O3 content, which is higher in AGW1 than in AGW2. Another difference is evident for Cr2O3, whose value for AGW2 is almost twice as high as for AGW1. In the case of Bi, AGW2 contains much more of it than AGW1.
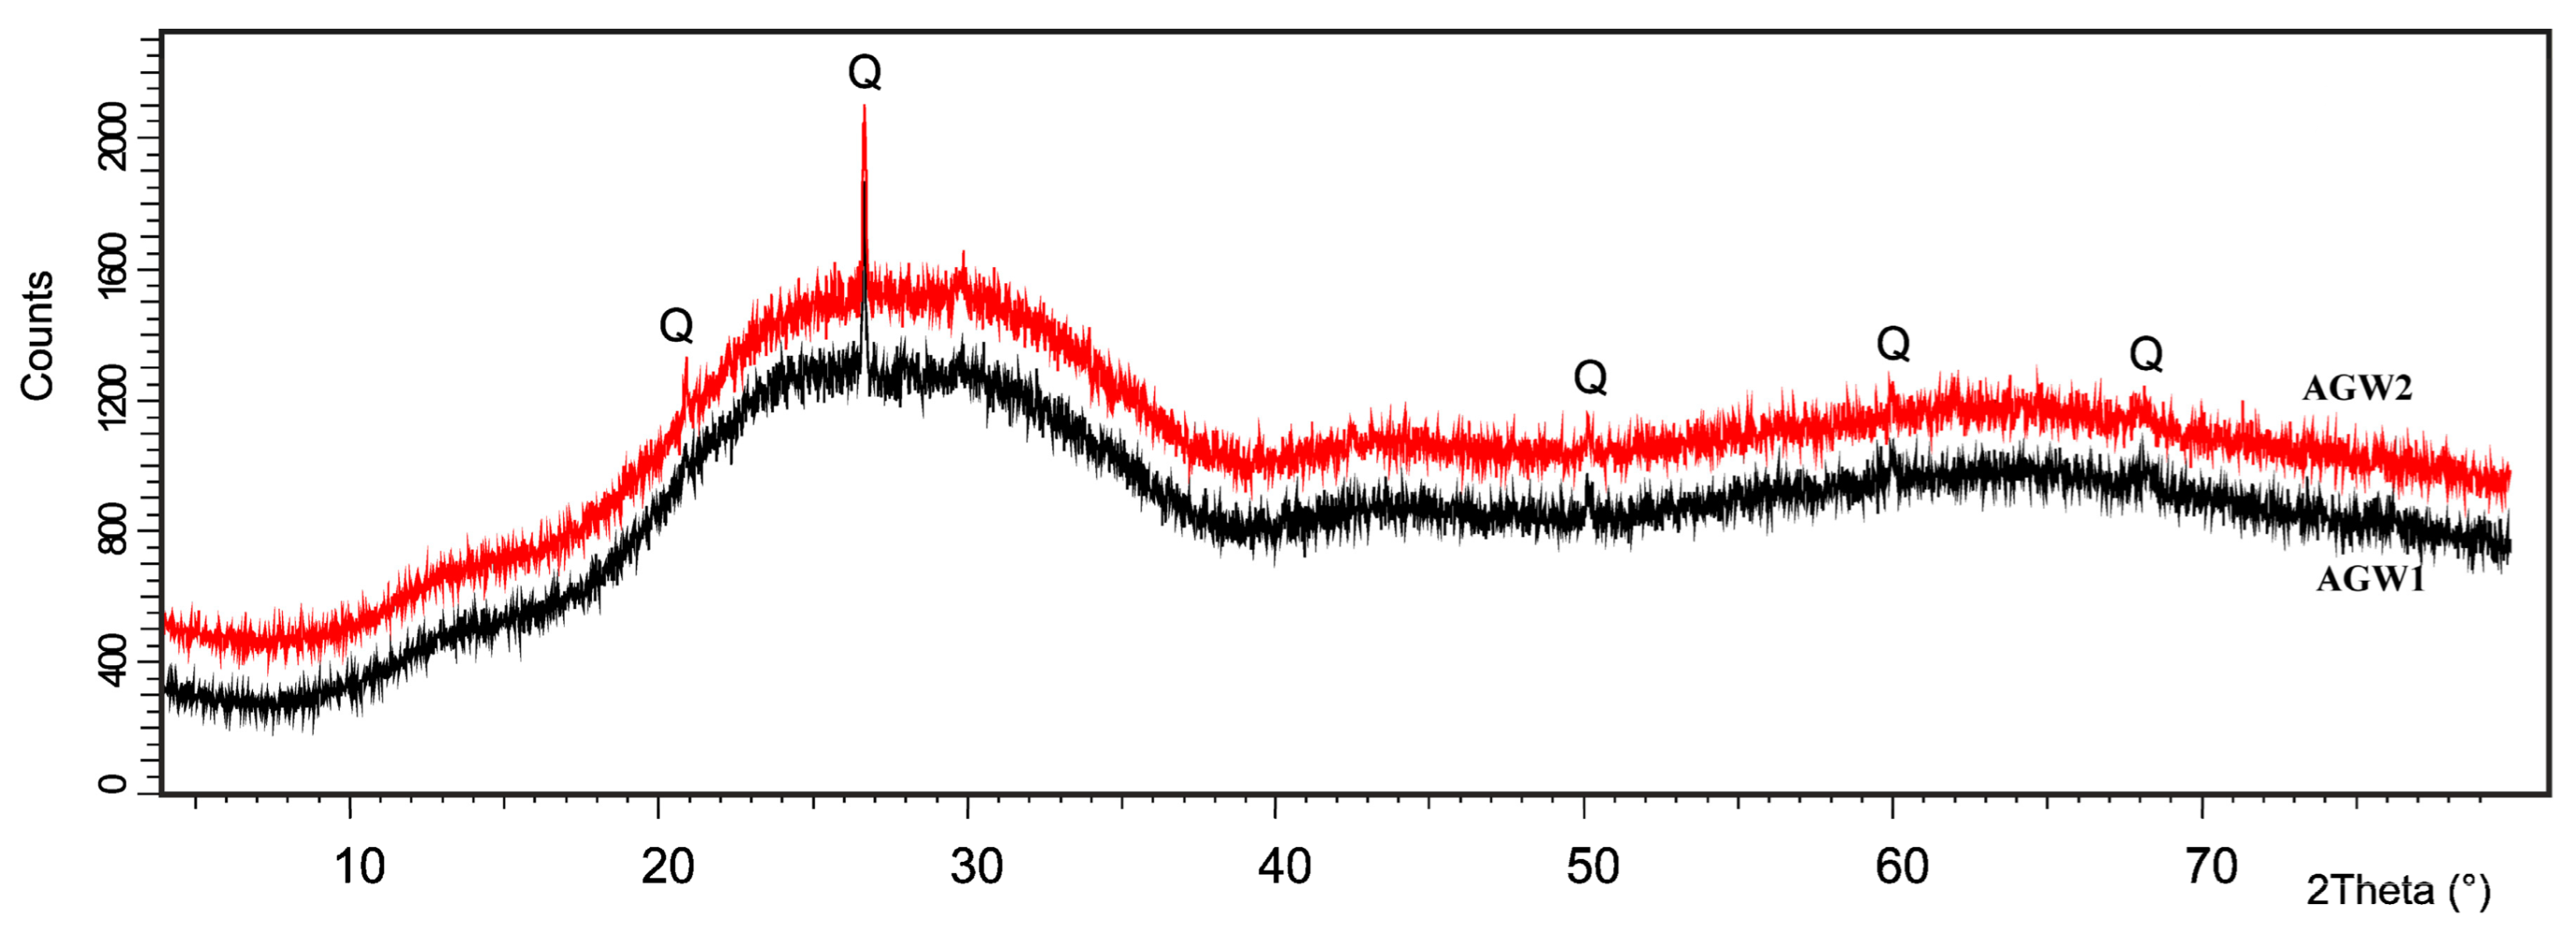
3.1.3. X-ray Diffraction Analysis
The results of the XRD analyses of AGW1 and AGW2 (Figure 1) have confirmed the expected amorphous character of the glass with only a minor content of crystalline quartz (Q; PDF00-001-0649). The curves of both samples are very similar, with no visible phases coming from the safety film or the heating elements.
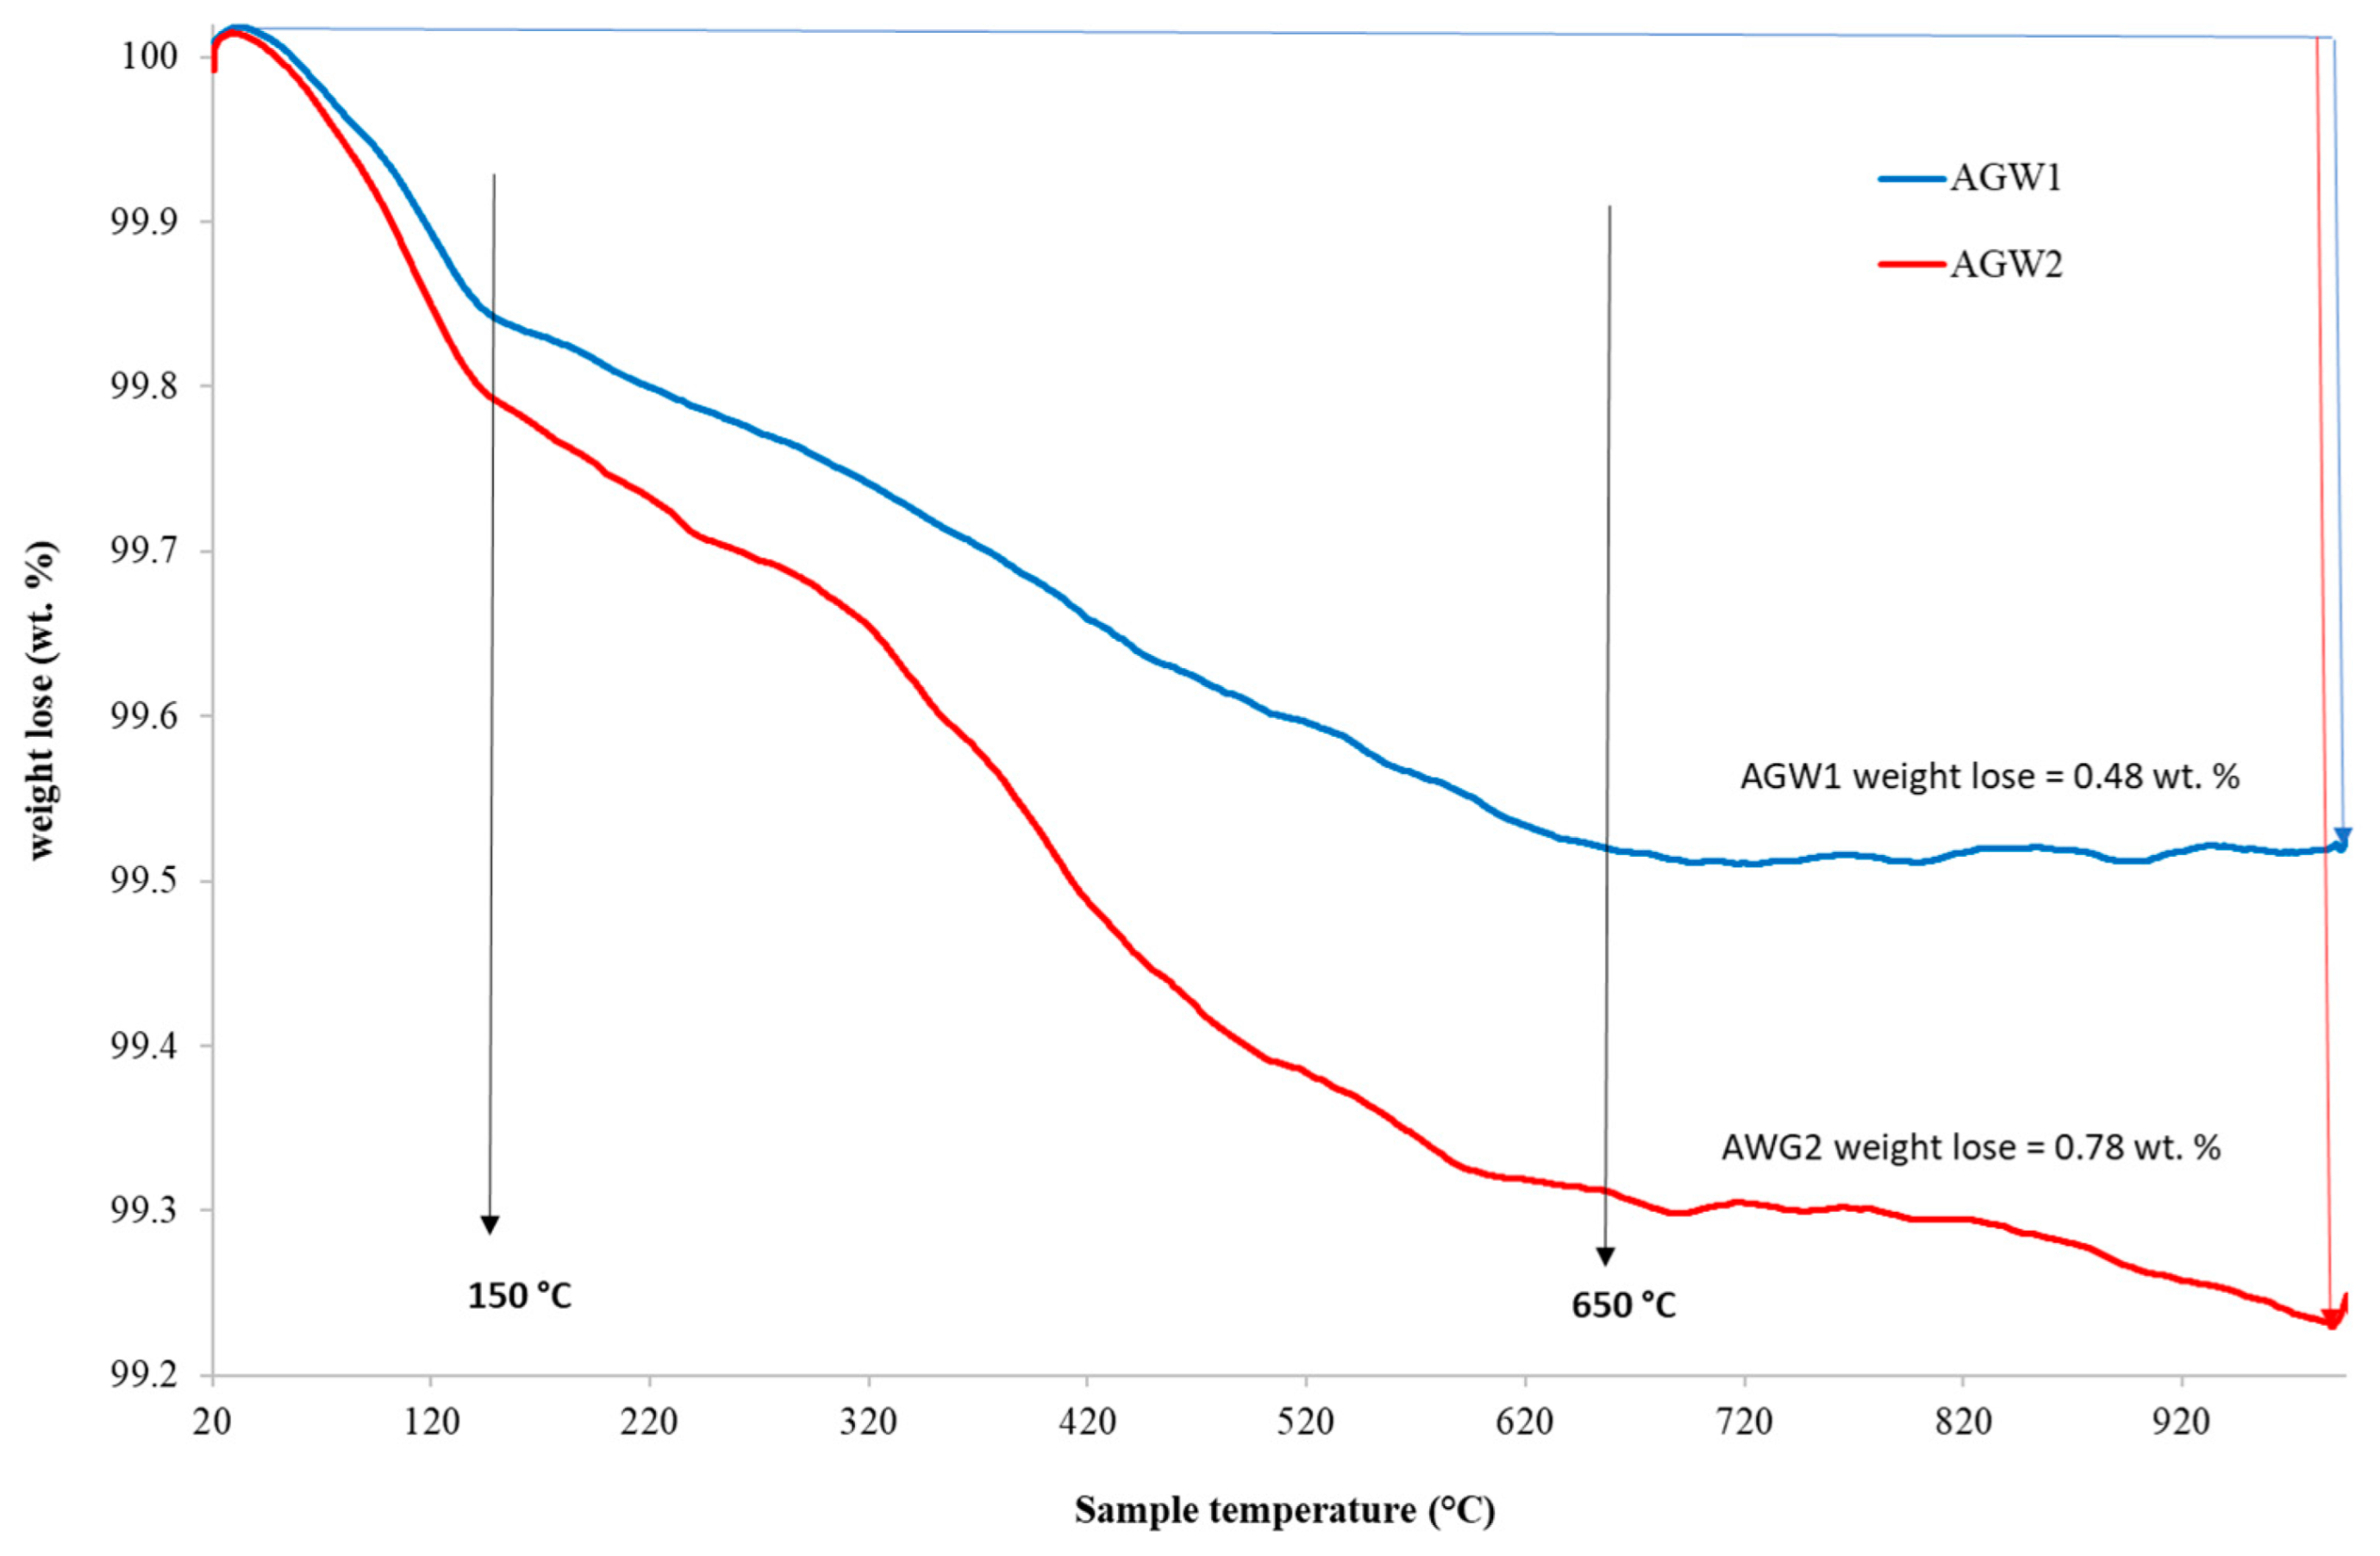
3.1.4. Thermogravimetric Analysis
AGW samples were further characterized by thermogravimetric analysis (Figure 2). Glass samples of 21–24 mg were heated in an inert helium atmosphere (at a flow rate of 20 mL·min−1) to prevent oxidation of the samples and to avoid affecting their quality. The change in weight loss was monitored by heating the samples at a constant heating rate of 10 °C min−1 from 25 °C to 1000 °C, which is sufficient to determine the volatile content of the finely crushed glasses. The glass contains a safety layer, which is typically polyvinyl butyral (PVB), whose main degradation starts at temperatures in the range of 260–330 °C [47,49,53]. This decrease can be divided into two phases [54]. In the first phase (up to 200 °C), moisture evaporation occurs, and in the second phase (200–900 °C), organic decomposition occurs, which is consistent with our results. These mass losses are seen from the TG curves in Figure 2, where moisture evaporation occurs with the first temperature increase up to 150 °C and amounts to 0.16 wt.% (AGW1) and 0.21 wt.% (AGW2). The subsequent decrease in signal in the temperature range of 150–650 °C is related to the gradual release of organic matter (e.g., polycarbonate, polyethylene terephthalate, etc.). This resulted in the release of gaseous molecules CO, CO2, CH4 and H2O from the hydroxyl groups bound to silica. The loss of organics was monitored up to a temperature of 1000 °C, which was sufficient to confirm that no undesirable substances were released.
Sample AGW1 commenced melting at 680 °C, whereas sample AGW2 initiated melting at 650 °C. The minor decrease in the AWG2 curve above 650 °C suggests that the final temperature of 1000 °C was inadequate to fully decompose this glass, unlike the AGW1 sample, where there was no decrease in the curve, indicating adequacy. This contrast was evident in the overall weight loss of 0.5% for AGW1 and 0.8% for AGW2. All the resulting melts exhibited coloring.
3.1.5. Gas Chromatography/Mass Spectrometry Analysis
GC/MS was applied for the identification of organic substances in both types of AGW and selected fractions (0.16–0.25 mm, 0.4–0.63 mm, 1.25–2 mm and 2–5 mm). The extraction yields were low (0.01–0.04 wt.%), corresponding to the inorganic nature of the samples. The extracts exhibited discoloration of the solutions, which varied according to the type of AGW (Figure S5 of the Supplementary Files). In all AGW1 and AGW2 samples, triethylene glycol bis(2-ethylhexanoate) was identified (formula: C22H42O6, MW: 402).
This compound serves as a plasticizer for various industrial materials, including polyvinyl butyral (PVB), which is widely used in glass lamination, especially in automotive applications [53]. In the case of windshields, the plasticizer triethylene glycol bis(2-ethylhexanoate) gives the film formability and flexibility and makes it possible to balance mechanical strength and elasticity, almost without affecting adhesion. The compound is insoluble, resistant to low temperatures and to ultraviolet radiation, has antistatic properties and is not listed as toxic or environmentally dangerous [55]. However, even if the substance is not labeled as hazardous, its release should be monitored and possibly restricted. This precaution is warranted due to documented instances of this substance being identified as a contact allergen [56]. Therefore, the influences of the AGW particle size on the release of triethylene glycol bis(2-ethylhexanoate) were investigated.
The concentrations of triethylene glycol bis(2-ethylhexanoate) in the AGW samples were quantitatively determined, ranging from 0.2 to 24.6 ng·kg−1 (Table 5).
The results show that for AGW1, the particle size has no significant effect on the presence of triethylene glycol bis(2-ethylhexanoate) in the samples. The measured values are very similar except for the 0.4–0.63 mm fraction, which is noticeably lower. These values range from 8.5 ng·kg−1 for the 0.4–0.63 mm fraction to 13.3 ng·kg−1 for the 2–5 mm fraction.
In contrast, a difference between the fractions has been found for AGW2. The contents of triethylene glycol bis(2-ethylhexanoate) in individual particle-size fractions varied. The highest concentration was found in the finest fraction, and the lowest concentration was determined in the coarsest fraction.
Surprisingly, the 0.4–0.63 mm fraction of both types of AGW showed the presence of a small amount of triethylene glycol bis(2-ethylhexanoate).
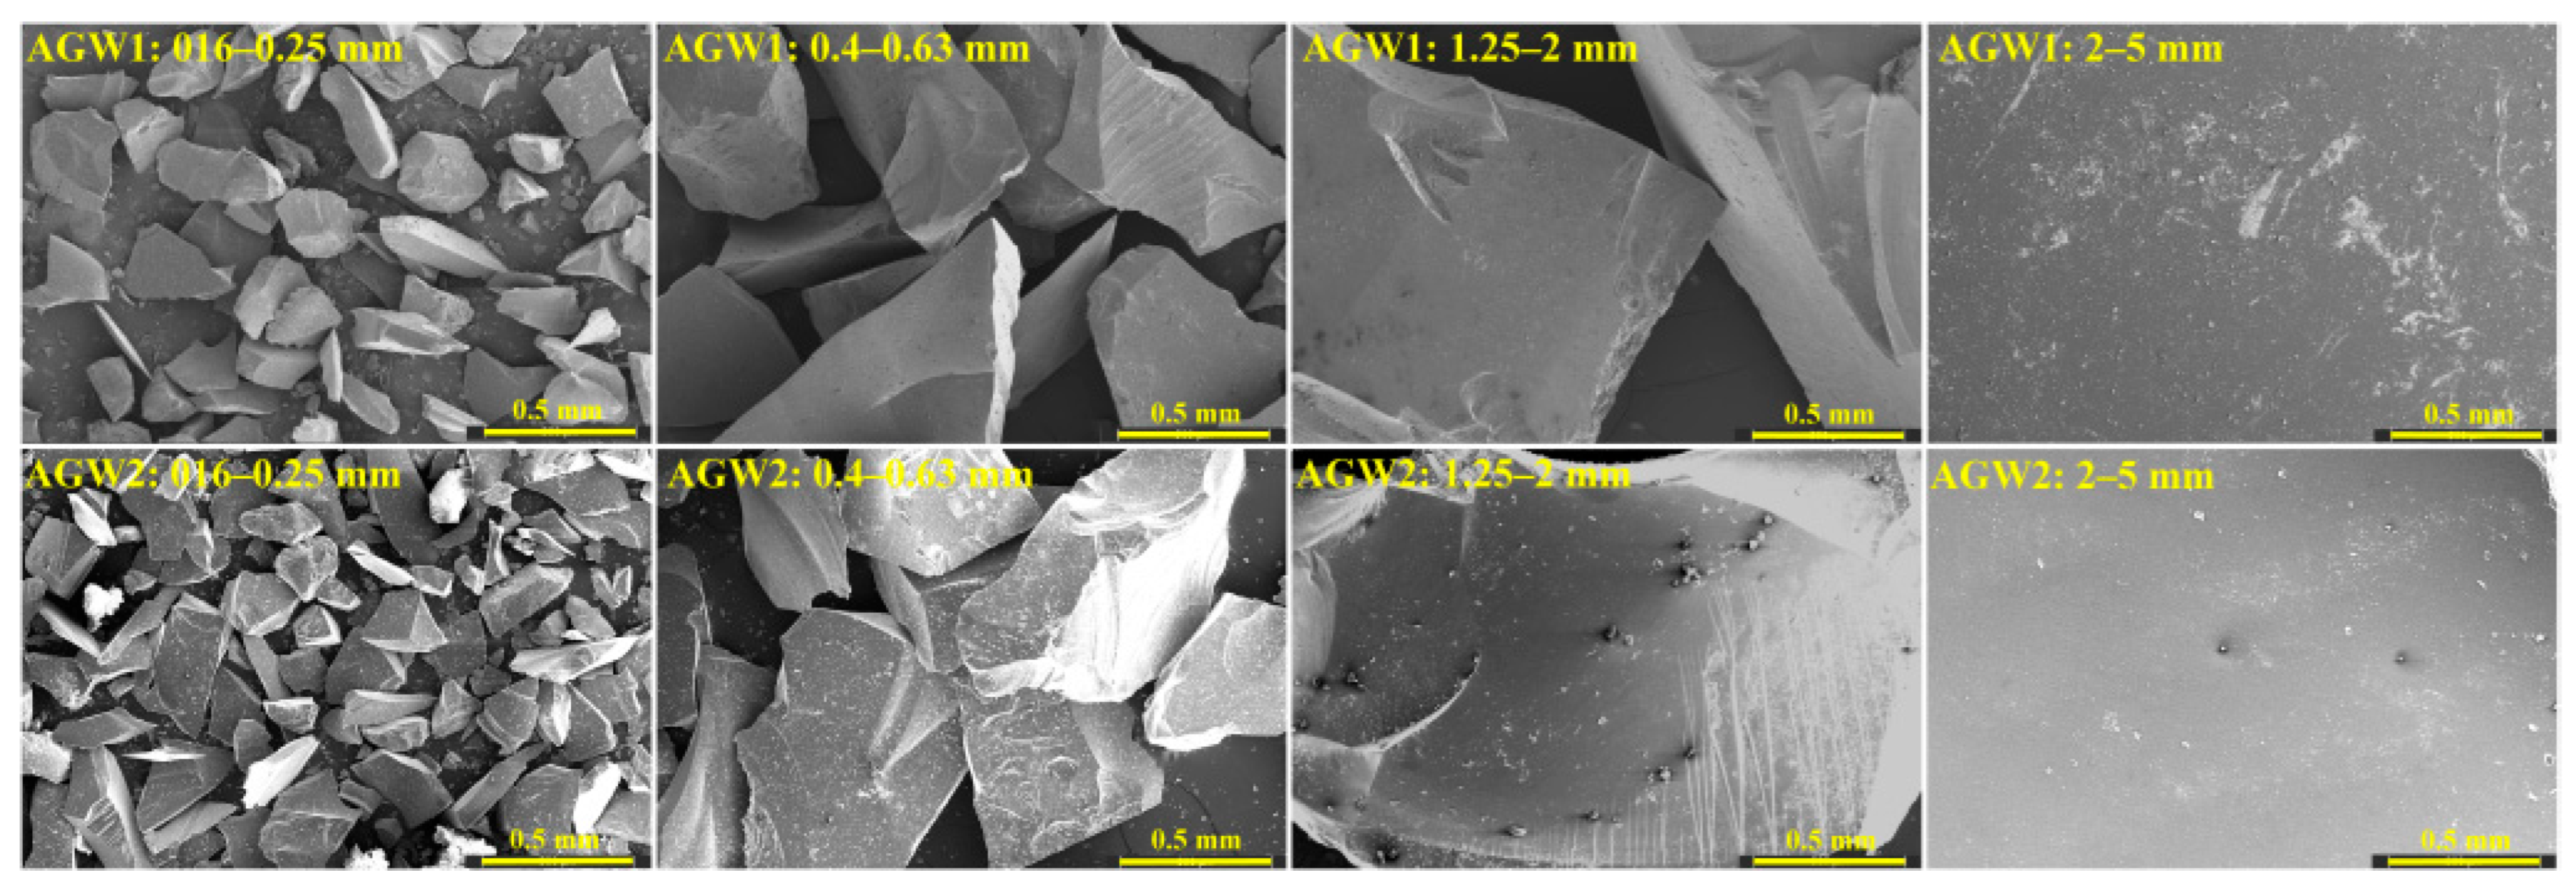
3.1.6. Scanning Electron Microscope Structure Study
Scanning electron microscopy (SEM) micrographs have been used to display the surfaces of AGW1 and AGW2 samples. Figure 3 shows the state of the ground glass before its exposure to the alkaline solution. Individual images are at the same magnification. It is evident from the pictures that the glass grit is sharp-edged after being crushed. In the larger fractions, it is possible to see traces of crushing as well as crushed-glass dust particles, especially in the case of the AGW2 1.25–2 mm fraction. These crushing residues (traces and dust particles) are more evident at 10,000× magnification (Figure S6 of the Supplementary Files).
3.2. The Effect of the Alkaline Activator on AGW Materials
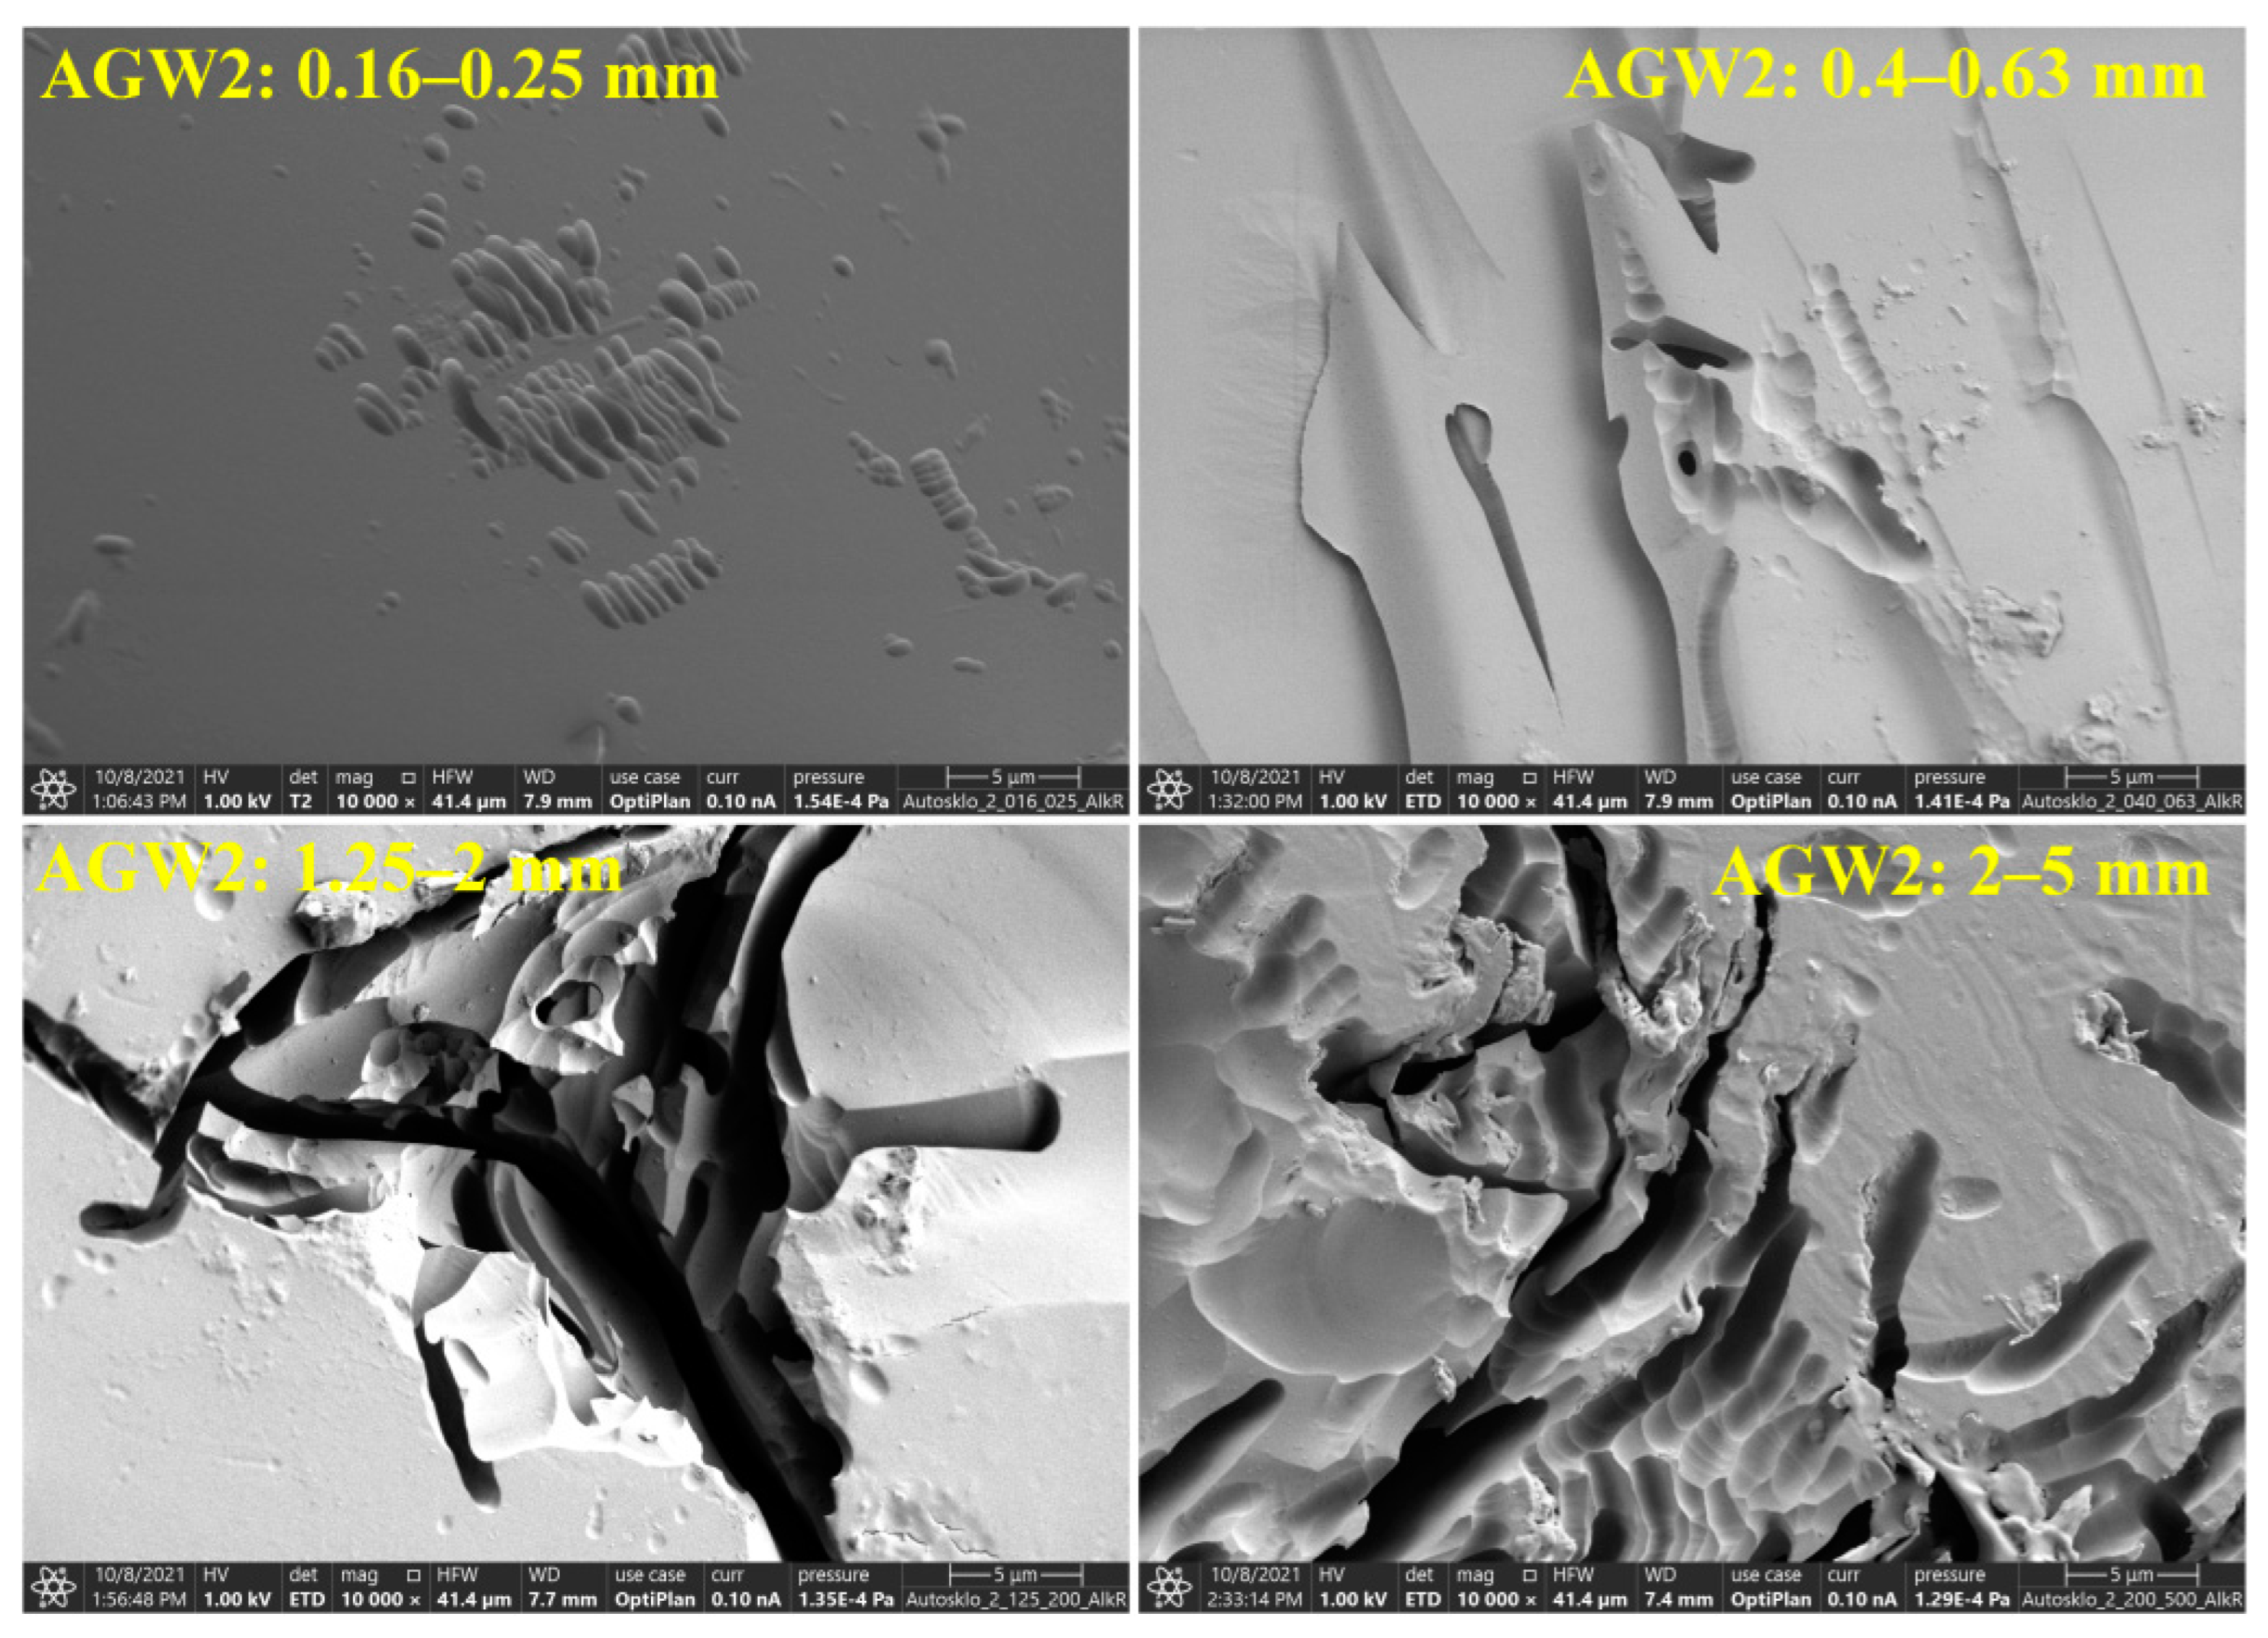
The effect of the alkaline activator on the waste glass has been determined for selected fractions of both AGW types (0.16–0.25 mm, 0.4–0.63 mm, 1.25–2 mm and 2–5 mm). The glass waste after exposure to the alkaline solution has been investigated by SEM analysis.
Figure 4 shows the AGW1 particles of different fractions after exposure to the alkaline solution at the same magnification (10,000×). The image reveals surface degradation in the form of oval, almost parallel grooves. The larger the original particles, the greater the degradation. Similar degradation traces have also been found in AGW2 (Figure 5). In comparison with AGW1, the incisions are almost parallel, but wherever they cross, the local damage is deeper. A comparison of the two images shows that AGW2 has more surface deterioration than AGW1, in both the extent and depth of damage.
The SEM study has confirmed the effect of the alkaline solution, with partial degradation occurring in the areas that were probably disrupted during crushing. However, it cannot be assumed that the same effect will be observed when the glass is embedded in the geopolymer matrix because no free-alkali activator will act on the glass after solidification (6–12 h). To confirm this hypothesis, geopolymer samples were prepared and subsequently analyzed.
3.3. The Characterization of Geopolymer Composites
Geopolymer composites (AGW-Gs) were prepared using the same fractions (0.16–0.25 mm, 0.4–0.63 mm, 1.25–2 mm and 2–5 mm) as those used to monitor the effect of the alkaline solution on AGW particles.
The geopolymer solids prepared (Figures S7 and S8 of the Supplementary Files) were studied mainly in terms of the geopolymer composition, bonds formed (FTIR spectroscopy), the microstructure, the effect of the geopolymer reaction on the glass-waste particles (SEM), and the effect of solidification on the release of organics (GC/MS) as a function of the fraction used. In addition, indicative compressive strength was determined.
3.3.1. X-ray Fluorescence Analysis
The chemical composition of geopolymer samples (Table 6) is very similar and corresponds to the composition of the raw materials from which the geopolymer was prepared (Table 1 and Table 4). AGW1-G and AGW2-G samples contain a high percentage of SiO2 (51.53 wt.% and 50.83 wt.%) and Al2O3 (19.88 wt.% and 20.68 wt.%), respectively. The increased concentration of Bi in AGW2-G correlates with the higher content identified in AGW2.
3.3.2. FTIR Analysis
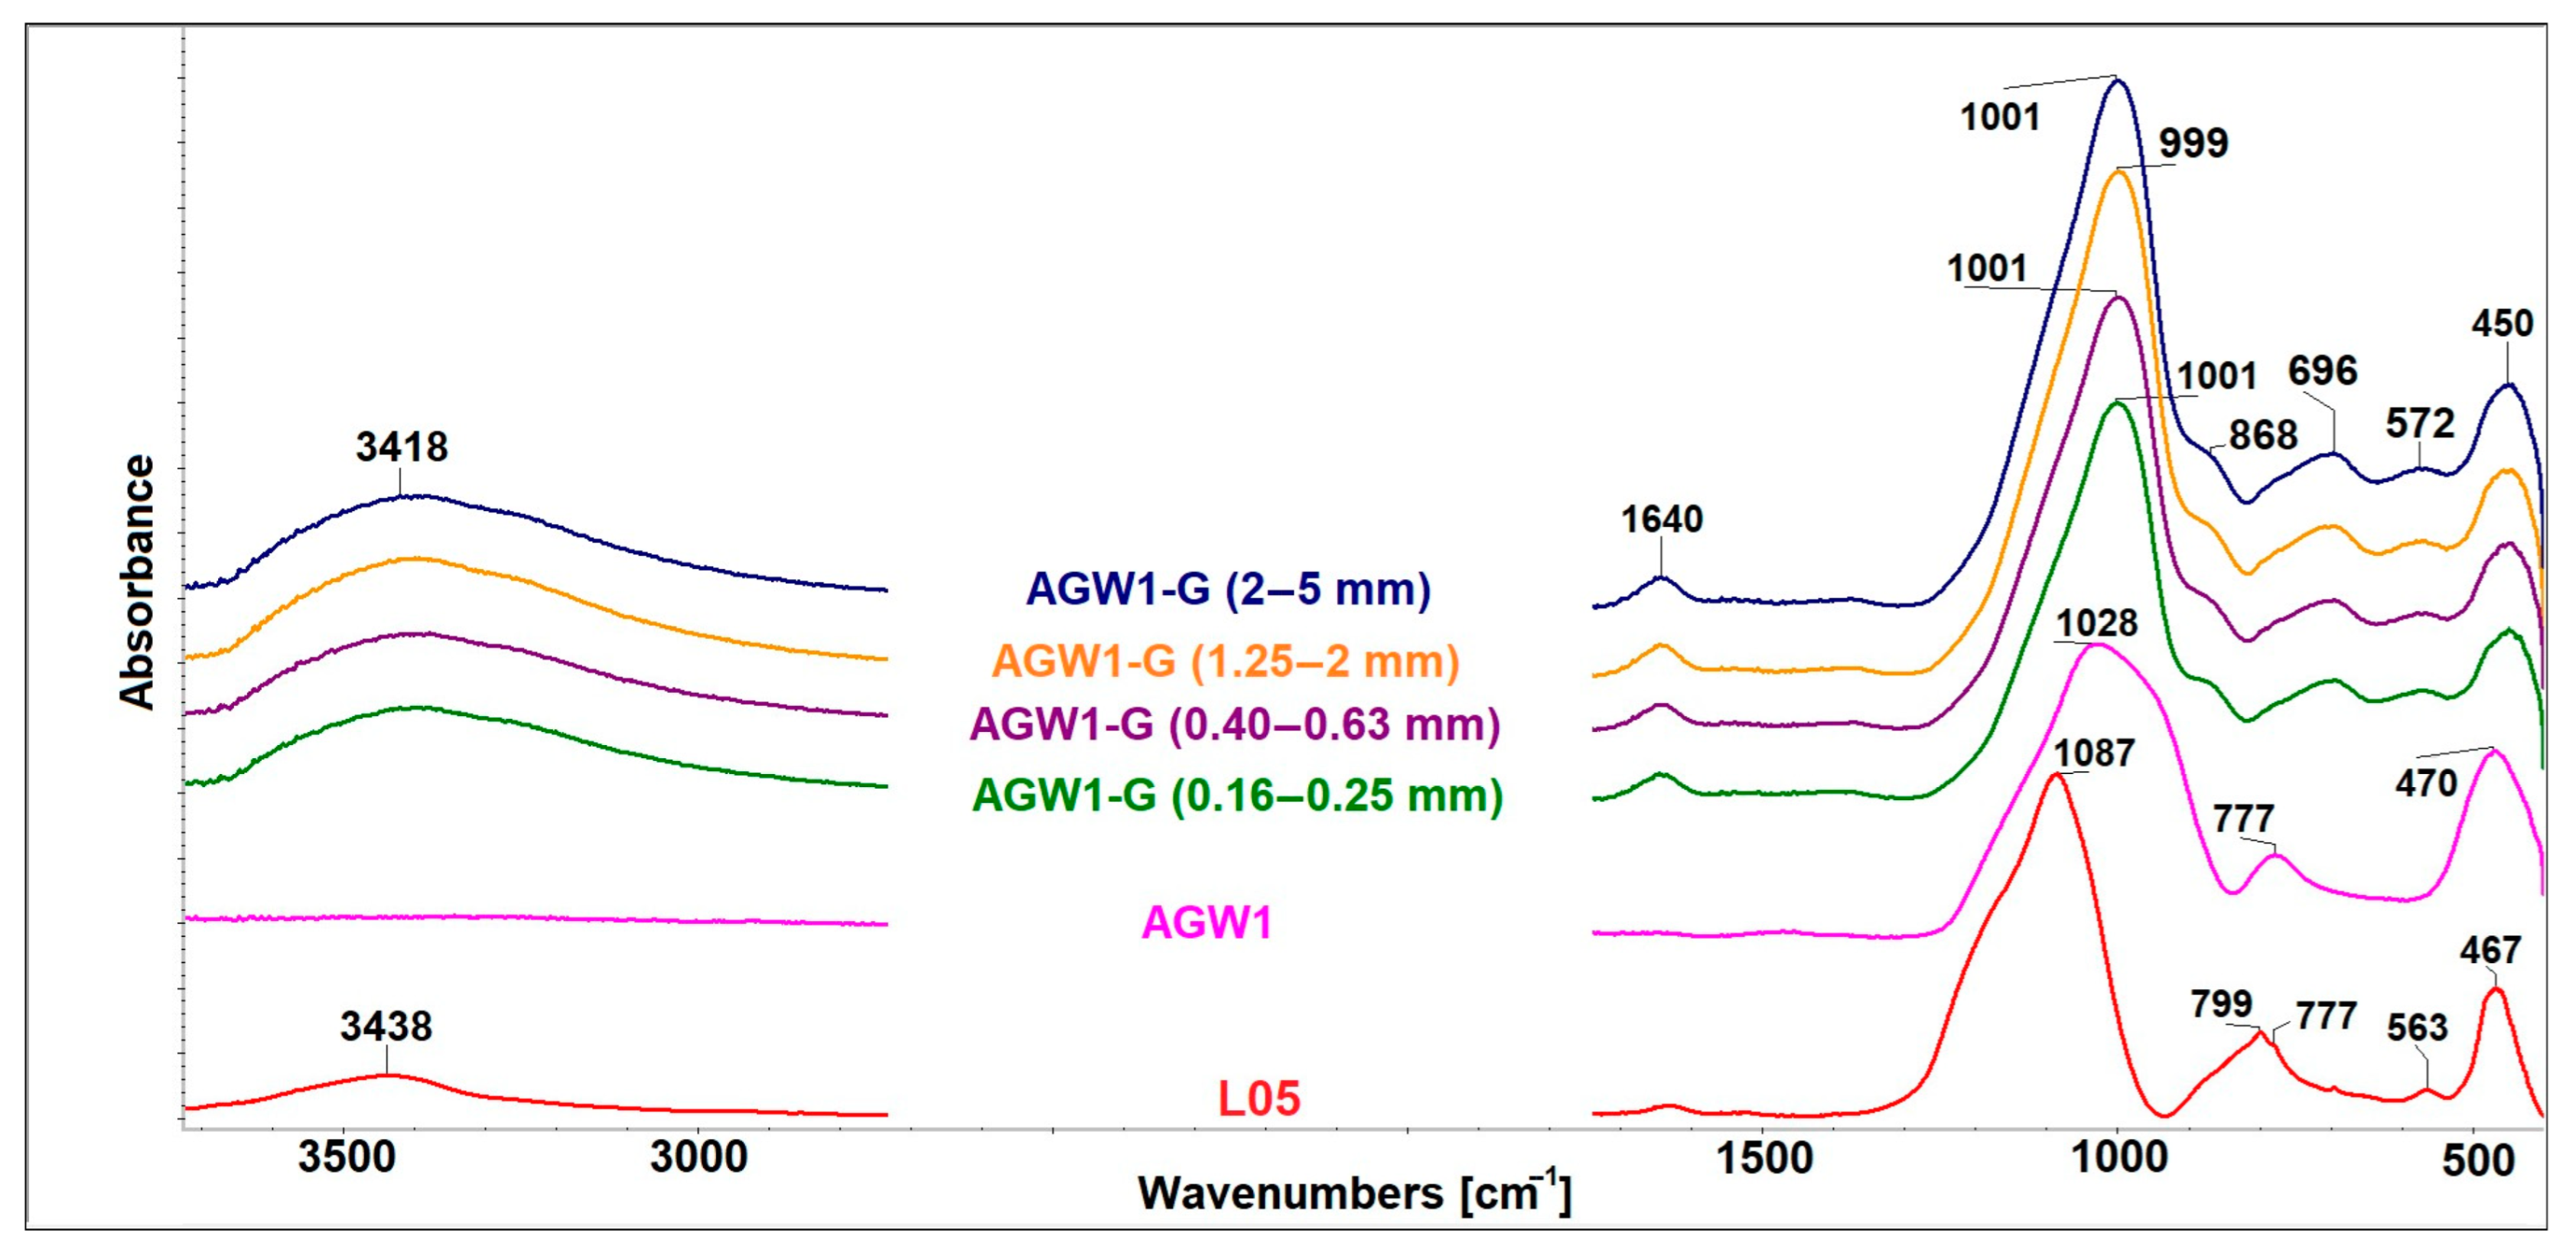
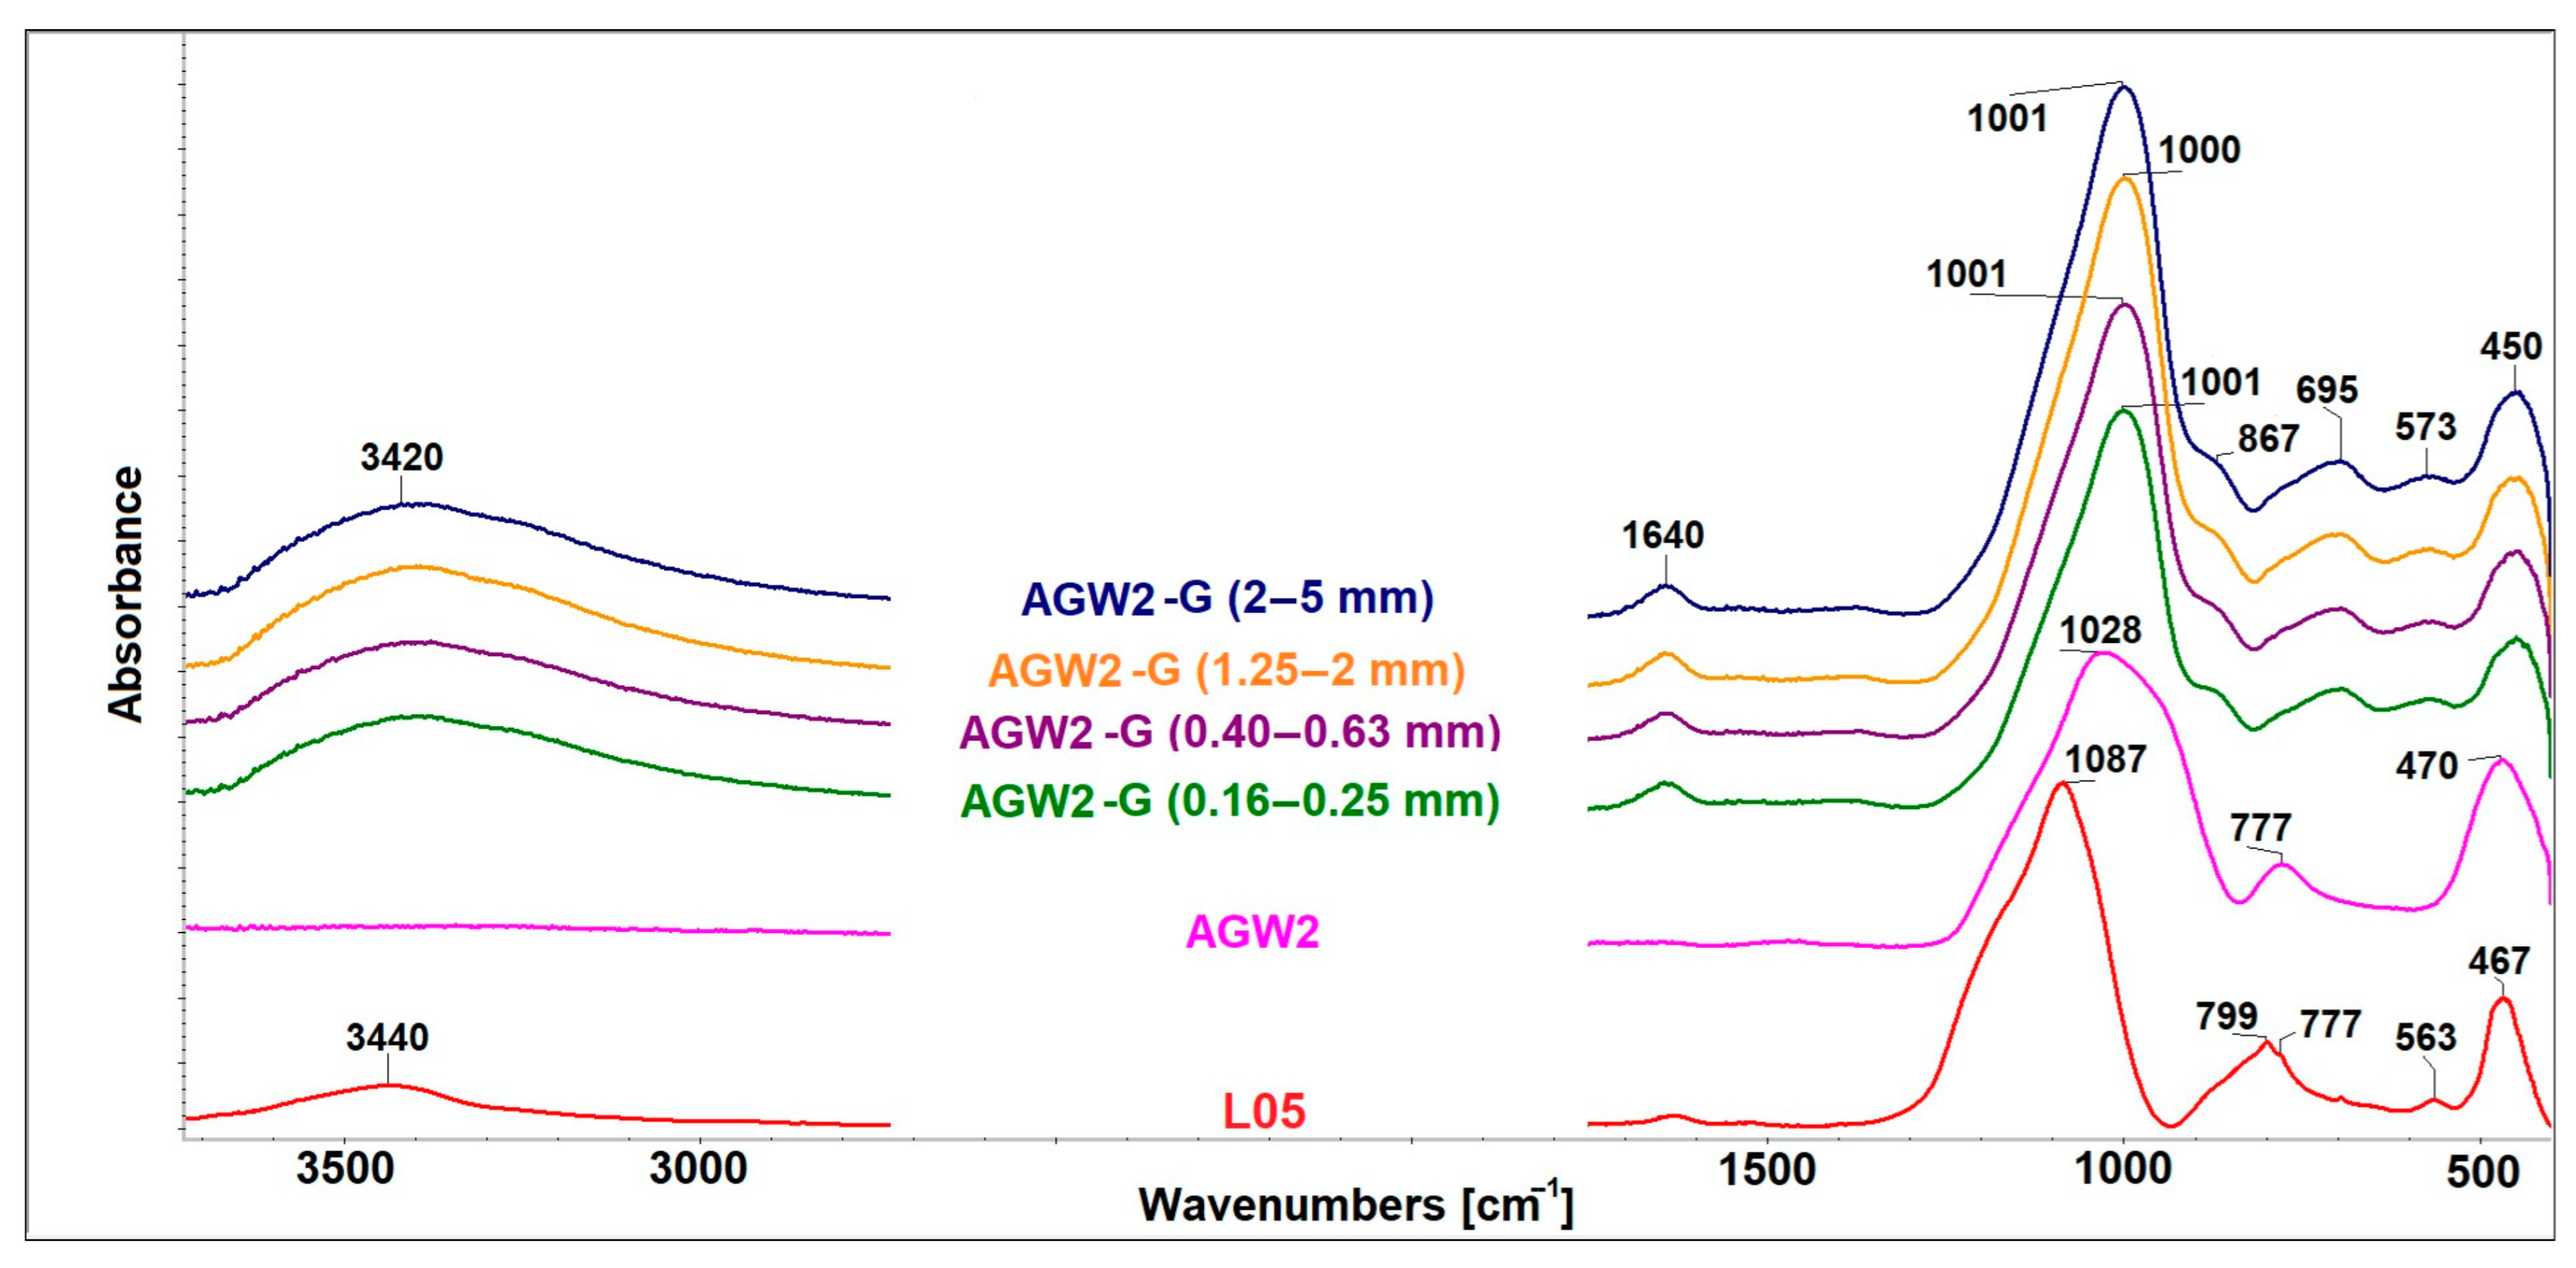
The FTIR spectra of the geopolymer material with variable grain size and a comparison with the clay material and glass waste are provided in Figure 6 for the AGW1-G series and in Figure 7 for the AGW2-G series.
The FTIR spectra of both types of glass waste (AGW1 and AGW2) are identical and contain a broad, intense band in the spectral region of 1240–840 cm−1, corresponding to the Si-O in asymmetric stretching vibrations (ν3) in the SiO4 tetrahedra. Another band, at 450–470 cm−1, is ascribed to the O-Si-O bending vibrations (ν4) in the SiO4 tetrahedra [57]. The weak band in the region of 720–840 cm−1 is attributed to the Si–O–Si symmetric stretching vibrations of the bridging oxygens between the SiO4 tetrahedra [58].
The metakaolin-based clay material contains bands attributed to the asymmetric stretching and bending vibrations of Si–O and the asymmetric stretching of Si–O–Al groups, visible at 1087 cm−1 and ~780 cm−1. The band with more distinctive features at 799 and 777 cm−1 and another at 467 cm−1 may be attributed to quartz [57], which is present in L05 as a minor impurity. The spectral shoulder at ~560 cm−1 is attributable to silicates and/or aluminosilicates with a long-range structural order [59].
The reaction of L05 with an alkaline activator leads to an increase in the substitution of the tetrahedral Al in the silicate network in the geopolymer matrix. This process is manifested by a spectral shift of the principal band, located at 1087 cm−1 in the L05 spectrum, to lower wave numbers (~1000 cm−1) in the spectra of the geopolymer materials [60]—see Figure 6 and Figure 7. Slight changes in wavenumber positions in the individual spectra of geopolymer materials (999–1001 cm−1) are within the resolution limit of the method (up to 4 cm−1). New weak bands positioned at around 866–867 cm−1 and 695–696 cm−1 can be ascribed to the bending vibration mode of Si-OH [61] and to the stretching and bending vibrations of Si-O-Al, respectively, providing another fingerprint for the formation of the geopolymer structure [62].
The spectra of L05 and geopolymer materials also contain a large peak at 3440 and 3420 cm−1 and a peak centered at 1640 cm−1, which are associated with the stretching and bending modes of OH groups in water molecules due to the residual water and moisture content in the materials [62].
Spectroscopically, all final geopolymer materials (of both the AGW1-G and AGW2-G series) are identical. FTIR analysis has proven that the grain size of waste glass does not affect its final structural properties or phase changes.
3.3.3. Scanning Electron Microscope Structure Study
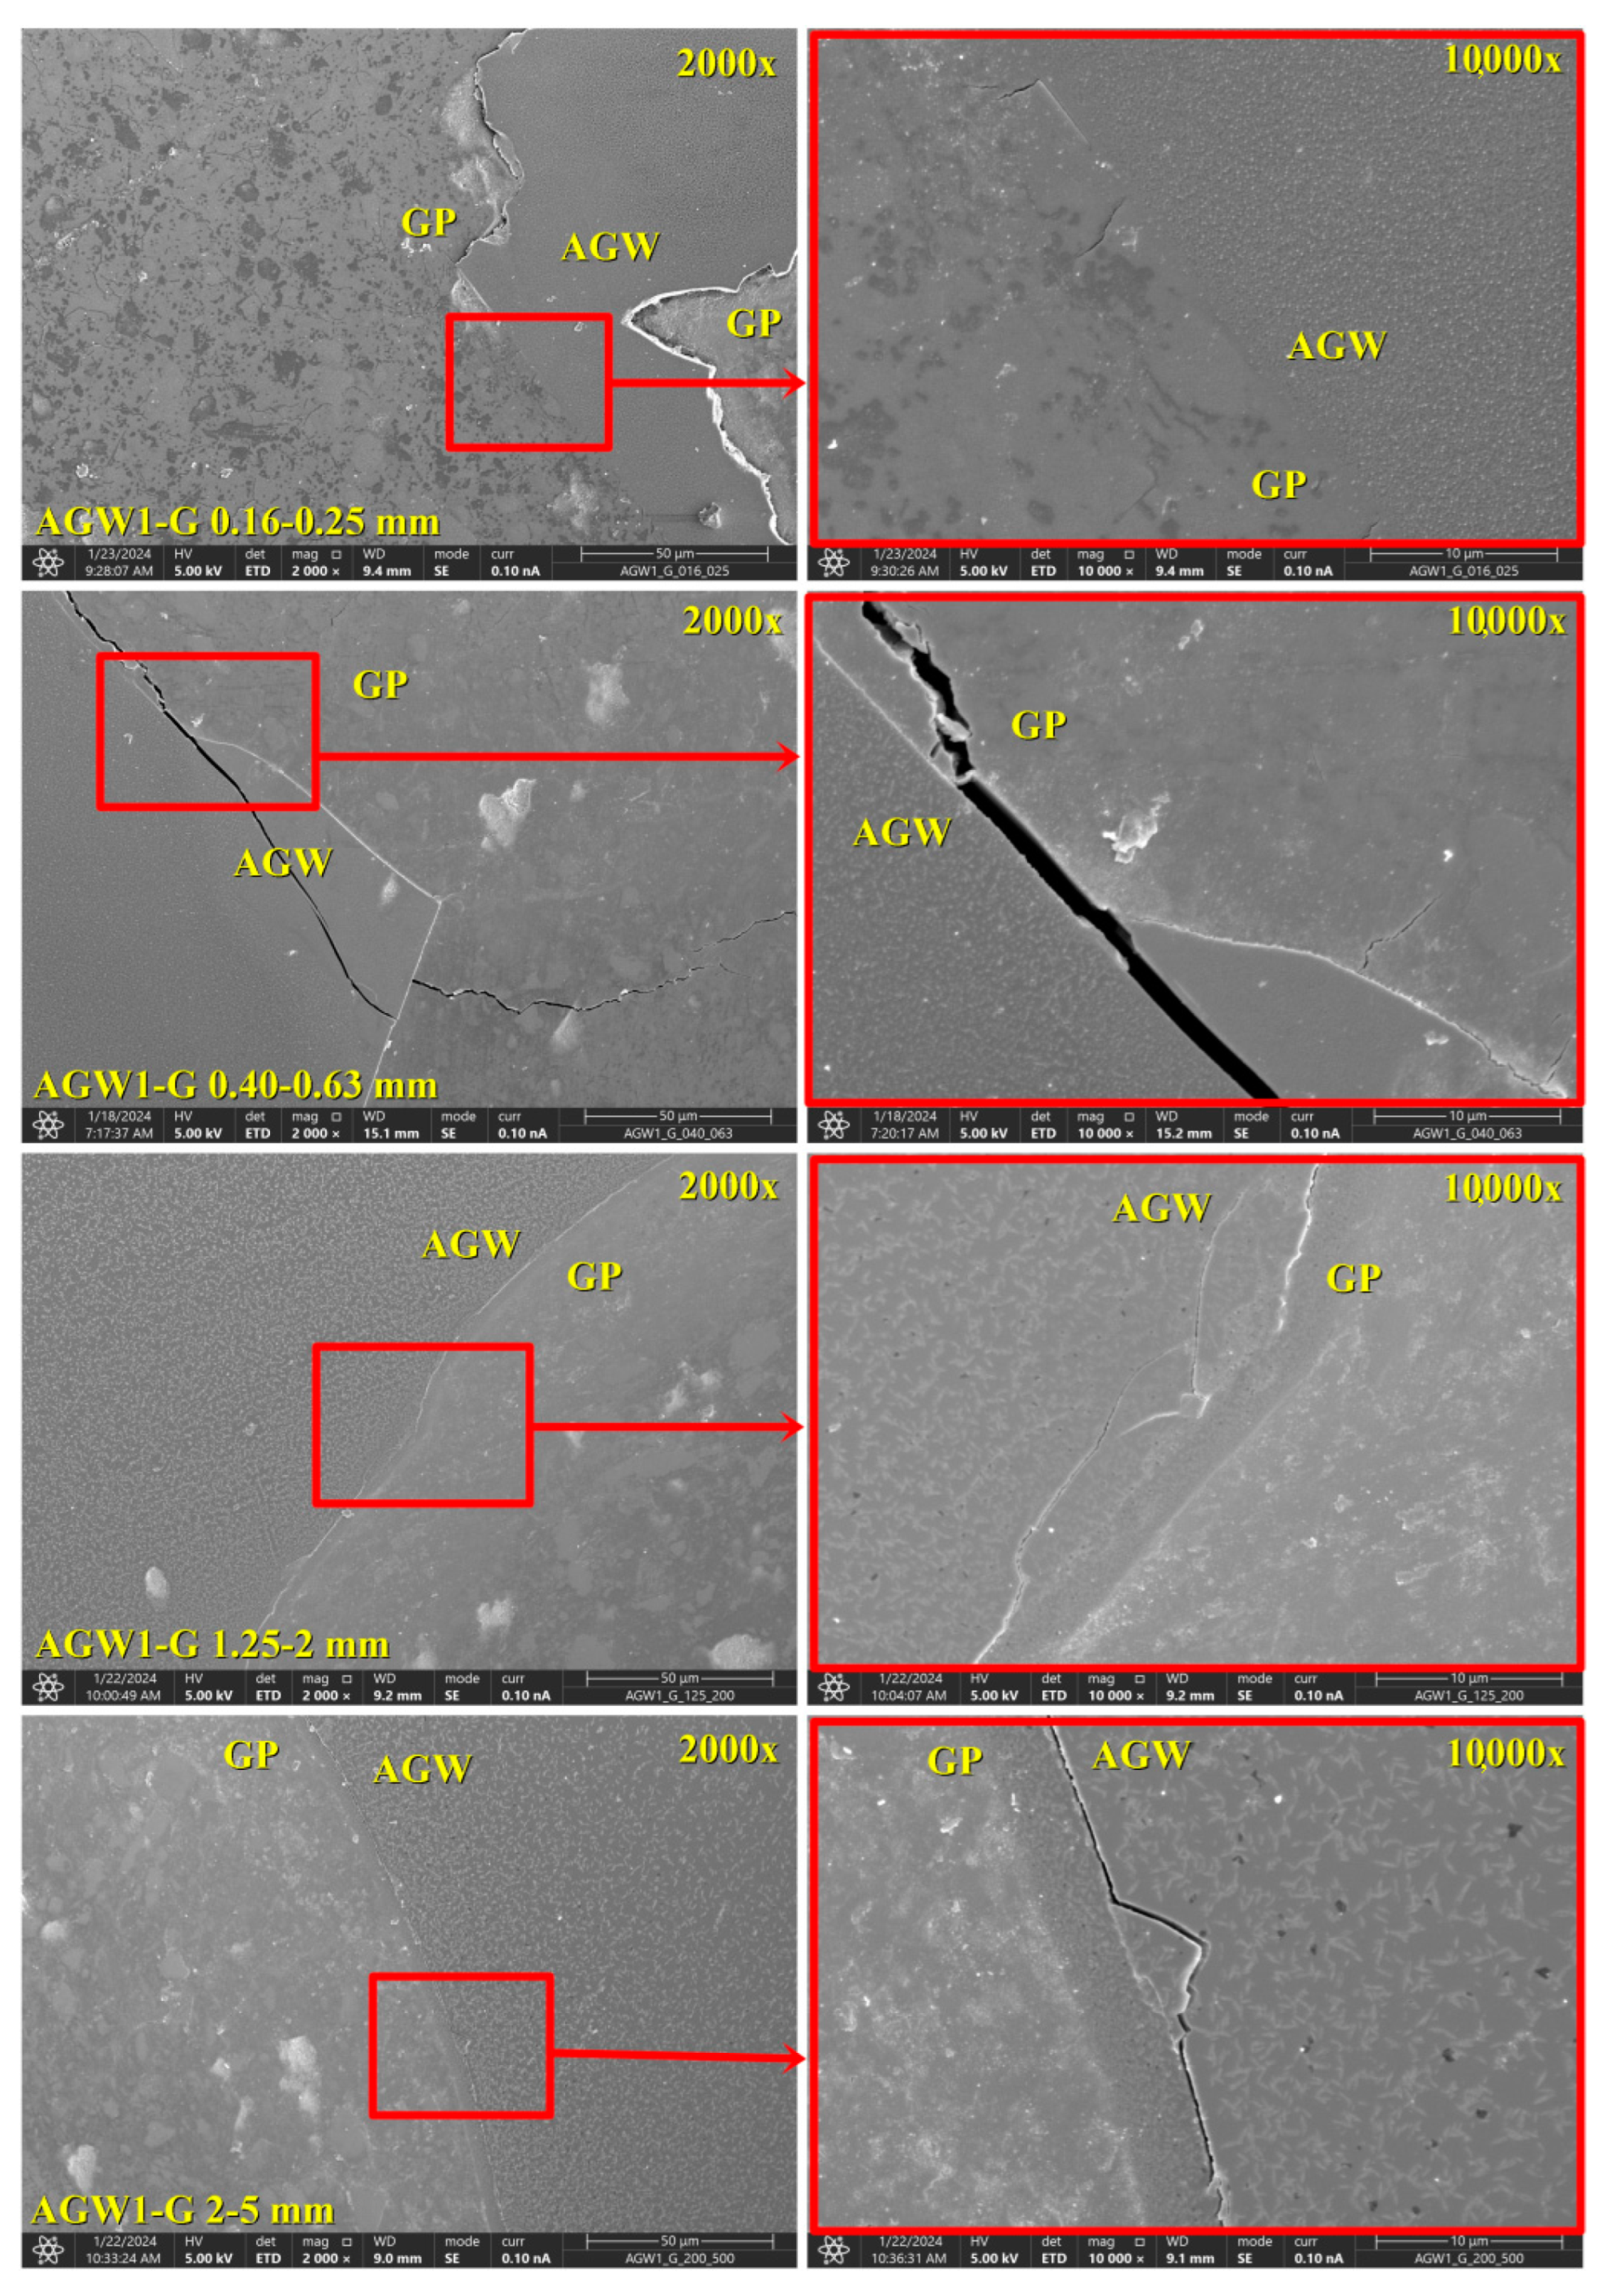
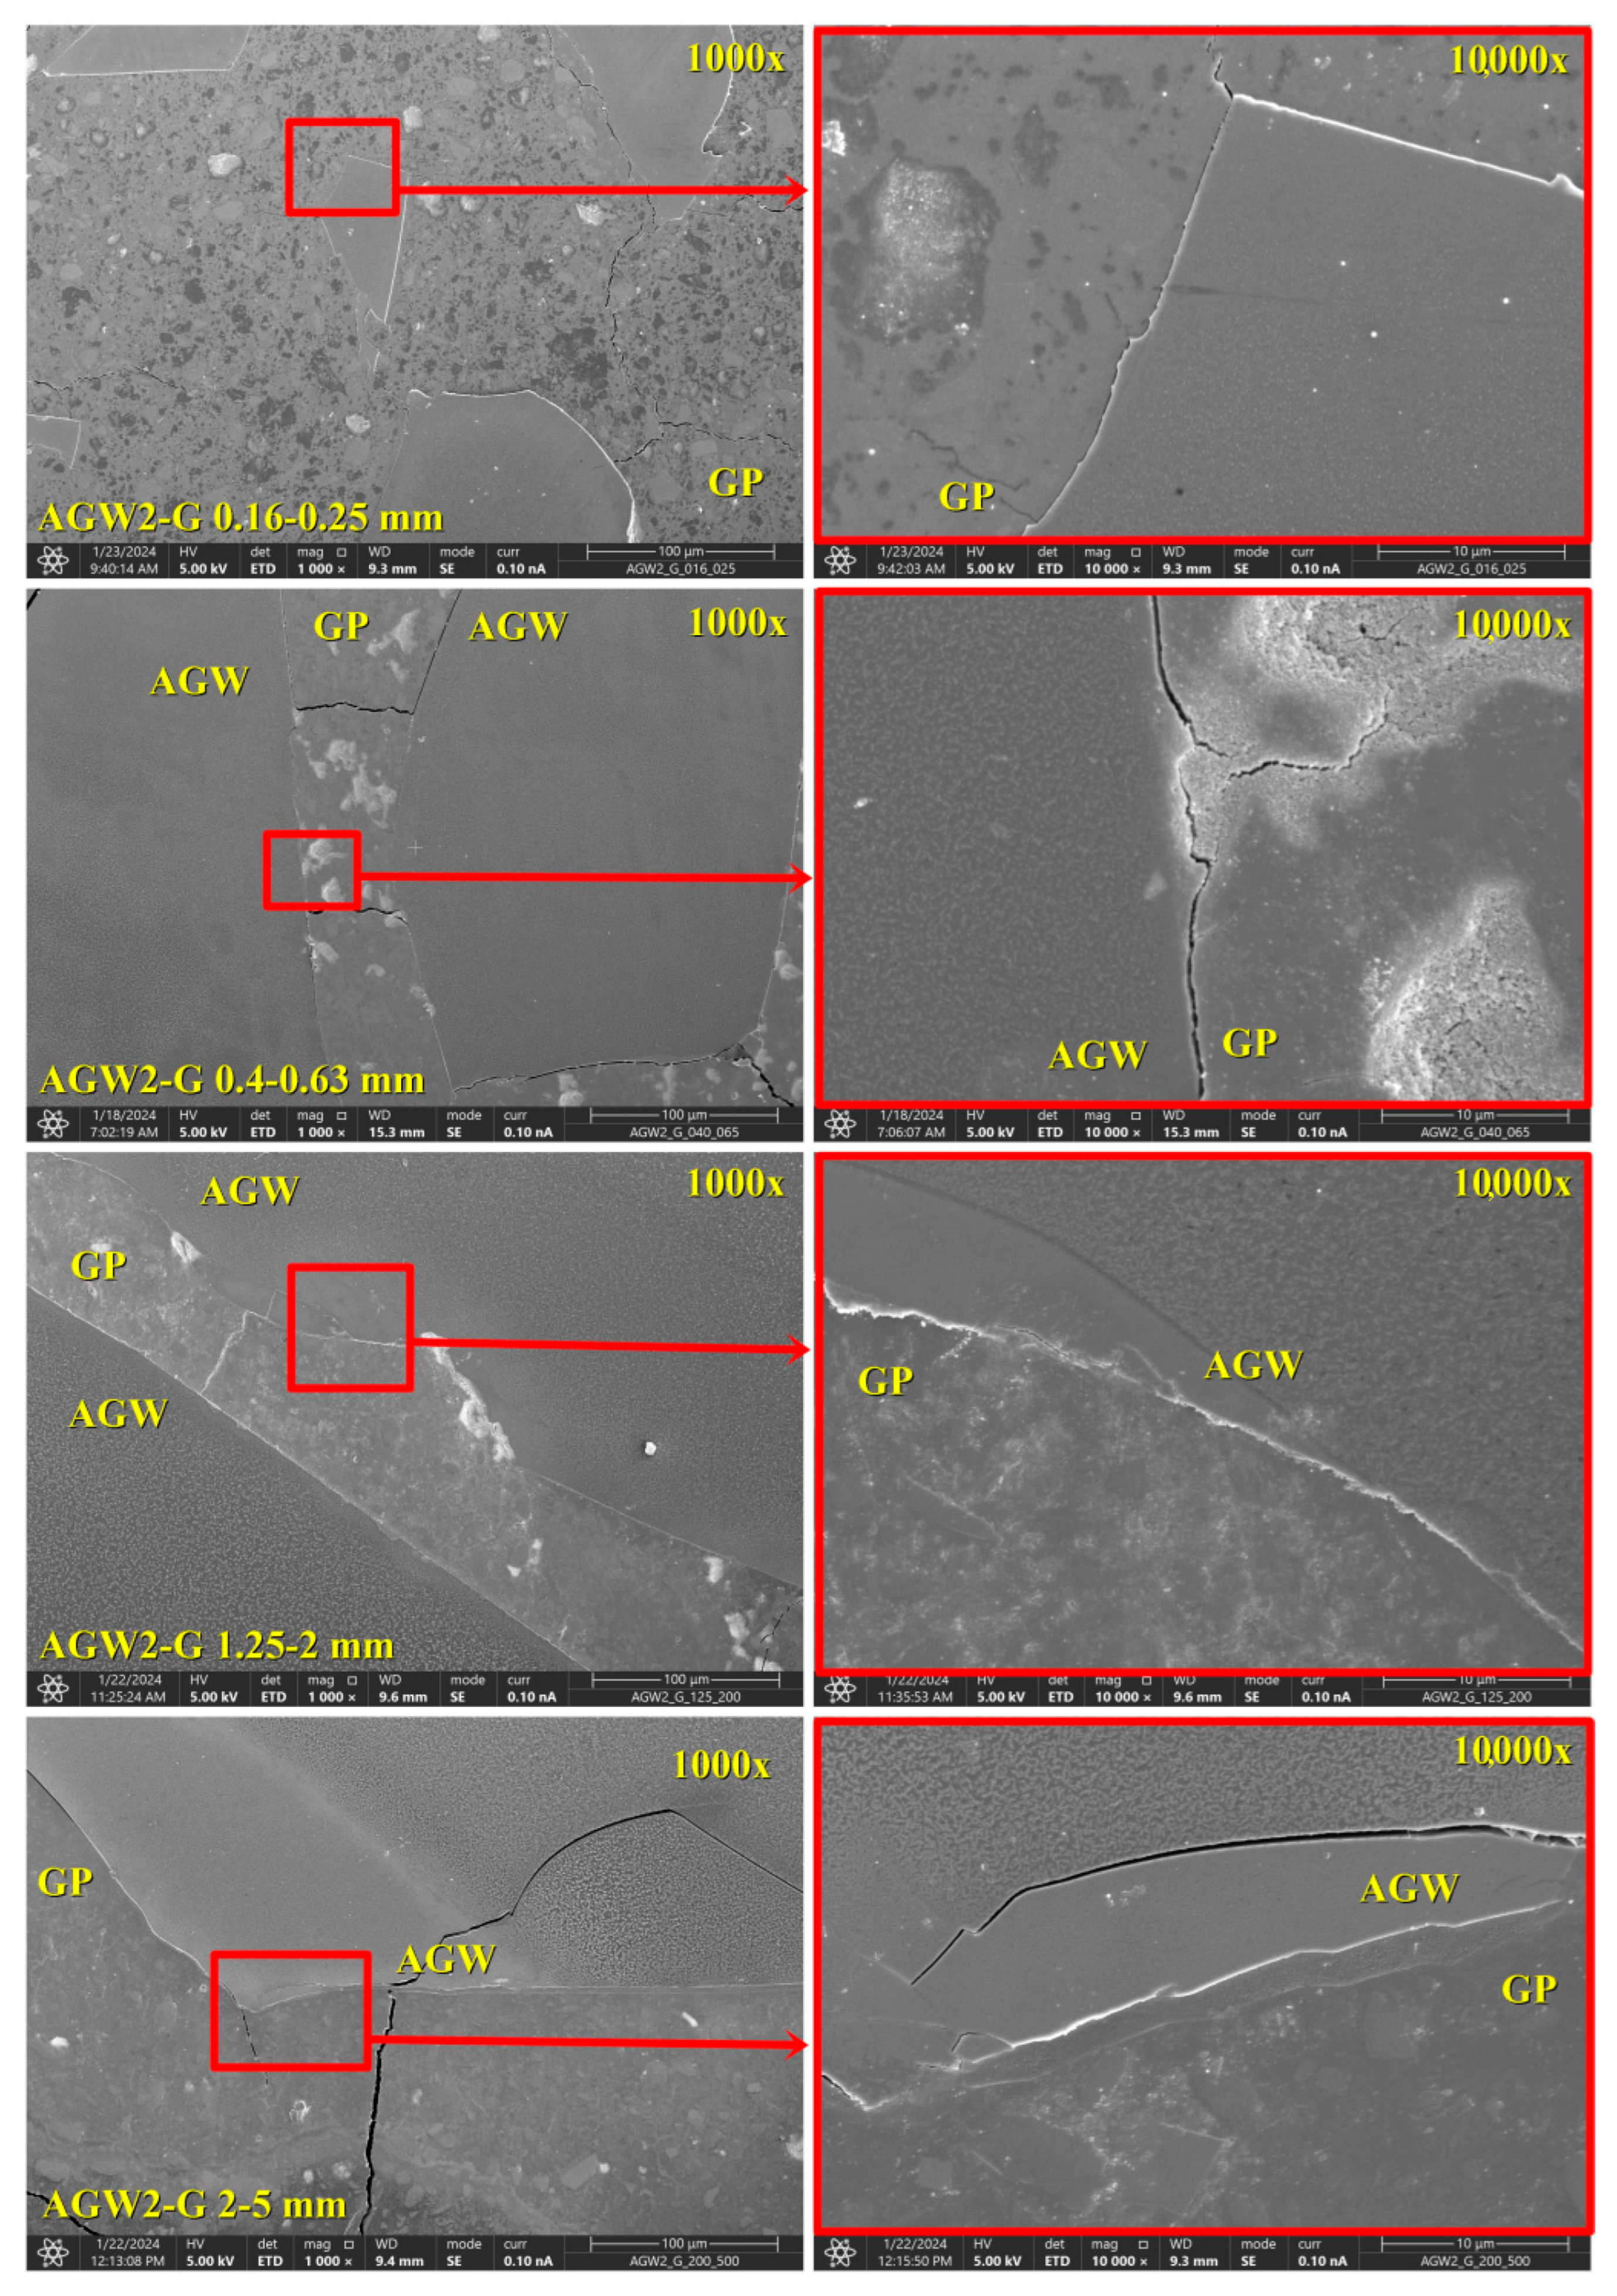
The SEM images of the geopolymer composites containing different fractions of AGW1 and AGW2 (AGW1-Gs and AGW2-Gs, respectively) are presented in Figure 8 and Figure 9, respectively. The glass waste is more compact and homogeneous than the geopolymer matrix.
In general, the geopolymer composites are very similar according to SEM investigations. No degradation of the glass is evident, as was the case of the glass after exposure to the alkaline solution (Figure 4 and Figure 5). The composites are stable without significant signs of degradation. Only in the case of 0.40–0.63 mm AGW2, a slight surface distortion in the geopolymer is visible.
In most cases, the geopolymer/AGW interface shows good adhesion of the geopolymer to the AGW. In certain images within Figure 8 (0.40–0.63 mm and 2–5 mm AGW1-G), it is evident that microcracks have developed, likely either during the geopolymer maturation process or during the preparation of the polished blocks. The crack runs through the AGW particles, indicating a relatively strong bond between the geopolymer and the glass waste. A similar phenomenon also occurs in the second type of glass waste (Figure 9, 2–5 mm AGW2-G). Microcracks are further visible in the geopolymer matrix even in areas with the predominance of AGW particles, where the geopolymer is almost closed between them, for example 0.40–0.63 mm and 1.25–2 mm AGW1-G. In some composites, there is a visible interlayer, particularly noticeable in the larger particles of both AGWs (1.25–2 mm and 2–5 mm), implying potential ion transfer between the materials. Interlayer formation has also been observed at interfaces between geopolymers and glass particles or other materials [36,63,64].
3.3.4. Gas Chromatography/Mass Spectrometry Analysis
The extraction yields of both AGW-G geopolymer composites were low for all fractions (0.01–0.04 wt.%) and comparable with AGW extraction yields. The GC/MS analysis of the AGW-G extracts confirmed the presence of triethylene glycol bis(2-ethylhexanoate), with the determined concentrations ranging from 0.0 to 6.4 ng·kg−1.
The results (Table 7) demonstrate the presence of triethylene glycol bis(2-ethylhexanoate) in both types of geopolymer composites. Like in the case of AGW1, the effect of particle size is not evident for the AGW1-G composite either, with concentration values ranging from 0.7 ng·kg−1 for the 0.4–0.63 mm fraction to 4.1 ng·kg−1 for the 2–5 mm fraction. In AGW2-G composites, on the other hand, the effect of particle size is visible (with the values ranging from 0.0 ng·kg−1 for the 2–5 mm fraction to 6.4 ng·kg−1 for the 0.16–0.25 mm fraction), which is consistent with the trend of AGW2 results.
Nevertheless, it should be considered that the geopolymer composite contains only 35% of AGW. If we take only 35% of the values shown in Table 4 (AGW1—4.4 ng·kg−1, 3.0 ng·kg−1, 4.0 ng·kg−1 and 4.7 ng·kg−1 and AGW2—8.6 ng·kg−1, 1.3 ng·kg−1, 4.8 ng·kg−1 and 0.1 ng·kg−1 for the fractions of 0.16–0.25 mm, 0.4–0.63 mm, 1.25–2 mm and 2–5 mm, respectively), we obtain values comparable with the results in Table 7.
The evaluation shows that the incorporation of AGW particles into the geopolymer matrix reduces the release of triethylene glycol bis(2-ethylhexanoate) from both types of geopolymer composites, especially in the case of 0.4–0.63 mm particles.
3.3.5. Compressive Strength
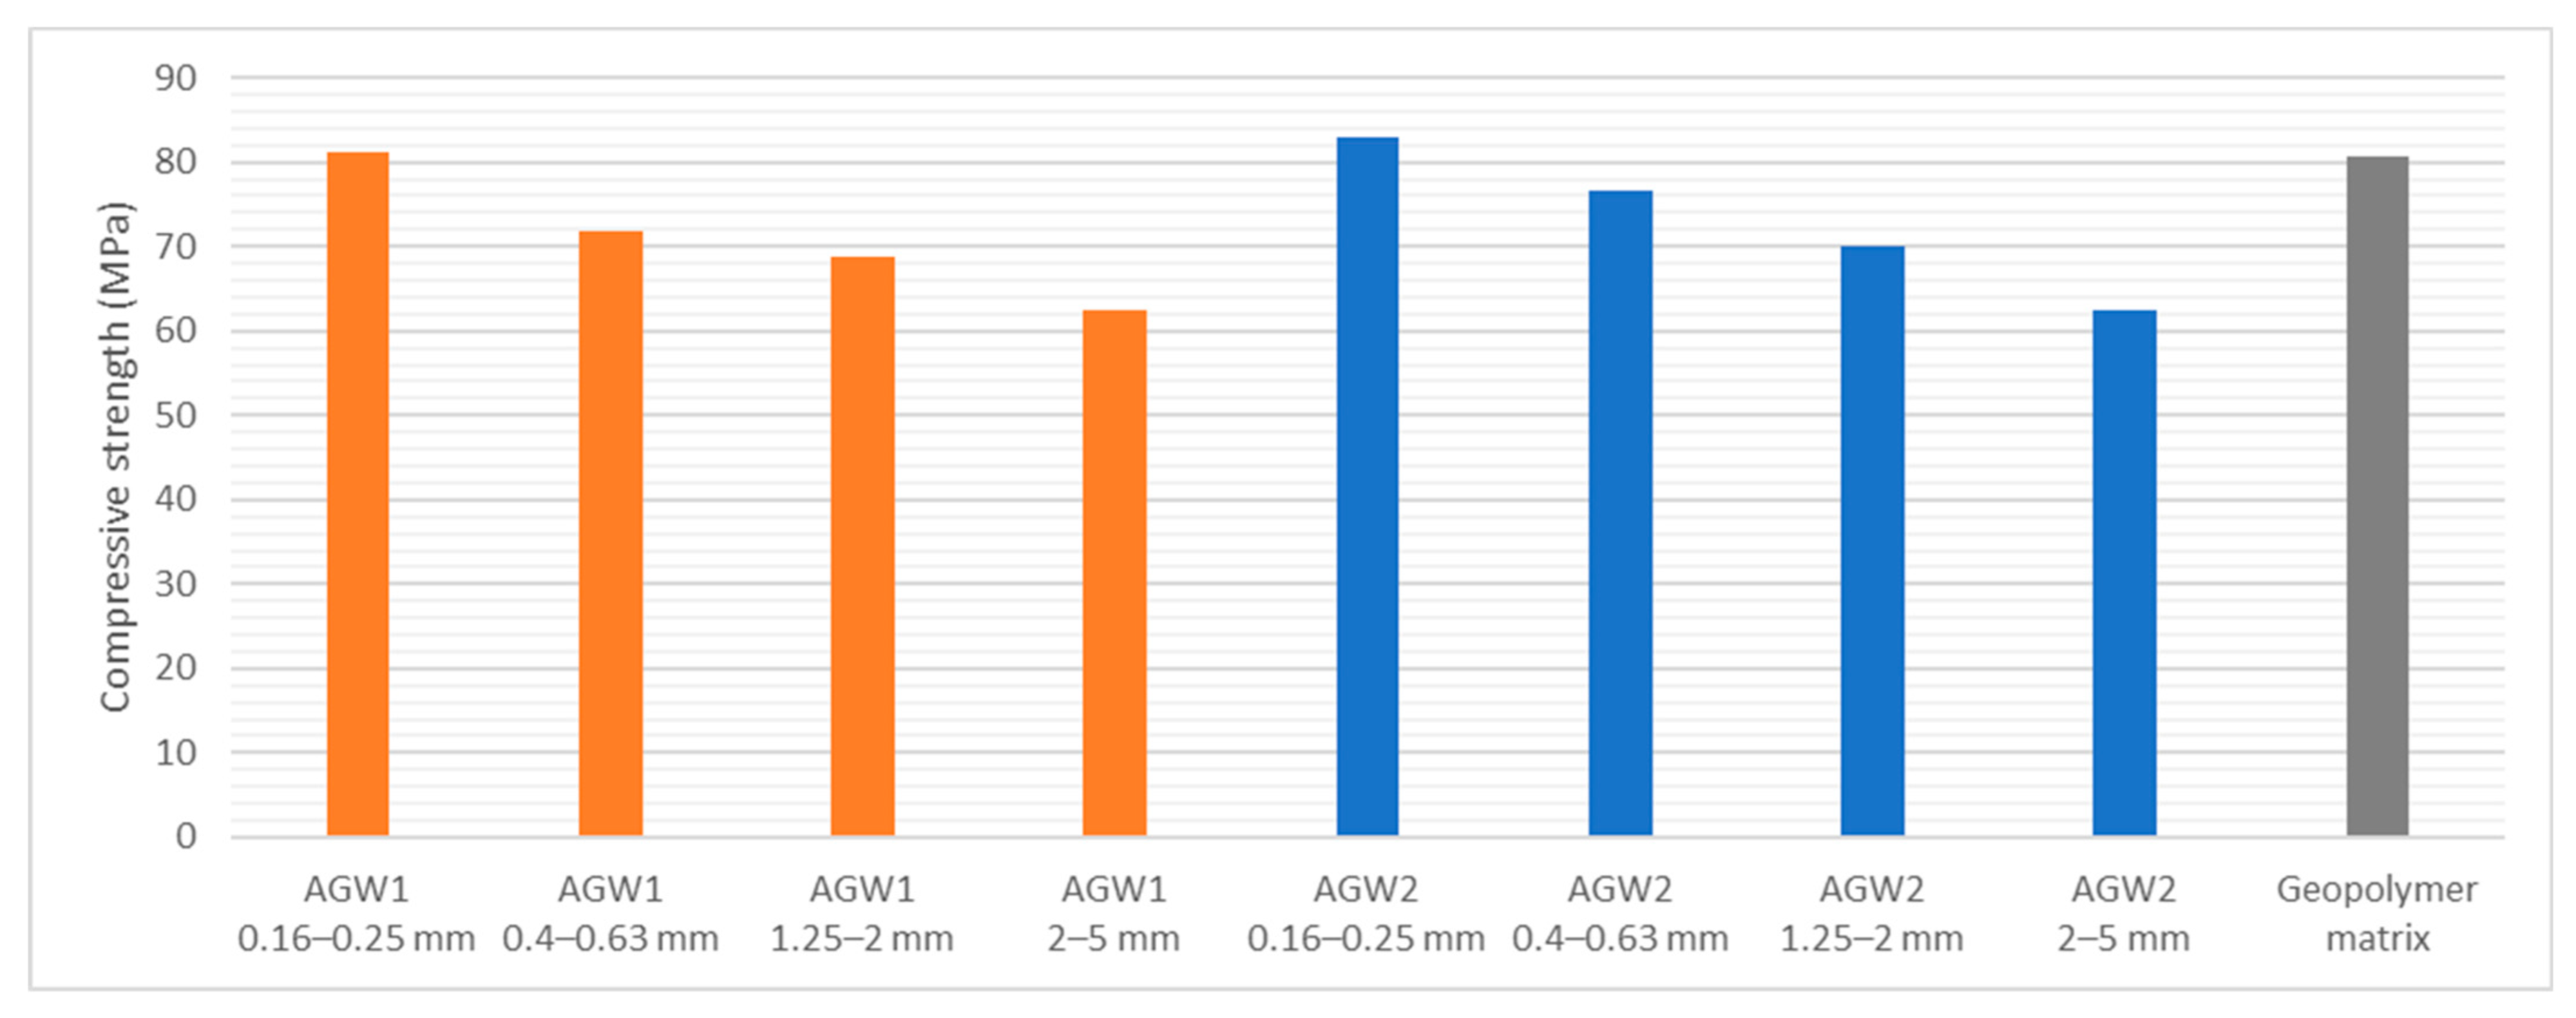
For the estimation of mechanical properties, the compressive strength was determined only tentatively at 28 days for a ratio of 100 g of the geopolymer matrix and 40 g of the waste-glass fraction (see Sample Preparation). The results are shown in the graph (Figure 10). The pure geopolymer matrix serves as a blank sample (without aggregates).
The results show that geopolymer composites with the addition of AGW have sufficient mechanical properties. The 28-day compressive-strength values reach up to 81.3 MPa and 82.8 MPa for the finest fractions (0.16–0.25 mm) of AGW1 and AGW2, respectively. There is a noticeable trend for both types of glass waste where the compressive strength decreases with the increasing particle size of the glass waste. A similar decrease in compressive strengths has been observed by several authors, but in their case, AGW particles were applied as a partial replacement for sand aggregate in geopolymer [43,45]. It can be assumed that the filling for other fractions was not optimal, especially for the larger fractions, where sedimentation of the particles occurred. On the other hand, for the fraction of 0.16 to 0.25 mm whose content in the geopolymer matrix is almost optimal, the compressive strengths slightly exceed the strength of the geopolymer matrix (80.6 MPa), which is in agreement with the work of Srivastava et al. and Hajimohammadi et al. [42,46]. By optimizing the AGW content or by using a combination of several AGW fractions, possibly in combination with another type of filler, it would probably be possible to achieve higher values of mechanical properties.
The main aim of this paper was to verify the possibility of using AGW as an alternative aggregate in a geopolymer matrix. Due to the composition of AGW, which includes organic safety films and heating elements, it was first necessary to characterize the AGW materials (AGW1 and AGW2) and determine the effect of an alkaline environment. Furthermore, the influence of the fractions used, both of the AGW itself and of the AGW incorporated in the geopolymer matrix, was also investigated.
Direct exposure to an alkaline solution partially degrades AGW particles. However, because of the setting time of the geopolymer matrix (from 2 to 12 h) [65], there is no long-term exposure of AGW particles to alkaline environments. Therefore, the deterioration of these particles is minor. It is possible to assume that this phenomenon is part of the glass particle dissolution process described by several authors [38,39,40,42] but due to the larger particle size, only partial degradation occurred.
AGW materials have been found to comprise mainly triethylene glycol bis(2-ethylhexanoate), originating from the contained safety films, which may be further released into the environment. GC/MS analysis has confirmed that the addition of AGW to the geopolymer matrix has lowered the release of triethylene glycol bis(2-ethylhexanoate).
The decline in the concentration of triethylene glycol bis(2-ethylhexanoate) in geopolymer composites may stem from the incorporation of this organic substance into the structure of the geopolymer because geopolymers are able to form hybrid bonds with organic substances (hybrid organic–geopolymer materials), as described by Reeb et al. [66]. Another possibility is the degradation within the alkaline environment of the geopolymer matrix [67]. Nevertheless, no byproducts of this degradation have been identified.
The effect of particle size is more evident in AGW2, where the concentration of triethylene glycol bis(2-ethylhexanoate) decreases with increasing particle size in both AGW2 and AGW2-G. The exception is the 0.4–0.63 mm fraction, where the concentrations are lower than would be expected for both types of glass waste.
The determination of the AGW1-G and AGW2-G mechanical properties showed relatively high 28-day compressive-strength values despite the non-optimal ratio of the geopolymer matrix to the aggregates for some fractions. In the case of larger particles, sedimentation occurred, which was evident in the geopolymer solids. It can also be assumed that finely ground AGW could be actively involved in the geopolymer reaction [42,68].
In view of the above, AGW materials can be considered potential alternative aggregates in metakaolin-based geopolymers, leading to a more efficient use of this non-recyclable material.
4. Conclusions
This paper has studied the possibility of using automotive glass waste as an alternative aggregate for geopolymer materials. The results have led to the following conclusions:
The effective utilization of AGW as an alternative aggregate in the production of geopolymer composites has resulted in solid, resilient materials that are insoluble in water.
FTIR analysis has demonstrated that the use of AGW materials does not affect the formation of geopolymer bonds.
It has been confirmed by GC/MS analysis that in the case of AGW1, the particle size used does not affect the release of triethylene glycol bis(2-ethylhexanoate) except for the 0.4–0.63 mm fraction, where its concentration was significantly lower than in the other fractions.
In the case of AGW2, which contains a heating element in addition to the safety film, the release of triethylene glycol bis(2-ethylhexanoate) has been found to be partially dependent on the size of the fractions used, both of the AGW itself and of the AGW incorporated in the geopolymer matrix.
The results have shown that the incorporation of AGW into the geopolymer matrix slightly reduces the release of triethylene glycol bis(2-ethylhexanoate).
Preliminary mechanical-property tests have demonstrated the potential of AGW-G composites. However, further research will be required to optimize the content ratios and fractions of the AGW materials used.
It can thus be assumed that AGW materials can be utilized as alternative aggregates. The use of this waste material (AGW) in geopolymer materials saves primary raw materials, thereby reducing the amount of landfill waste, which is in accordance with the EU environmental strategy.
Supplementary Materials
The following supporting information can be downloaded at: https://www.mdpi.com/article/10.3390/app14083439/s1, Figure S1: Automotive glass waste used (A and B—general and detailed view on windscreen with protective film, C and D—general and detailed view on windscreen with protective film and heat elements); Figure S2: Windscreen cutting (A—general view, B—detailed view); Figure S3: The photographs of AGW1 glass fractions; Figure S4: The photographs of AGW2 glass fractions; Figure S5: Photographs of the extracts prepared for GC analysis; Figure S6. An overview of different AGW fractions (10,000× magnification); Figure S7. Photographs of the AGW1-G solids; Figure S8. Photographs of the AGW2-G solids.
Author Contributions
Conceptualization: I.P.; methodology: I.P., M.H., M.Š., M.Ž. and O.B.; formal analysis: I.P., M.H., M.Š., M.Ž. and O.B.; investigation: I.P., M.H., M.Š., M.Ž. and O.B.; data curation: I.P.; writing—original draft preparation: I.P.; writing—review and editing: I.P., M.H., M.Š., M.Ž. and O.B.; supervision, I.P. All authors have read and agreed to the published version of the manuscript.
Funding
This work has been carried out thanks to the support of the long-term project for the conceptual development of the research organization No. 67985891 and the Strategy AV21, activity of the Czech Academy of Sciences, the research program VP23—City as a Laboratory of Change: Historical Heritage and Place for Safe and Quality Life.
Data Availability Statement
The raw data supporting the conclusions of this article will be made available by the authors on request.
Conflicts of Interest
The authors declare no conflicts of interest.
References
- Eurostat Statistics Explained. Recycling—Secondary Material Price Indicator. [Online]. Available online: http://ec.europa.eu/eurostat/statistics-explained/index.php/Recycling_%E2%80%93_secondary_material_price_indicator (accessed on 12 January 2024).
- Blengini, G.A.; Busto, M.; Fantoni, M.; Fino, D. Eco-Efficient Waste Glass Recycling: Integrated Waste Management and Green Product Development through LCA. Waste Manag. 2012, 32, 1000–1008. [Google Scholar] [CrossRef] [PubMed]
- Akinwumi, I.I.; Booth, C.A.; Ojuri, O.O.; Ogbiye, A.S.; Coker, A.O. Containment of Pollution from Urban Waste Disposal Sites. In Urban Pollution; Wiley: Hoboken, NJ, USA, 2018; pp. 223–234. [Google Scholar]
- Pant, D.; Singh, P. Pollution Due to Hazardous Glass Waste. Environ. Sci. Pollut. Res. 2014, 21, 2414–2436. [Google Scholar] [CrossRef] [PubMed]
- Butler, J.H.; Hooper, P.D. Glass Waste. In Waste: A Handbook for Management; Academic Press: Cambridge, MA, USA, 2019; pp. 307–322. [Google Scholar] [CrossRef]
- Musgraves, J.D.; Hu, J.; Calvez, L. (Eds.) Springer Handbook of Glass; Springer: Cham, Switzerland, 2019. [Google Scholar]
- Wu, Y.; Lu, B.; Bai, T.; Wang, H.; Du, F.; Zhang, Y.; Cai, L.; Jiang, C.; Wang, W. Geopolymer, Green Alkali Activated Cementitious Material: Synthesis, Applications and Challenges. Constr. Build. Mater. 2019, 224, 930–949. [Google Scholar] [CrossRef]
- Singh, N.B.; Kumar, M.; Rai, S. Geopolymer Cement and Concrete: Properties. Mater. Today Proc. 2019, 29, 743–748. [Google Scholar] [CrossRef]
- Elahi, M.M.A.; Hossain, M.M.; Karim, M.R.; Zain, M.F.M.; Shearer, C. A Review on Alkali-Activated Binders: Materials Composition and Fresh Properties of Concrete. Constr. Build. Mater. 2020, 260, 119788. [Google Scholar] [CrossRef]
- Amran, Y.H.M.; Alyousef, R.; Alabduljabbar, H.; El-Zeadani, M. Clean Production and Properties of Geopolymer Concrete; A Review. J. Clean. Prod. 2020, 251, 119679. [Google Scholar] [CrossRef]
- Ren, B.; Zhao, Y.; Bai, H.; Kang, S.; Zhang, T.; Song, S. Eco-Friendly Geopolymer Prepared from Solid Wastes: A Critical Review. Chemosphere 2021, 267, 128900. [Google Scholar] [CrossRef] [PubMed]
- Chowdhury, S.; Mohapatra, S.; Gaur, A.; Dwivedi, G.; Soni, A. Study of Various Properties of Geopolymer Concrete—A Review. Mater. Today Proc. 2021, 46, 5687–5695. [Google Scholar] [CrossRef]
- Perná, I.; Novotná, M.; Hanzlíček, T.; Šupová, M.; Řimnáčová, D. Metakaolin-Based Geopolymer Formation and Properties: The Influence of the Maturation Period and Environment (Air, Demineralized and Sea Water). J. Ind. Eng. Chem. 2024, 134, 415–424. [Google Scholar] [CrossRef]
- Reddy, D.V.; Edouard, J.-B.; Sobhan, K. Durability of Fly Ash-Based Geopolymer Structural Concrete in the Marine Environment. J. Mater. Civ. Eng. 2013, 25, 781–787. [Google Scholar] [CrossRef]
- Rashad, A.M. Insulating and Fire-Resistant Behaviour of Metakaolin and Fly Ash Geopolymer Mortars. Proc. Inst. Civ. Eng.-Constr. Mater. 2019, 172, 37–44. [Google Scholar] [CrossRef]
- Bakharev, T. Resistance of Geopolymer Materials to Acid Attack. Cem. Concr. Res. 2005, 35, 658–670. [Google Scholar] [CrossRef]
- Lee, N.K.; Lee, H.K. Influence of the Slag Content on the Chloride and Sulfuric Acid Resistances of Alkali-Activated Fly Ash/Slag Paste. Cem. Concr. Compos. 2016, 72, 168–179. [Google Scholar] [CrossRef]
- Hager, I.; Sitarz, M.; Mróz, K. Fly-Ash Based Geopolymer Mortar for High-Temperature Application—Effect of Slag Addition. J. Clean. Prod. 2021, 316, 128168. [Google Scholar] [CrossRef]
- Davidovits, J. Geopolymer Chemistry and Applications, 5th ed.; Institute Geopolymer: Saint-Quentin, France, 2020. [Google Scholar]
- Liew, Y.M.; Heah, C.Y.; Mohd Mustafa, A.B.; Kamarudin, H. Structure and Properties of Clay-Based Geopolymer Cements: A Review. Prog. Mater. Sci. 2016, 83, 595–629. [Google Scholar] [CrossRef]
- Rashad, A.M. Alkali-Activated Metakaolin: A Short Guide for Civil Engineer—An Overview. Constr. Build. Mater. 2013, 41, 751–765. [Google Scholar] [CrossRef]
- John, S.K.; Nadir, Y.; Girija, K. Effect of Source Materials, Additives on the Mechanical Properties and Durability of Fly Ash and Fly Ash-Slag Geopolymer Mortar: A Review. Constr. Build. Mater. 2021, 280, 122443. [Google Scholar] [CrossRef]
- Amer, I.; Kohail, M.; El-Feky, M.S.; Rashad, A.; Khalaf, M.A. A Review on Alkali-Activated Slag Concrete. Ain Shams Eng. J. 2021, 12, 1475–1499. [Google Scholar] [CrossRef]
- Perná, I.; Hanzlíček, T. The Solidification of Aluminum Production Waste in Geopolymer Matrix. J. Clean. Prod. 2014, 84, 657–662. [Google Scholar] [CrossRef]
- Perná, I.; Šupová, M.; Hanzlíček, T.; Špaldoňová, A. The Synthesis and Characterization of Geopolymers Based on Metakaolin and High LOI Straw Ash. Constr. Build. Mater. 2019, 228, 116765. [Google Scholar] [CrossRef]
- Ng, C.; Johnson Alengaram, U.; Sing Wong, L.; Hung Mo, K.; Zamin Jumaat, M.; Ramesh, S. A Review on Microstructural Study and Compressive Strength of Geopolymer Mortar, Paste and Concrete. Constr. Build. Mater. 2018, 280, 550–576. [Google Scholar] [CrossRef]
- Duxson, P.; Provis, J.L.; Lukey, G.C.; Mallicoat, S.W.; Kriven, W.M.; van Deventer, J.S. Understanding the Relationship between Geopolymer Composition, Microstructure and Mechanical Properties. Physicochem. Eng. Asp. 2005, 269, 47–58. [Google Scholar] [CrossRef]
- Fu, Q.; Xu, W.; Zhao, X.; Bu, M.; Yuan, Q.; Niu, D. The Microstructure and Durability of Fly Ash-Based Geopolymer Concrete: A Review. Ceram. Int. 2021, 47, 29550–29566. [Google Scholar] [CrossRef]
- Parathi, S.; Nagarajan, P.; Pallikkara, S.A. Ecofriendly Geopolymer Concrete: A Comprehensive Review. Clean Technol. Environ. Policy 2021, 23, 1701–1713. [Google Scholar] [CrossRef]
- Bai, T.; Song, Z.; Wang, H.; Wu, Y.; Huang, W. Performance Evaluation of Metakaolin Geopolymer Modified by Different Solid Wastes. J. Clean. Prod. 2019, 226, 114–121. [Google Scholar] [CrossRef]
- Novotná, M.; Perná, I.; Hanzlíček, T. Review of Possible Fillers and Additives for Geopolymer Materials. Waste Forum 2020, 2, 78–89. [Google Scholar]
- Tian, Q.; Bai, Y.; Pan, Y.; Chen, C.; Yao, S.; Sasaki, K.; Zhang, H. Application of Geopolymer in Stabilization/Solidification of Hazardous Pollutants: A Review. Molecules 2022, 27, 4570. [Google Scholar] [CrossRef] [PubMed]
- Rasaki, S.A.; Bingxue, Z.; Guarecuco, R.; Thomas, T.; Minghui, Y. Geopolymer for Use in Heavy Metals Adsorption, and Advanced Oxidative Processes: A Critical Review. J. Clean. Prod. 2019, 213, 42–58. [Google Scholar] [CrossRef]
- Khater, H.M.; El Naggar, A. Combination between Organic Polymer and Geopolymer for Production of Eco-Friendly Metakaolin Composite. J. Aust. Ceram. Soc. 2020, 56, 599–608. [Google Scholar] [CrossRef]
- Siddika, A.; Hajimohammadi, A.; Al Mamun, M.A.; Alyousef, R.; Ferdous, W. Waste Glass in Cement and Geopolymer Concretes: A Review on Durability and Challenges. Polymers 2021, 13, 2071. [Google Scholar] [CrossRef]
- Rios, L.M.H.; Hoyos Triviño, A.F.; Villaquirán-Caicedo, M.A.; Mejía De Gutiérrez, R. Effect of the Use of Waste Glass (as Precursor, and Alkali Activator) in the Manufacture of Geopolymer Rendering Mortars and Architectural Tiles. Constr. Build. Mater. 2023, 363, 129760. [Google Scholar] [CrossRef]
- Fouad Alnahhal, M.; Kim, T.; Hajimohammadi, A. Waste-Derived Activators for Alkali-Activated Materials: A Review. Cem. Concr. Compos. 2021, 118, 103980. [Google Scholar] [CrossRef]
- Torres-Carrasco, M.; Puertas, F. Waste Glass as a Precursor in Alkaline Activation: Chemical Process and Hydration Products. Constr. Build. Mater. 2017, 139, 342–354. [Google Scholar] [CrossRef]
- Tchakouté, H.K.; Rüscher, C.H.; Kong, S.; Kamseu, E.; Leonelli, C. Geopolymer Binders from Metakaolin Using Sodium Waterglass from Waste Glass and Rice Husk Ash as Alternative Activators: A Comparative Study. Constr. Build. Mater. 2016, 114, 276–289. [Google Scholar] [CrossRef]
- Puertas, F.; Torres-Carrasco, M. Use of Glass Waste as an Activator in the Preparation of Alkali-Activated Slag. Mechanical Strength and Paste Characterisation. Cem. Concr. Res. 2013, 57, 95–104. [Google Scholar] [CrossRef]
- El-Naggar, M.R.; El-Dessouky, M.I. Re-Use of Waste Glass in Improving Properties of Metakaolin-Based Geopolymers: Mechanical and Microstructure Examinations. Constr. Build. Mater. 2016, 132, 543–555. [Google Scholar] [CrossRef]
- Hajimohammadi, A.; Ngo, T.; Kashani, A. Glass Waste versus Sand as Aggregates: The Characteristics of the Evolving Geopolymer Binders. J. Clean. Prod. 2018, 193, 593–603. [Google Scholar] [CrossRef]
- Tahwia, A.M.; Heniegal, A.M.; Abdellatief, M.; Tayeh, B.A.; Elrahman, M.A. Properties of Ultra-High Performance Geopolymer Concrete Incorporating Recycled Waste Glass. Case Stud. Constr. Mater. 2022, 17, e01393. [Google Scholar] [CrossRef]
- Chindaprasirt, P.; Lao-un, J.; Zaetang, Y.; Wongkvanklom, A.; Phoo-ngernkham, T.; Wongsa, A.; Sata, V. Thermal Insulating and Fire Resistance Performances of Geopolymer Mortar Containing Auto Glass Waste as Fine Aggregate. J. Build. Eng. 2022, 60, 105178. [Google Scholar] [CrossRef]
- Kuri, J.C.; Hosan, A.; Uddin, F.; Shaikh, A.; Biswas, W.K. The Effect of Recycled Waste Glass as a Coarse Aggregate on the Properties of Portland Cement Concrete and Geopolymer Concrete. Buildings 2023, 13, 586. [Google Scholar] [CrossRef]
- Srivastava, V.; Gautam, S.P.; Agarwal, V.C.; Mehta, P.K. Glass Wastes as Coarse Aggregate in Concrete. J. Environ. Nanotechnol. 2014, 3, 2319–5541. [Google Scholar] [CrossRef]
- Swain, B.; Ryang Park, J.; Yoon Shin, D.; Park, K.S.; Hwan Hong, M.; Gi Lee, C. Recycling of Waste Automotive Laminated Glass and Valorization of Polyvinyl Butyral through Mechanochemical Separation. Environ. Res. 2015, 142, 615–623. [Google Scholar] [CrossRef] [PubMed]
- Farzana, R.; Rajarao, R.; Sahajwalla, V. Characteristics of Waste Automotive Glasses as Silica Resource in Ferrosilicon Synthesis. Waste Manag. Res. 2015, 34, 113–121. [Google Scholar] [CrossRef]
- Farzana, R.; Rajarao, R.; Sahajwalla, V. Synthesis of Ferrosilicon Alloy Using Waste Glass and Plastic. Mater. Lett. 2014, 116, 101–103. [Google Scholar] [CrossRef]
- Farzana, R.; Sahajwalla, V. Recycling Automotive Waste Glass and Plastic—An Innovative Approach. In Proceedings of the 8th Pacific Rim International Congress on Advanced Materials and Processing 2013, PRICM 8, Waikoloa, HI, USA, 4–9 August 2013; Volume 3, pp. 2267–2276. [Google Scholar]
- Munhoz, A.H.; Faldini, S.B.; de Miranda, L.F.; Masson, T.J.; Maeda, C.Y.; Zandonadi, A.R. Recycling of Automotive Laminated Waste Glass in Ceramic. Mater. Sci. Forum 2014, 798–799, 588–593. [Google Scholar] [CrossRef]
- EN 196-1; Methods of Testing Cement–Part 1: Determination of Strength. European Committee for Standardization: Brusel, Belgium, 2016.
- Dhaliwal, A.K.; Hay, J.N. The Characterization of Polyvinyl Butyral by Thermal Analysis. Thermochim. Acta 2002, 391, 245–255. [Google Scholar] [CrossRef]
- Siddika, A.; Hajimohammadi, A.; Sahajwalla, V. Stabilisation of Pores in Glass Foam by Using a Modified Curing-Sintering Process: Sustainable Recycling of Automotive Vehicles’ Waste Glass. Resour. Conserv. Recycl. 2022, 179, 106145. [Google Scholar] [CrossRef]
- Li, X.; Zhang, Q.; Li, H.; Gao, X. A Novel Process for the Production of Triethylene Glycol Di-2-Ethylhexoate by Reactive Distillation Using a Sulfated Zirconia Catalyst. Ind. Eng. Chem. Res. 2020, 59, 9242–9253. [Google Scholar] [CrossRef]
- Andersen, K.E.; Vestergaard, M.E.; Christensen, L.P. Triethylene Glycol Bis(2-Ethylhexanoate)—A New Contact Allergen Identified in a Spectacle Frame. Contact Dermat. 2014, 70, 112–116. [Google Scholar] [CrossRef]
- Torres-Carrasco, M.; Palomo, J.G.; Puertas, F. Sodium Silicate Solutions from Dissolution of Glasswastes. Statistical Analysis. Mater. Constr. 2014, 64, e014. [Google Scholar] [CrossRef]
- ElBatal, H.A.; Hassaan, M.Y.; Fanny, M.A.; Ibrahim, M.M. Optical and FT Infrared Absorption Spectra of Soda Lime Silicate Glasses Containing Nano Fe2O3 and Effects of Gamma Irradiation. Silicon 2017, 9, 511–517. [Google Scholar] [CrossRef]
- Sitarz, M.; Mozgawa, W.; Handke, M. Vibrational Spectra of Complex Ring Silicate Anions-Method of Recognition. J. Mol. Struct. 1997, 404, 193–197. [Google Scholar] [CrossRef]
- Rees, C.A.; Provis, J.L.; Lukey, G.C.; Van Deventer, J.S.J. Attenuated Total Reflectance Fourier Transform Infrared Analysis of Fly Ash Geopolymer Gel Aging. Langmuir 2007, 23, 8170–8179. [Google Scholar] [CrossRef] [PubMed]
- Kouamo Tchakouté, H.; Henning Rüscher, C.; Hinsch, M.; Noël, J.; Djobo, Y.; Kamseu, E.; Leonelli, C. Utilization of Sodium Waterglass from Sugar Cane Bagasse Ash as a New Alternative Hardener for Producing Metakaolin-Based Geopolymer Cement. Geochemistry 2017, 77, 257–266. [Google Scholar] [CrossRef]
- Zheng, J.; Li, X.; Bai, C.; Zheng, K.; Wang, X.; Sun, G.; Zheng, T.; Zhang, X.; Colombo, P. Rapid Fabrication of Porous Metakaolin-Based Geopolymer via Microwave Foaming. Appl. Clay Sci. 2024, 249, 107238. [Google Scholar] [CrossRef]
- Perná, I.; Šupová, M.; Hanzlíček, T. The Characterization of the Ca-K Geopolymer/Solidified Fluid Fly-Ash Interlayer. Ceram.-Silik. 2017, 61, 26–33. [Google Scholar] [CrossRef]
- Perná, I.; Hanzlícek, T.; Žaloudková, M. Microscopic Study of the Concrete/Geopolymer Coating Interface. Ceram.-Silik. 2020, 64, 68–74. [Google Scholar] [CrossRef]
- Perná, I.; Hanzlíček, T. The Setting Time of a Clay-Slag Geopolymer Matrix: The Influence of Blast-Furnace-Slag Addition and the Mixing Method. J. Clean. Prod. 2016, 112, 1150–1155. [Google Scholar] [CrossRef]
- Reeb, C.; Pierlot, C.; Davy, C.; Lambertin, D. Incorporation of Organic Liquids into Geopolymer Materials—A Review of Processing, Properties and Applications. Ceram. Int. 2021, 47, 7369–7385. [Google Scholar] [CrossRef]
- Balazs, D.J.; Triandafillu, K.; Wood, P.; Chevolot, Y.; Van Delden, C.; Harms, H.; Hollenstein, C.; Mathieu, H.J. Inhibition of Bacterial Adhesion on PVC Endotracheal Tubes by RF-Oxygen Glow Discharge, Sodium Hydroxide and Silver Nitrate Treatments. Biomaterials 2004, 25, 2139–2151. [Google Scholar] [CrossRef]
- Toniolo, N.; Boccaccini, A.R. Fly Ash-Based Geopolymers Containing Added Silicate Waste. A Review. Ceram. Int. 2017, 43, 14545–14551. [Google Scholar] [CrossRef]
Figure 1.
The XRD analyses of AGW1 and AGW2.

Figure 2.
The TG curves of AGW1 and AGW2.

Figure 3.
An overview of different AGW fractions (200× magnification).

Figure 4.
AGW1 particles after exposure to the alkaline solution (10,000× magnification).

Figure 5.
AGW2 particles after exposure to the alkaline solution (10,000× magnification).

Figure 6.
The ATR-FTIR spectra of the geopolymer materials (AGW1-G series with variable grain size) and a comparison with L05 and AGW1.
Figure 6.
The ATR-FTIR spectra of the geopolymer materials (AGW1-G series with variable grain size) and a comparison with L05 and AGW1.

Figure 7.
The ATR-FTIR spectra of the geopolymer materials (AGW2-G series with variable grain size) and a comparison with the L05 and AGW2.
Figure 7.
The ATR-FTIR spectra of the geopolymer materials (AGW2-G series with variable grain size) and a comparison with the L05 and AGW2.

Figure 8.
The SEM images of the geopolymer composite with AGW1 particles (AGW1-G): The left side shows the images at lower magnification (2000×), while the right side contains details of the images on the left at higher magnification (10,000×). The images depict the geopolymer matrix (GP) and particles of automotive glass waste (AGW).

Figure 9.
The SEM images of the geopolymer composite with AGW2 particles (AGW2-G): The left side shows the images at lower magnification (1000×), while the right side contains details of the images on the left at higher magnification (10,000×). The images depict the geopolymer matrix (GP) and particles of automotive glass waste (AGW).

Figure 10.
An overview of 28-day compressive-strength values for both AGW types and geopolymer matrix.
Figure 10.
An overview of 28-day compressive-strength values for both AGW types and geopolymer matrix.


Table 1.
The chemical composition of the clay material used.
| Oxides | SiO2 | Al2O3 | MgO | CaO | K2O | Fe2O3 | LOI | Residues |
|---|---|---|---|---|---|---|---|---|
| L05 | 50.28 | 41.99 | <0.02 | 0.14 | 0.9 | 1.03 | 3.65 | 2.01 |
Table 2.
The particle size distribution of the clay material used (% of total).
| Particle Size | 2 | 5 | 8 | 10 | 15 | 25 | d10 | d50 | d90 |
|---|---|---|---|---|---|---|---|---|---|
| [µm] | [µm] | ||||||||
| L05 | 27.03 | 57.98 | 77.70 | 88.49 | 99.14 | 100.00 | 1.00 | 3.94 | 10.43 |
Table 3.
The sieve analyses of the crushed AGW1 and AGW2.
| Fraction (mm) | AGW1 (wt.%) | AGW2 (wt.%) |
|---|---|---|
| >5 | 1.85 | 4.37 |
| 2–5 | 31.15 | 34.87 |
| 1.25–2 | 18.76 | 16.20 |
| 0.8–1.25 | 8.56 | 9.82 |
| 0.63–0.8 | 6.19 | 5.97 |
| 0.4–0.63 | 9.21 | 8.52 |
| 0.25–0.4 | 7.48 | 8.27 |
| 0.16–0.25 | 5.37 | 4.27 |
| 0.063–0.16 | 7.45 | 5.41 |
| <0.063 | 3.97 | 2.28 |
| Sum | 99.99 | 99.98 |
Table 4.
The chemical analysis of AGW samples (the main oxides in wt.%).
| Oxides | Na2O | MgO | Al2O3 | SiO2 | SO3 | K2O | CaO | Cr2O3 | Fe2O3 | Bi | LOI | Residues |
|---|---|---|---|---|---|---|---|---|---|---|---|---|
| AGW1 | 10.21 | 3.14 | 0.30 | 71.28 | 0.32 | 0.12 | 13.15 | 0.06 | 1.24 | 0.0008 | 0.02 | 0.19 |
| AGW2 | 10.74 | 4.12 | 0.50 | 69.57 | 0.26 | 0.47 | 13.52 | 0.15 | 0.18 | 0.22 | 0.14 | 0.13 |
Table 5.
The results of the quantitative analysis of triethylene glycol bis(2-ethylhexanoate) in the fractions of AGW samples.
Table 5.
The results of the quantitative analysis of triethylene glycol bis(2-ethylhexanoate) in the fractions of AGW samples.
| Fraction | AGW1 (ng·kg−1) | AGW2 (ng·kg−1) |
|---|---|---|
| 0.16–0.25 mm | 12.7 ± 0.2 | 24.6 ± 1.2 |
| 0.4–0.63 mm | 8.5 ± 0.5 | 3.6 ± 0.3 |
| 1.25–2 mm | 11.3 ± 0.8 | 13.7 ± 0.5 |
| 2–5 mm | 13.3 ± 0.8 | 0.2 ± 0.1 |
Table 6.
The chemical analysis of AGW-G samples (the main oxides in wt.%).
| Oxides | Na2O | MgO | Al2O3 | SiO2 | K2O | CaO | Fe2O3 | Bi | LOI | Residues |
|---|---|---|---|---|---|---|---|---|---|---|
| AGW1-G | 2.04 | 0.53 | 19.88 | 51.53 | 11.73 | 3.71 | 0.96 | 0.02 | 8.37 | 1.23 |
| AGW2-G | 1.84 | 0.65 | 20.68 | 50.83 | 12.28 | 3.47 | 0.76 | 0.04 | 8.17 | 1.28 |
Table 7.
The results of the quantitative analysis of triethylene glycol bis(2-ethylhexanoate) in the fractions of AGW-G samples.
Table 7.
The results of the quantitative analysis of triethylene glycol bis(2-ethylhexanoate) in the fractions of AGW-G samples.
| Fraction | AGW1-G (ng·kg−1) | AGW2-G (ng·kg−1) |
|---|---|---|
| 0.16–0.25 mm | 3.1 ± 0.1 | 6.4 ± 0.2 |
| 0.4–0.63 mm | 0.7 ± 0.1 | 0.6 ± 0.2 |
| 1.25–2 mm | 1.9 ± 0.1 | 2.5 ± 0.4 |
| 2–5 mm | 4.1 ± 0.2 | 0.0 ± 0.1 |
Disclaimer/Publisher’s Note: The statements, opinions and data contained in all publications are solely those of the individual author(s) and contributor(s) and not of MDPI and/or the editor(s). MDPI and/or the editor(s) disclaim responsibility for any injury to people or property resulting from any ideas, methods, instructions or products referred to in the content. |
© 2024 by the authors. Licensee MDPI, Basel, Switzerland. This article is an open access article distributed under the terms and conditions of the Creative Commons Attribution (CC BY) license (https://creativecommons.org/licenses/by/4.0/).
Share and Cite
MDPI and ACS Style
Perná, I.; Havelcová, M.; Šupová, M.; Žaloudková, M.; Bičáková, O. The Synthesis and Characterization of Geopolymers Based on Metakaolin and on Automotive Glass Waste. Appl. Sci. 2024, 14, 3439. https://doi.org/10.3390/app14083439
AMA Style
Perná I, Havelcová M, Šupová M, Žaloudková M, Bičáková O. The Synthesis and Characterization of Geopolymers Based on Metakaolin and on Automotive Glass Waste. Applied Sciences. 2024; 14(8):3439. https://doi.org/10.3390/app14083439
Chicago/Turabian StylePerná, Ivana, Martina Havelcová, Monika Šupová, Margit Žaloudková, and Olga Bičáková. 2024. "The Synthesis and Characterization of Geopolymers Based on Metakaolin and on Automotive Glass Waste" Applied Sciences 14, no. 8: 3439. https://doi.org/10.3390/app14083439
Note that from the first issue of 2016, this journal uses article numbers instead of page numbers. See further details here.