Research on Supply Chain Network Resilience: Considering Risk Propagation and Node Type

1
College of Manufacturing Science and Engineering, Southwest University of Science and Technology, Mianyang 621000, China
2
Low Speed Aerodynamics Institute, China Aerodynamics Research and Development Center, Mianyang 621000, China
3
Key Laboratory of Icing and Anti/De-Icing, China Aerodynamics Research and Development Center, Mianyang 621000, China
4
Mianyang Science and Technology City Intelligent Manufacturing Industry Technology Innovation Institute, Mianyang 621000, China
5
State Key Laboratory of Intelligent Manufacturing Equipment and Technology, College of Mechanical Science and Engineering, Huazhong University of Science and Technology, Wuhan 430074, China
*
Author to whom correspondence should be addressed.
Appl. Sci. 2024, 14(7), 2675; https://doi.org/10.3390/app14072675
Submission received: 27 February 2024
/
Revised: 16 March 2024
/
Accepted: 17 March 2024
/
Published: 22 March 2024
Abstract
:The aim of this study is to investigate the impact of network characteristics on supply chain network resilience (SCNR) when risk propagation occurs in supply chain networks (SCNs). The network characteristics we study here (e.g., clustering coefficient, scalar index, node type, etc.) are exceptionally important for real-life SCNs, but are not sufficiently considered in the previous research on SCNR. To this end, we first construct an SCN model with adjustable parameters for multiple network characteristics. Second, this SCN model is combined with a susceptible–infectious–susceptible model to construct an SCN risk propagation model. Third, we propose using the average (i.e., a novel SCNR metric considering node type) of the sizes of the maximum connected subgraphs (which contain all node types) over a period of time after risk propagation reaches a steady state. Fourth, the parameters of the SCN model are adjusted to generate SCNs with different network characteristics, and then the resilience of these SCNs is addressed accordingly. The simulation results mainly show the following: the larger the scalar index of an SCN is, the higher its resilience; the larger the clustering coefficient of an SCN is, the smaller its resilience; and the more uniform the distribution of node types is in an SCN, the higher its resilience. Our research work will help optimize SCNs’ structure, which has important implications for society and practice.
1. Introduction
A supply chain is a complex system of interconnected, different firms such as suppliers, manufacturers, distributors, and retailers [1]. A supply chain network (characterized by nodes and edges) is a mesh of multiple interlocking supply chains, where nodes represent firms and edges represent relationships between these firms [2]. Supply chain disruptions are operational stoppages caused directly or indirectly by various risks, such as natural disasters and political and economic factors [3]. Disruptions at any node location on a supply chain network (SCN) may affect other nodes through propagation [1,4], causing huge economic losses. For example, according to World Bank estimates, supply chain disruptions caused by the COVID-19 pandemic resulted in a loss of 5% of the global GDP, or approximately USD 3 trillion [5].
Supply chain network resilience (SCNR) is expressed as the ability of a network to withstand, adapt, and recover from disruptions [6]. SCNR is critical for business continuity and coping with disruptions [7,8]. Scholars have explored factors affecting SCNR from different perspectives, including visibility [9], information sharing [10,11], collaboration [12], blockchain technology [13,14], network structure [15,16], and so on. With the advent of the Industry 4.0 era, many scholars have also adopted the cutting-edge technology of Industry 4.0 to improve the resilience of supply chains [17,18,19,20,21,22]. How to build a more resilient supply chain is a problem that urgently needs a solution.
Studying the effect of network structure on SCNR has attracted extensive attention [15,16,23]. Currently, scholars mainly consider the effect of network type on network resilience [15,24]. For example, the effects of network types on resilience for scale-free, random, and small-world networks have been extensively studied [25]. However, network structures vary greatly across different network types. The degree distribution of a random network obeys a Poisson distribution, while the degree distribution of a scale-free network conforms to a power-law distribution [26]. More importantly, real-life SCNs have very complex network characteristics and do not belong to a specific network type. Therefore, only studying the impact on network resilience in terms of network types is very limited.
Fortunately, some scholars have begun to recognize this problem and have proposed focusing on network characteristics [15,16,25]. Network characteristics describe one aspect of network structure, and different network characteristics can be combined into arbitrary network types [15,16]. The network characteristics that have been studied are the average degree, degree centrality, intermediary centrality, eigenvector centrality, information centrality, and communicability [15,16]. However, there are still some SCN characteristics that have not been studied, such as scalar indices, clustering coefficients, and node types, which are present and important in real-life SCNs. Therefore, we will study the effect of the above network characteristics on SCNR.
How to measure SCNR is of great importance in this field [6,13]. Resilience metrics such as the number of healthy nodes [27], the size of the largest subgraph, and the average path length [28] have been used frequently. However, all of the aforementioned metrics share the common limitation of a consistent type of different nodes [29]. In a real-life SCN, if a certain type of node is lacking, this SCN will not function properly. The current maximum full-type subgraph metric is calculated by removing nodes at each time step, which can damage the network structure [30,31]. The SCNR metrics proposed in this study differ in two distinct respects: First, we performed the analysis after the SCN risk propagation reached a steady state. The average (i.e., a novel SCNR metric considering node type) of the sizes of the maximum connected subgraphs over a period of time after reaching a steady state was used to measure the resilience of SCNs. Second, we performed the calculation without destroying the network structure. We computed the maximum full-type subgraph formed by using healthy nodes, where the SCN structure is always complete.
The purpose of this study is to investigate the effects of different network characteristic parameters on SCNR when risk propagation occurs in SCNs, and to propose some guiding suggestions for supply chain management to improve SCNR. According to the experimental results of this study, supply chain managers can optimize the SCN structure to improve the SCNR. Understanding how the multiple network characteristics of the SCN affect its resilience can help society ensure the continuous supply of critical social materials and services in the face of emergencies to maintain the normal operation of society. In addition, optimizing the SCN can adjust the allocation of social resources to save social resources and promote the sustainable development of society. This research also has significance for practice. By understanding the influence factors of SCNR, it can help enterprises optimize their supply chain management to have a clearer understanding of their own supply chain status, improve their competitiveness, and help them to formulate more effective risk strategies to reduce the impacts of risks. The government can formulate more scientific and effective economic policies by studying the network characteristics that affect SCNR. Building a more resilient supply chain ensures that consumers receive a reliable supply of products and better service.
The problem investigated in this study is how the network characteristics of SCNR, such as node types, scalar indices, and clustering coefficients, are affected when the risk propagation on an SCN reaches a steady state. The rest of the paper is organized as follows. Section 2 presents a literature review. Section 3 presents the details of the proposed SCN risk propagation model and resilience metrics. Section 4 presents the experimental setup and analysis of the results. Section 5 presents some broader practical insights based on the analysis. Section 6 validates the results by using a real-life SCN. Section 7 summarizes the contributions and shortcomings of this study and discusses some future research directions.
2. Literature Review
This study focuses on analyzing the resilience of SCNs after risk propagation reaches a steady state by simulating the risk propagation process on SCNs with different network characteristics. SCNR and SCN risk propagation are the two related research directions of this study and, hence, a literature review on these two parts is conducted.
2.1. Supply Chain Network Resilience
The concept of resilience originated from the study of resilient mechanics in the discipline of physics [32]. It refers to the property of an object that undergoes deformation under an external force and can recover its original size and shape when the external force is withdrawn. The concept of resilience has been widely used, for example, in psychology [33,34], ecology [35], and economics [36,37]. It is defined differently in different research areas. The concept of SCNR originated in the field of supply chain risk management [38]. Ponomarov and Holcomb [39] defined supply chain resilience as the ability of a supply chain to recover quickly and to maintain normal business levels when it is disrupted by unexpected events. Generally speaking, scholars have defined and studied SCNR from different perspectives [6].
As supply chains become more complex and global, the impact of regional disruptions can be far-reaching and long-lasting [15]. A real-life SCN will be affected by many different types of risk [40,41]; in this context, in order to reduce the effect of risk to reduce business losses, scholars have conducted a lot of research on SCNR. How to cope with the impact of disruptions and improve SCNR has attracted the interest of an increasing number of scholars [16,39]. Relevant studies have been conducted using both quantitative and qualitative analysis methods [15,16,42]. However, Li et al. [16] mentioned that most of the literature focuses on the resilience capabilities of individual enterprises and does not consider the impact of network structures on network resilience from the perspective of complex networks.
Industry 4.0 is the fourth industrial revolution, led by smart manufacturing, which has generated many frontier technologies [17]. These technological tools play a key role in improving SCNR. The technological tools of Industry 4.0 can improve SCNR through digitization, intelligence, additive manufacturing, and cloud computing [18,19,20]. Qader et al. [21] explored the impact of Industry 4.0 on supply chain performance, drawing on information processing theory and a resource-based view. Ivanov and Dolgui [22] investigated the impact of digitalization and Industry 4.0 on the analysis of chain reactions and disruption risk control in supply chains. In the era of Industry 4.0, supply chain managers can utilize advanced technological tools to better understand and control the state of an SCN to improve SCNR.
The structure of an SCN is important for its response to disruptions [43,44]. Snyder et al. [44] used optimization methods to allow decision makers to select nodes and edges to construct networks that maximize supply chain performance. But the method cannot be applied to large-scale SCNs. Many scholars have used network science methods to study the impact of different network types [15,27,43]. However, for different network types, their network characteristics vary particularly widely, yielding very rough and unrefined conclusions [25]. Moreover, real-life SCNs do not exclusively belong to a certain type of network and have more complex network characteristics [16]. Therefore, there are limitations if we classify SCNs into certain network types and study the resilience of SCNs by examining the differences between different network types.
A small number of scholars have recognized the aforementioned shortcomings and proposed focusing on the impact of network characteristics on resilience [15,16], but there are still some network characteristics that have not been studied. Managers are able to adjust the network characteristics to change an SCN’s structure but cannot change the network type [16]. Network characteristics are more applicable to the study of resilience in real-life SCNs. Most realistic SCNs have scale-free and small-world characteristics [45]. The main difference between our study and those of Li et al. [16] and Li and Zobel [15] is that we analyze the resilience of an SCN after risk propagation over the SCN reaches a steady state and use different resilience metrics, as well as study different network characteristics.
Additionally, all the abovementioned metrics have a common limitation that the nodes have the same type. Different node types play different functions in real-life SCNs, and each of them is indispensable. If the traditional metrics are used, the situation arises that although the largest subgraph is large, the SCN may no longer function properly due to the lack of some types of nodes. Therefore, when the SCN risk propagation reaches a steady state, we include the full range of node types in the resilience metrics. We believe that the maximum subgraph should contain all node types (i.e., maximum full-type subgraph). A larger maximum full-type subgraph means that an SCN can quickly return to normal operation, which is more suitable for measuring the resilience of real-life SCNs.
Finally, richer resilience metrics are needed to measure the resilience of SCNs in SCNR studies [46,47]. To address these emerging issues, this study mainly considers the impact of three network characteristics, i.e., node types, scalar indices, and clustering coefficients, on SCNR from the perspective of complex networks. We use the maximum full-type subgraph when the risk propagation of SCNs reaches a steady state as a new metric of SCNR. Our proposed resilience metric allows enterprises to quantitatively assess their own resilience in a more rational way, and guides them to take effective measures to improve the resilience and competitiveness of their supply chains.
2.2. Supply Chain Network Risk Propagation
The study of SCN risk propagation originated from the early research on inter-firm risk propagation [48]. With the development of economic globalization and the close business contacts between enterprises, the relationship between enterprises has gradually evolved into a complex network structure. The occurrence of risk at any node on a network will spread across the network and eventually cause serious damage to the whole network [1,24]. If we can understand the mechanism of risk propagation on a network, we can then take measures to prevent and control SCN risks [15,49].
How can we describe the process of risk propagation throughout SCNs? Mainstream approaches include complex network dynamics [4,24], anyLogistix simulation optimization software [50], and agent-based agent simulation [16]. Complex network dynamics is a combination of infectious disease models and complex network theory [51]. It can better simulate the propagation process of risks, which is suitable to the research content of this paper [52,53,54].
Barabasi–Albert (BA) scale-free networks, small-world networks, and random networks are the most common types of networks used by scholars when studying SCN risk propagation using complex network dynamics methods [15,16,24]. Commonly used contagion models include SIS (susceptible–infectious–susceptible), SIRS (susceptible–infectious–recovered–susceptible), SIR (susceptible–infectious–recovered), SEIR (susceptible–exposed–infectious–recovered), and SEIRS (susceptible–exposed–infectious–recovered–susceptible), among which SIS and SIR contagion models are most commonly used in the context of supply chain risk management [4,53]. In this paper, we use a combination of scale-free networks and SIS models to simulate the propagation process of risks in SCNs.
A large number of scholars have studied the mechanisms of risk propagation in SCNs. In this study, we divide the scholars’ studies into two categories, i.e., the non-network level and the network level. For the non-network level, several scholars have studied infection mechanisms [48,53,55], including infection rates, immunity rates, recovery rates, self-healing time, propagation direction, and the number of initial risk nodes, on the risk propagation process. Some scholars have considered the effects of firm-related factors [49,56], including the degree of risk appetite, herd mentality, operational robustness and flexibility, the completeness of market information, different operational strategies, and financial factors.
For the network level, scholars have mainly conducted the following studies. Huo et al. [49], Gomez et al. [57], and Hosseini and Ivanov [58] modeled an SCN as a multilayer network rather than a single-layer network. Yue et al. [59] considered the existence of weights for the edges in a network with different degrees of business transactions between node enterprises. Zhao et al. [53], Li and Zobel [15]; Wang, Zhou, and Jin [24]; and Kim, Chen, and Linderman [43] studied the influence of the degree of initial infection nodes, the average degree size, and the network type. However, there are a large number of network characteristics that have not been studied [15,16]. The clustering coefficient describes the likelihood of business transactions occurring between neighboring node firms in an SCN [60]. The scalar index can be used to analyze the degree distribution of an SCN [61], and the node type affects the normal operation of an SCN [30,31]. All of the above network characteristics exist in real-life SCNs and are important components of the structural properties of SCNs. And they have been studied by scholars from other fields [62]. However, it is not clear what effect they have on the resilience of SCNs.
In this study, we construct a supply chain network model with adjustable clustering coefficients, scalar indices, and node-type ratios. Next, it is combined with the SIS model to simulate the risk propagation process on the SCN. We then explore the impact of multiple network characteristic parameters on SCNR at the network level when risk propagation occurs in the SCN.
3. Supply Chain Network Risk Propagation Model and Resilience Metric
In this section, we first describe the SCN risk propagation model and then the novel resilience metrics.
3.1. Supply Chain Network Risk Propagation Model
In order to better model the process of risk propagation on an SCN, we made the following assumptions. These assumptions are the same as those made by some scholars [15,24,53].
Hypothesis 1.
The SCN is unweighted and undirected, and risk propagation is undirected.
Hypothesis 2.
The state of a node enterprise is unique at each time step (i.e., risk state or health state).
Hypothesis 3.
Enterprises can only be affected by the risks of their neighboring nodes.
3.1.1. Supply Chain Networks with Tunable Parameters
SCNs are a complex network of enterprises with different types, such as suppliers, manufacturers, retailers, and distributors. Here, enterprises correspond to nodes and the business relationships between enterprises correspond to the adjacency relationships between nodes (i.e., edges). Accordingly, the SCN is described as a network, G = (N, E). N is the set of all node enterprises and is defined as
where S is the set of suppliers, M is the set of manufacturers, R is the set of retailers, and D is the set of distributors. E is the edge set. We can change the ratio of various node types in the SCN by adjusting the numbers of S, M, R, and D.
The BA model [63] is capable of generating BA scale-free networks whose degree distributions are power-law distributions with a fixed scalar index. But the clustering coefficient of a BA scale-free network is close to 0 and cannot be adjusted. The HK model [64], which can generate networks with different clustering coefficients and the same scalar index, has been widely used. To obtain SCNs with different clustering coefficients, different scalar indices, and different node-type ratios, we extend the HK model as follows.
Step 1 Initial state: the initial state of an SCN contains m0 fully connected nodes.
Step 2 Network evolution: At each step, a new node i with m (≤m0) edges is added. Firstly, the new node i is connected to an old node j already existing in the SCN in a preferential attachment (PA) to produce the first edge. The PA rule is a node-degree-first connection mechanism [63]. When a new node is added to the network, the probability of picking node j (denoted as ) is proportional to the degree of node j, as shown:
Then, triad formation (TF) connections are made with probability p or PA connections are established with probability 1 − p, adding the remaining m − 1 edges. Finally, we repeat Step 2 until N nodes are formed in the network. The TF rule is to select a node in the network, which is selected according to Equation (2), and then add a connection between one of its pairs of unconnected neighbors. The clustering coefficients are calculated using the triangle counting method [65]. In Equation (3), is the number of relationships between a node and its neighbors (i.e., the number of triangles), is the number of neighboring nodes, and is the clustering coefficient of the current node. C in Equation (4) is the overall average clustering coefficient.
Step 3 Adjustable scalar indices: First, an SCN is created based on creating a sequence of degrees obeying a power-law distribution with parameter e controlling the scalar indices, according to the method of configuring the model graph. Then, the self-loops and duplicate edges are removed from the network. Equation (5) is a network whose degrees k obey a power-law distribution and e is the scalar index:
Step 4 Adjustment of the ratio of node types and the type of initial risk node: First, each node in an SCN is numbered. The ratio between node types is the ratio between companies of each type in the SCN. Then, a corresponding number of nodes is assigned to each type of enterprise from the SCN in proportion to the node type. Each node is assigned a node type. The different types of nodes can be distinguished by the node numbers. Nodes of the relevant node type are selected for infection according to the node numbers to achieve an initially adjustable type of initial risk node.
Step 5 Termination condition: The average clustering coefficient and the scalar index of the generated network are calculated at this time. If the calculated values are the same as the ideal value, this SCN is output. If the calculated values differ significantly from the ideal value, the corresponding steps are repeated until an SCN with the ideal network characteristics is generated.
The process of generating an SCN using our model is shown in Figure 1. If it is necessary to adjust the clustering coefficients of SCNs, Step 1, Step 2, and Step 5 should be performed in sequence. If it is necessary to adjust the scalar indices of SCNs, Step 3 and Step 5 should be performed in sequence. If it is necessary to adjust the ratio of the node type and the initial infected node type, Step 4 should be added after generating SCNs.
3.1.2. SIS Model
The SIS model is a classical propagation dynamics model that contains two types of node states, i.e., S (susceptible) and I (infected). It can reflect the dynamic evolution of risk propagation, can be applied to large-scale network environments, and is simple to use [4,53]. Therefore, the SIS model was used in this study. The susceptible person corresponds to a node (in an SCN) that is not affected by risks, and the infected person corresponds to a node that is affected by risks. The mechanism of risk propagation in an SCN is similar to the mechanism of virus propagation [66]. Risk propagation in an SCN refers to the risk transmission of risk-exposed enterprises to adjacent supply chain enterprises through various media [24].
For an SCN, if a healthy node is adjacent to a risky node, it is possible for the healthy node to be affected by the risk to become a risky node. This probability is defined as the infection rate, α. It is possible for a node at risk to heal itself and become a healthy node. This probability is defined as the recovery rate, β. The effective infection rate is defined as the ratio between the infection rate and the recovery rate (i.e., λ = α/β). There exists a critical value called λc: for λ < λc, there will be no infected nodes in the network after a long time and the dynamical system of the network will be in the absorption phase; for λ > λc, after a long time the region of density of risky nodes in the network will be stable and the dynamical system of the network will be in the active phase [67].
3.2. Resilience Metric
When risk propagation occurs on an SCN, we consider a connected subgraph of it as a connected component formed by multiple interconnected healthy nodes. Each subgraph contains only healthy nodes, and the higher the number of nodes in the subgraph, the better the performance of the network [15,28]. The size of the maximum full-type subgraph represents the ability of SCNs to quickly return to a normal state when they are affected by risks at the current step. The existing maximum full-type subgraph (a resilience metric) considers all types of nodes, but changes the structure of the SCN and removes some nodes in the calculation [30,45]. However, we propose a resilience metric that is the average of the maximum full-type subgraph sizes over a period of time after risk propagation reaches a steady state. In addition, we do not change the network structure and do not remove nodes during the calculation, always keeping the integrity of the supply chain network structure.
When the SCN risk propagation reaches a steady state, the size and number of connected subgraphs are dynamically changing. A maximum full-type subgraph (MFTS) contains four node types of maximum connected subgraphs. We computed the size of the maximum full-type subgraph (MFTSS). The difference between them is that the MFTSS is computed for the size of the MFTS. N is the number of nodes in the SCN; thus, the ratio of these two numbers is defined as follows:
where y is the resilience capacity of the network at each time step after the system reaches a steady state. Accordingly, running T more steps after this steady state, we propose a novel resilience metric Y as follows:
To adequately study the SCNR, we also use the number of healthy nodes in the network to measure the resilience of the SCN. The greater the number of healthy nodes in the SCN, the faster it can return to a normal operating state [15,27]. The s in Equation (8) is the number of healthy nodes in the SCN at each step after reaching a steady state. Therefore, running T steps again when a steady state is reached, we propose another resilience metric, defined as
4. Numerical Simulation
4.1. Simulation Setup
The full parameters of the proposed SCN risk propagation model include N, α, β, T, ε, e, q, S, R, M, and D. They are divided into fixed and variable parameters. The fixed parameters are the size of an SCN (N = 1000), the infection rate (α = 0.35), the recovery rate (β = 0.50), risk propagation steps after reaching a steady state (T = 80), and the number of nodes with initial risk (ε = 10). The effects of these fixed parameters have been studied extensively [24,25,53], and, hence, to avoid duplication we only consulted their parameter settings. The studied network characteristic parameters here include the node-type ratio S/R/M/D, scalar index e, and clustering coefficient q. During the experiments, the fixed parameters were kept constant and only the network characteristics parameters were adjusted. To improve statistical stability, the experiments were repeated 100 times independently under each network characteristic parameter and the results of these experiments were averaged.
When studying the effect of e on SCNR, the fixed parameters were set as q = 0.2, S/R/M/D = 1:1:1:1, and e was adjusted from two to three with a step size of 0.1. When studying the effect of q on SCNR, the fixed parameters were set as e = 3, S/R/M/D = 2:3:3:2, and q was adjusted from 0 to 0.45 with a step size of 0.05. When studying the effect of S/R/M/D on SCNR, the fixed parameters were set as e = 3, q = 0.2, and six different groups of S/R/M/D were randomly selected (i.e., 1:1:1:1, 7:1:1:1, 2:2:15:1, 2:2:1:20, 35:2:2:1, and 1:1:47:1). When studying the effect of the type of initial risk node on SCNR, the fixed parameters were set as e = 3, q = 0.2, and S/R/M/D = 1:1:1:1. We used two methods of risk propagation. The first way was to choose one category among S, R, M, and D as the initial risk nodes. The second way was to randomly select nodes in the SCN for risk propagation.
In summary, we will address the following four questions: (1) How do the scalar indices affect the SCNR? (2) How do the clustering coefficients affect SCNR? (3) How do the node-type ratios affect SCNR? (4) How do the types of initial risk nodes affect SCNR?
4.2. How Scalar Indices Affect SCNR
We simulated the risk propagation process on SCNs with different scalar indices. Figure 2 and Figure 3 show the resilience changes with different scalar indices at each time step when using resilience metrics y and s, respectively. The curves in different colors in the figures represent SCNs with different scalar indices, the horizontal coordinate is the time step, and the vertical coordinate is the SCNR at this time step.
We used resilience metric y to measure the SCNR at each time step. In Figure 2, the curve drops sharply in the initial phase. When the curve fluctuates less frequently, the risk propagation reaches a steady state. Observing the resilience of SCNs with different scalar indices at the same time step, a larger e implies a larger SCNR. When T = 20, the system has reached a steady state, at which point we ran another 80 time steps and averaged these y values to obtain Y. When Y was used to measure the SCNR, the change in SCNR with different scalar indices is shown in Figure 4. In Figure 4, when e = 2.0, Y = 0.0009. When e = 3.0, Y = 0.0172. As e increases, the curve keeps rising and the value of Y increases. The experimental results under this resilience metric show that the larger the value of an SCN’s scalar index network characteristics, the more resilient that SCN is.
Similarly, we used the resilience metric s to measure the SCNR at each time step. The change in SCNR with different scalar indices is shown in Figure 3. The change pattern of the curve in Figure 3 is similar to that in Figure 2, and we used the same method to obtain S. The SCNR measured by the resilience metrics y and s differs by a factor of 10. This indicates that using s as the resilience metric is relatively coarse, while y is more delicate.
In Figure 5, when e = 2.0, S = 0.2225. When e = 3.0, S = 0.3684. Although the SCNR is minimal when e = 2.1, the overall trend of the curve is slowly increasing. When measured by this elasticity metric, S increases with e. The resilience metrics Y and S yield the same conclusion, indicating that Y is valid. The p-value method is a common method for statistical tests, where if p < 0.01, a significant effect is indicated, and if p < 0.05, an effect is indicated [68]. The p-values calculated under both resilience metrics are much less than 0.01. This indicates that e has a significant effect on SCNR.
Finally, the reasons for such experimental results are analyzed. Nodes with large degrees have more influence on risk propagation. The larger e is in an SCN, the fewer nodes have large degrees, and the more uniform network degree distributions are. Thus, the larger the scalar index, the lower the risk propagation impact and the higher the SCNR.
4.3. How Clustering Coefficients Affect SCNRs
We simulated the risk propagation process on SCNs with different clustering coefficients. Figure 6 and Figure 7 show the resilience changes with different clustering coefficients at each time step when using resilience metrics y and s, respectively. The curves in different colors in the figures represent SCNs with different clustering coefficients, the horizontal coordinate is the time step, and the vertical coordinate is the SCNR at this time step.
The curves in Figure 6 and Figure 7 drop sharply in the initial phase. When risk propagation reaches a steady state, the relative fluctuations of the curves in the figures are smaller. In Figure 6, the relative position of the curve is highest when q = 0.05 and lowest when q = 0.45. However, in Figure 7, the relative position of the curve is lowest when q = 0.10 and highest when q = 0.45. In Figure 6 and Figure 7, the relative positions of the curves corresponding to the resilience of SCNs with different clustering coefficients are reversed.
The variations in SCNR with different clustering coefficients measured under the two metrics are shown in Figure 8 and Figure 9. The overall trend in the curves in Figure 8 and Figure 9 is exactly opposite. Figure 8 is a decreasing curve; when q = 0.05, the SCNR is a maximum of 0.0290, and when q = 0.45, the SCNR is a minimum of 0.0214. A rising curve is shown in Figure 9, where the SCNR has a minimum of 0.3370 when q = 0.10. The SCNR has a maximum of 0.3517 when q = 0.45. The SCN resilience decreases with the increase in the clustering coefficient when measured by resilience metric Y, while the opposite is true when measured by resilience metric S. It is then calculated that the p-values under the two resilience metrics are much less than 0.01, indicating that the clustering coefficient has a significant effect on SCNR.
Next, we analyze the reasons for the different results. An increase in the clustering coefficient in an SCN indicates an increase in the number of triangles in the network. The triangle structure represents the relationship between nodal firms. The larger average clustering coefficient in the network indicates a higher degree of aggregation of network nodes. Nodal firms are closely connected to each other and the transparency of network information is high. The impact of risk propagation is reduced and the number of healthy nodes in the SCN becomes more, so S is greater. The total number of nodes in the network is fixed. The average size of triangles decreases as the number of triangles in the network increases. When risk propagates, the size of the connected subgraphs decreases, the size of the maximum full-type subgraphs decreases, and the corresponding SCNR is lower.
4.4. How Node-Type Ratios Affect SCNR
In this part of our paper, we use resilience metrics Y and S to measure SCNR. In Figure 10 and Figure 11, the horizontal coordinates are SCNs at different node-type ratios, and the vertical coordinates are the SCNR at that ratio. The difference between these two figures is obvious. As can be seen in Figure 10, as the horizontal coordinate shifts to the right, the corresponding vertical coordinate decreases significantly. When S/R/M/D = 1:1:1:1, Y = 0.0262; when S/R/M/D = 47:1:1:1, Y = 0.0053. This indicates that the more uniform the distribution of node types is in an SCN, the greater its resilience. However, in Figure 10, the SCNR always fluctuates around 0.3436 for different node types. The p-value calculated under Y is very small and negligible, but the p-value obtained under S is 0.2122, which is much larger than 0.05. This shows that the proportion of node types has a significant impact on SCNR when measured by metric Y. And the effect of node type is not considered when measured by metric S. However, the type of node affects the normal operation of the SCN and should be considered when measuring SCNR.
In summary, our resilience metric Y is more applicable compared to the resilience metric S. The resilience metrics we used included all types of nodes, and the type of each node is equally important. The greater the difference in the ratio of node types, the more the SCN may lack a certain type of node to generate a full-type subgraph. Then, the size of the maximum full-type subgraph becomes smaller and the SCN becomes less resilient.
4.5. How the Types of Nodes Initially Infected Affect SCNR
We conducted two experiments, selecting specific types of nodes as well as randomly selected nodes as initial risk nodes. We measured SCNR with Y and S. The experimental results are shown in Figure 12 and Figure 13. From left to right, horizontal coordinates are the nodes of S, M, R, and D selected sequentially as initial risk nodes. The fifth horizontal coordinate N is the initial risk node chosen randomly. It can be noticed that SCNR fluctuates around 0.0260 and 0.3430 in Figure 12 and Figure 13, respectively. In both cases, by calculation, the p-values under both metrics are much greater than 0.05. This indicates that the initial risk node-type selection and the random selection of node-type risk have no effect on SCNR.
We first constructed an SCN and then assigned node types to nodes. The node types are additional information for nodes and do not change the topology of the SCN. In addition, although there are different types of initial risk nodes, the nodes all affect neighboring nodes during risk propagation. Furthermore, we performed the calculations after the risk propagation reached a steady state, and the type of the initial risk node had no effect on the steady state.
5. Discussion
Through the analysis of the above sections, we summarize several important takeaways.
- (1).
- Better structure of an SCN is very important to improve its resilience
The scalar indices record the distribution of node degrees in the network, and the clustering coefficients are used to analyze the aggregation of nodes in the network [69]. Our results show that the larger the scalar indices of an SCN are, the higher the SCNR and the lower the impact of risks. The larger the clustering coefficient of an SCN is, the lower the SCNR and the higher the impact of risks. The network characteristics of SCNs have a huge impact on SCNR. Managers adjust the structure of an SCN to improve the SCNR and reduce the impact brought by risks.
When risk propagation occurs in an SCN, managers can reduce transactions with firms with larger operations, making the scale of business of different firms more balanced. Enterprises need to scale down their operations and avoid business expansion. This will enable them to enhance the scalar index network characteristics of an SCN and allow it to have greater resilience. A higher clustering coefficient in an SCN means a higher transparency of information in the network. Managers should enhance communication and cooperation among enterprises and share information resources. Enhancing the flow of information between companies and improving corporate transparency can reduce the impact of risk and increase the resilience of SCNs. However, the SCN cannot be too transparent, which can lead to conflicts and internal management difficulties, undermining the SCN’s resilience.
- (2).
- The ratio of node types in an SCN has a significant impact on SCNR
The ratio of node types in an SCN records the distribution information of enterprises with different node types. The greater the difference in the number of enterprises with different node types is, the less resilient an SCN is. In an SCN, although the functions of enterprises in different types are different, they are all equally important and indispensable. Enterprise managers should consider the whole picture and should not favor a certain enterprise node type in have business transactions. Enterprise managers should choose as many different types of partners as possible to avoid the lack of a certain partner and ensure they can function properly.
- (3).
- The two infection methods of the initial node type do not affect SCNR
We used two infection methods, specifically node type and randomly selected node type, to select the initial risky nodes. The results show that the two node-type-specific infection methods do not affect the SCNR. Although the types of the initially infected nodes are different, they both affect the neighboring node states, and the initial node types have no effect when calculating the SCNR in a steady state. SCNR is a capability of the SCN itself, and node types are additional information that we attach to the nodes. Managers should pay high attention to each partner enterprise in an SCN and treat them equally when facing both types of risk attacks.
6. Case Study
We simulated the risk propagation process on an SCN existing in real life [70]. This SCN has 577 nodes and 2662 edges, and we visualized this SCN as shown in Figure 14. Nodes with larger degrees are larger after visualization. In Figure 14 the blue circles represent node firms and the black edges represent links between firms.
We sorted this SCN according to the degree of nodes, as shown in Figure 15. The curve in Figure 15 has a power-law distribution pattern. The largest node degree in this SCN is 204, and there is only one node. The average clustering coefficient of the actual SCN used in this study was calculated to be so small that it was approximately equal to zero and the scale index was equal to approximately 0.905. The average degree value of this SCN was 7.841. In the meantime, we also analyzed the distribution of degree distribution in this SCN and drew its histogram of degree distribution as shown in Figure 16. Observing Figure 16, we found that a large number of nodes have small degrees and a small number of nodes have a large number of connections in the SCN. Among them, there are 201 nodes with a node degree of three.
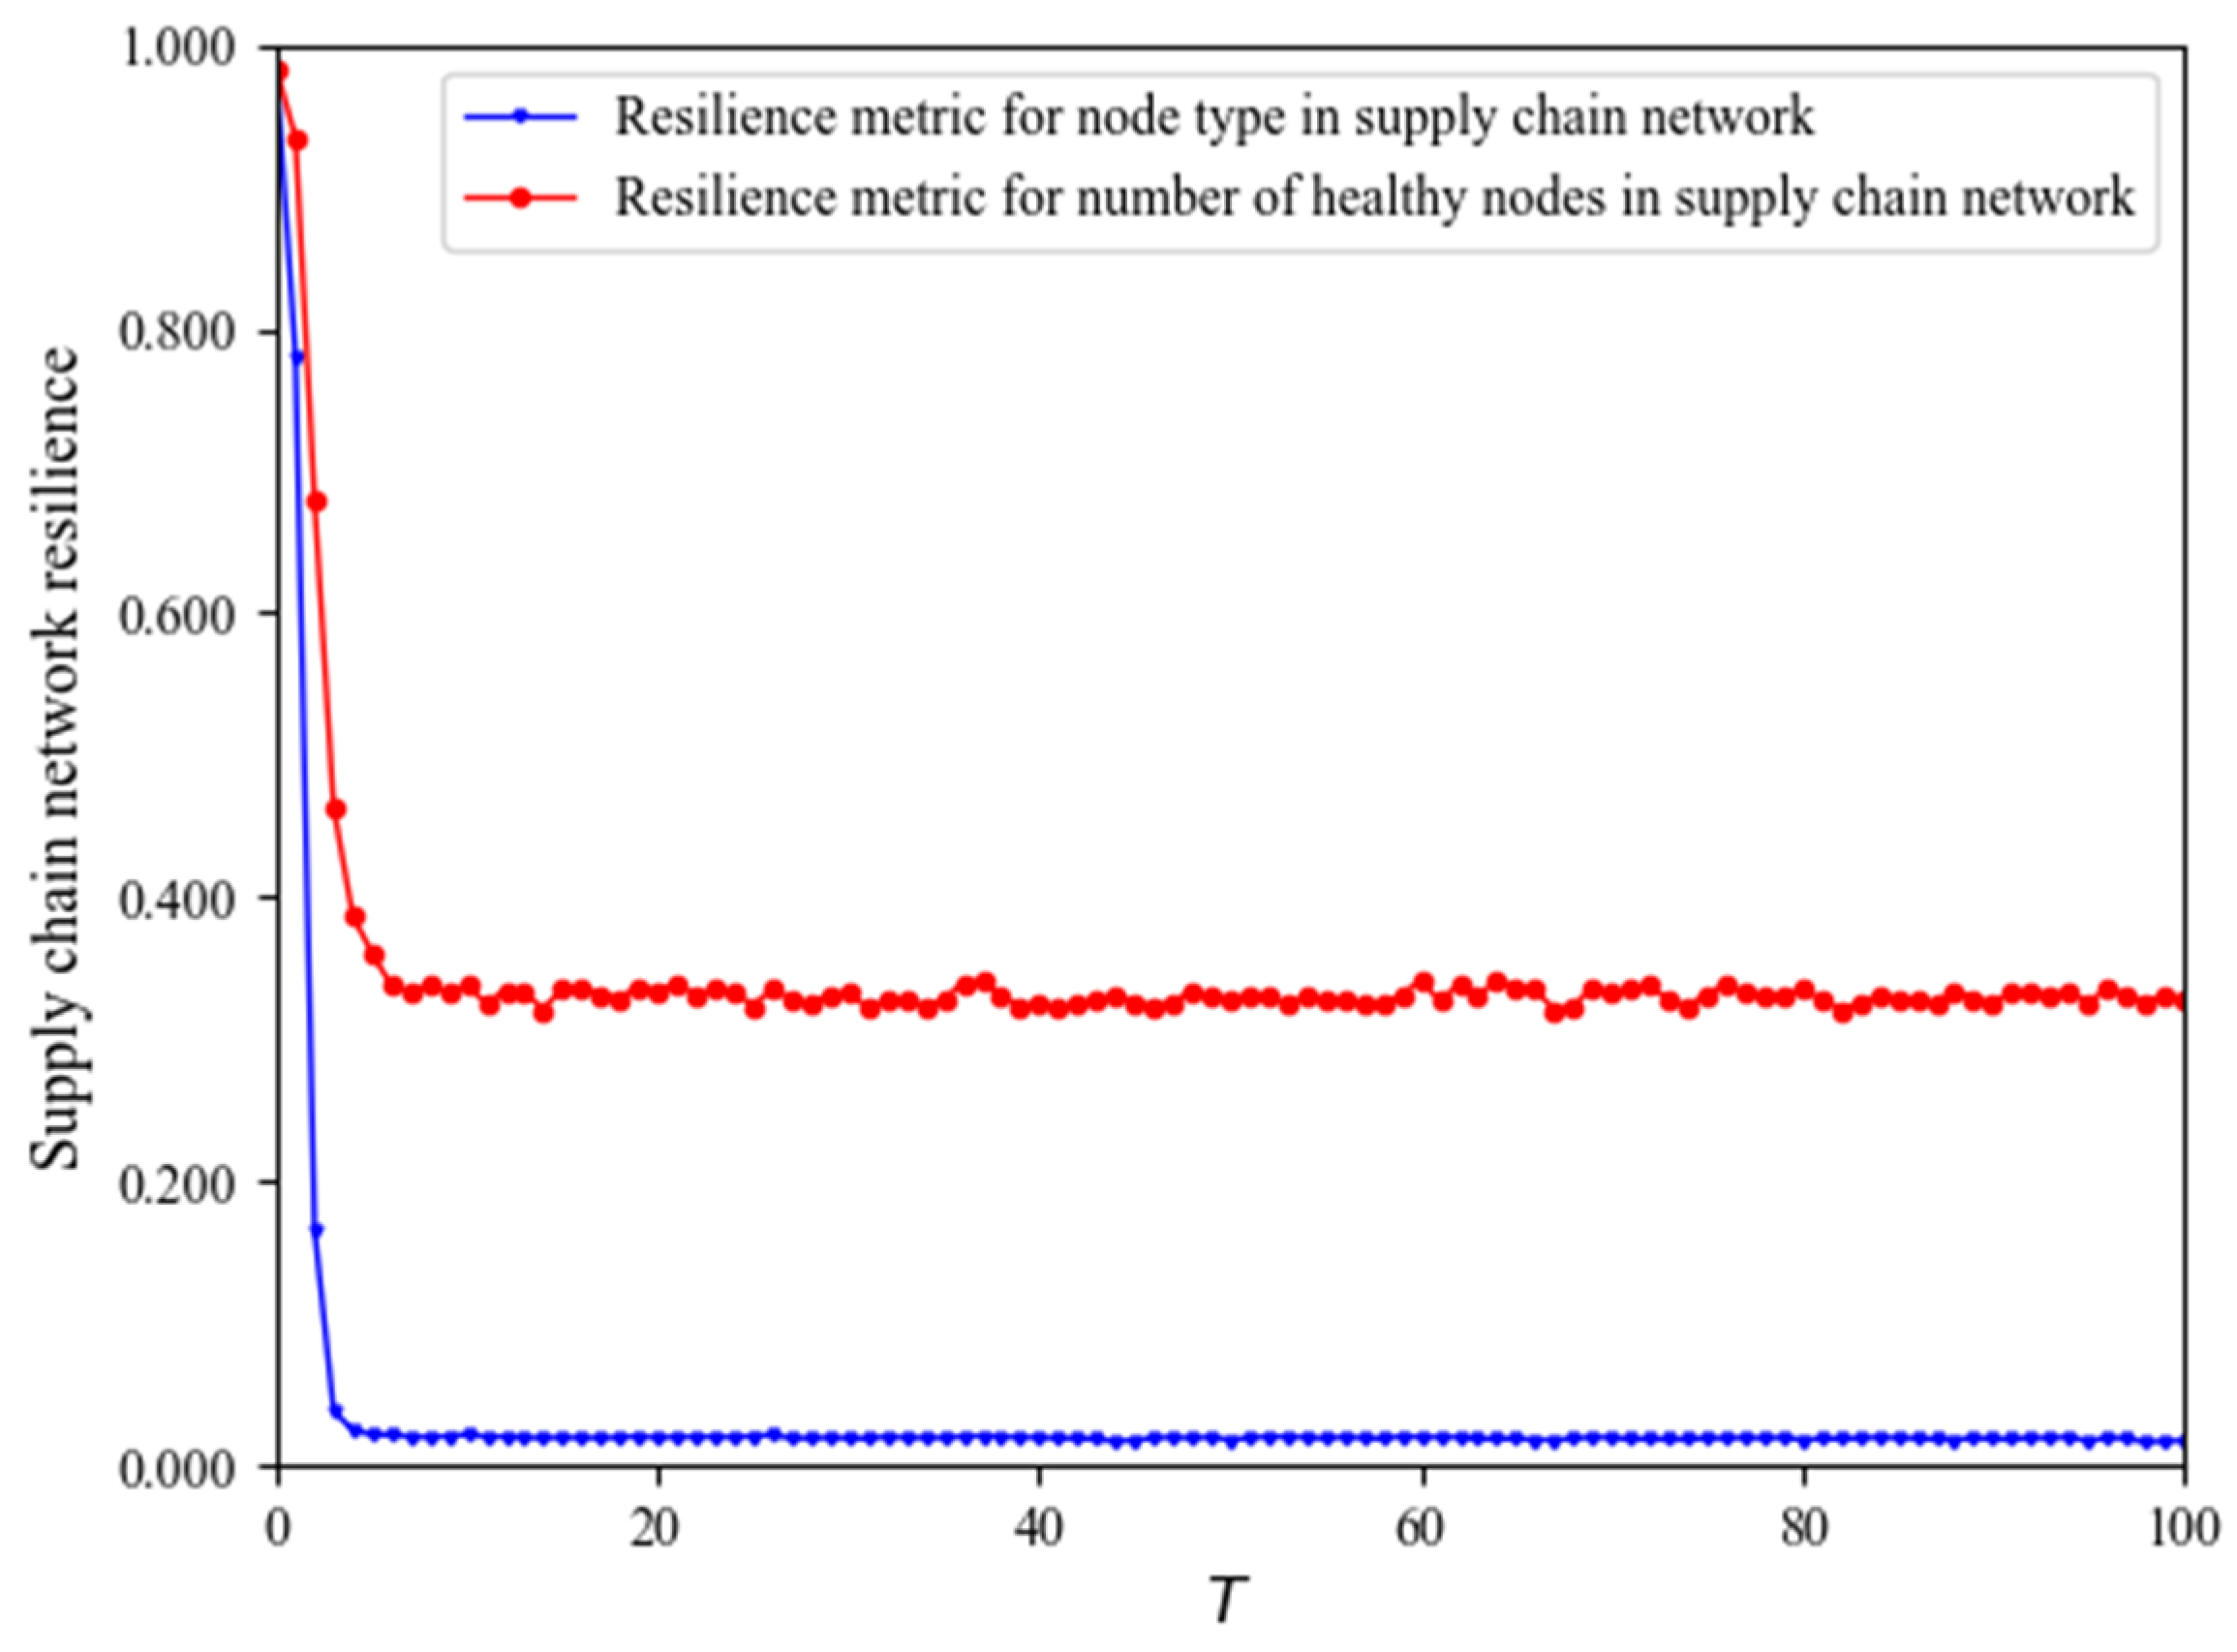
The results of the experiments under two metrics on the instances are shown in Figure 17. The horizontal coordinate in Figure 17 is the time step and the vertical coordinate is the SCNR at this time step. The blue curve represents the use of resilience metric y, and the red curve represents the use of resilience metric s. Both curves in Figure 17 go through an initial phase of plummeting and maintain a steady trend after reaching the steady state. When risk propagation occurs, the system has reached a steady state at T = 20, and we begin our analysis at this time step.
After calculation, when the SCN risk propagation reaches a steady state, the resilience of this actual SCN when measured by resilience metrics Y and S is 0.0191 and 0.6700, respectively. The experimental results of this case study show that our proposed SCN resilience metrics can be used to measure the resilience of real SCNs, which provides a richer choice for supply chain managers to measure the resilience of real SCNs. Our study can provide theoretical guidance for supply chain managers to adjust the SCN structure according to the demands of different SCNs in real life, and to build more resilient SCNs. In addition, our study may allow supply chain managers to utilize our proposed resilience metrics for a more rational measurement of the SCNs that exist in real life.
7. Conclusions
In this study, an SCN model with several real-life SCN characteristics was constructed. And the parameters of multiple network characteristics of the model can be adjusted. We combined it with the SIS model to construct an SCN risk propagation model. We proposed using the average of the maximum full-type subgraph sizes over a period of time after the SCN risk propagation reached a steady state as a new SCNR metric. We studied the effects of q, e, and S/R/M/D on SCNR when risk propagation reaches a steady state. The simulation results mainly indicated that the higher the value of e, the larger the value of Y; the larger the value of q, the smaller the value of Y; and the more uniform the distribution of S/R/M/D, the larger the value of Y. In addition, the two methods of intentional infection and random infection for the initial risky node types have no effect on SCNR.
When risk propagation occurs, managers can adjust the structure of the SCN to improve SCNR. Nodal companies with large degrees represent a low percentage of the SCN, and managers should focus on managing and protecting these nodes so that the impact of risk can be reduced. Managers can enhance inter-company communication and cooperation, as appropriate, to weather crises by increasing the transparency of an SCN. In addition, managers could reduce business transactions and avoid business expansion; in particular, they should reduce transactions with businesses of large size to reduce the impact caused by risks. Different types of node enterprises have different functions in an SCN, but all of them play equally important functions. Managers should choose a variety of different types of companies to work with in order to avoid the lack of a certain type of company causing the SCN not to function properly.
In our model, we assume that all nodes have the same probability of being infected and self-healing, but this is not always the case. The individual differences of enterprises in actual SCNs are very obvious, and the probability of being affected by risks may be different. In addition, we found that network characteristics have a significant impact on SCNR, but we only considered three network characteristics here. We believe that studying more factors affecting SCNR from the perspective of network characteristics is a challenging and meaningful direction for future research.
Author Contributions
Conceptualization, S.X. and X.S.; methodology, S.X. and M.L.; software, J.L. and M.L.; validation, S.X. and J.Y.; writing—original draft preparation, S.X.; writing—review and editing, S.X. and X.S. All authors have read and agreed to the published version of the manuscript.
Funding
This research was partially supported by the Natural Science Foundation of Sichuan Province (Grant No. 2023NSFSC0507), the Program for the HUST State Key Laboratory of Intelligent Manufacturing Equipment and Technology (Grant No. IMETKF2023026), and the Key Laboratory of Icing and Anti/De-icing of CARDC (Grant No. IADL 20220405).
Institutional Review Board Statement
Not applicable.
Informed Consent Statement
Not applicable.
Data Availability Statement
The data that support the findings of this study are available from the corresponding author upon reasonable request. The data are not publicly available due to privacy.
Conflicts of Interest
The authors declare no conflicts of interest.
References
- Ivanov, D.; Dolgui, A. OR-methods for coping with the ripple effect in supply chains during COVID-19 pandemic: Managerial insights and research implications. Int. J. Prod. Econ. 2021, 232, 107921. [Google Scholar] [CrossRef] [PubMed]
- Wu, D.; Wang, Q.; Olson, D.L. Industry classification based on supply chain network information using graph neural networks. Appl. Soft. Comput. 2023, 13, 09849. [Google Scholar] [CrossRef]
- Scheibe, K.P.; Blackhurst, J. Supply chain disruption propagation: A systemic risk and normal accident theory perspective. Int. J. Prod. Res. 2018, 561, 43–59. [Google Scholar] [CrossRef]
- Lei, Z.M.; Lim, M.K.; Cui, L.; Wang, Y.Z. Modelling of risk transmission and control strategy in the transnational supply chain. Int. J. Prod. Res. 2021, 59, 148–167. [Google Scholar] [CrossRef]
- Gu, M.H.; Huo, B.F. Supply chain elasticity research: Theory and influence mechanism. Supply. Chain Manag. 2020, 1, 46–56. [Google Scholar]
- Hosseini, S.; Ivanov, D.; Dolgui, A. Review of quantitative methods for supply chain resilience analysis. Transport. Res. E Logist. Transport. Rev. 2019, 125, 285–307. [Google Scholar] [CrossRef]
- Zidi, S.; Kermad, L.; Hamani, N.; Zidi, H. Reconfigurable Supply Chain Selection: Literature Review, Research Roadmap and New Trends. Appl. Sci. 2023, 13, 4561. [Google Scholar] [CrossRef]
- Hua, Y.; Zhang, Y.; Zhang, S.; Hou, F.; Kang, M. Using Building Information Modeling to Enhance Supply Chain Resilience in Prefabricated Buildings: A Conceptual Framework. Appl. Sci. 2023, 13, 12694. [Google Scholar] [CrossRef]
- Mubarik, M.S.; Naghavi, N.; Mubarik, M.; Kusi-Sarpong, S.; Khan, S.A.; Zaman, S.I.; Kazmi, S.H.A. Resilience and cleaner production in industry 4.0: Role of supply chain mapping and visibility. J. Clean. Prod. 2021, 292, 126058. [Google Scholar] [CrossRef]
- Mehrjerdi, Y.Z.; Shafiee, M. A resilient and sustainable closed-loop supply chain using multiple sourcing and information sharing strategies. J. Clean. Prod. 2021, 289, 125141. [Google Scholar] [CrossRef]
- Gruzauskas, V.; Burinskiene, A.; Krisciunas, A. Application of information-sharing for resilient and sustainable food delivery in last-mile logistics. Mathematics 2023, 11, 303. [Google Scholar] [CrossRef]
- Liu, Z.Y.; Hansen, D.W.; Chen, Z.Y. Leveraging digital twins to support industrial symbiosis networks: A case study in the norwegian wood supply chain collaboration. Sustainability 2023, 15, 2647. [Google Scholar] [CrossRef]
- Lohmer, J.; Bugert, N.; Lasch, R. Analysis of resilience strategies and ripple effect in blockchain-coordinated supply chains: An agent-based simulation study. Int. J. Prod. Econ. 2020, 228, 107882. [Google Scholar] [CrossRef] [PubMed]
- Dubey, R.; Gunasekaran, A.; Bryde, D.J.; Dwivedi, Y.K.; Papadopoulos, T. Blockchain technology for enhancing swift-trust, collaboration and resilience within a humanitarian supply chain setting. Int. J. Prod. Res. 2020, 58, 3381–3398. [Google Scholar] [CrossRef]
- Li, Y.H.; Zobel, C.W. Exploring supply chain network resilience in the presence of the ripple effect. Int. J. Prod. Econ. 2020, 228, 107693. [Google Scholar] [CrossRef]
- Li, Y.H.; Zobel, C.W.; Seref, O.; Chatfield, D. Network characteristics and supply chain resilience under conditions of risk propagation. Int. J. Prod. Econ. 2020, 223, 107529. [Google Scholar] [CrossRef]
- Ortt, R.; Stolwijk, C.; Punter, M. Implementing Industry 4.0: Assessing the current state. J. Manuf. Technol. Manag. 2022, 31, 825–836. [Google Scholar] [CrossRef]
- Spieske, A.; Birkel, H. Improving supply chain resilience through industry 4.0: A systematic literature review under the impressions of the COVID-19 pandemic. Comput. Ind. Eng. 2021, 158, 107452. [Google Scholar] [CrossRef]
- Marinagi, C.; Reklitis, P.; Trivellas, P.; Sakas, D. The impact of industry 4.0 technologies on key performance indicators for a resilient supply chain 4.0. Sustainability 2023, 15, 5185. [Google Scholar] [CrossRef]
- Ivanov, D.; Dolgui, A. A digital supply chain twin for managing the disruption risks and resilience in the era of Industry 4.0. Prod. Plan. Control 2021, 32, 775–788. [Google Scholar] [CrossRef]
- Qader, G.; Junaid, M.; Abbas, Q.; Mubarik, M.S. Industry 4.0 enables supply chain resilience and supply chain performance. Technol. Forecast. Soc. 2022, 185, 122026. [Google Scholar] [CrossRef]
- Ivanov, D.; Dolgui, A.; Sokolov, B. The impact of digital technology and Industry 4.0 on the ripple effect and supply chain risk analytics. Int. J. Prod. Res. 2019, 57, 829–846. [Google Scholar] [CrossRef]
- Shi, X.Q.; Yuan, X.J.; Deng, D.S. Research on supply network resilience considering the ripple effect with collaboration. Int. J. Prod. Res. 2022, 60, 5553–5570. [Google Scholar] [CrossRef]
- Wang, J.P.; Zhou, H.; Jin, X.D. Risk transmission in complex supply chain network with multi-drivers. Chaos. Soliton. Fract. 2021, 143, 110259. [Google Scholar] [CrossRef]
- Zhao, P.X.; Li, Z.Y.; Han, X.; Duan, X.Y. Supply chain network resilience by considering disruption propagation: Topological and operational perspectives. IEEE. Syst. J. 2022, 16, 5305–5316. [Google Scholar] [CrossRef]
- Zhang, Z.H.; Li, W.; Wu, J.; Chai, L.H. Eco-industrial parks’ structural characteristics and mechanisms: A case of Xinzhuang and comparison studies. J. Clean. Prod. 2020, 268, 121764. [Google Scholar] [CrossRef]
- Basole, R.C.; Bellamy, M.A. Supply network structure, visibility, and risk diffusion: A computational approach. Decision. Sci. 2014, 45, 753–789. [Google Scholar] [CrossRef]
- Zhao, K.; Kumar, A.; Harrison, T.P.; Yen, J. Analyzing the resilience of complex supply network topologies against random and targeted disruptions. IEEE. Syst. J. 2011, 5, 28–39. [Google Scholar] [CrossRef]
- Wu, Y.P.; Chen, Z.L.; Zhao, X.D.; Liu, Y.; Zhang, P.; Liu, Y.J. Robust analysis of cascading failures in complex networks. Phys. A Stat. Mech. Its Appl. 2021, 583, 126320. [Google Scholar] [CrossRef]
- Shi, X.Q.; Long, W.; Li, Y.Y.; Deng, D.S. Robustness of interdependent supply chain networks against both functional and structural cascading failures. Phys. A Stat. Mech. Its Appl. 2022, 586, 126518. [Google Scholar] [CrossRef]
- Shi, X.Q.; Deng, D.S.; Long, W.; Li, Y.Y.; Yu, X.J. Research on the robustness of interdependent supply networks with tunable parameters. Comput. Ind. Eng. 2021, 158, 107431. [Google Scholar] [CrossRef]
- Auffray, N.; Bouchet, R.; Brechet, Y. Derivation of anisotropic matrix for bi-dimensional strain-gradient elasticity behavior. Int. J. Solids. Struct. 2009, 46, 440–454. [Google Scholar] [CrossRef]
- García-Rudolph, A.; Sanchez-Pinsach, D.; Frey, D.; Opisso, E.; Cisek, K.; Kelleher, J.D. Know an Emotion by the Company It Keeps: Word Embeddings from Reddit/Coronavirus. Appl. Sci. 2023, 13, 6713. [Google Scholar] [CrossRef]
- Bacchi, S.; Licinio, J. Resilience and psychological distress in psychology and medical students. Acad. Psychiatr. 2017, 41, 185–188. [Google Scholar] [CrossRef] [PubMed]
- Bona, S.; Silva-Afonso, A.; Gomes, R.; Matos, R.; Rodrigues, F. Nature-Based Solutions in Urban Areas: A European Analysis. Appl. Sci. 2023, 13, 168. [Google Scholar] [CrossRef]
- Tombe, R.; Smuts, H. Agricultural Social Networks: An Agricultural Value Chain-Based Digitalization Framework for an Inclusive Digital Economy. Appl. Sci. 2023, 13, 6382. [Google Scholar] [CrossRef]
- Wang, Q.; Jiang, R. Is China’s economic growth decoupled from carbon emissions? J. Clean. Prod. 2019, 225, 1194–1208. [Google Scholar] [CrossRef]
- Taleizadeh, A.A.; Ahmadzadeh, K.; Sarker, B.R.; Ghavamifar, A. Designing an optimal sustainable supply chain system considering pricing decisions and resilience factors. J. Clean. Prod. 2022, 332, 129895. [Google Scholar] [CrossRef]
- Ponomarov, S.Y.; Holcomb, M.C. Understanding the concept of supply chain resilience. Int. J. Logist. Manag. 2009, 20, 124–143. [Google Scholar] [CrossRef]
- Lotfi, R.; Gholamrezaei, A.; Kadłubek, M.; Afshar, M.; Ali, S.S.; Kheiri, K. A robust and resilience machine learning for forecasting agri-food production. Sci. Rep. 2022, 12, 21787. [Google Scholar] [CrossRef]
- Freitas, K.A.D.; Flynn, B.B.; Paiva, E.L.; Awaysheh, A. Achieving risk resilience in an environment of mistrust: Supply chain piracy of physical goods. Int. J. Oper. Prod. Manag. 2024, 44, 565–590. [Google Scholar] [CrossRef]
- Ivanov, D.; Dolgui, A.; Sokolov, B.; Ivanova, M. Literature review on disruption recovery in the supply chain. Int. J. Prod. Res. 2017, 55, 6158–6174. [Google Scholar] [CrossRef]
- Kim, Y.; Chen, Y.S.; Linderman, K. Supply network disruption and resilience: A network structural perspective. J. Oper. Manag. 2015, 33, 43–59. [Google Scholar] [CrossRef]
- Snyder, L.V.; Atan, Z.; Peng, P.; Rong, Y.; Schmitt, A.J.; Sinsoysal, B. OR/MS models for supply chain disruptions: A review. IIE Trans. 2016, 48, 89–109. [Google Scholar] [CrossRef]
- Shi, X.Q.; Long, W.; Li, Y.Y.; Deng, D.S.; Wei, Y.L.; Liu, H.G. Research on supply network resilience considering random and targeted disruptions simultaneously. Int. J. Prod. Res. 2020, 58, 6670–6688. [Google Scholar] [CrossRef]
- Shao, L.G.; Jin, S.Z. Resilience assessment of the lithium supply chain in China under impact of new energy vehicles and supply interruption. J. Clean. Prod. 2020, 252, 119624. [Google Scholar] [CrossRef]
- Yan, W.Y.; Cao, H.B.; Zhang, Y.; Ning, P.G.; Song, Q.B.; Yang, J.X.; Sun, Z. Rethinking Chinese supply resilience of critical metals in lithium-ion batteries. J. Clean. Prod. 2020, 256, 120719. [Google Scholar] [CrossRef]
- Wang, H.C.; Zhang, X.Y. Research on supply chain risk transmission mechanism based on improved SIRS model. Math. Prob. Eng. 2022, 2022, 9502793. [Google Scholar] [CrossRef]
- Huo, L.A.; Guo, H.Y.; Cheng, Y.Y.; Xie, X.X. A new model for supply chain risk propagation considering herd mentality and risk preference under warning information on multiplex networks. Phys. A Stat. Mech. Its Appl. 2020, 545, 12306. [Google Scholar] [CrossRef]
- Ivanov, D. Predicting the impacts of epidemic outbreaks on global supply chains: A simulation-based analysis on the coronavirus outbreak (COVID-19/SARS-CoV-2) case. Transport. Res. E Logist. Transport. Rev. 2020, 136, 101922. [Google Scholar] [CrossRef]
- Wang, Z.S.; Xia, C.Y.; Chen, Z.Q.; Chen, G.R. Epidemic propagation with positive and negative preventive information in multiplex networks. IEEE Trans. Cybern. 2020, 51, 1454–1462. [Google Scholar] [CrossRef] [PubMed]
- Chen, T.T.; Li, Y.; Jiang, X.F.; Shao, L.J. Spatiotemporal patterns of risk propagation in complex financial networks. Appl. Sci. 2023, 13, 1129. [Google Scholar] [CrossRef]
- Zhao, Z.B.; Chen, D.L.; Wang, L.Q.; Han, C.Q. Credit risk diffusion in supply chain finance: A complex networks perspective. Sustainability 2018, 10, 4608. [Google Scholar] [CrossRef]
- Ghadge, A.; Er, M.; Ivanov, D.; Chaudhuri, A. Visualisation of ripple effect in supply chains under long-term, simultaneous disruptions: A system dynamics approach. Int. J. Prod. Res. 2022, 60, 6173–6186. [Google Scholar] [CrossRef]
- Liang, D.; Bhamra, R.; Liu, Z.; Pan, Y. Risk propagation and supply chain health control based on the SIR epidemic model. Mathematics 2022, 10, 3008. [Google Scholar] [CrossRef]
- Alkahtani, M. Mathematical modelling of inventory and process outsourcing for optimization of supply chain management. Mathematics 2022, 10, 1142. [Google Scholar] [CrossRef]
- Gomez, M.; Garcia, S.; Rajtmajer, S.; Grady, C.; Mejia, A. Fragility of a multilayer network of intranational supply chains. Appl. Netw. Sci. 2020, 5, 71. [Google Scholar] [CrossRef]
- Hosseini, S.; Ivanov, D. A multi-layer bayesian network method for supply chain disruption modelling in the wake of the COVID-19 pandemic. Int. J. Prod. Res. 2022, 60, 5258–5276. [Google Scholar] [CrossRef]
- Yue, X.P.; Mu, D.; Wang, C.; Ren, H.Y.; Ghadimi, P. Topological structure and COVID-19 related risk propagation in TFT-LCD supply networks. Int. J. Prod. Res. 2023, 61, 2758–2778. [Google Scholar] [CrossRef]
- Wiedmer, R.; Griffis, S.E. Structural characteristics of complex supply chain networks. J. Bus. Logist. 2021, 42, 264–290. [Google Scholar] [CrossRef]
- Qian, X.D.; Dai, Y.F. Evolution of the complex supply chain network based on deviation from the power-law distribution. Appl. Sci. 2022, 12, 7483. [Google Scholar] [CrossRef]
- Wan, Z.; Mahajan, Y.; Kang, B.W.; Moore, T.J.; Cho, J.H. A survey on centrality metrics and their network resilience analysis. IEEE Access 2021, 9, 104773–104819. [Google Scholar] [CrossRef]
- Barabási, A.L.; Albert, R. Emergence of scaling in random networks. Science 1999, 286, 509–512. [Google Scholar] [CrossRef]
- Holme, P.; Kim, B.J. Growing scale-free networks with tunable clustering. Phys. Rev. E 2002, 65, 026107. [Google Scholar] [CrossRef]
- Al Hasan, M.; Dave, V.S. Triangle counting in large networks: A review. Wires. Data. Min. Knowl. 2018, 8, e1226. [Google Scholar] [CrossRef]
- Pastor-Satorras, R.; Castellano, C.; Van Mieghem, P.; Vespignani, A. Epidemic processes in complex networks. Rev. Mod. Phys. 2015, 87, 925. [Google Scholar] [CrossRef]
- Ni, Q.; Tang, M.; Liu, Y.; Lai, Y.C. Machine learning dynamical phase transitions in complex networks. Phys. Rev. E 2019, 100, 052312. [Google Scholar] [CrossRef]
- Rishehchi Fayyaz, M.; Rasouli, M.R.; Amiri, B. A data-driven and network-aware approach for credit risk prediction in supply chain finance. Ind. Manag. Data Syst. 2021, 121, 785–808. [Google Scholar] [CrossRef]
- Ma, F.; Xue, H.F.; Yuen, K.F.; Sun, Q.P.; Zhao, S.M.; Zhang, Y.X.; Huang, K. Assessing the vulnerability of logistics service supply chain based on complex network. Sustainability 2020, 12, 1991. [Google Scholar] [CrossRef]
- Willems, S.P. Data set real world multiechelon supply chains used for inventory optimization. Manuf. Serv. Oper. Manag. 2008, 10, 19–23. [Google Scholar] [CrossRef]
Figure 1.
The process of generating an SCN from this model.
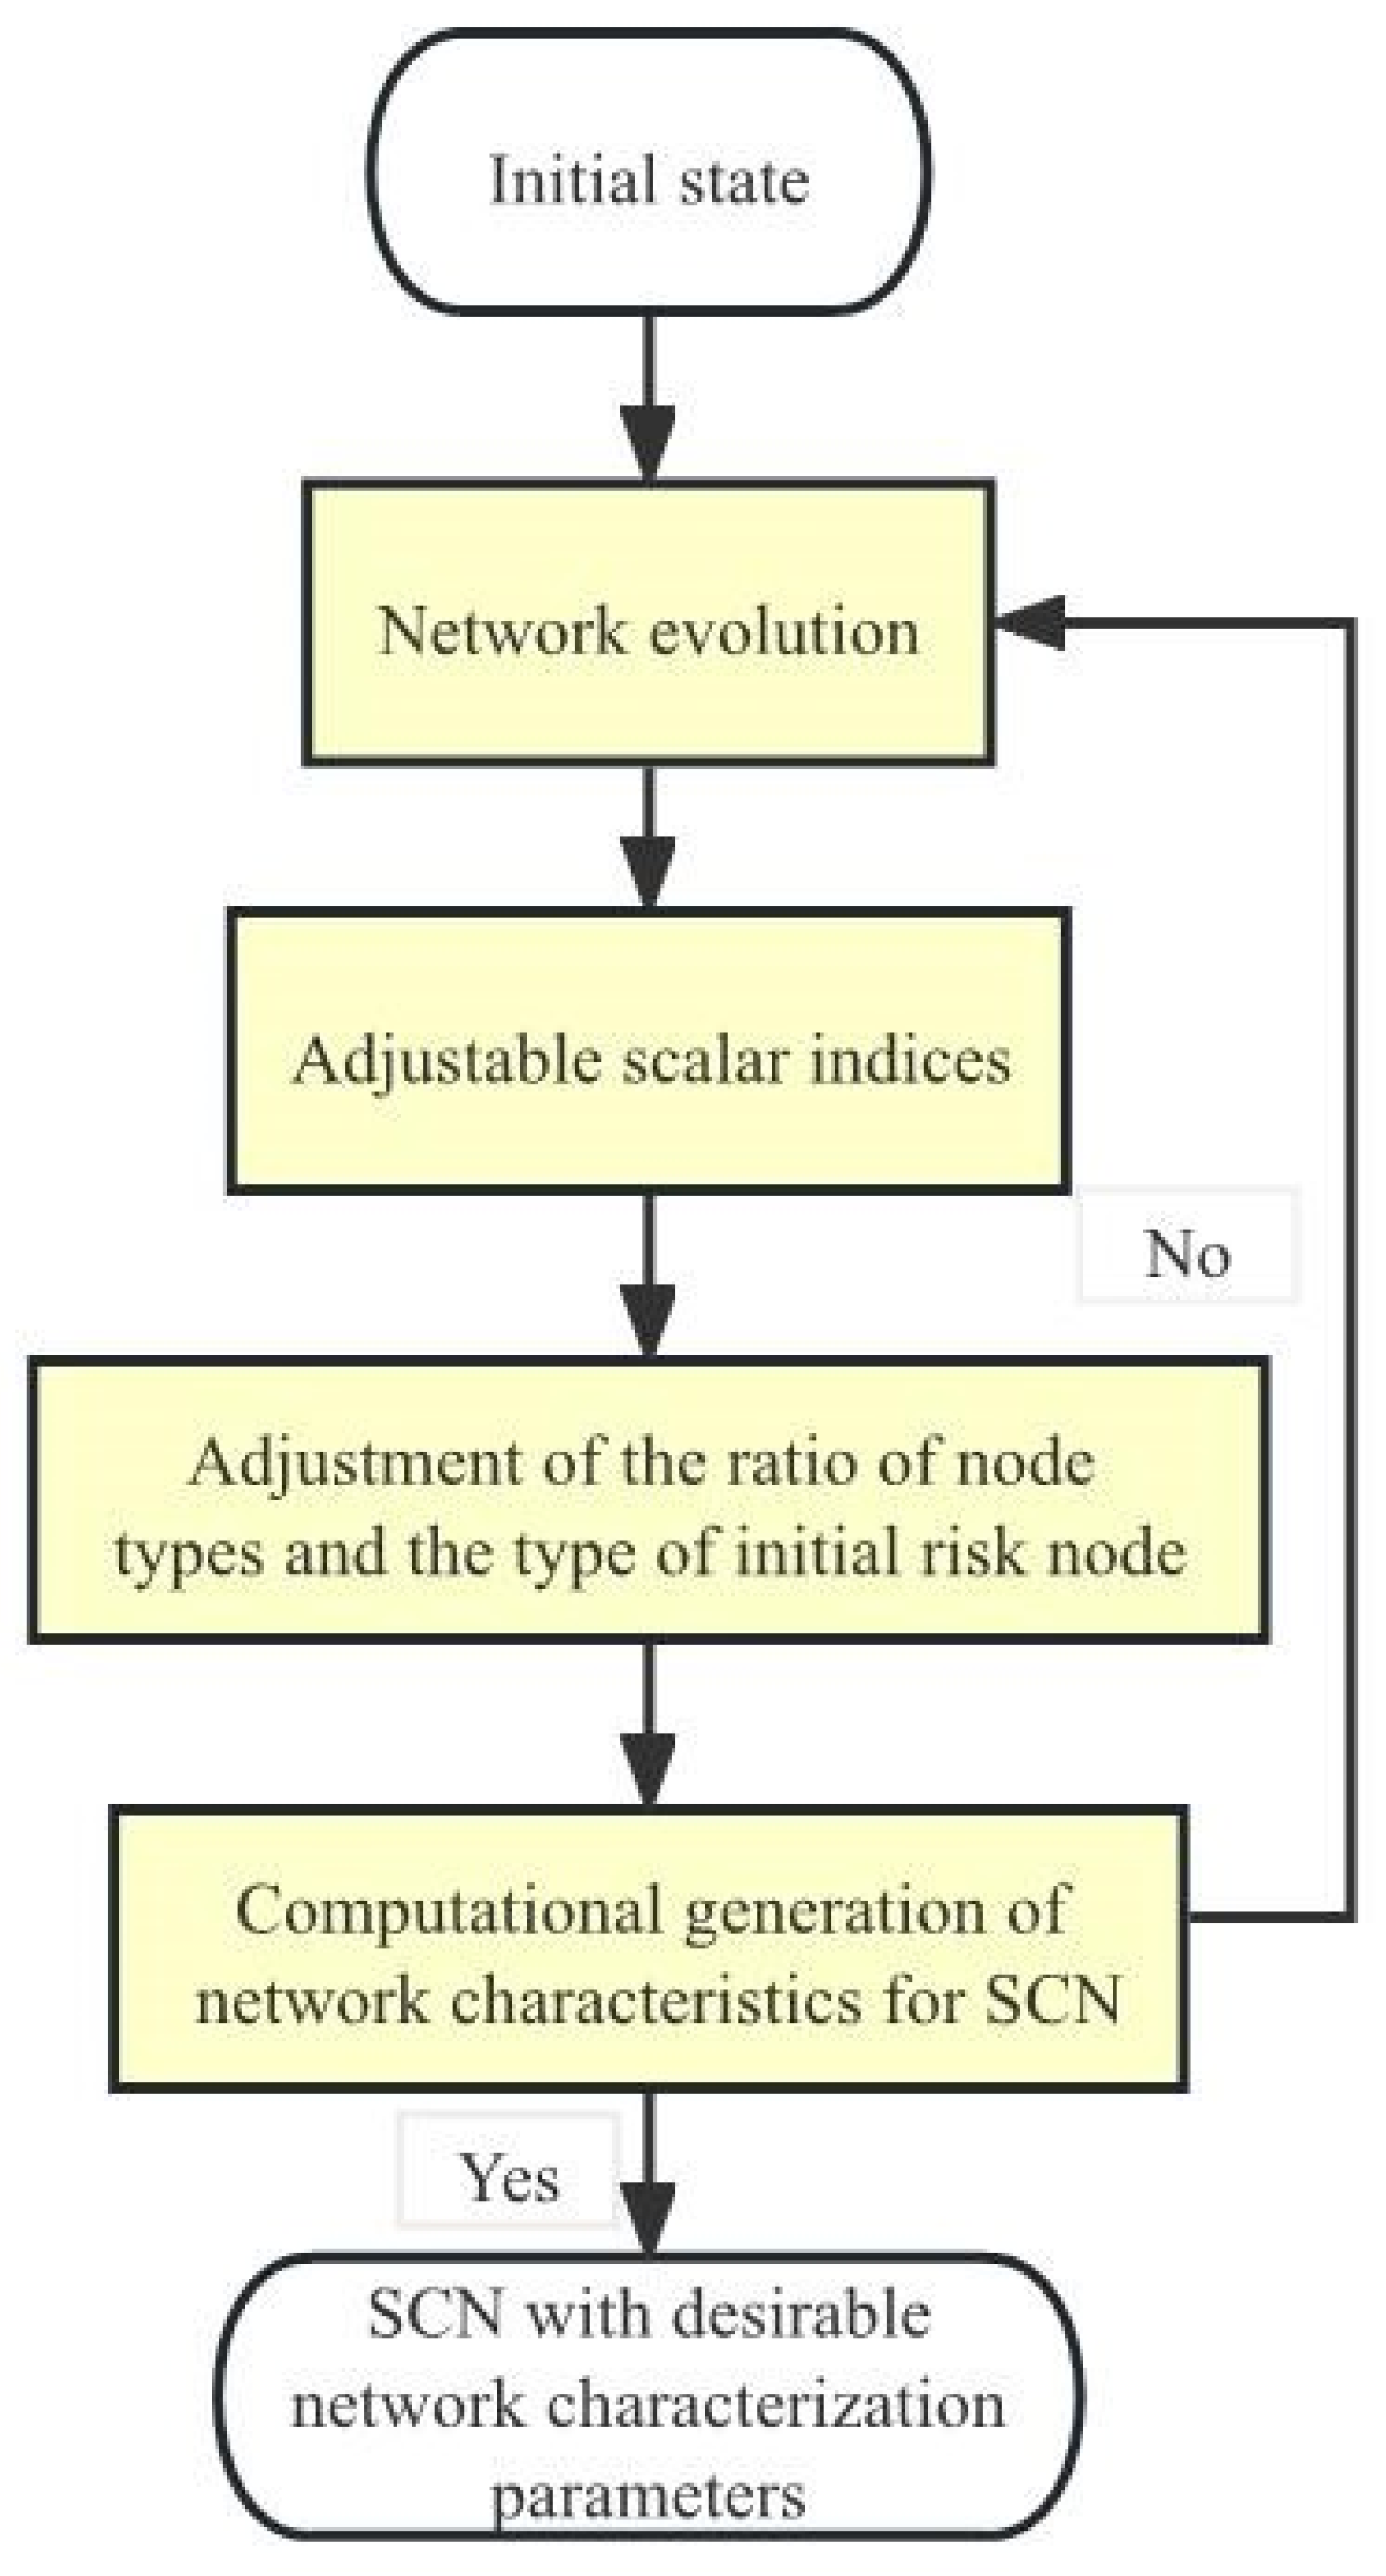
Figure 2.
The resilience of SCNs at each time step for different scalar indices when using the resilience metric y.
Figure 2.
The resilience of SCNs at each time step for different scalar indices when using the resilience metric y.
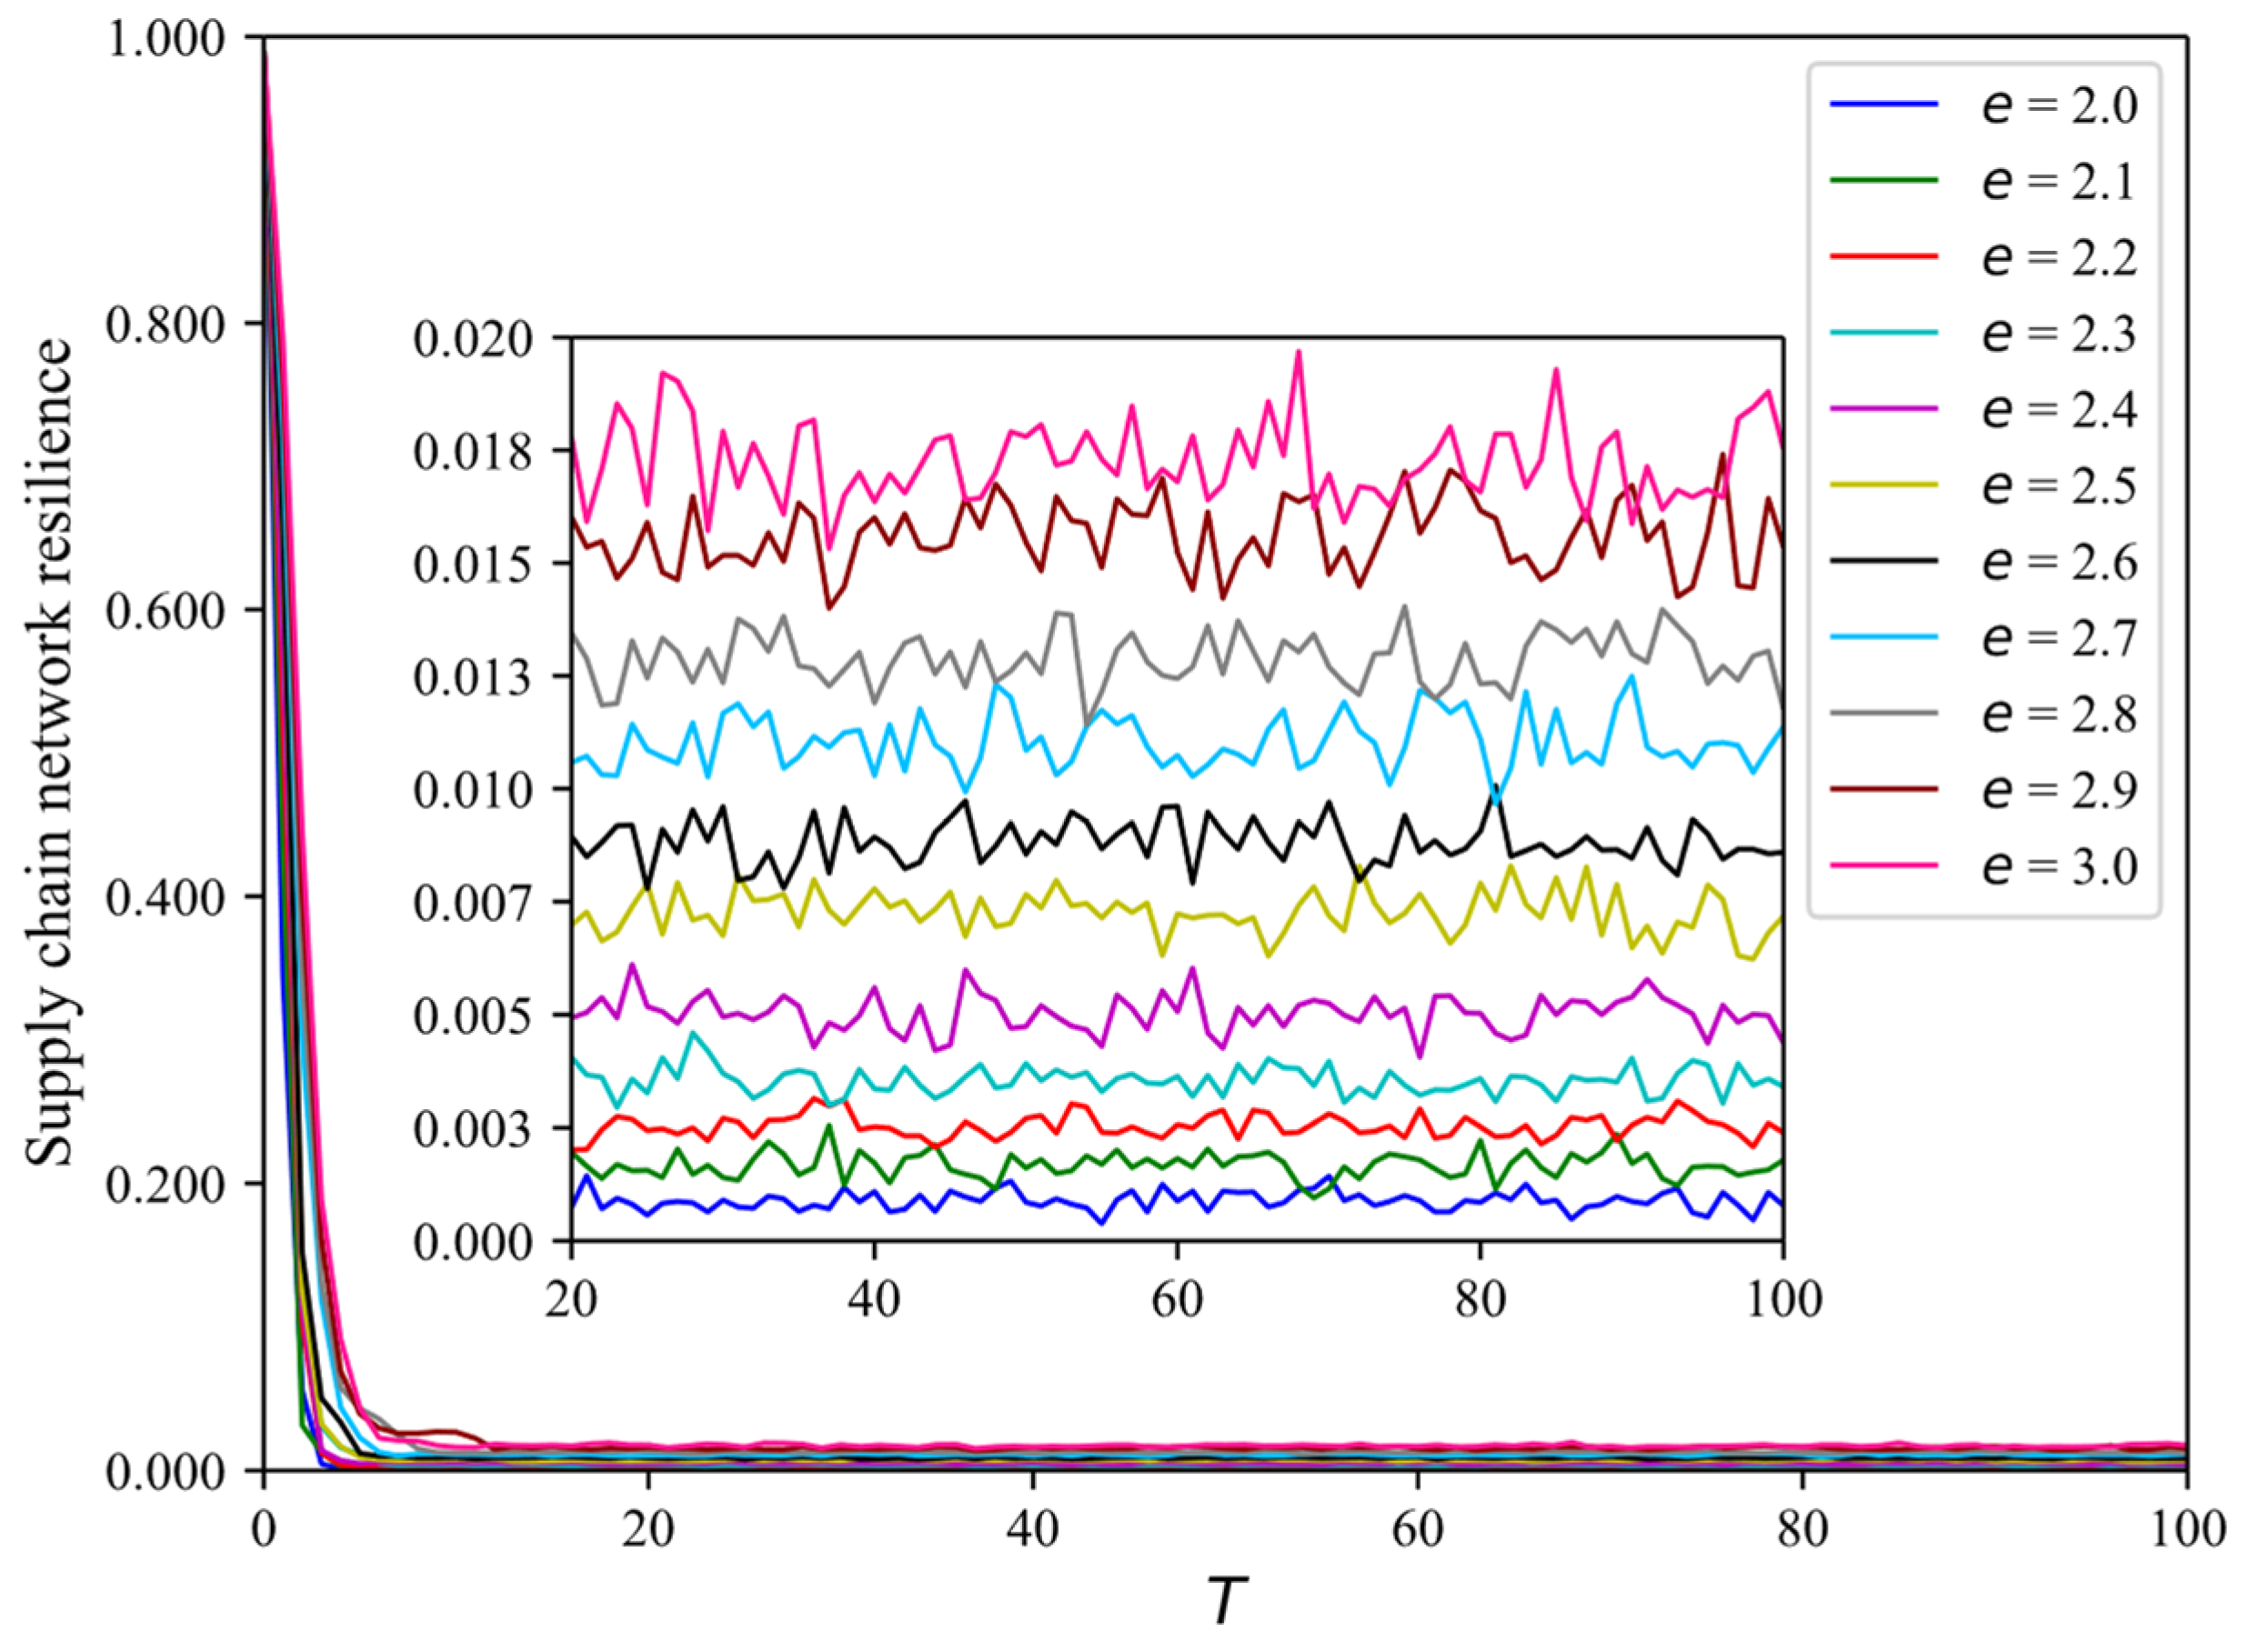
Figure 3.
The resilience of SCNs at each time step for different scalar indices when using the resilience metric s.
Figure 3.
The resilience of SCNs at each time step for different scalar indices when using the resilience metric s.
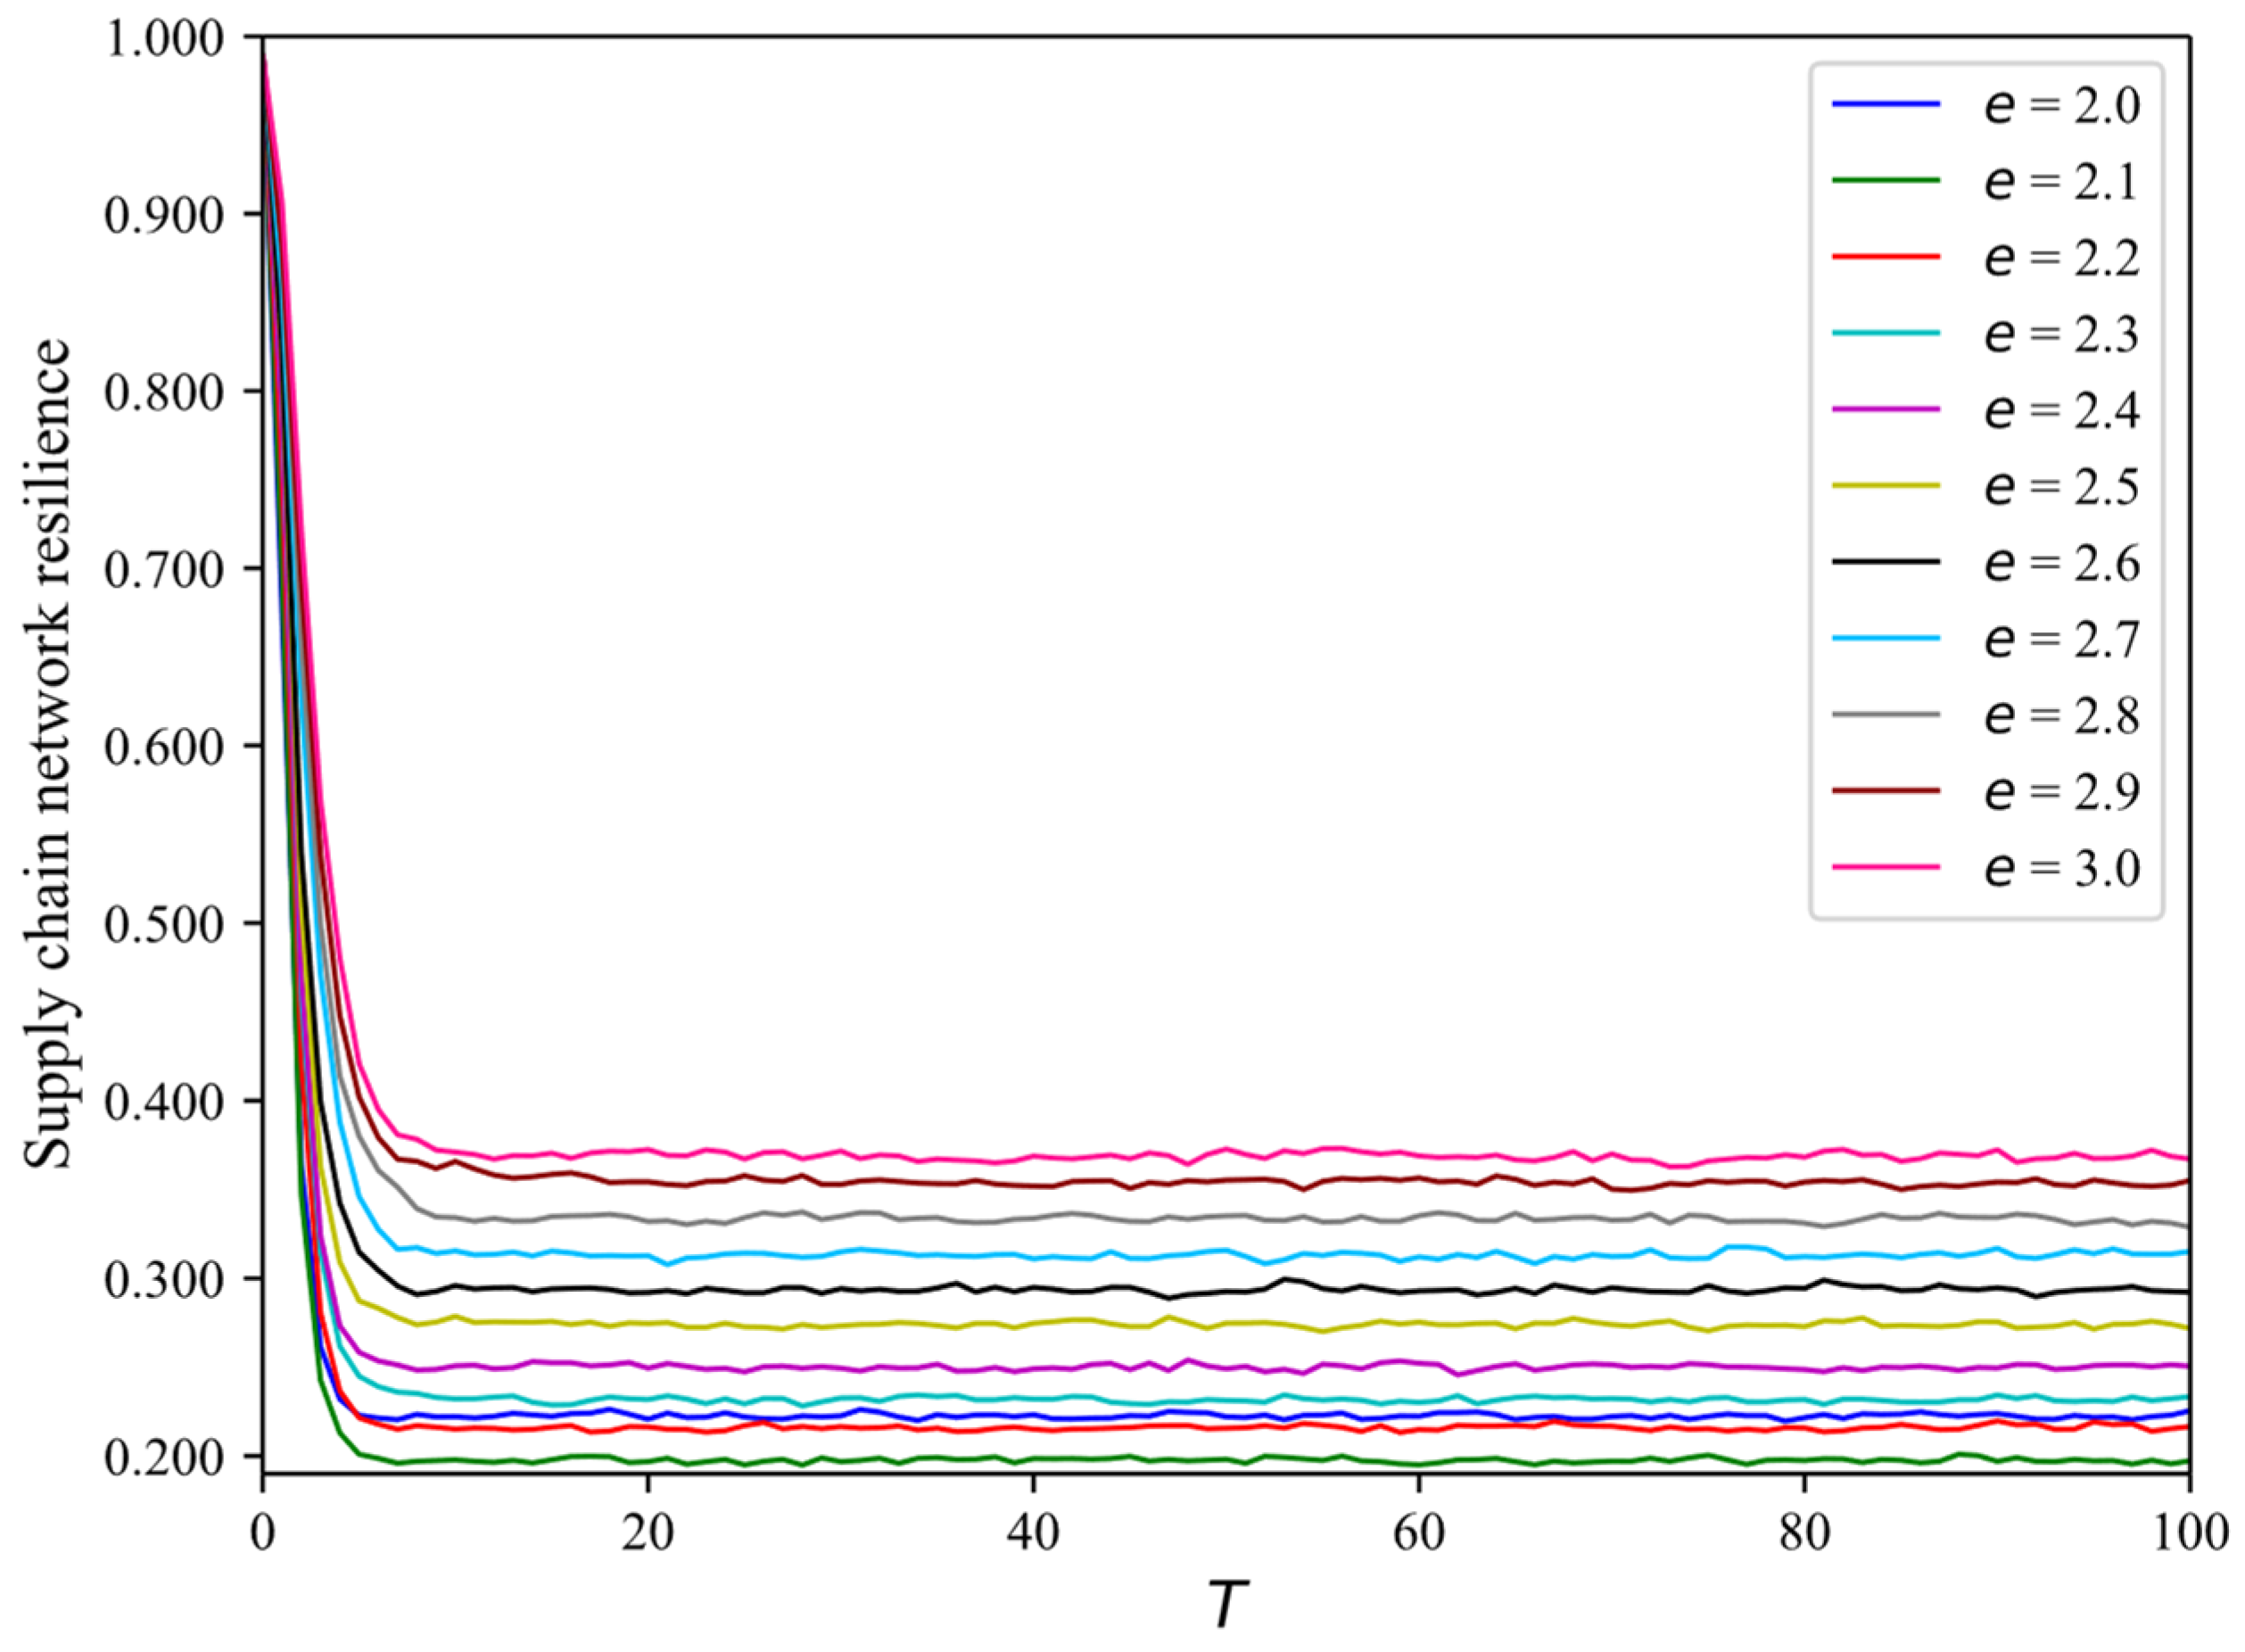
Figure 4.
The resilience of SCNs for different scalar indices when using the resilience metric Y.
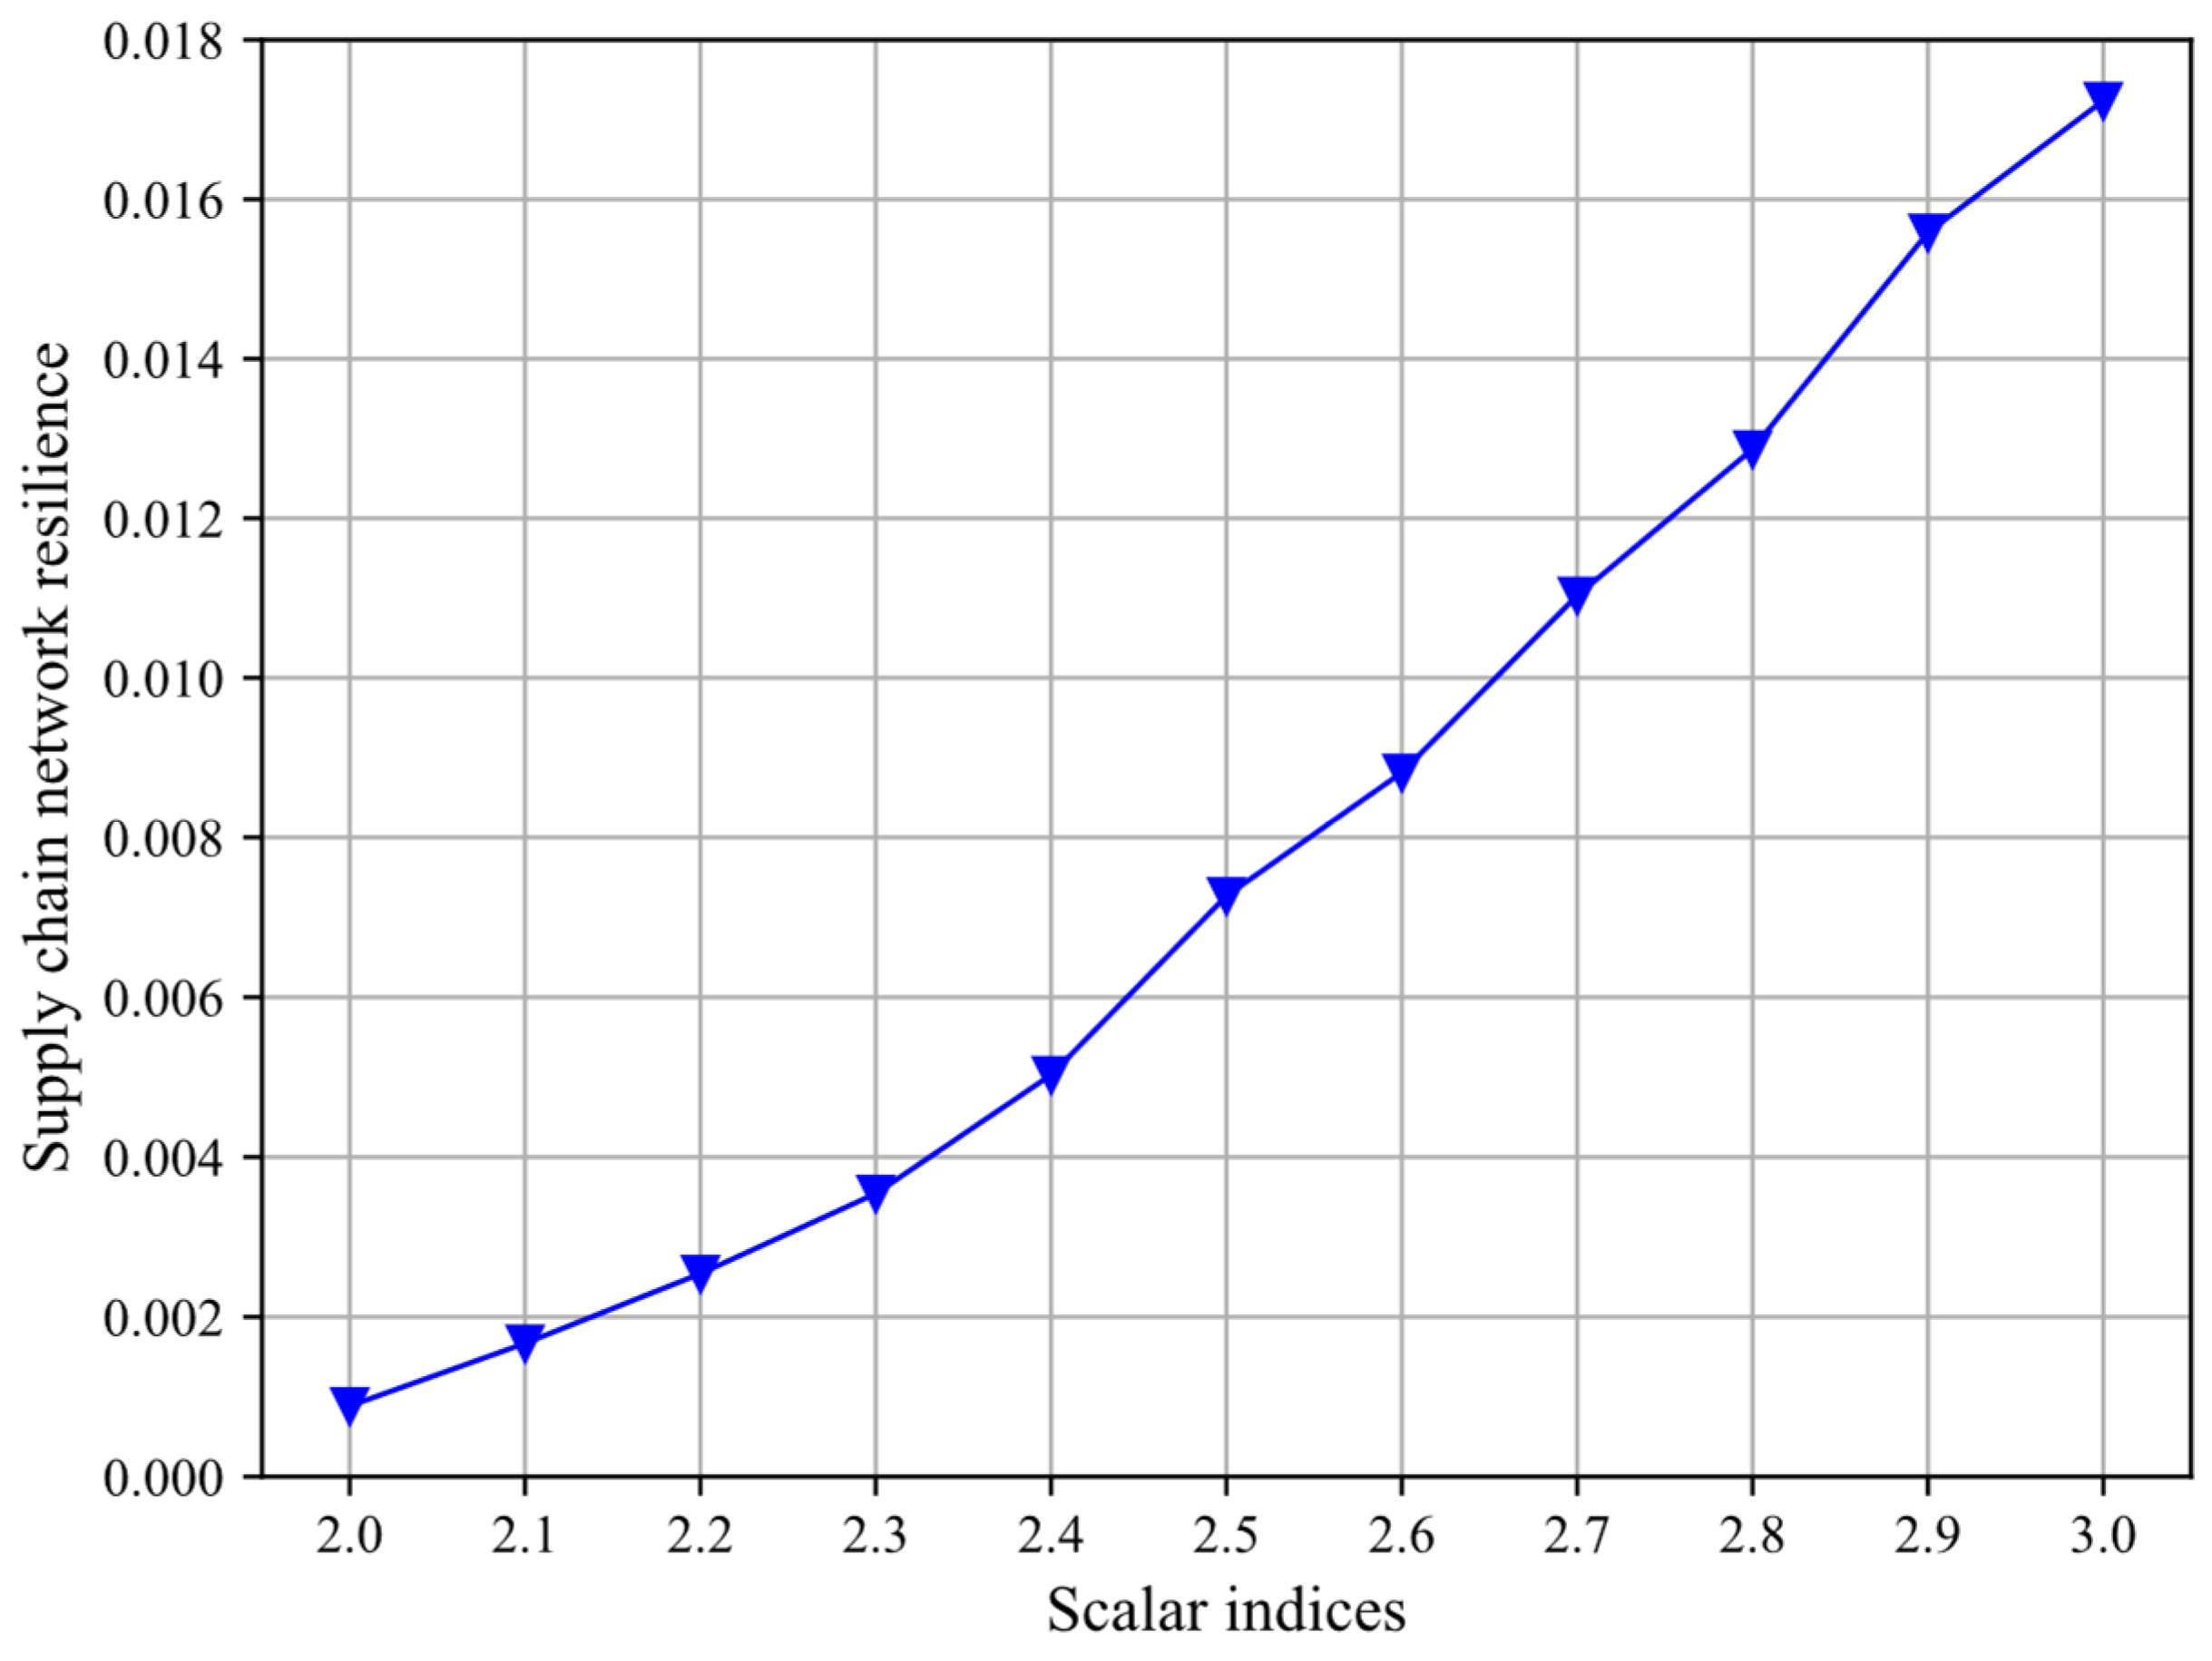
Figure 5.
The resilience of SCNs for different scalar indices when using the resilience metric S.
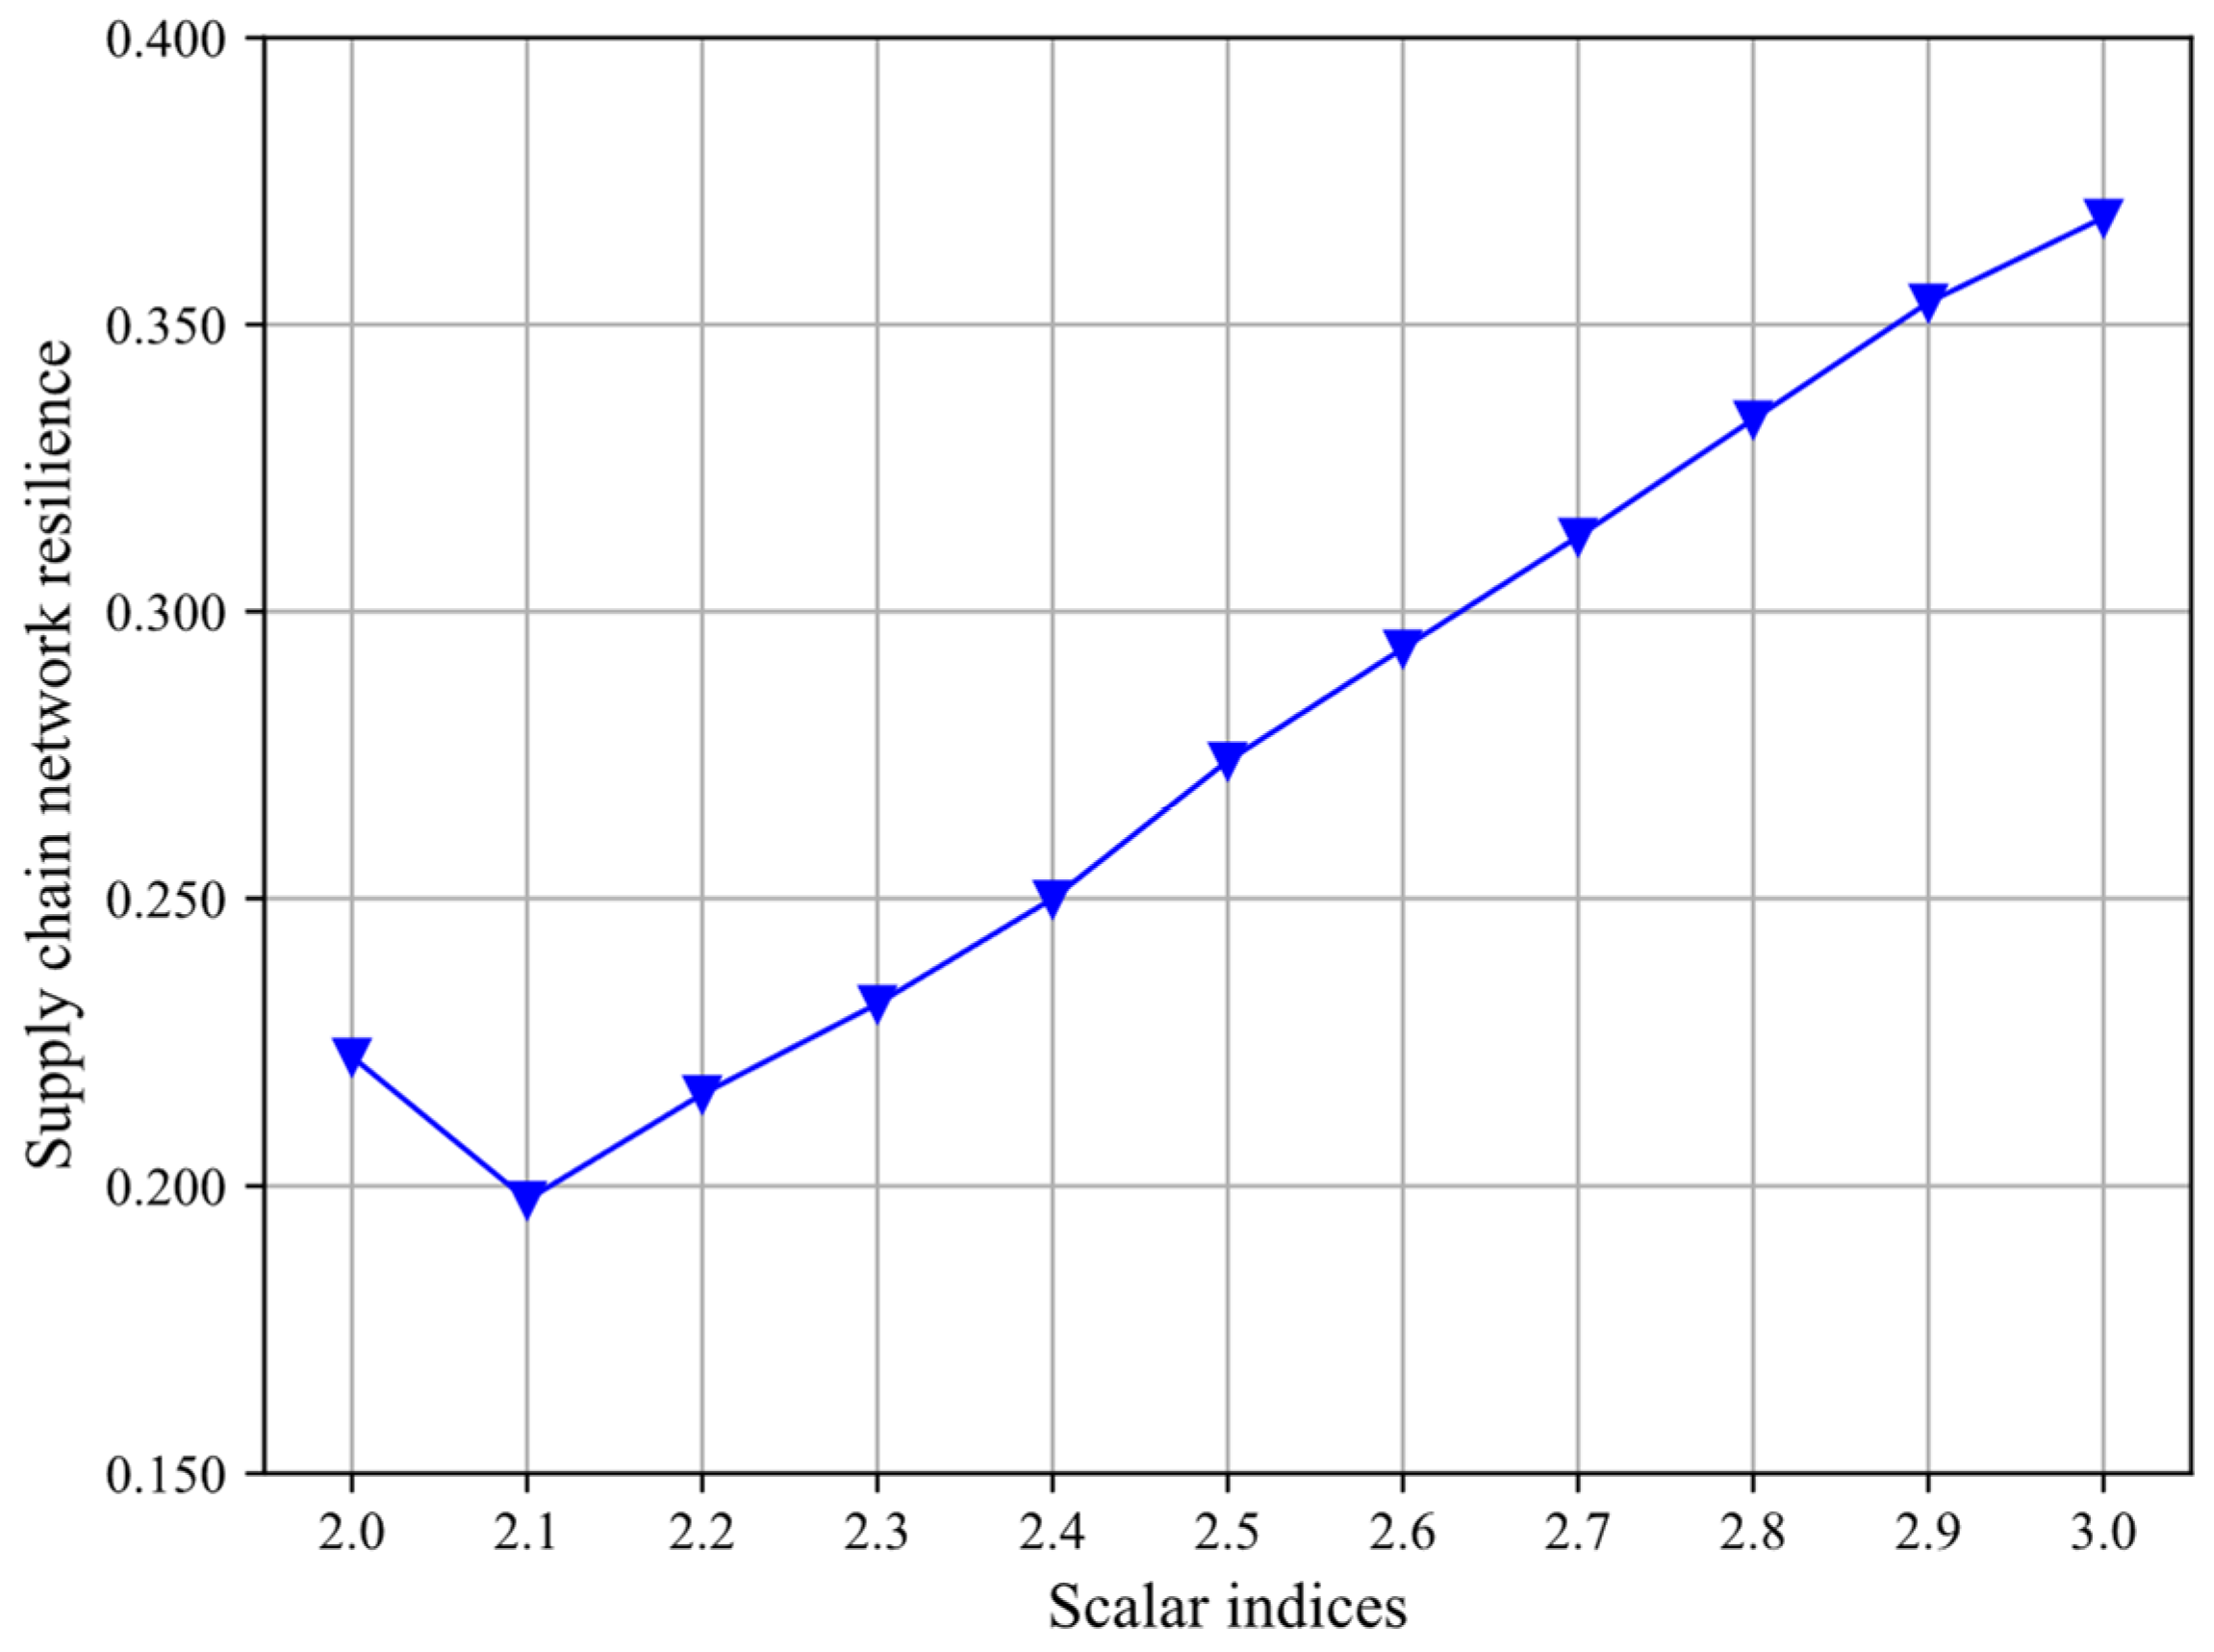
Figure 6.
The resilience of SCNs at each time step for different clustering coefficients when using the resilience metric y.
Figure 6.
The resilience of SCNs at each time step for different clustering coefficients when using the resilience metric y.
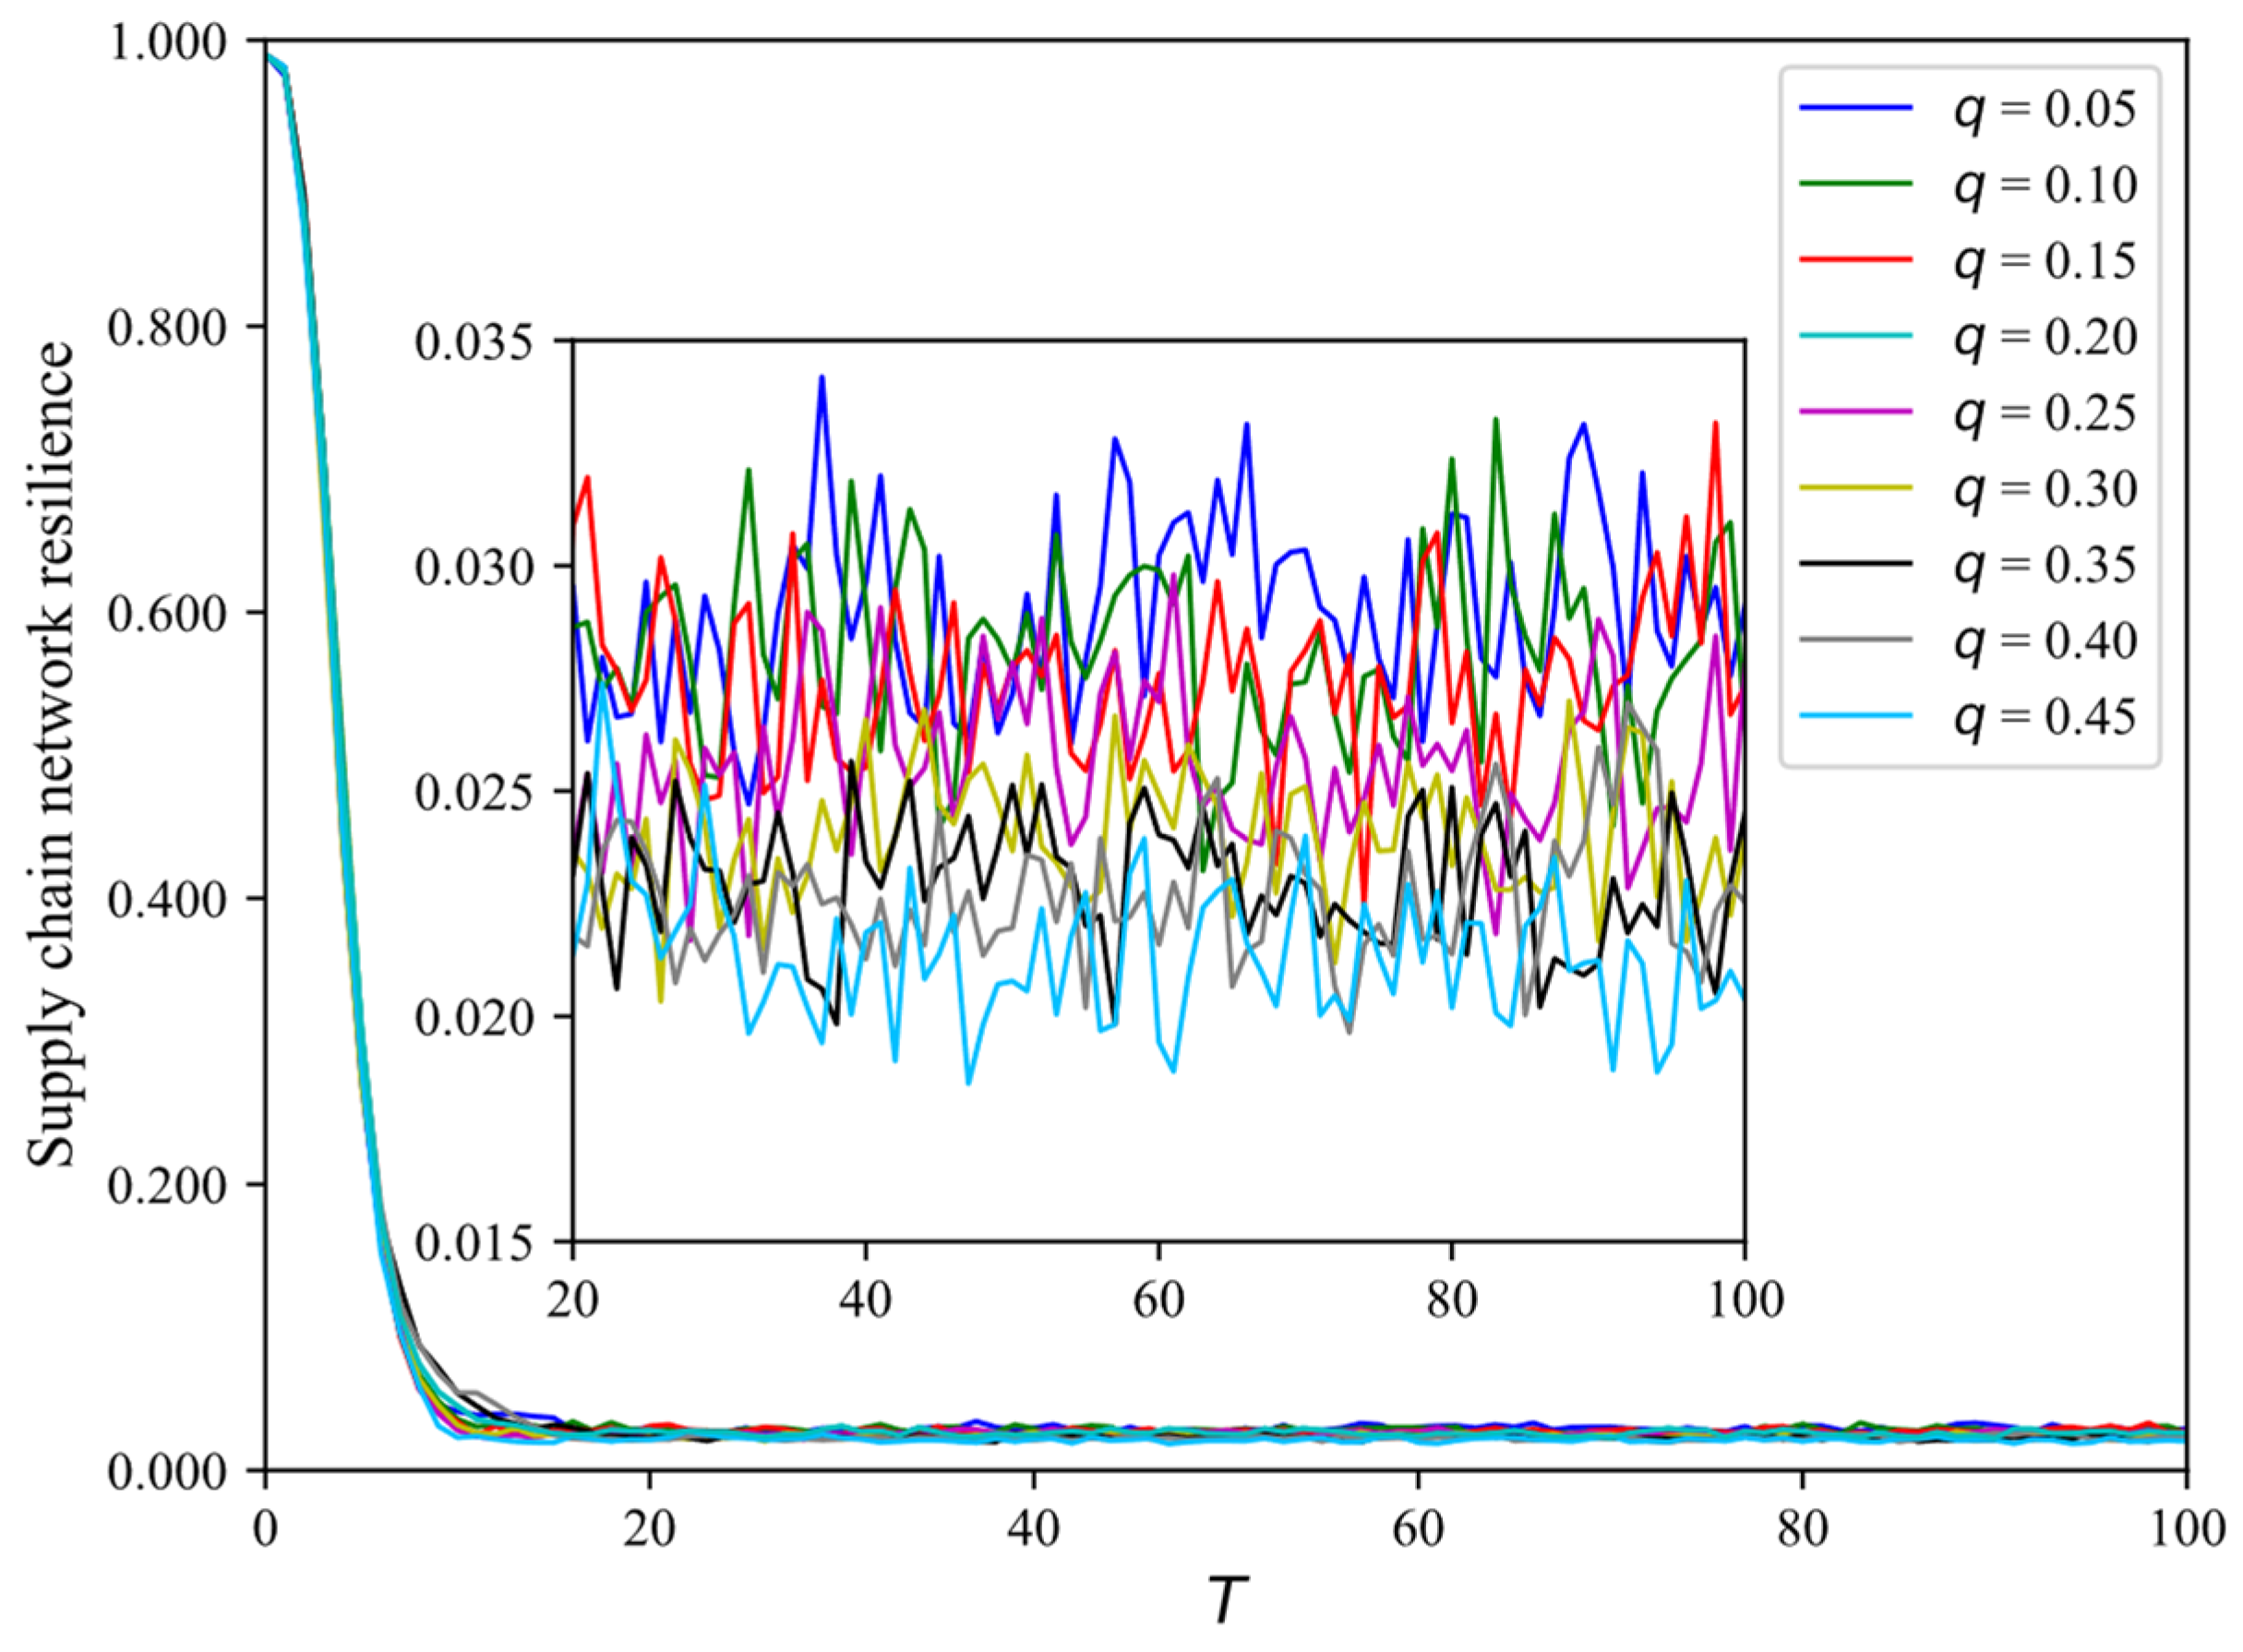
Figure 7.
The resilience of SCNs at each time step for different clustering coefficients when using the resilience metric s.
Figure 7.
The resilience of SCNs at each time step for different clustering coefficients when using the resilience metric s.

Figure 8.
The resilience of SCNs for different clustering coefficients when using the resilience metric Y.
Figure 8.
The resilience of SCNs for different clustering coefficients when using the resilience metric Y.
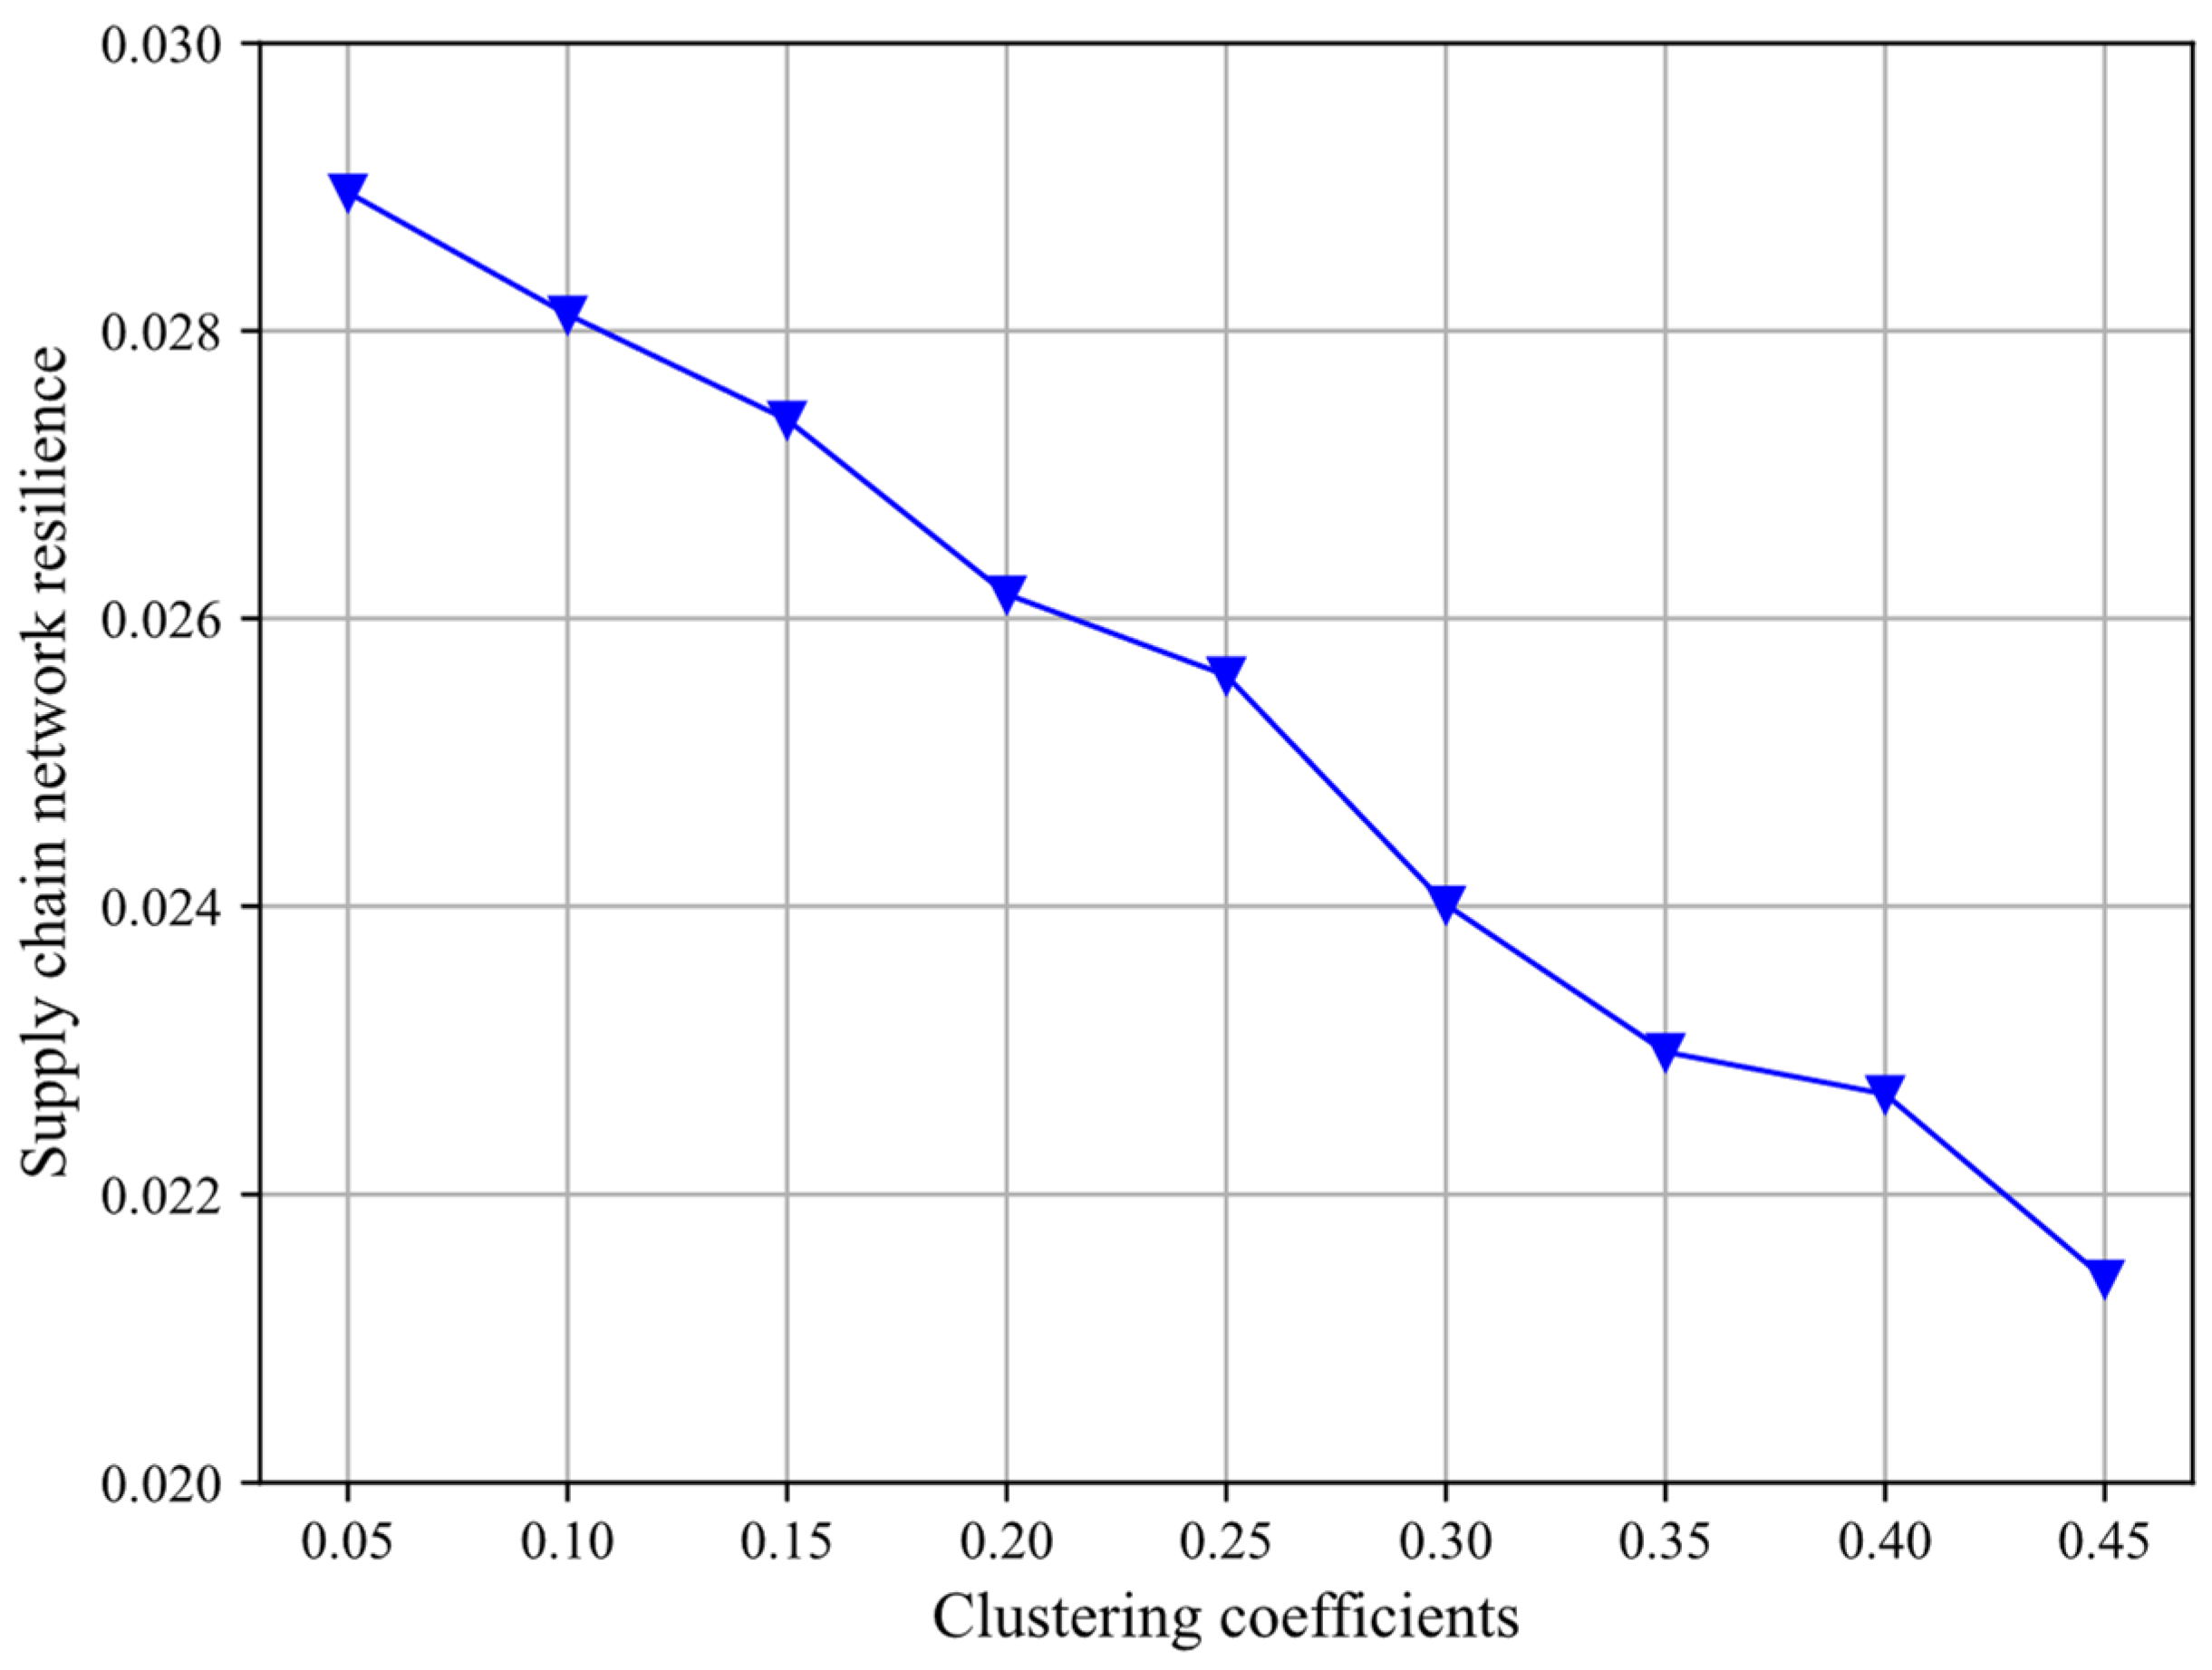
Figure 9.
The resilience of SCNs for different clustering coefficients when using the resilience metric S.
Figure 9.
The resilience of SCNs for different clustering coefficients when using the resilience metric S.
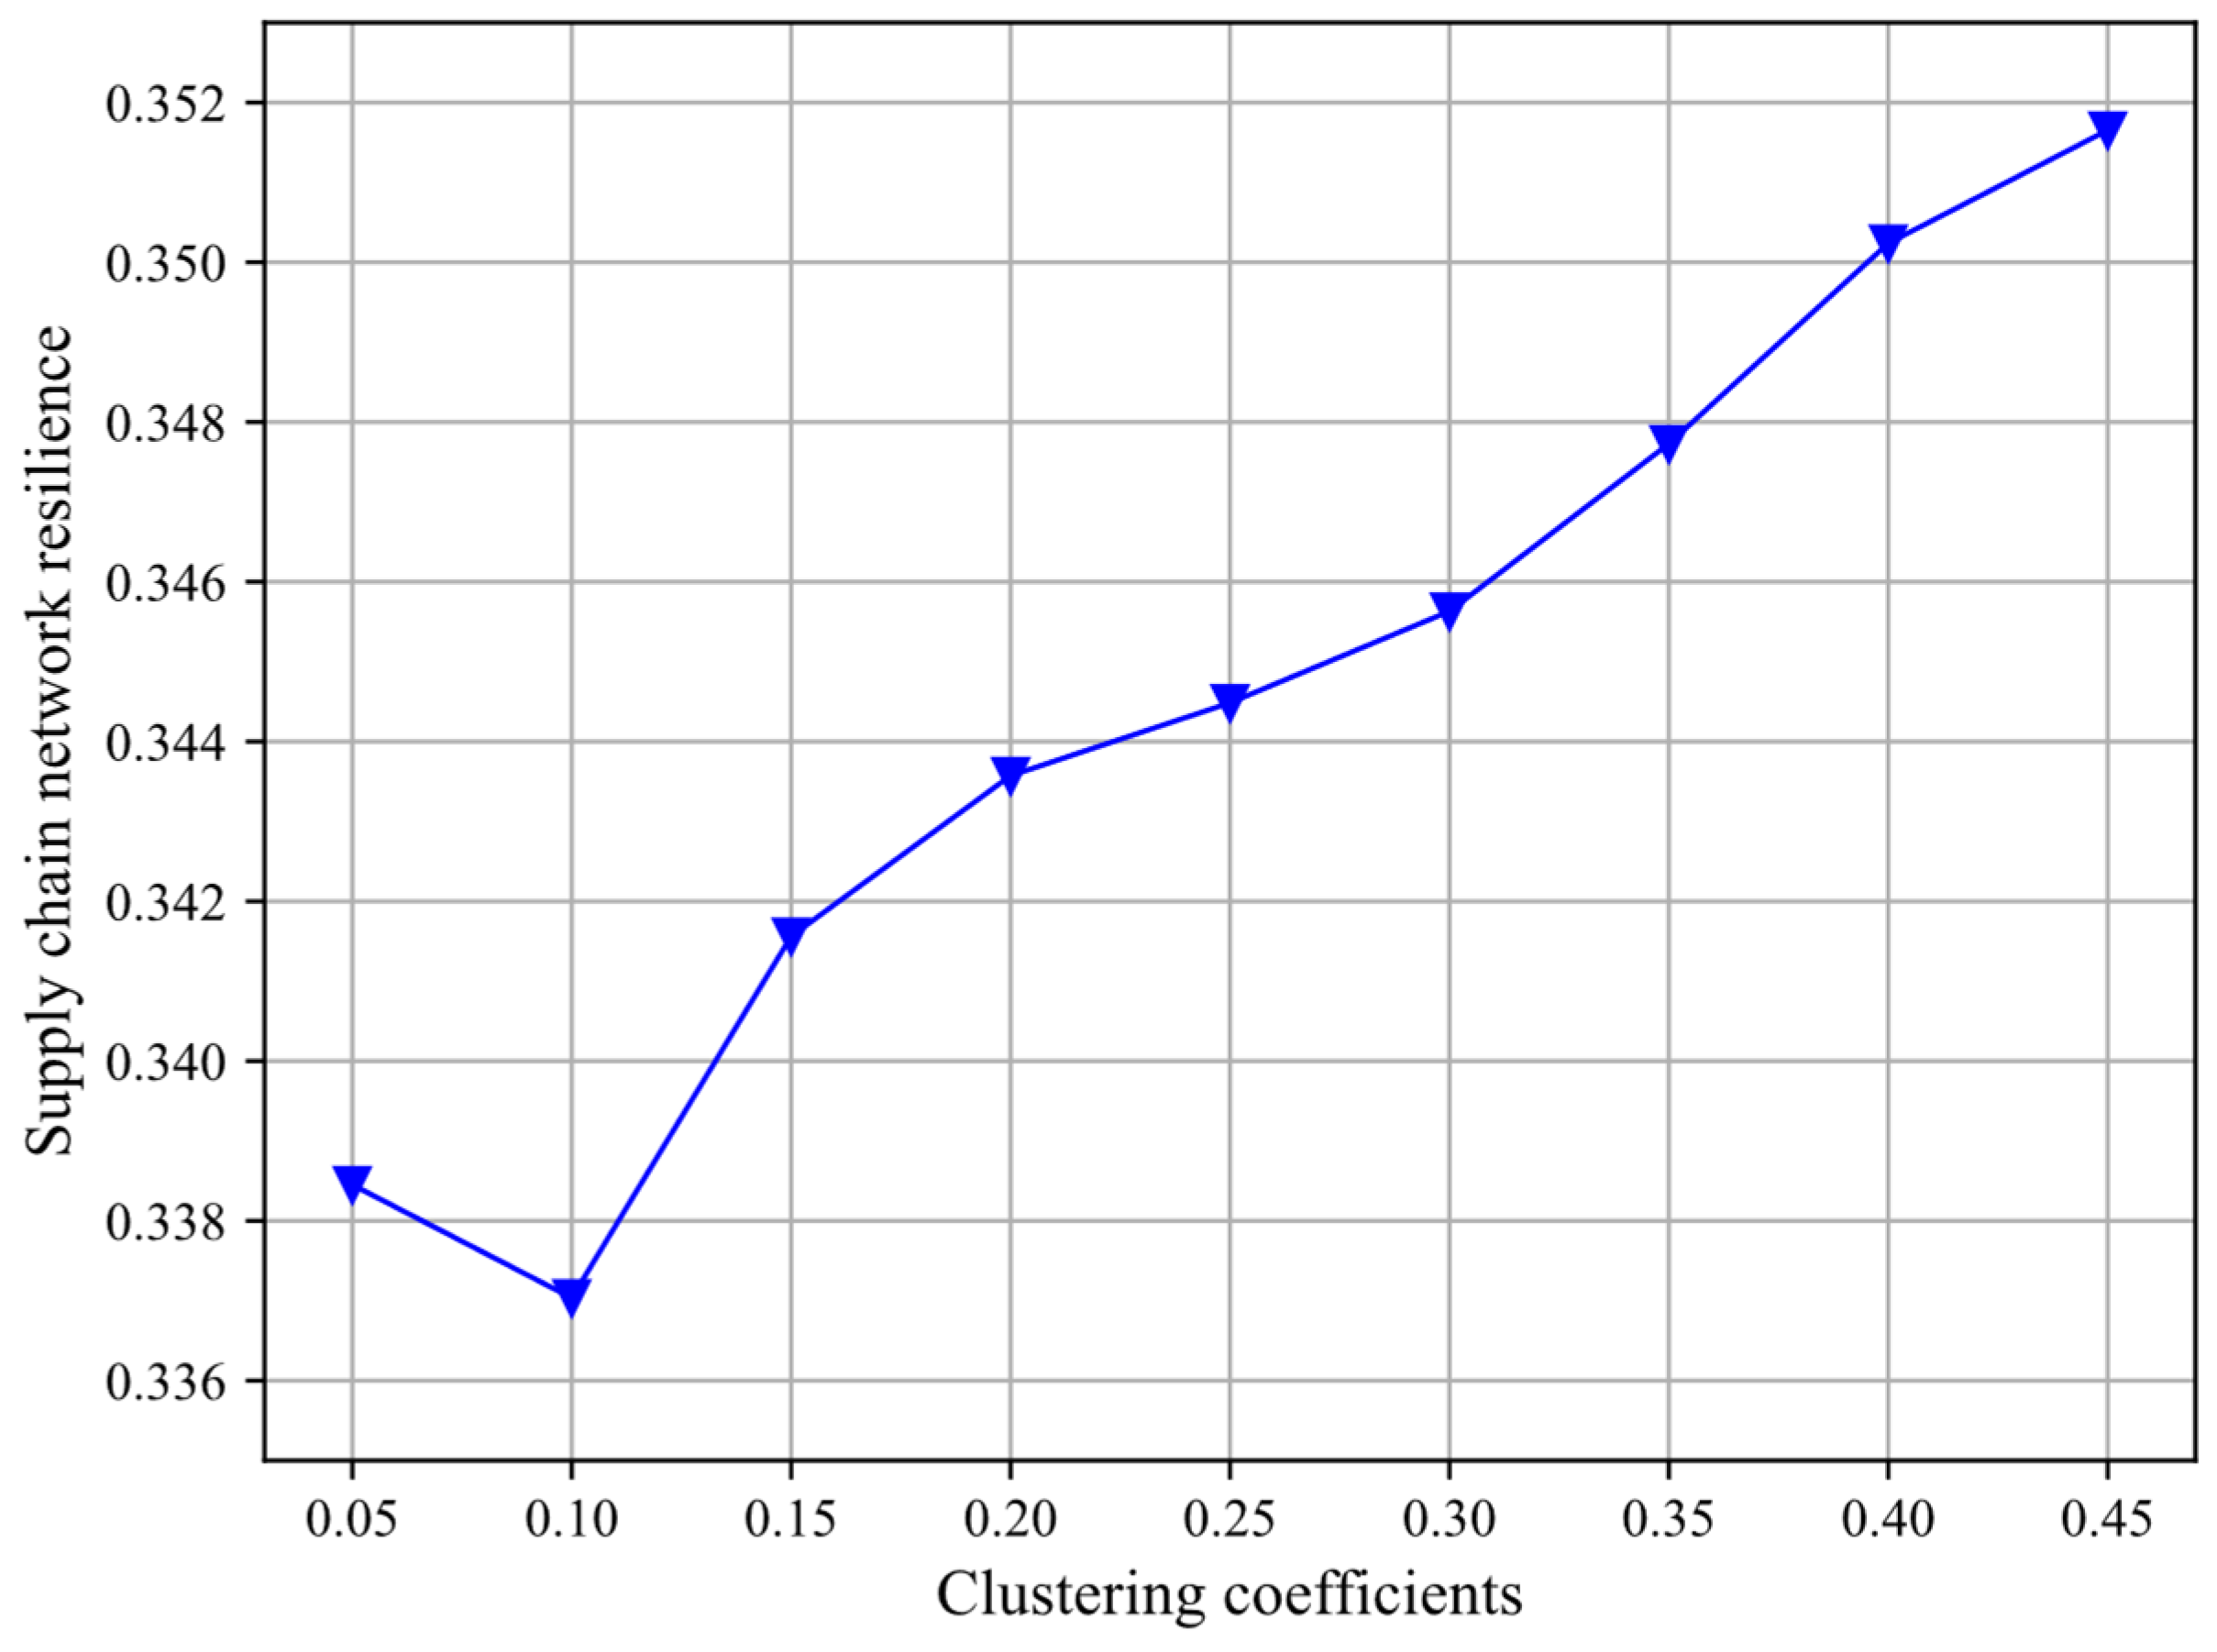
Figure 10.
The resilience of SCNs for different node-type ratios when using the resilience metric Y.
Figure 10.
The resilience of SCNs for different node-type ratios when using the resilience metric Y.
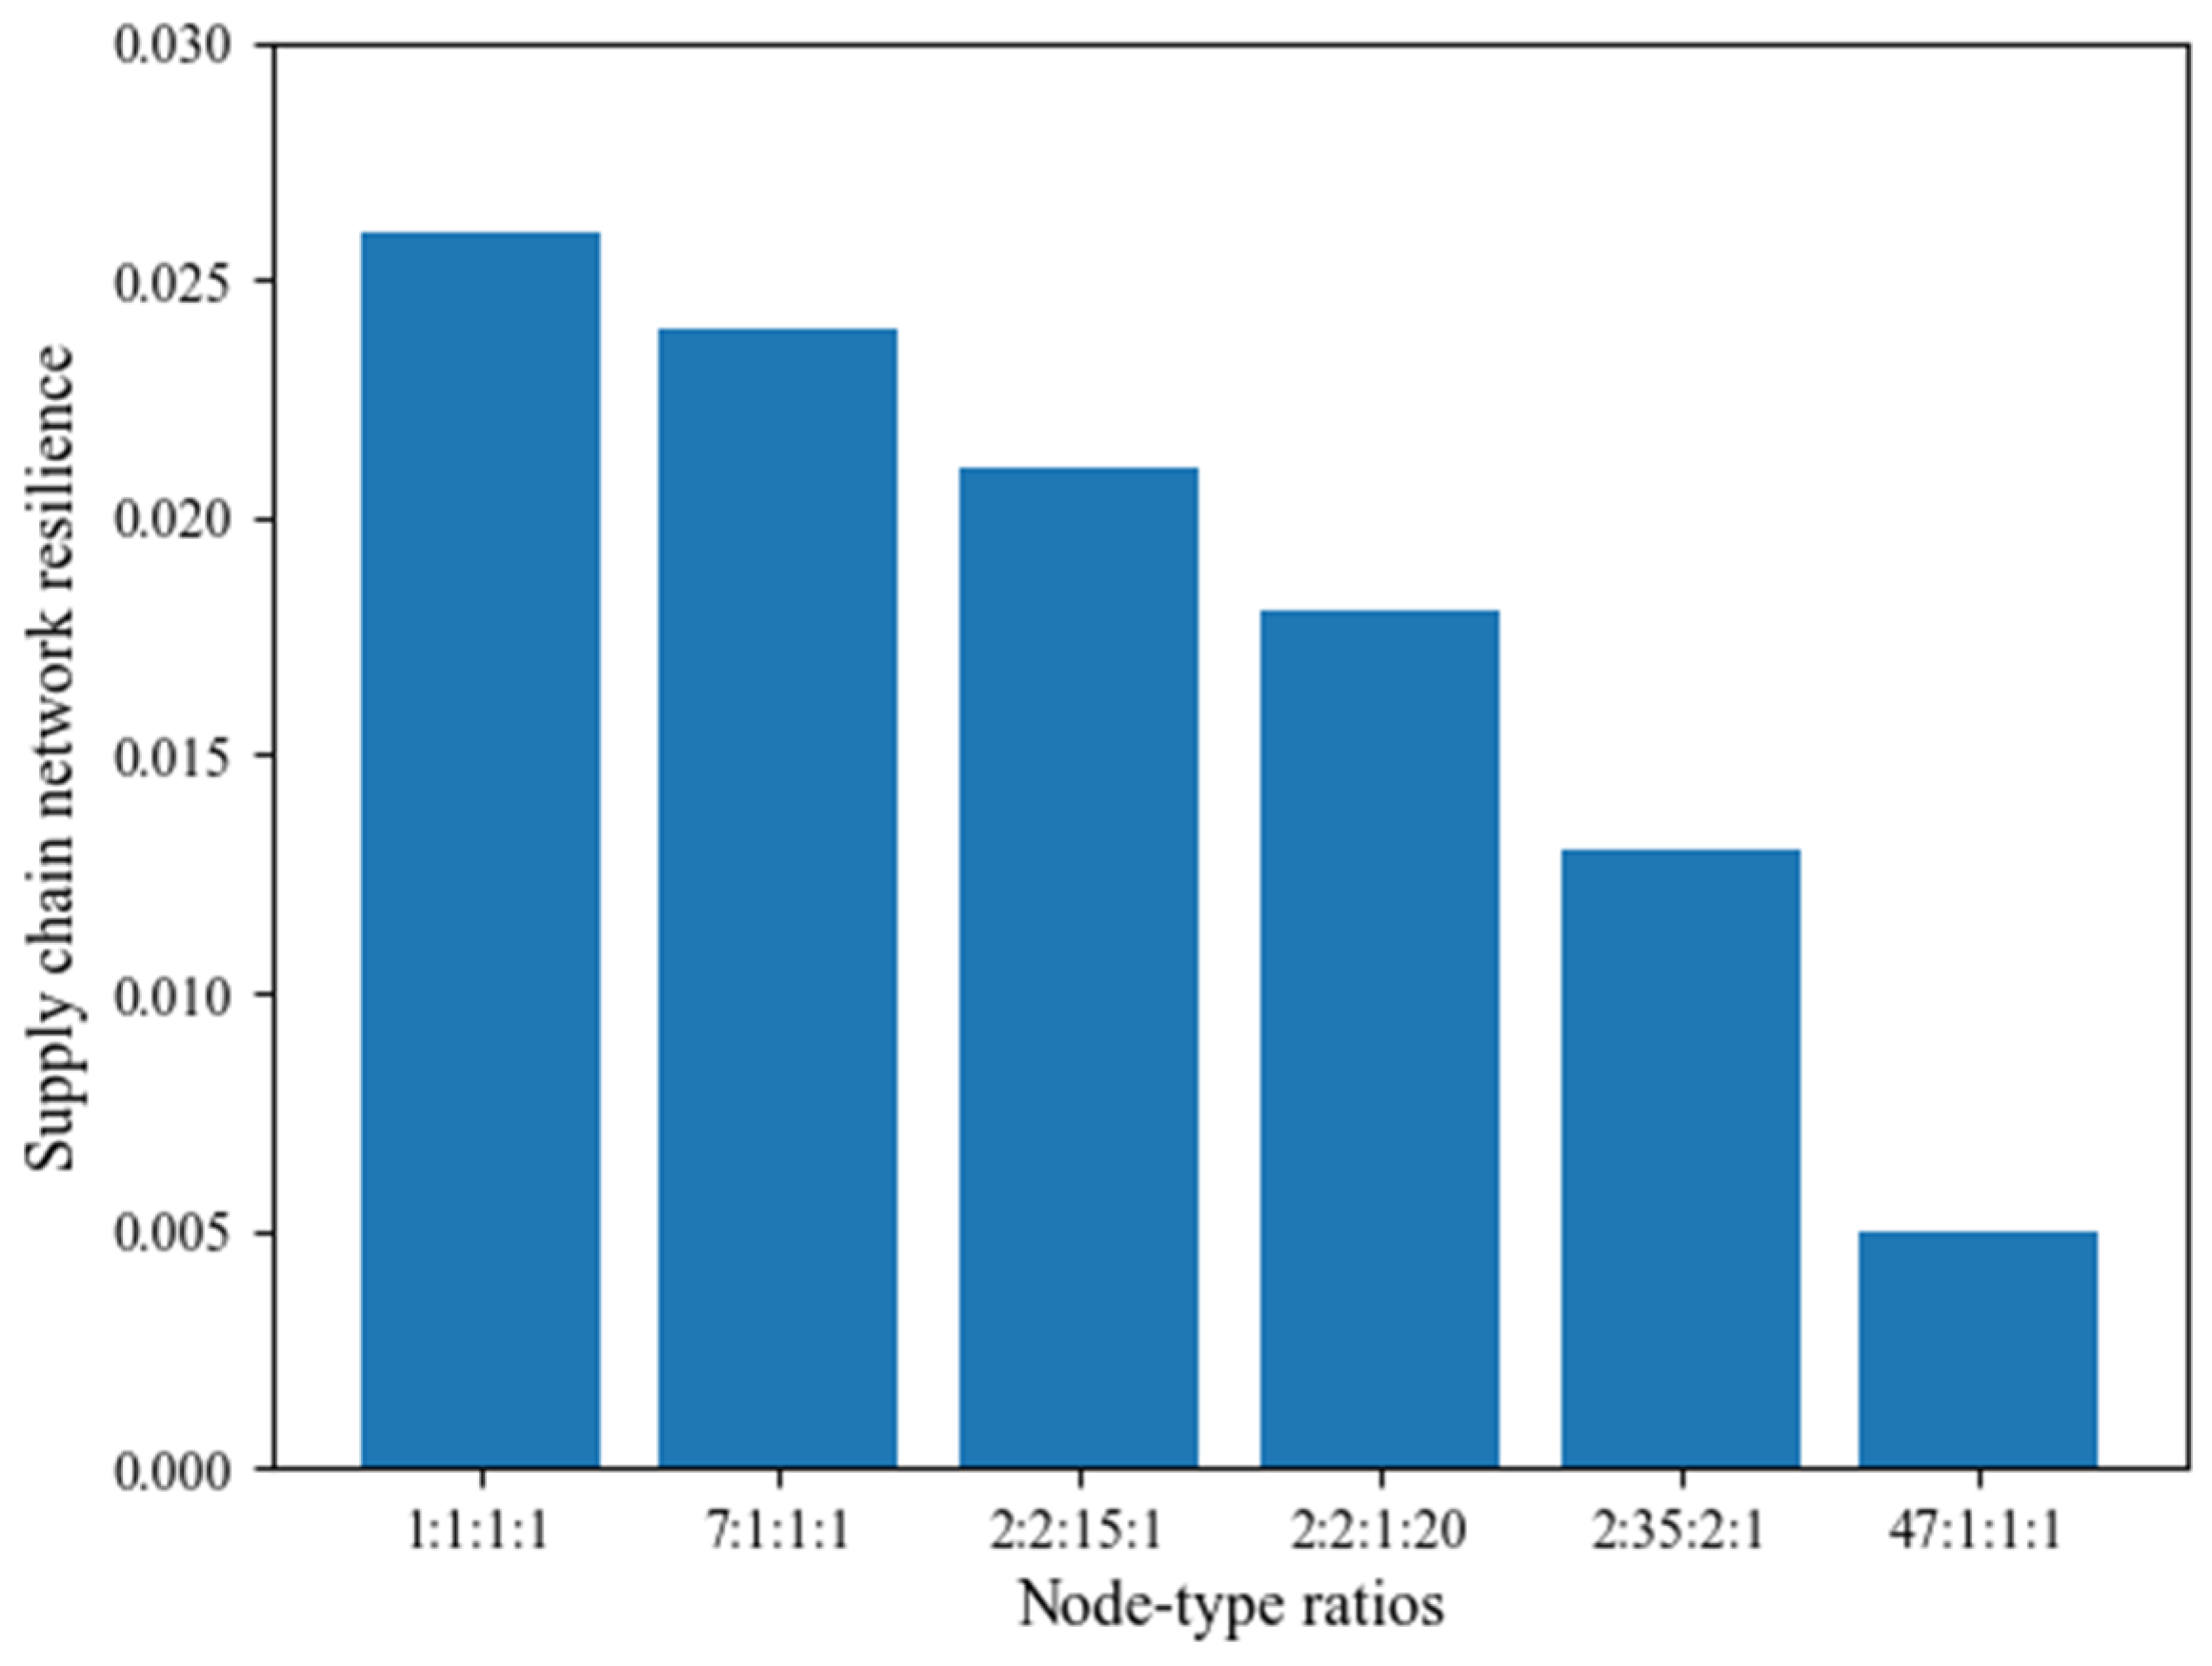
Figure 11.
The resilience of SCNs for different node-type ratios when using the resilience metric S.
Figure 11.
The resilience of SCNs for different node-type ratios when using the resilience metric S.
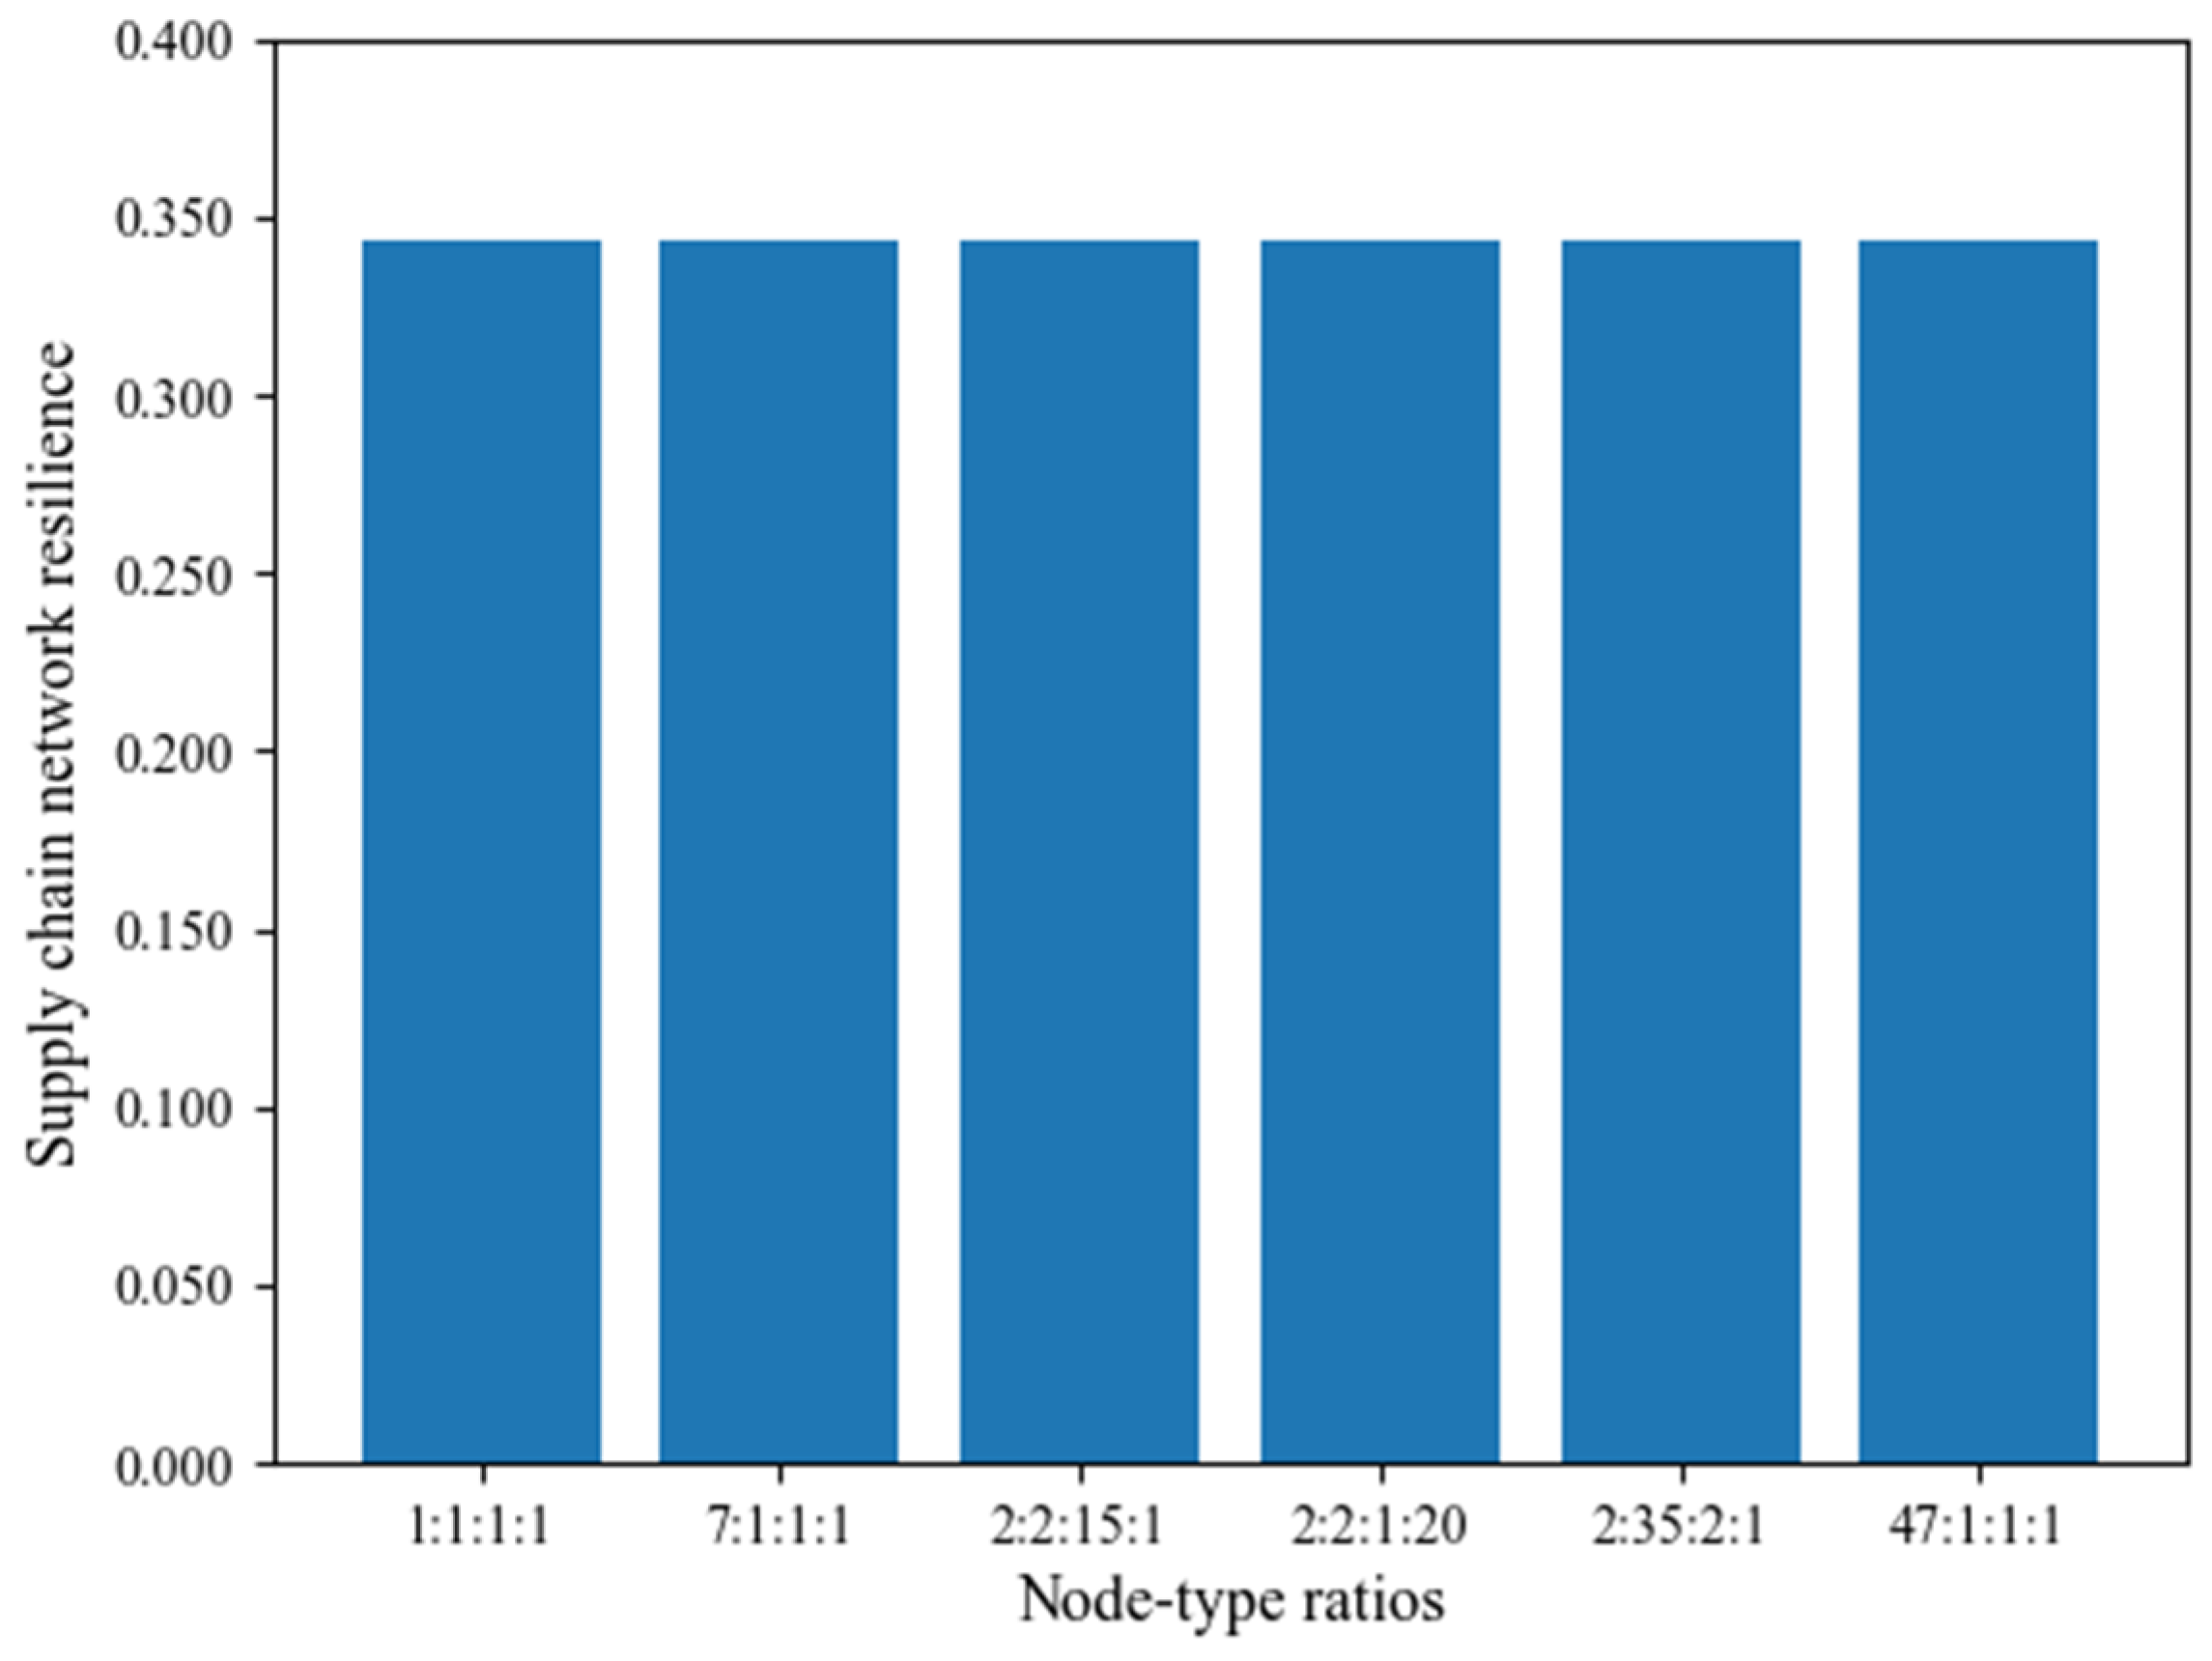
Figure 12.
The resilience of SCNs for different types of initial risk nodes when using the resilience metric Y.
Figure 12.
The resilience of SCNs for different types of initial risk nodes when using the resilience metric Y.

Figure 13.
The resilience of SCNs for different types of initial risk nodes when using the resilience metric S.
Figure 13.
The resilience of SCNs for different types of initial risk nodes when using the resilience metric S.
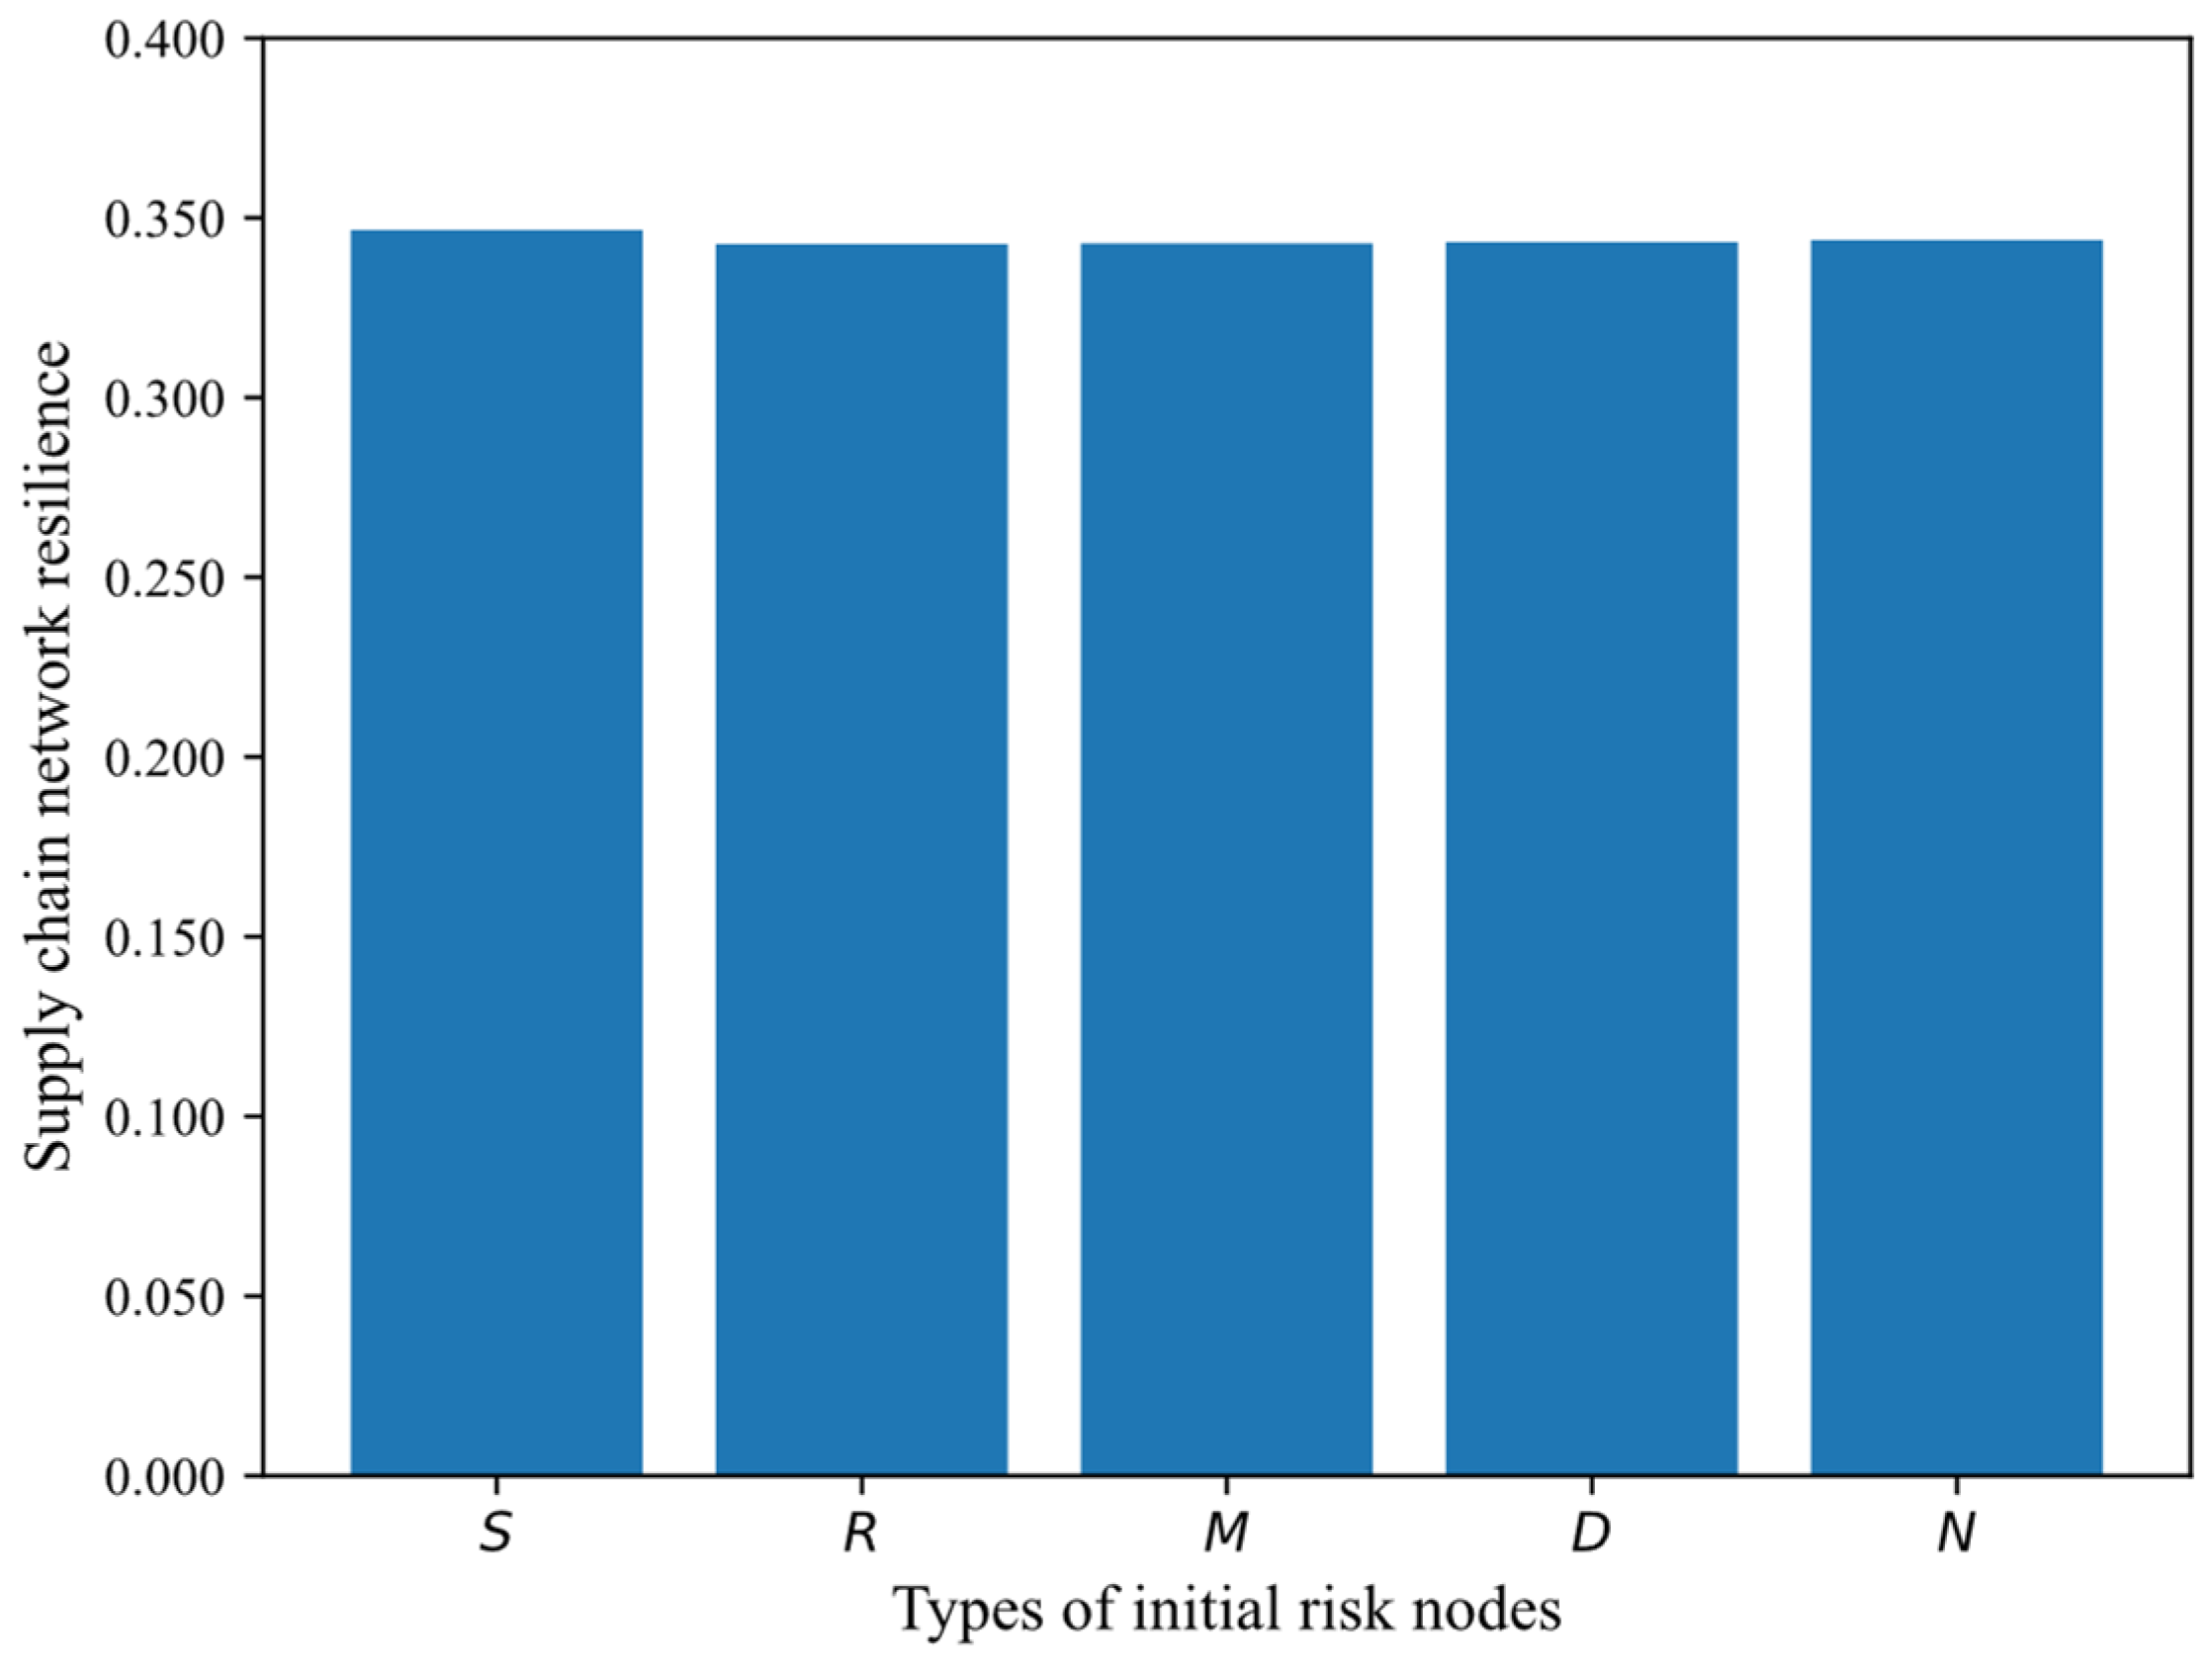
Figure 14.
Visualization of a real-life SCN.
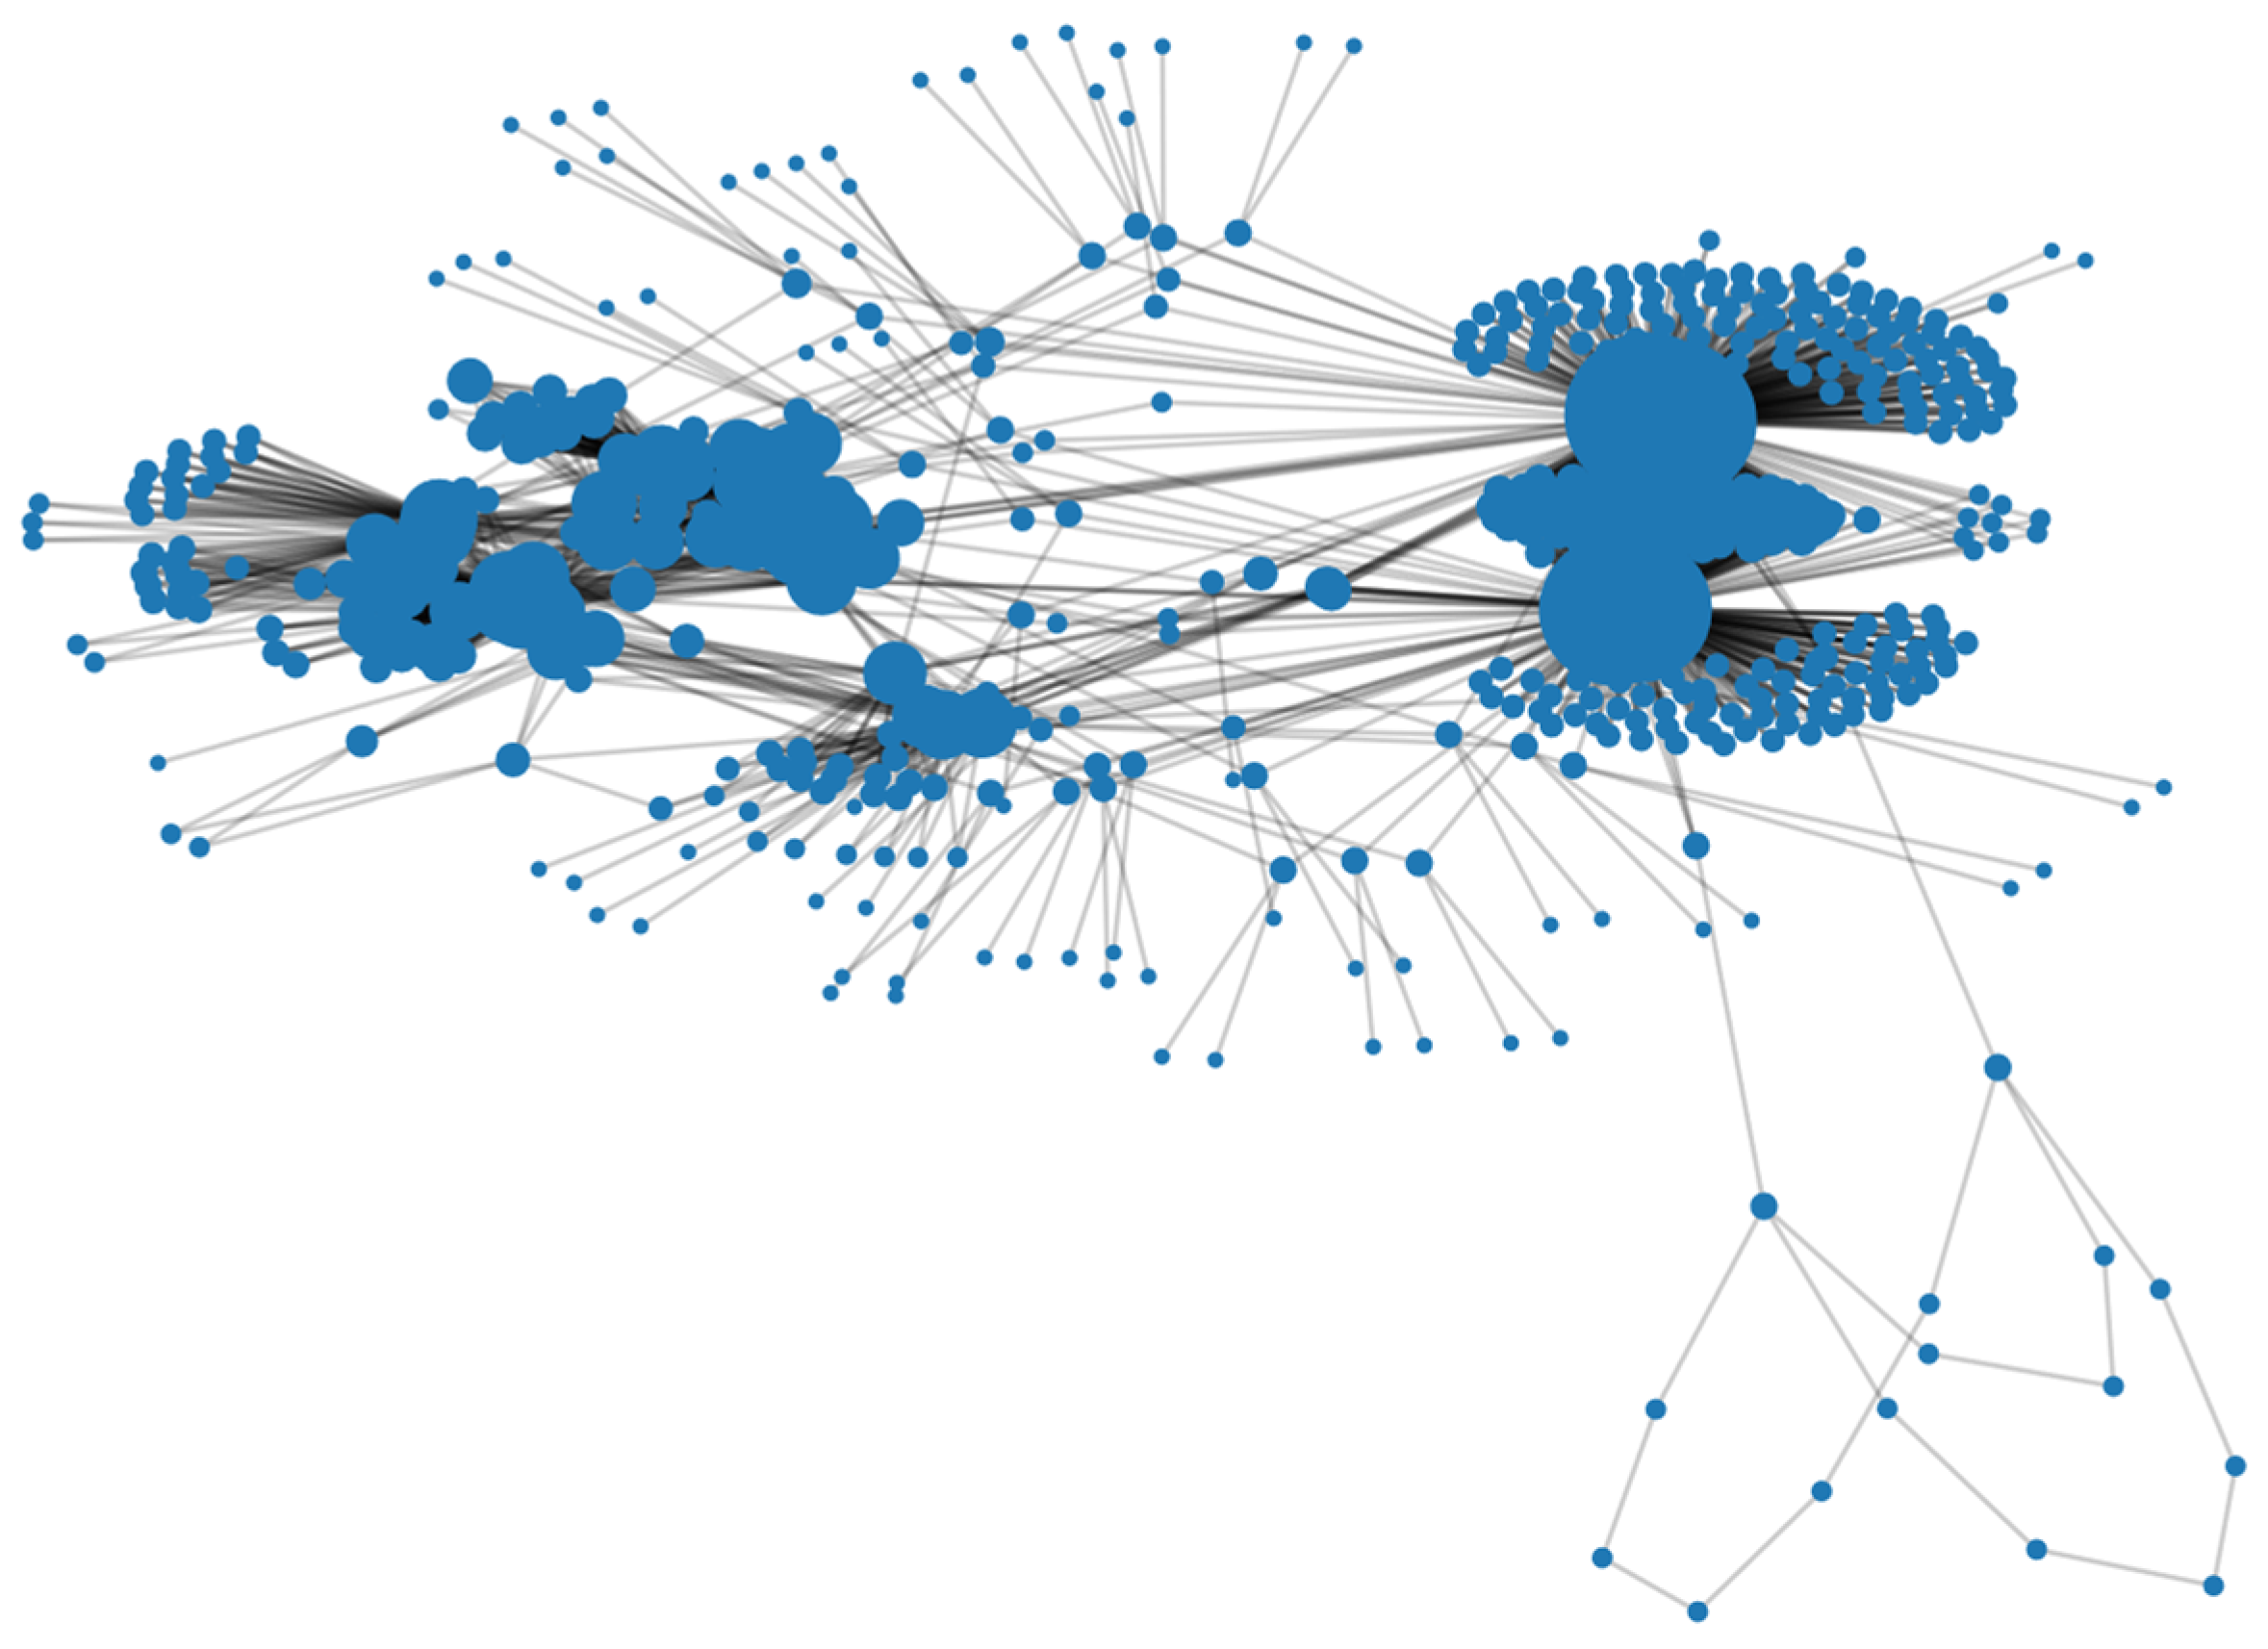
Figure 15.
A real-life SCN node degree ranking.

Figure 16.
The degree distribution of a real-life SCN.
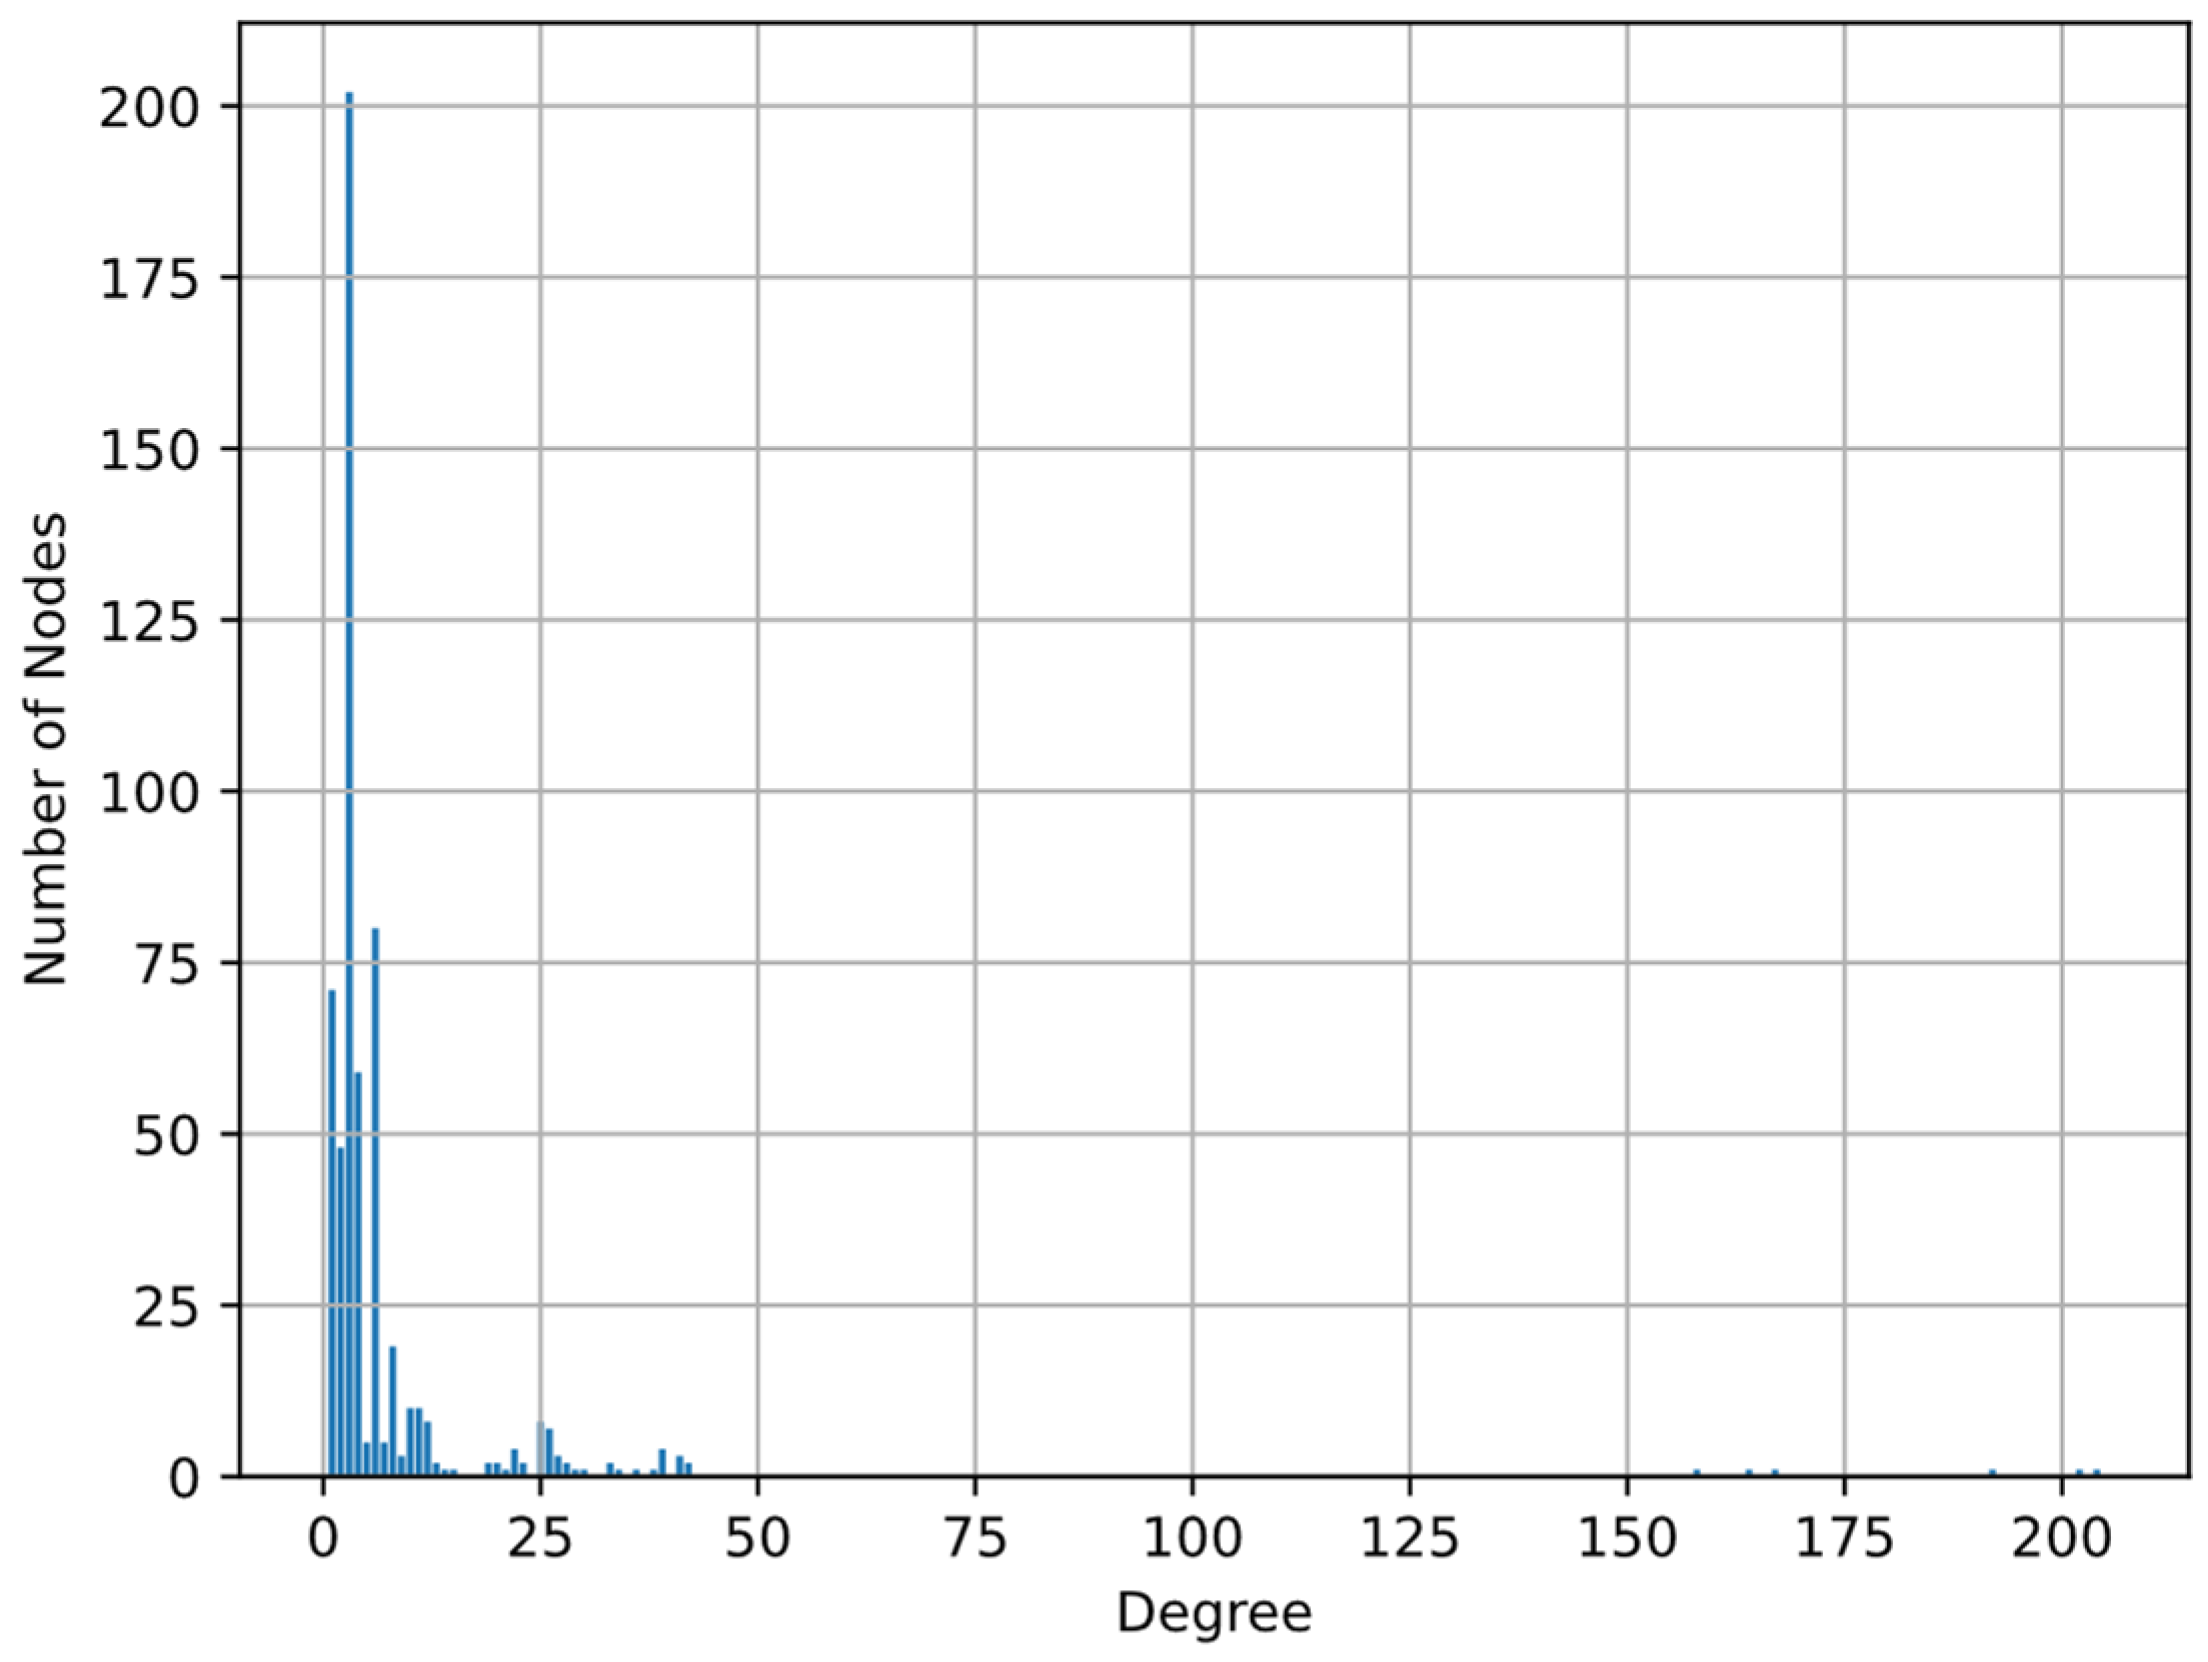
Figure 17.
The resilience of a real-life SCN at each time step when using the resilience metrics s and y.
Figure 17.
The resilience of a real-life SCN at each time step when using the resilience metrics s and y.
Disclaimer/Publisher’s Note: The statements, opinions and data contained in all publications are solely those of the individual author(s) and contributor(s) and not of MDPI and/or the editor(s). MDPI and/or the editor(s) disclaim responsibility for any injury to people or property resulting from any ideas, methods, instructions or products referred to in the content. |
© 2024 by the authors. Licensee MDPI, Basel, Switzerland. This article is an open access article distributed under the terms and conditions of the Creative Commons Attribution (CC BY) license (https://creativecommons.org/licenses/by/4.0/).
Share and Cite
MDPI and ACS Style
Xue, S.; Li, J.; Yu, J.; Li, M.; Shi, X. Research on Supply Chain Network Resilience: Considering Risk Propagation and Node Type. Appl. Sci. 2024, 14, 2675. https://doi.org/10.3390/app14072675
AMA Style
Xue S, Li J, Yu J, Li M, Shi X. Research on Supply Chain Network Resilience: Considering Risk Propagation and Node Type. Applied Sciences. 2024; 14(7):2675. https://doi.org/10.3390/app14072675
Chicago/Turabian StyleXue, Shuaihao, Jia Li, Jiaxin Yu, Minghui Li, and Xiaoqiu Shi. 2024. "Research on Supply Chain Network Resilience: Considering Risk Propagation and Node Type" Applied Sciences 14, no. 7: 2675. https://doi.org/10.3390/app14072675
Note that from the first issue of 2016, this journal uses article numbers instead of page numbers. See further details here.