A Methodological Approach for Interpreting and Comparing the Viscoelastic Behaviors of Soft Biological Tissues and Hydrogels at the Cell-Length Scale

 , , , , , , and
Abstract
:1. Introduction
2. Materials and Methods
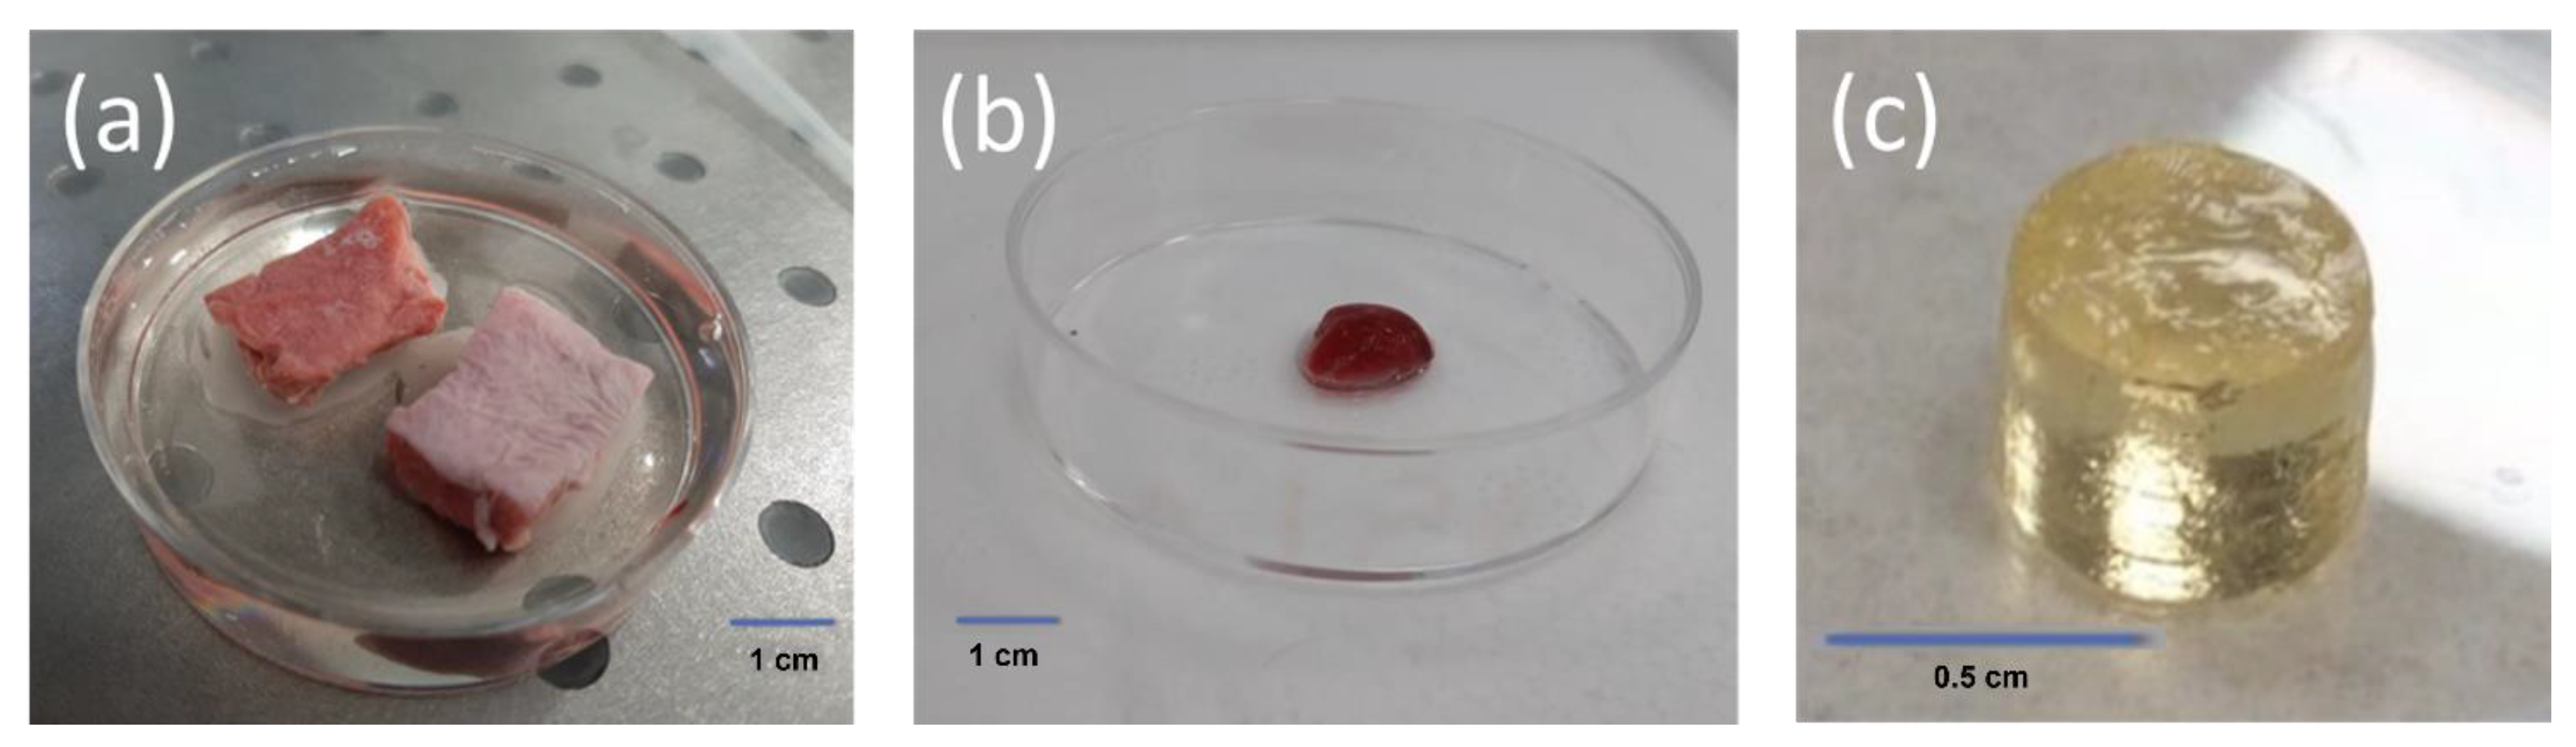
2.1. Sample Preparation
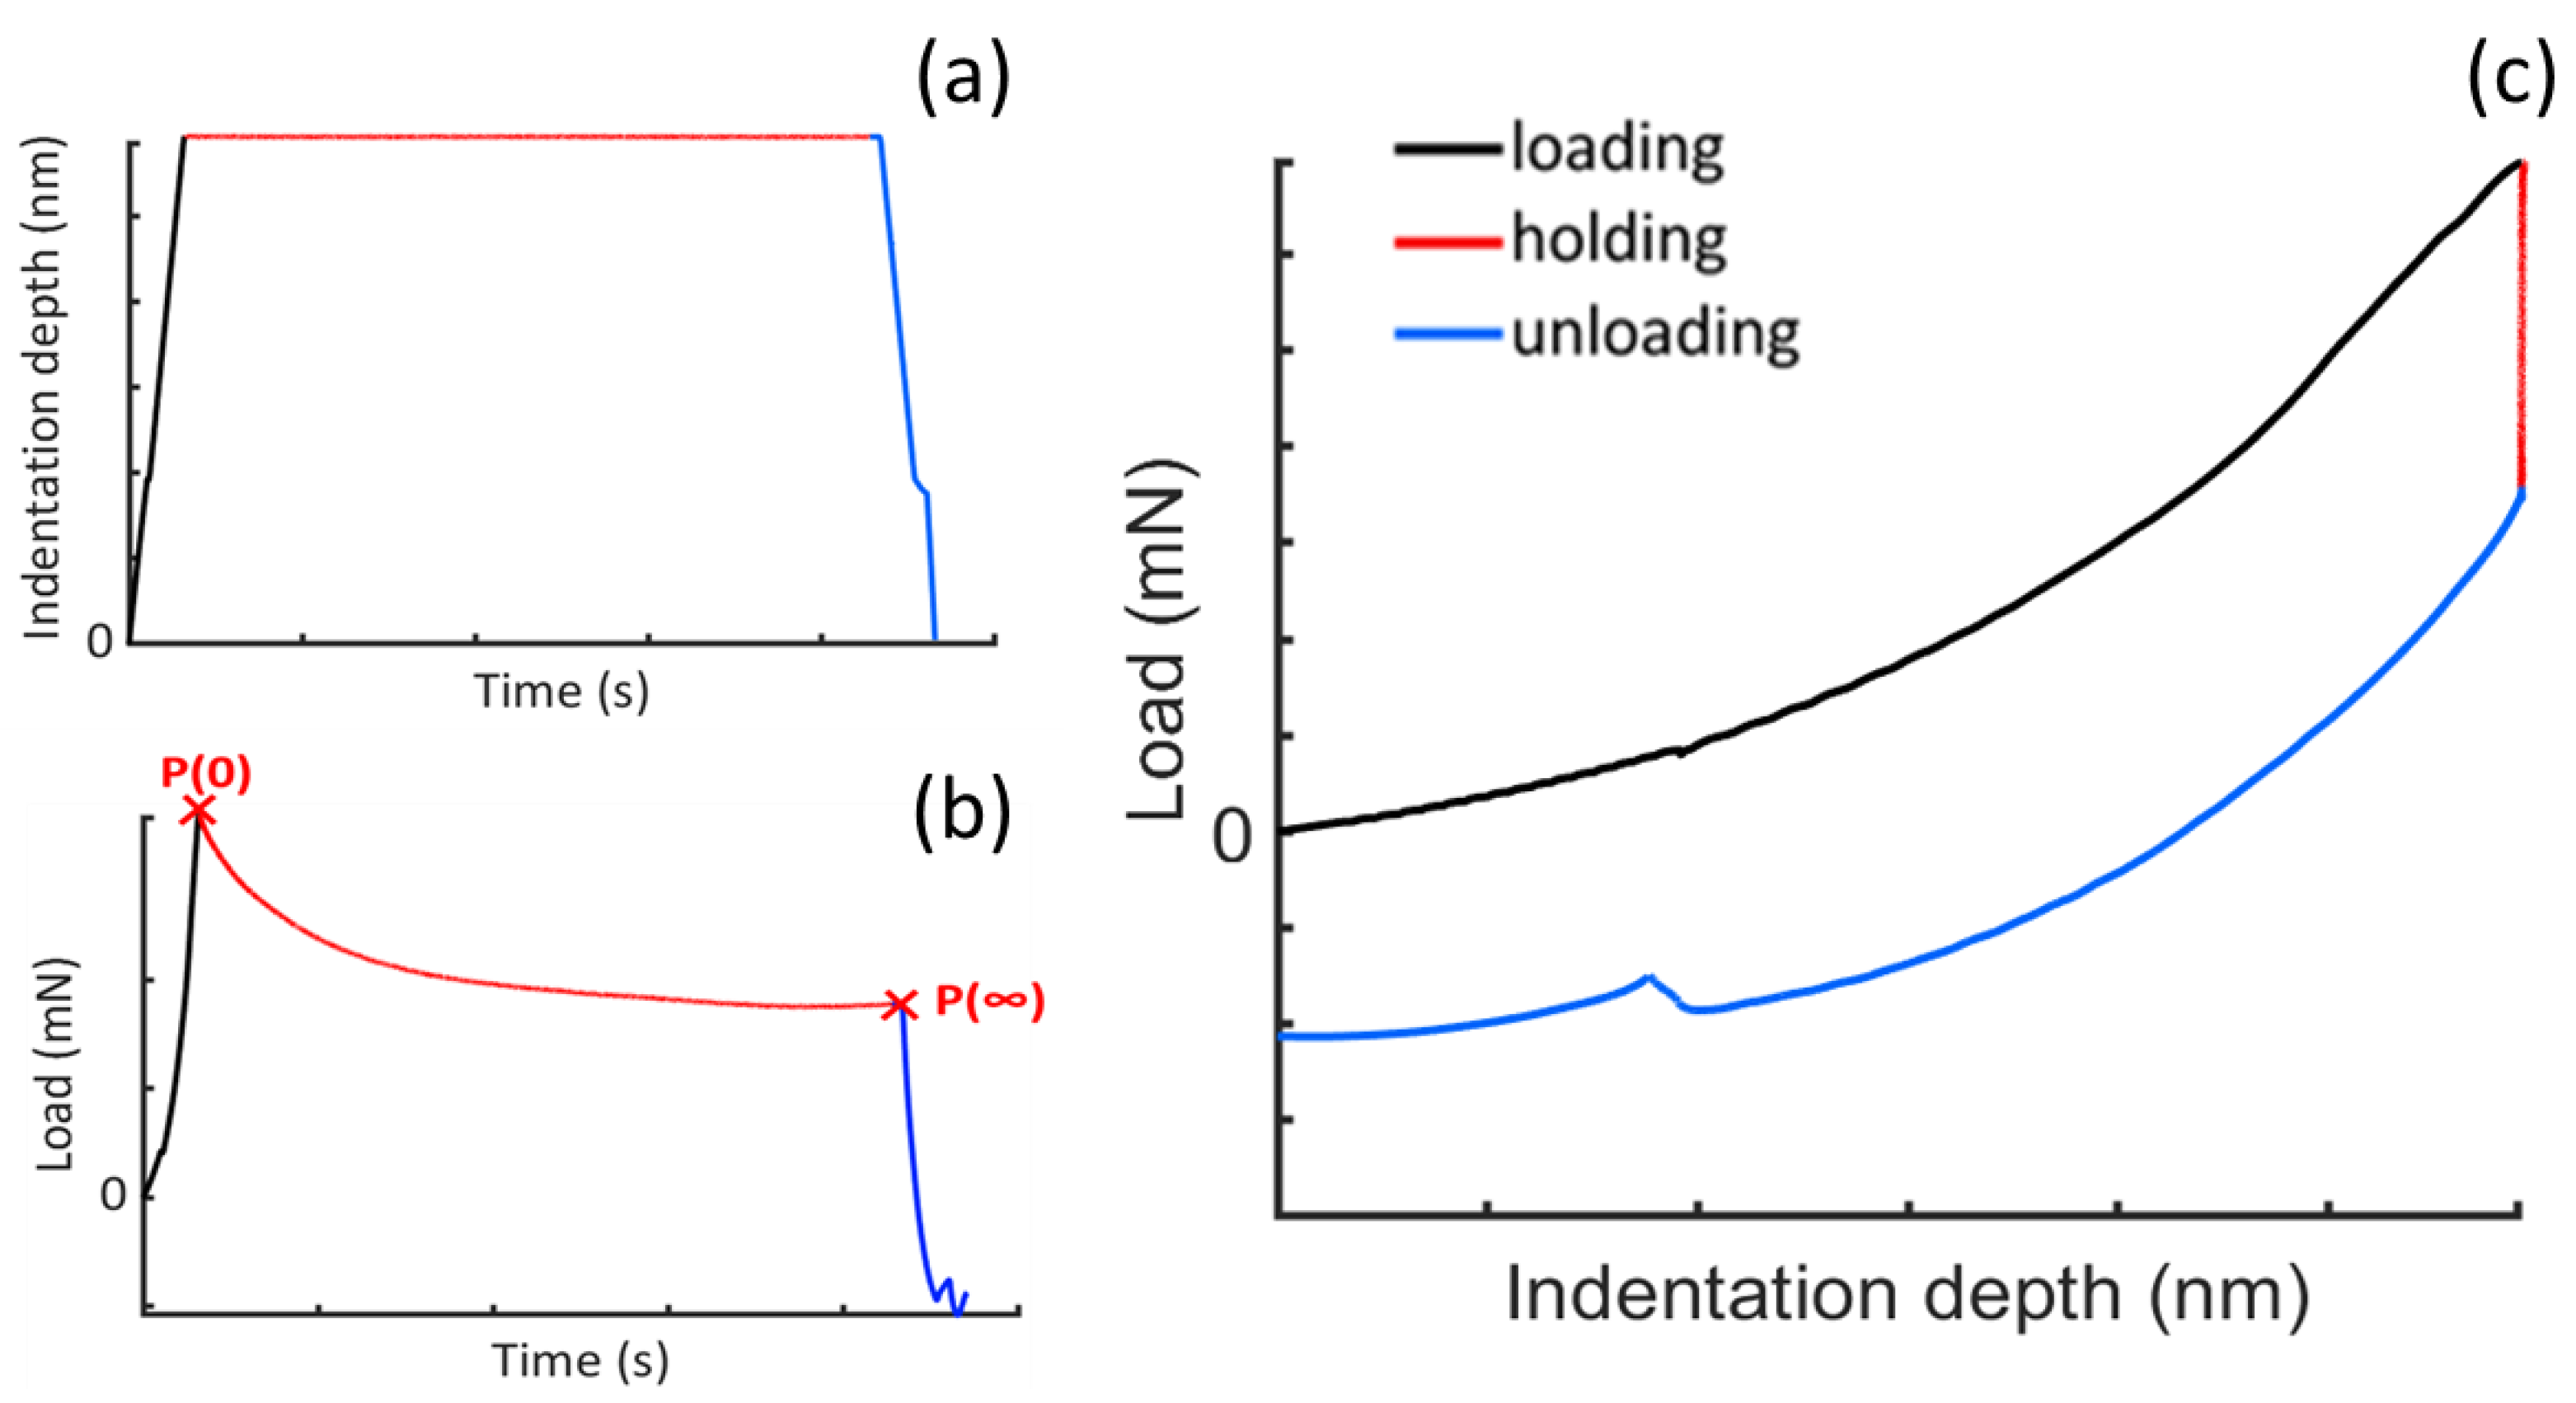
2.2. Experimental Procedure
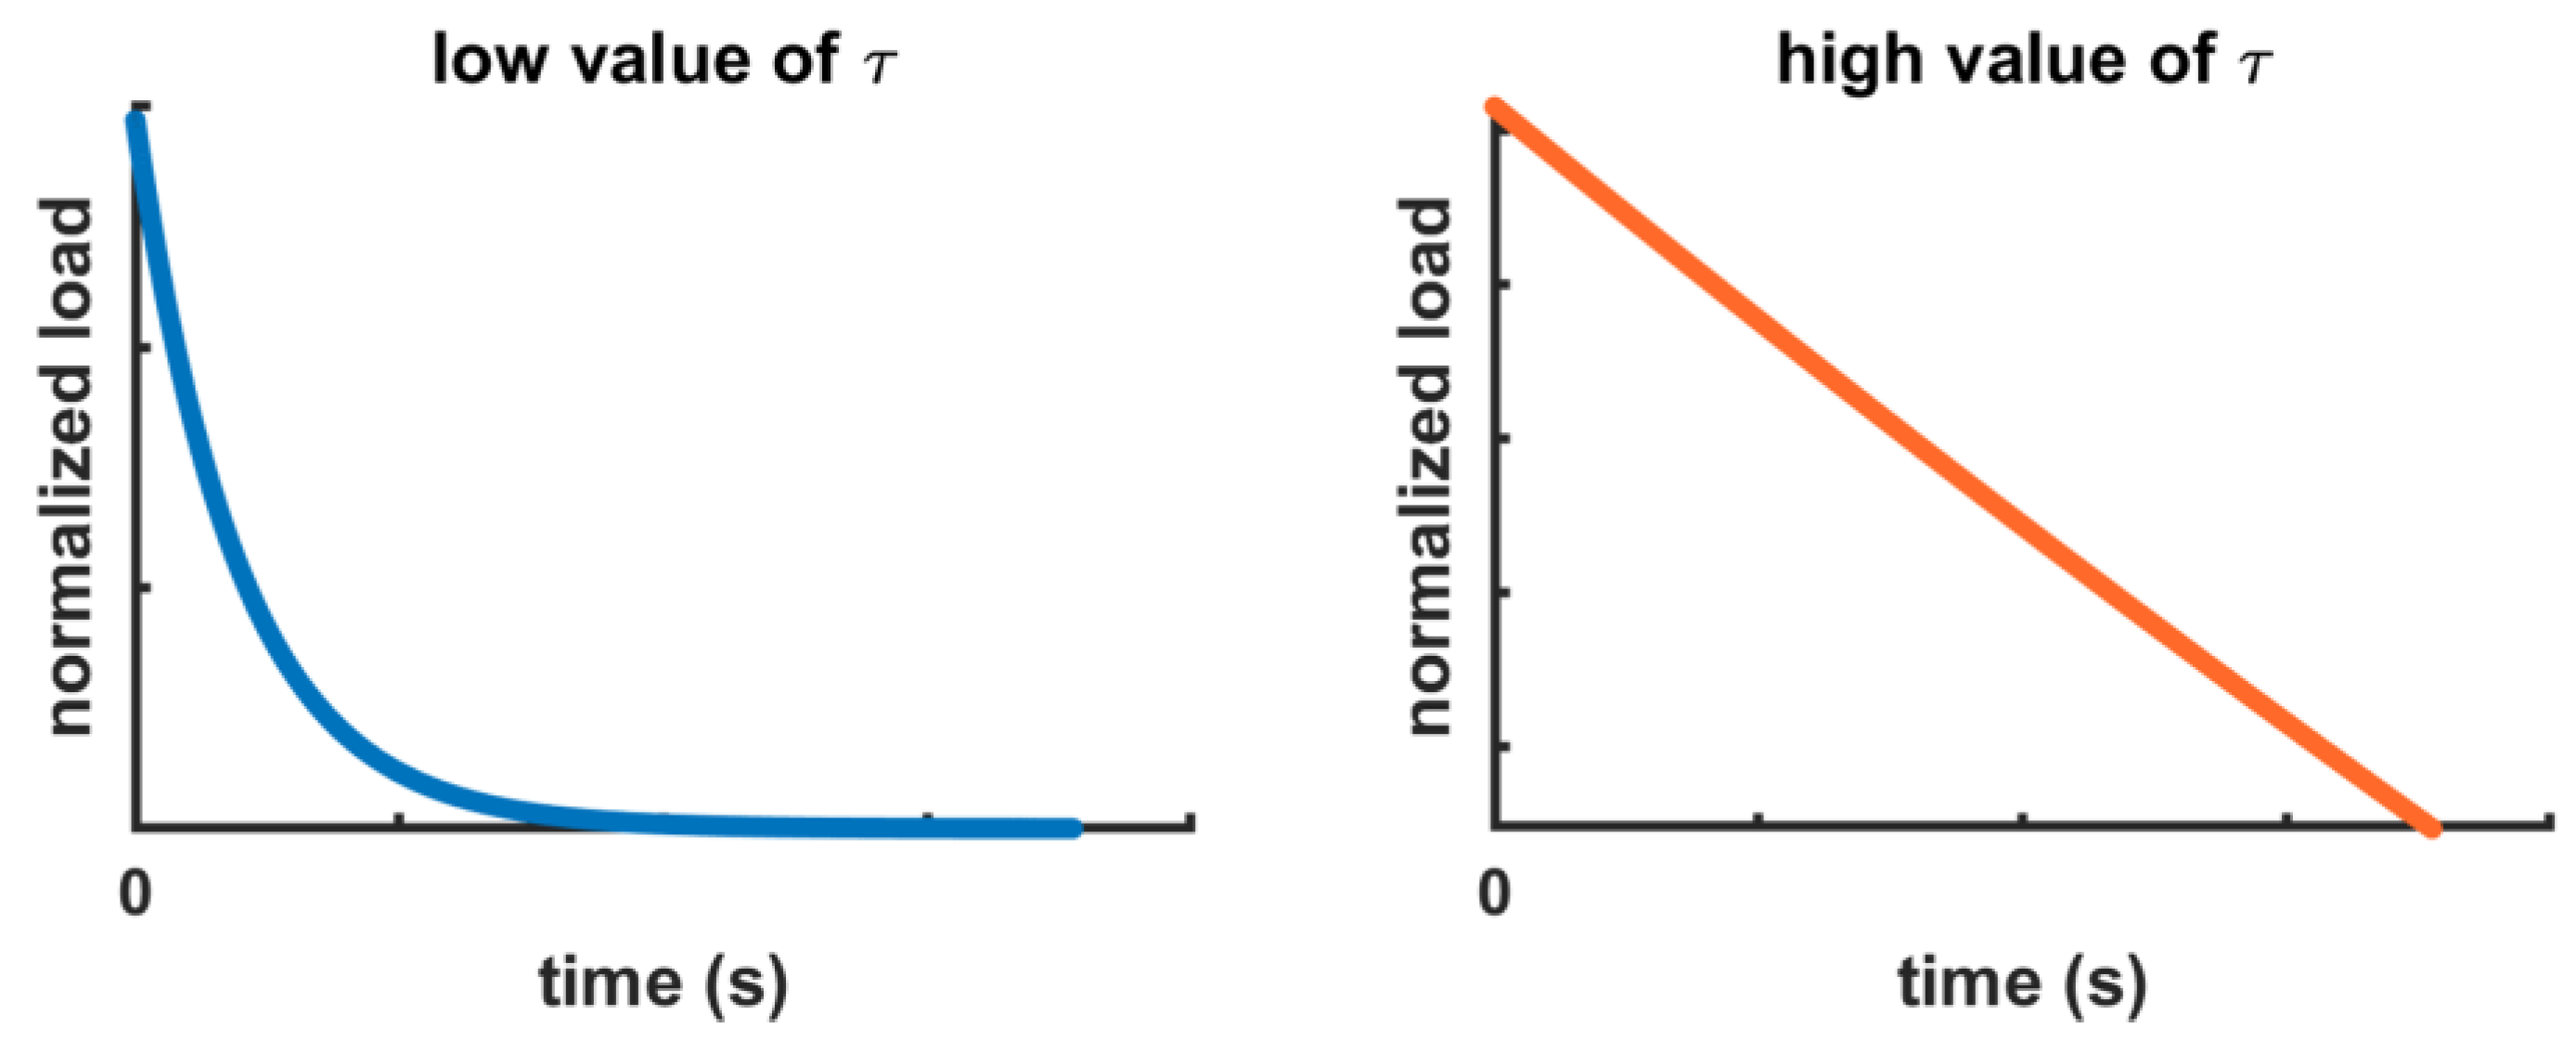
2.3. Theoretical Remarks
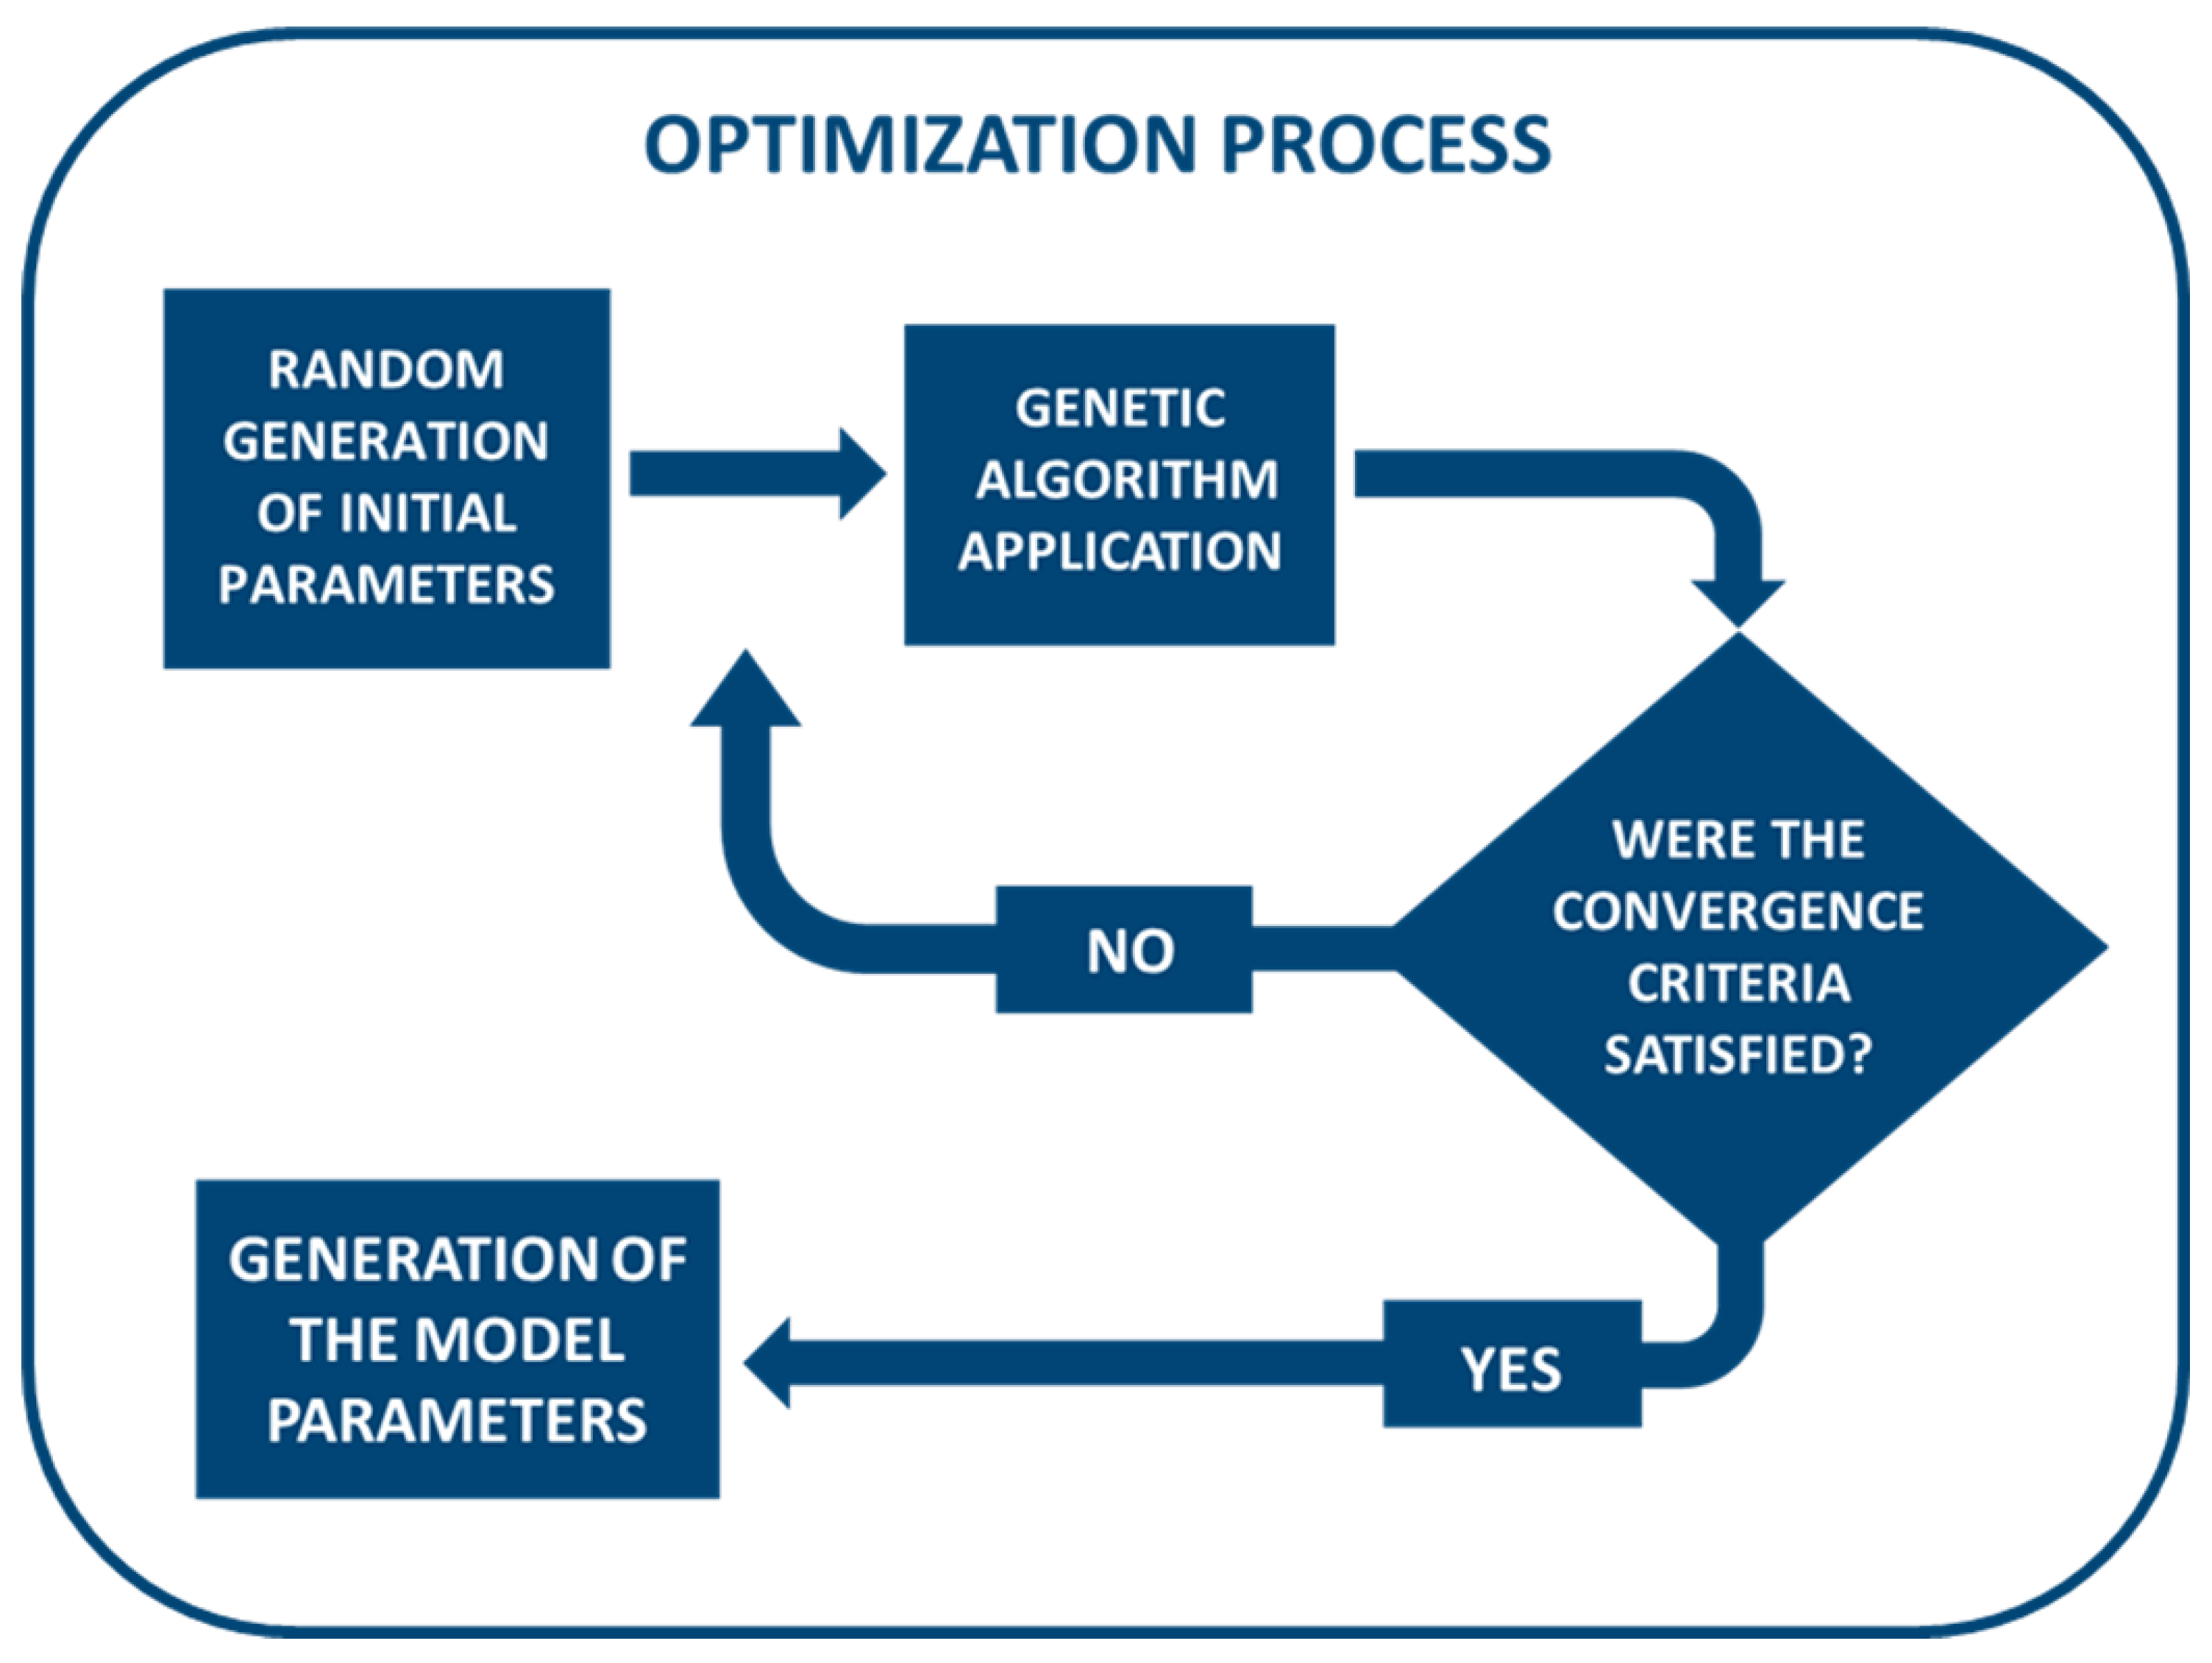
2.4. Fitting Procedure
2.5. Statistics
3. Results
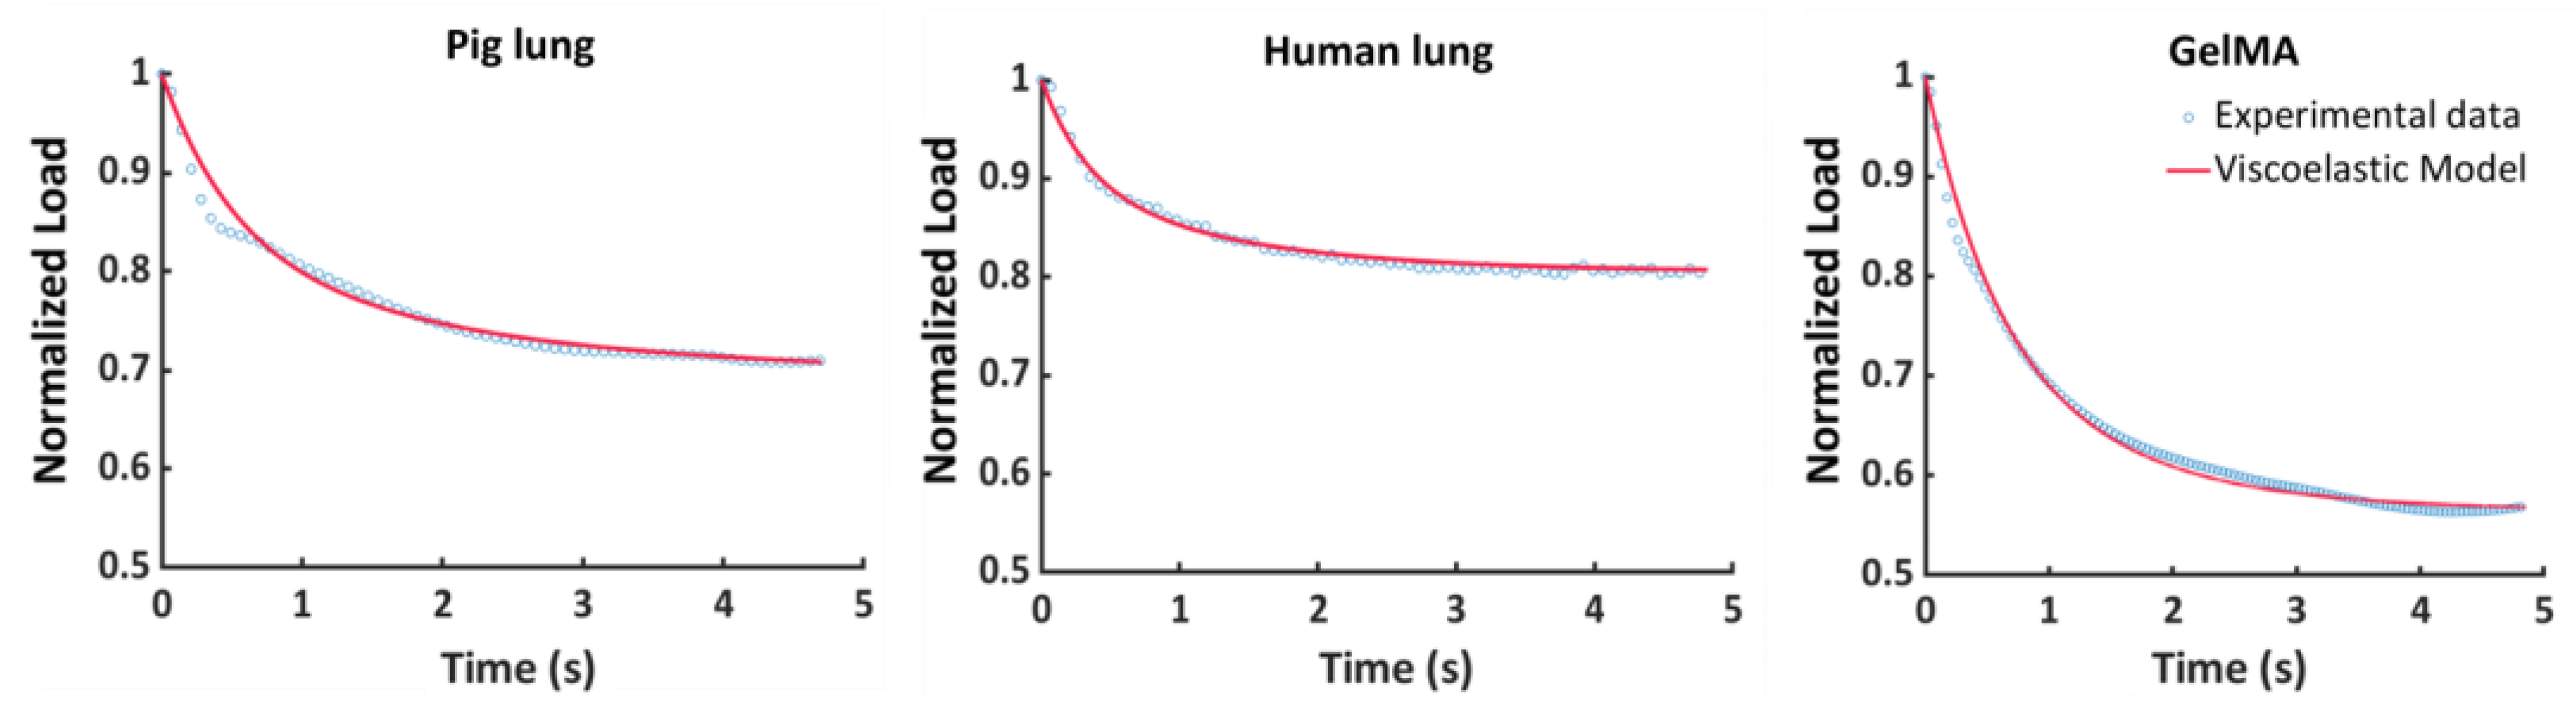
3.1. Fitting Procedure
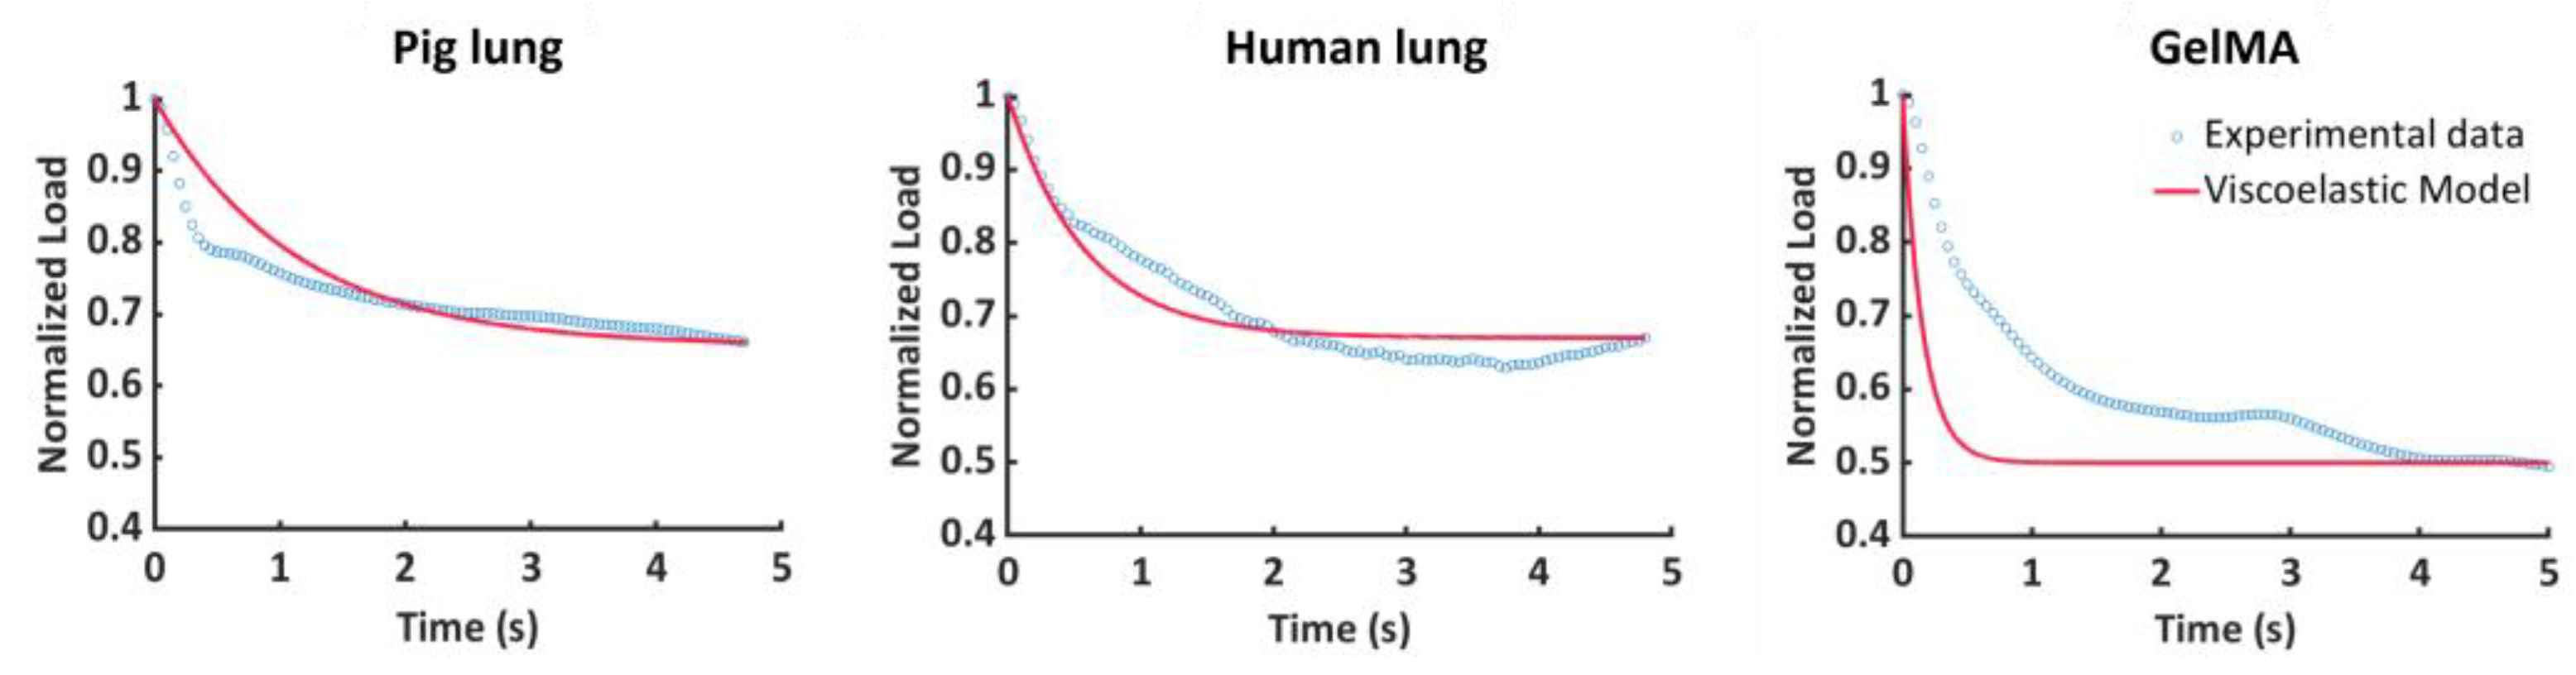
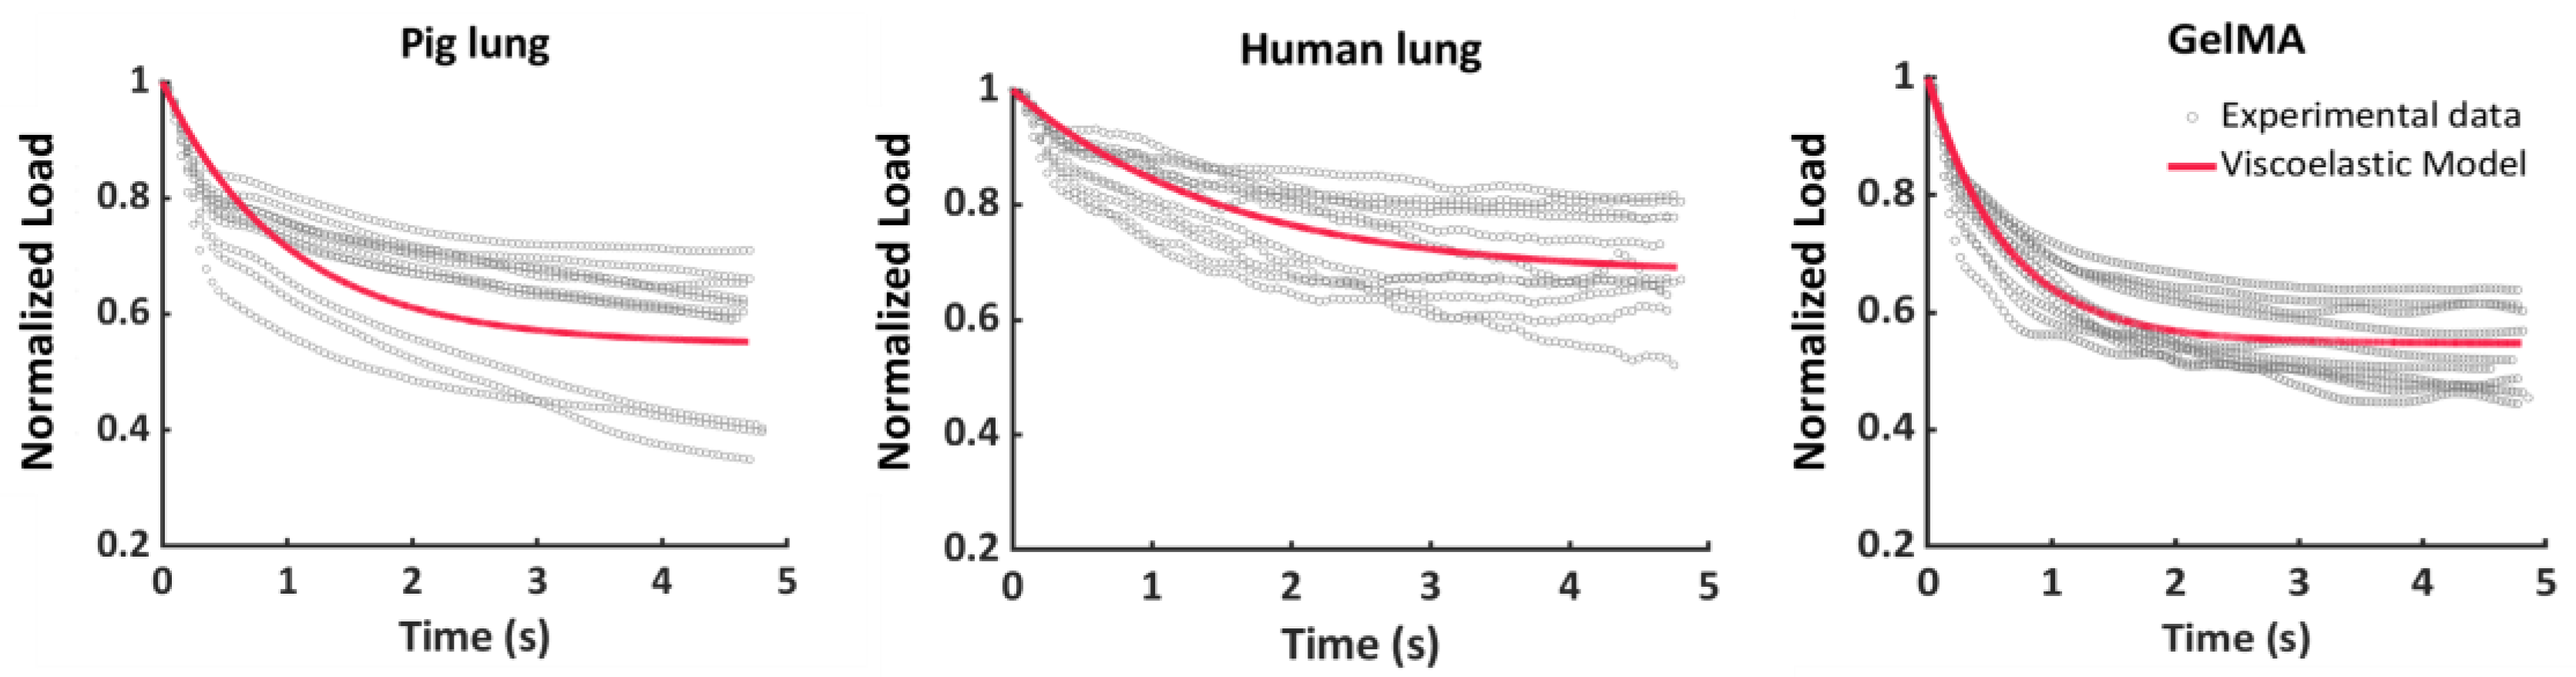
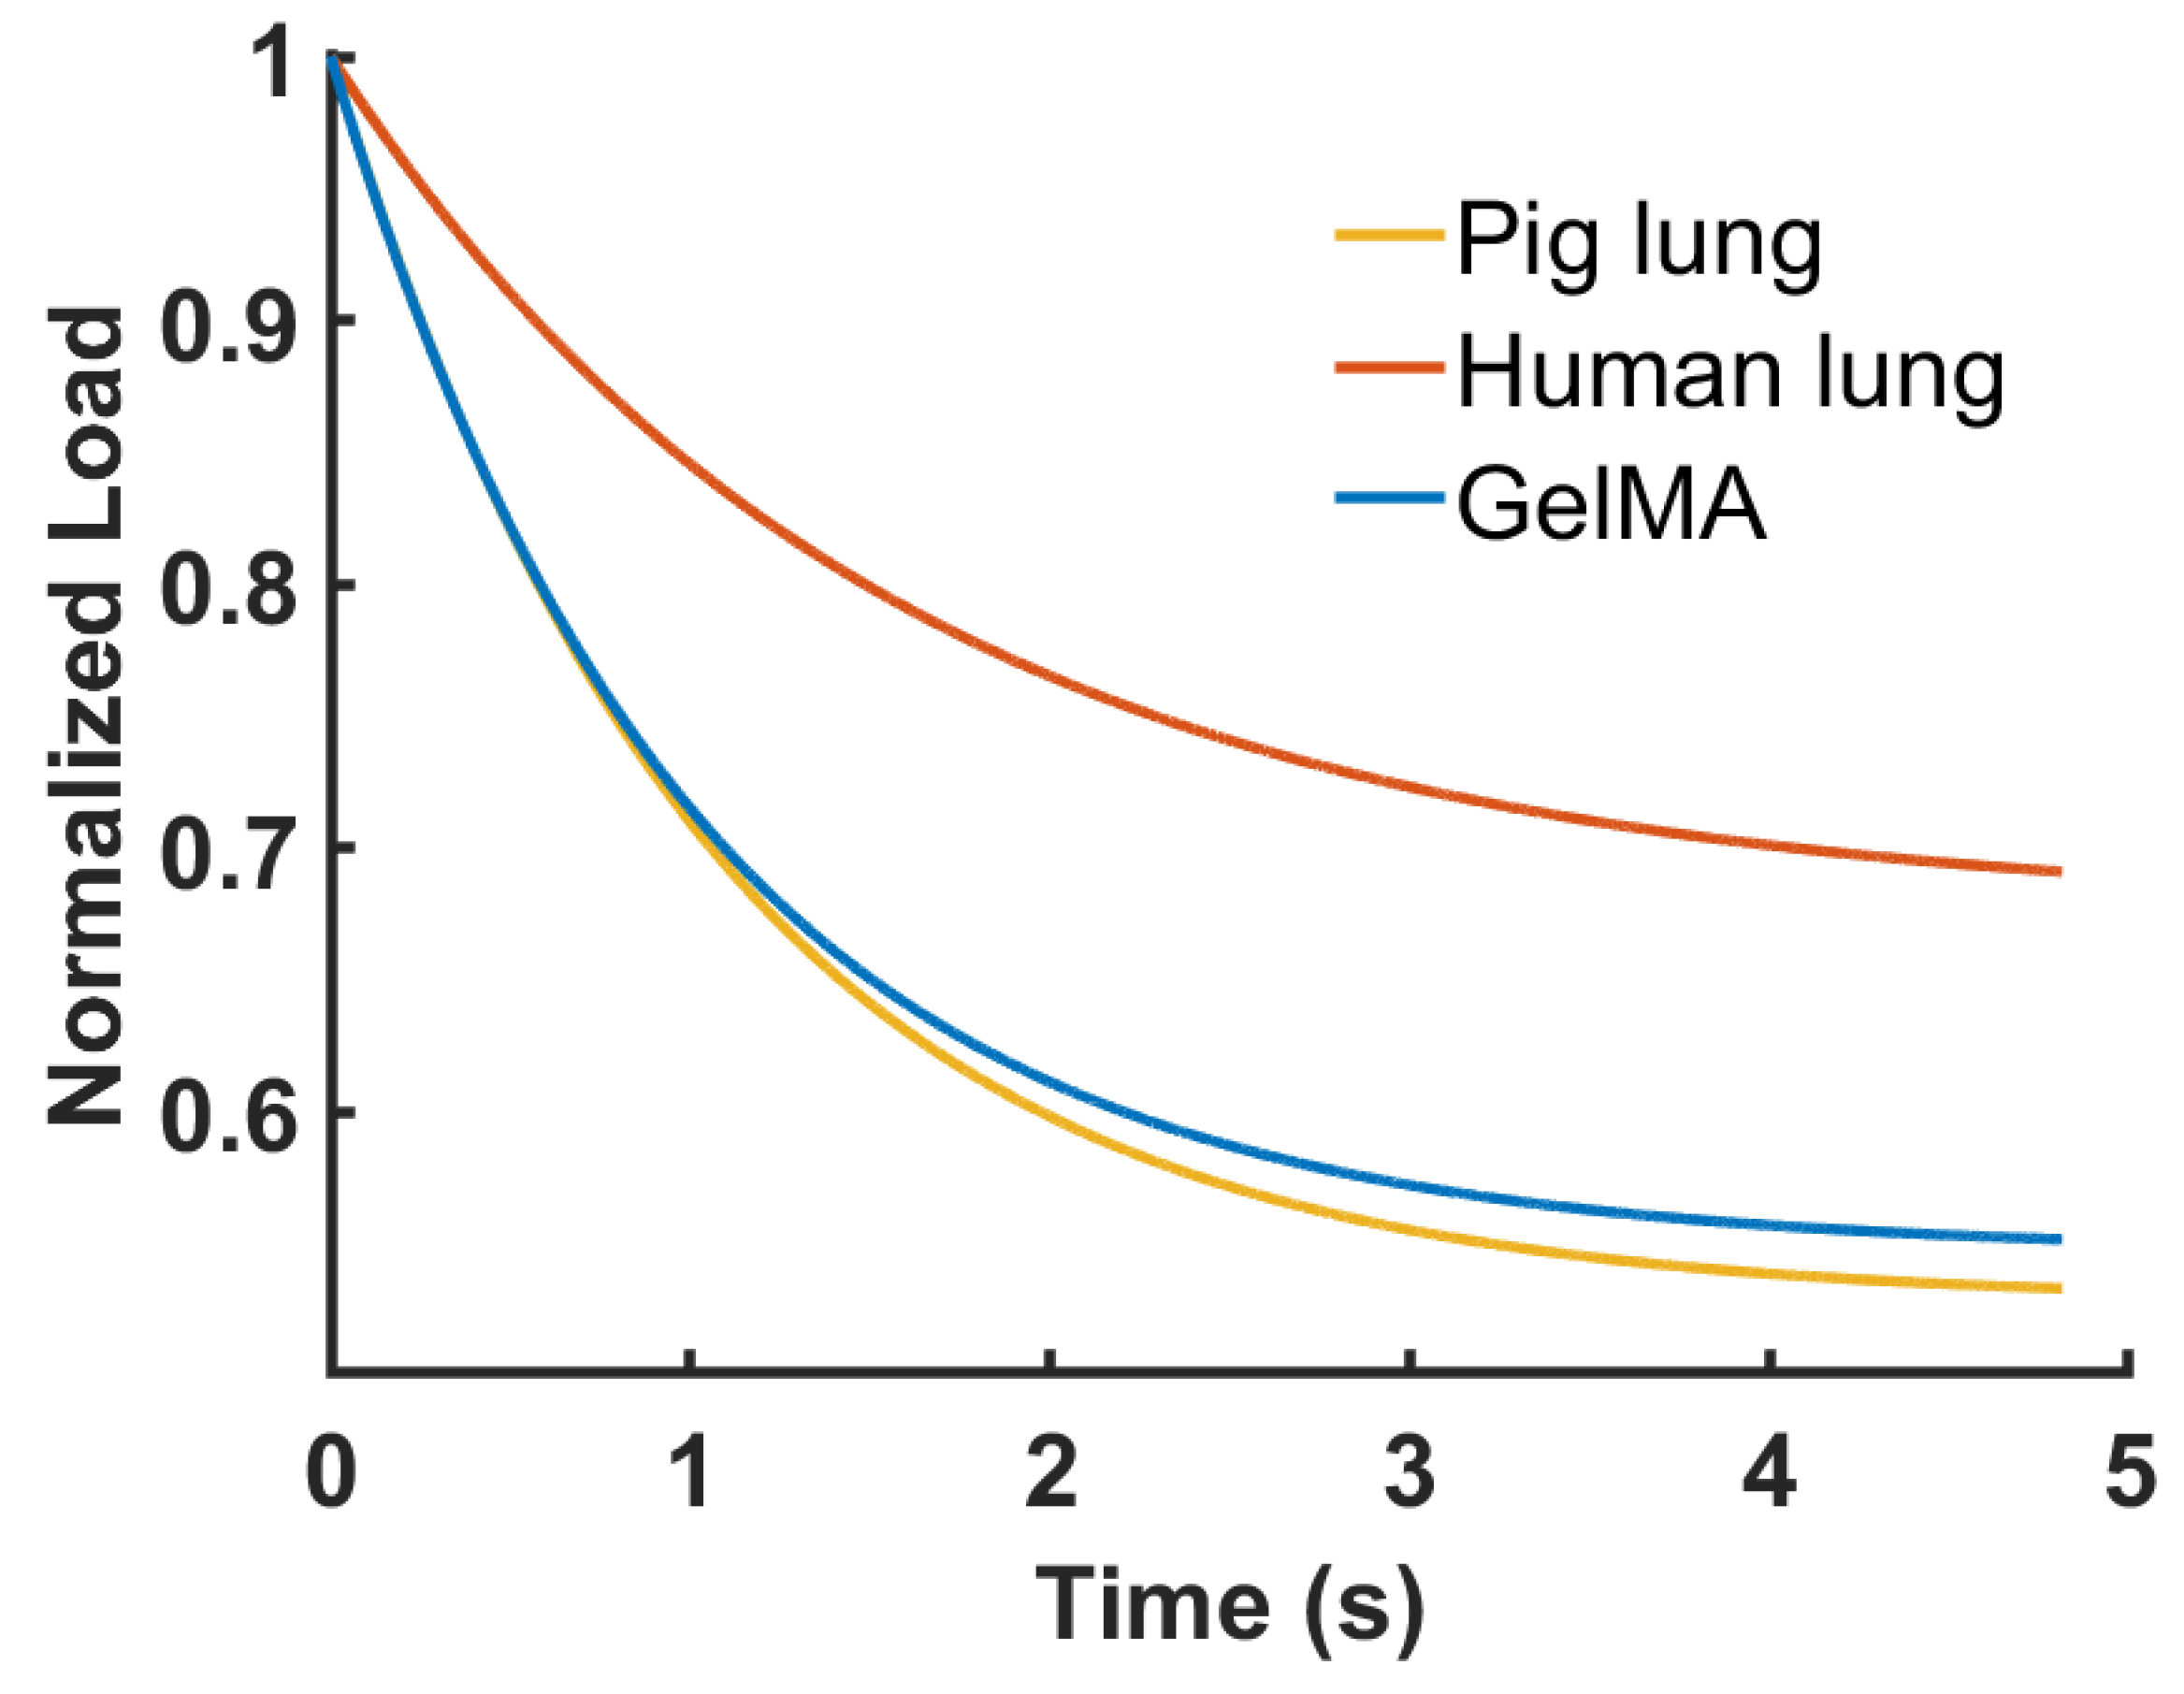
3.2. Stress–Relaxation Behavior
4. Discussion
5. Conclusions
Author Contributions
Funding
Institutional Review Board Statement
Informed Consent Statement
Data Availability Statement
Conflicts of Interest
Appendix A
References
- Handorf, A.M.; Zhou, Y.; Halanski, M.A.; Li, W.J. Tissue Stiffness Dictates Development, Homeostasis, and Disease Progression. Organogenesis 2015, 11, 1–15. [Google Scholar] [CrossRef]
- Di, X.; Gao, X.; Peng, L.; Ai, J.; Jin, X.; Qi, S.; Li, H.; Wang, K.; Luo, D. Cellular Mechanotransduction in Health and Diseases: From Molecular Mechanism to Therapeutic Targets. Signal Transduct. Target. Ther. 2023, 8, 282. [Google Scholar] [CrossRef]
- Melica, M.E.; La Regina, G.L.; Parri, M.; Peired, A.J.; Romagnani, P.; Lasagni, L. Substrate Stiffness Modulates Renal Progenitor Cell Properties via a ROCK-Mediated Mechanotransduction Mechanism. Cells 2019, 8, 1561. [Google Scholar] [CrossRef]
- Bakhshandeh, B.; Sorboni, S.G.; Ranjbar, N.; Deyhimfar, R.; Abtahi, M.S.; Izady, M.; Kazemi, N.; Noori, A.; Pennisi, C.P. Mechanotransduction in Tissue Engineering: Insights into the Interaction of Stem Cells with Biomechanical Cues. Exp. Cell Res. 2023, 431, 113766. [Google Scholar] [CrossRef]
- Sridharan, R.; Cavanagh, B.; Cameron, A.R.; Kelly, D.J.; O’Brien, F.J. Material Stiffness Influences the Polarization State, Function and Migration Mode of Macrophages. Acta Biomater. 2019, 89, 47–59. [Google Scholar] [CrossRef]
- Janmey, P.A.; Fletcher, D.A.; Reinhart-King, C.A. Stiffness Sensing by Cells. Physiol. Rev. 2020, 100, 695–724. [Google Scholar] [CrossRef]
- Chin, L.K.; Xia, Y.; Discher, D.E.; Janmey, P.A. Mechanotransduction in Cancer. Curr. Opin. Chem. Eng. 2016, 11, 77–84. [Google Scholar] [CrossRef]
- Montagner, G.; Barbazza, A.; Lugas, A.T.; Terzini, M.; Serino, G.; Bignardi, C.; Cacciatore, M.; Vida, V.L.; Padalino, M.A.; Trojan, D. Decellularized Cryopreserved Human Pericardium: A Validation Study towards Tissue Bank Practice. Cell Tissue Bank. 2023. [Google Scholar] [CrossRef]
- Belviso, I.; Romano, V.; Sacco, A.M.; Ricci, G.; Massai, D.; Cammarota, M.; Catizone, A.; Schiraldi, C.; Nurzynska, D.; Terzini, M.; et al. Decellularized Human Dermal Matrix as a Biological Scaffold for Cardiac Repair and Regeneration. Front. Bioeng. Biotechnol. 2020, 8, 229. [Google Scholar] [CrossRef]
- Hamon, M.; Chen, Y.; Srivastava, P.; Chang, H.M.; Gupta, V.; Jin, L.; Yanagawa, N.; Hauser, P.V. Matrix Stiffness Influences Tubular Formation in Renal Tissue Engineering. Appl. Sci. 2023, 13, 4510. [Google Scholar] [CrossRef]
- Islam, M.R.; Virag, J.; Oyen, M.L. Micromechanical Poroelastic and Viscoelastic Properties of Ex-Vivo Soft Tissues. J. Biomech. 2020, 113, 110090. [Google Scholar] [CrossRef] [PubMed]
- Cacopardo, L.; Guazzelli, N.; Nossa, R.; Mattei, G.; Ahluwalia, A. Engineering Hydrogel Viscoelasticity. J. Mech. Behav. Biomed. Mater. 2019, 89, 162–167. [Google Scholar] [CrossRef] [PubMed]
- Cantini, M.; Donnelly, H.; Dalby, M.J.; Salmeron-Sanchez, M. The Plot Thickens: The Emerging Role of Matrix Viscosity in Cell Mechanotransduction. Adv. Healthc. Mater. 2020, 9, 1901259. [Google Scholar] [CrossRef] [PubMed]
- Chaudhuri, O.; Cooper-White, J.; Janmey, P.A.; Mooney, D.J.; Shenoy, V.B. Effects of Extracellular Matrix Viscoelasticity on Cellular Behaviour. Nature 2020, 584, 535–546. [Google Scholar] [CrossRef] [PubMed]
- Zhang, Y.; Wang, Z.; Sun, Q.; Li, Q.; Li, S.; Li, X. Dynamic Hydrogels with Viscoelasticity and Tunable Stiffness for the Regulation of Cell Behavior and Fate. Materials 2023, 16, 5161. [Google Scholar] [CrossRef] [PubMed]
- Li, J.; Liu, Y.; Zhang, Y.; Yao, B.; Enhejirigala, B.; Li, Z.; Song, W.; Wang, Y.; Duan, X.; Yuan, X.; et al. Biophysical and Biochemical Cues of Biomaterials Guide Mesenchymal Stem Cell Behaviors. Front. Cell Dev. Biol. 2021, 9, 640388. [Google Scholar] [CrossRef]
- Goetzke, R.; Sechi, A.; De Laporte, L.; Neuss, S.; Wagner, W. Why the Impact of Mechanical Stimuli on Stem Cells Remains a Challenge. Cell. Mol. Life Sci. 2018, 75, 3297–3312. [Google Scholar] [CrossRef]
- Puech, P.H.; Bongrand, P. Mechanotransduction as a Major Driver of Cell Behaviour: Mechanisms, and Relevance to Cell Organization and Future Research. Open Biol. 2021, 11, 210256. [Google Scholar] [CrossRef]
- Díaz-Bello, B.; Monroy-Romero, A.X.; Pérez-Calixto, D.; Zamarrón-Hernández, D.; Serna-Marquez, N.; Vázquez-Victorio, G.; Hautefeuille, M. Method for the Direct Fabrication of Polyacrylamide Hydrogels with Controlled Stiffness in Polystyrene Multiwell Plates for Mechanobiology Assays. ACS Biomater. Sci. Eng. 2019, 5, 4219–4227. [Google Scholar] [CrossRef]
- Tse, J.R.; Engler, A.J. Preparation of Hydrogel Substrates with Tunable Mechanical Properties. Curr. Protoc. Cell Biol. 2010, 47, 10–16. [Google Scholar] [CrossRef]
- Ho, T.C.; Chang, C.C.; Chan, H.P.; Chung, T.W.; Shu, C.W.; Chuang, K.P.; Duh, T.H.; Yang, M.H.; Tyan, Y.C. Hydrogels: Properties and Applications in Biomedicine. Molecules 2022, 27, 2902. [Google Scholar] [CrossRef]
- Kocen, R.; Gasik, M.; Gantar, A.; Novak, S. Viscoelastic Behaviour of Hydrogel-Based Composites for Tissue Engineering under Mechanical Load. Biomed. Mater. 2017, 12, 025004. [Google Scholar] [CrossRef]
- Mierke, C.T. Viscoelasticity, Like Forces, Plays a Role in Mechanotransduction. Front. Cell Dev. Biol. 2022, 10, 789841. [Google Scholar] [CrossRef]
- Cacopardo, L.; Guazzelli, N.; Ahluwalia, A. Characterizing and Engineering Biomimetic Materials for Viscoelastic Mechanotransduction Studies. Tissue Eng. Part. B Rev. 2022, 28, 912–925. [Google Scholar] [CrossRef] [PubMed]
- Barthes, J.; Özçelik, H.; Hindié, M.; Ndreu-Halili, A.; Hasan, A.; Vrana, N.E. Cell Microenvironment Engineering and Monitoring for Tissue Engineering and Regenerative Medicine: The Recent Advances. BioMed Res. Int. 2014, 2014, 921905. [Google Scholar] [CrossRef]
- Bilston, L.E. Soft Tissue Rheology and Its Implications for Elastography: Challenges and Opportunities. NMR Biomed. 2018, 31, e3832. [Google Scholar] [CrossRef]
- Urban, M.W. Production of Acoustic Radiation Force Using Ultrasound: Methods and Applications. Expert. Rev. Med. Devices 2018, 15, 819–834. [Google Scholar] [CrossRef]
- Li, G.Y.; Cao, Y. Mechanics of Ultrasound Elastography. Proc. R. Soc. A Math. Phys. Eng. Sci. 2017, 473, 20160841. [Google Scholar] [CrossRef] [PubMed]
- Itoh, A.; Ueno, E.; Tohno, E.; Kamma, H.; Takahashi, H.; Shiina, T.; Yamakawa, M.; Matsumura, T. Breast Disease: Clinical Application of US Elastography for Diagnosis. Radiology 2006, 239, 341–350. [Google Scholar] [CrossRef]
- Jugé, L.; Foley, P.; Hatt, A.; Yeung, J.; Bilston, L.E. Ex Vivo Bovine Liver Nonlinear Viscoelastic Properties: MR Elastography and Rheological Measurements. J. Mech. Behav. Biomed. Mater. 2023, 138, 105638. [Google Scholar] [CrossRef] [PubMed]
- McKnight, A.L.; Kugel, J.L.; Rossman, P.J.; Manduca, A.; Hartmann, L.C.; Ehman, R.L. MR Elastography of Breast Cancer: Preliminary Results. Am. J. Roentgenol. 2012, 178, 1411–1417. [Google Scholar] [CrossRef]
- Larin, K.V.; Sampson, D.D. Optical Coherence Elastography–OCT at Work in Tissue Biomechanics [Invited]. Biomed. Opt. Express 2017, 8, 1172. [Google Scholar] [CrossRef] [PubMed]
- Han, Z.; Singh, M.; Aglyamov, S.R.; Liu, C.-H.; Nair, A.; Raghunathan, R.; Wu, C.; Li, J.; Larin, K.V. Quantifying Tissue Viscoelasticity Using Optical Coherence Elastography and the Rayleigh Wave Model. J. Biomed. Opt. 2016, 21, 090504. [Google Scholar] [CrossRef]
- Leartprapun, N.; Iyer, R.; Adie, S.G. Model-Independent Quantification of Soft Tissue Viscoelasticity with Dynamic Optical Coherence Elastography. Proc. SPIE 2017, 10053, 1005322. [Google Scholar]
- Raghunathan, S.; Evans, D.; Sparks, J.L. Poroviscoelastic Modeling of Liver Biomechanical Response in Unconfined Compression. Ann. Biomed. Eng. 2010, 38, 1789–1800. [Google Scholar] [CrossRef]
- Miller, K. Method of Testing Very Soft Biological Tissues in Compression. J. Biomech. 2005, 38, 153–158. [Google Scholar] [CrossRef]
- López-Guerra, E.A.; Solares, S.D. Modeling Viscoelasticity through Spring-Dashpot Models in Intermittent-Contact Atomic Force Microscopy. Beilstein J. Nanotechnol. 2014, 5, 2149–2163. [Google Scholar] [CrossRef]
- Najera, J.; Rosenberger, M.R.; Datta, M. Atomic Force Microscopy Methods to Measure Tumor Mechanical Properties. Cancers 2023, 15, 3285. [Google Scholar] [CrossRef]
- Abuhattum, S.; Mokbel, D.; Müller, P.; Soteriou, D.; Guck, J.; Aland, S. An Explicit Model to Extract Viscoelastic Properties of Cells from AFM Force-Indentation Curves. iScience 2022, 25, 104016. [Google Scholar] [CrossRef]
- Efremov, Y.M.; Okajima, T.; Raman, A. Measuring Viscoelasticity of Soft Biological Samples Using Atomic Force Microscopy. Soft Matter 2019, 16, 64–81. [Google Scholar] [CrossRef]
- Qian, L.; Zhao, H. Nanoindentation of Soft Biological Materials. Micromachines 2018, 9, 654. [Google Scholar] [CrossRef]
- Oyen, M.L.; Shean, T.A.V.; Strange, D.G.T.; Galli, M. Size Effects in Indentation of Hydrated Biological Tissues. J. Mater. Res. 2012, 27, 245–255. [Google Scholar] [CrossRef]
- Mijailovic, A.S.; Qing, B.; Fortunato, D.; Van Vliet, K.J. Characterizing Viscoelastic Mechanical Properties of Highly Compliant Polymers and Biological Tissues Using Impact Indentation. Acta Biomater. 2018, 71, 388–397. [Google Scholar] [CrossRef]
- Kazaili, A.; Geraghty, B.; Akhtar, R. Microscale Assessment of Corneal Viscoelastic Properties under Physiological Pressures. J. Mech. Behav. Biomed. Mater. 2019, 100, 103375. [Google Scholar] [CrossRef] [PubMed]
- Huang, H.; Tang, W.; Yang, Y.; Wu, B.; Yan, B. Determination of Viscoelastic Properties of the Periodontal Ligament Using Nanoindentation Testing and Numerical Modeling. J. Mech. Med. Biol. 2016, 16, 1650089. [Google Scholar] [CrossRef]
- Park, K.; Lonsberry, G.E.; Gearing, M.; Levey, A.I.; Desai, J.P. Viscoelastic Properties of Human Autopsy Brain Tissues as Biomarkers for Alzheimer’s Diseases. IEEE Trans. Biomed. Eng. 2019, 66, 1705–1713. [Google Scholar] [CrossRef] [PubMed]
- Mattei, G.; Gruca, G.; Rijnveld, N.; Ahluwalia, A. The Nano-Epsilon Dot Method for Strain Rate Viscoelastic Characterisation of Soft Biomaterials by Spherical Nano-Indentation. J. Mech. Behav. Biomed. Mater. 2015, 50, 150–159. [Google Scholar] [CrossRef]
- Jiri, N.; Michael, S.; Philipp, E. Micromechanical Properties of Polyacrylamide Hydrogels Measured by Spherical Nanoindentation. Key Eng. Mater. 2014, 606, 121–124. [Google Scholar]
- Simič, R.; Mathis, C.H.; Spencer, N.D. A Two-Step Method for Rate-Dependent Nano-Indentation of Hydrogels. Polymer 2018, 137, 276–282. [Google Scholar] [CrossRef]
- Karr, C.L.; Weck, B.; Massart, D.L.; Vankeerberghen, P. Least Median Squares Curve Fitting Using a Genetic Algorithm. Eng. Appl. Artif. Intell. 1995, 8, 177–189. [Google Scholar] [CrossRef]
- Agapie, A.; Fagarasan, F.; Stanciulescu, B. A Genetic Algorithm for a Fitting Problem. Nucl. Instrum. Methods Phys. Res. A 1997, 389, 288–292. [Google Scholar] [CrossRef]
- Smith, A.E.; Gulsen, M.; Tate, D.M. A Genetic Algorithm Approach to Curve Fitting. Int. J. Prod. Res. 1995, 33, 1911–1923. [Google Scholar]
- Van Den Bulcke, A.I.; Bogdanov, B.; De Rooze, N.; Schacht, E.H.; Cornelissen, M.; Berghmans, H. Structural and Rheological Properties of Methacrylamide Modified Gelatin Hydrogels. Biomacromolecules 2000, 1, 31–38. [Google Scholar] [CrossRef] [PubMed]
- Mattice, J.M.; Lau, A.G.; Oyen, M.L.; Kent, R.W. Spherical Indentation Load-Relaxation of Soft Biological Tissues. J. Mater. Res. 2006, 21, 2003–2010. [Google Scholar] [CrossRef]
- Qiang, B.; Greenleaf, J.; Oyen, M.; Zhang, X. Estimating Material Elasticity by Spherical Indentation Load-Relaxation Tests on Viscoelastic Samples of Finite Thickness. IEEE Trans. Ultrason. Ferroelectr. Freq. Control 2011, 58, 1418–1429. [Google Scholar] [CrossRef]
- Strange, D.G.T.; Fletcher, T.L.; Tonsomboon, K.; Brawn, H.; Zhao, X.; Oyen, M.L. Separating Poroviscoelastic Deformation Mechanisms in Hydrogels. Appl. Phys. Lett. 2013, 102, 031913. [Google Scholar] [CrossRef]
- Hertz, H. On the Contact of Elastic Solids. J. Für Die Reine Und Angew. Math. 1881, 92, 156–171. [Google Scholar]
- Muiznieks, L.D.; Keeley, F.W. Molecular Assembly and Mechanical Properties of the Extracellular Matrix: A Fibrous Protein Perspective. Biochim. Biophys. Acta Mol. Basis Dis. 2013, 1832, 866–875. [Google Scholar] [CrossRef] [PubMed]
- Huang, D.; Huang, Y.; Xiao, Y.; Yang, X.; Lin, H.; Feng, G.; Zhu, X.; Zhang, X. Viscoelasticity in Natural Tissues and Engineered Scaffolds for Tissue Reconstruction. Acta Biomater. 2019, 97, 74–92. [Google Scholar] [CrossRef]
- Alisafaei, F.; Han, C.S.; Sanei, S.H.R. On the Time and Indentation Depth Dependence of Hardness, Dissipation and Stiffness in Polydimethylsiloxane. Polym. Test. 2013, 32, 1220–1228. [Google Scholar] [CrossRef]
- Forgacs, G.; Foty, R.A.; Shafrir, Y.; Steinberg, M.S. Viscoelastic Properties of Living Embryonic Tissues: A Quantitative Study. Biophys. J. 1998, 74, 2227–2234. [Google Scholar] [CrossRef]
- Dwivedi, K.K.; Lakhani, P.; Kumar, S.; Kumar, N. The Effect of Strain Rate on the Stress Relaxation of the Pig Dermis: A Hyper-Viscoelastic Approach. J. Biomech. Eng. 2020, 142, 091006. [Google Scholar] [CrossRef]
- Suki, B.; Bates, J.H.T. Emergent Behavior in Lung Structure and Function Lung Tissue Mechanics as an Emergent Phenomenon. J. Appl. Physiol. 2011, 110, 1111–1118. [Google Scholar] [CrossRef]
- Kauer, M.; Vuskovic, V.; Dual, J.; Szekely, G.; Bajka, M. Inverse Finite Element Characterization of Soft Tissues. Med. Image Anal. 2002, 6, 275–287. [Google Scholar] [CrossRef]
- Lucas, S.R.; Bass, C.R.; Salzar, R.S.; Oyen, M.L.; Planchak, C.; Ziemba, A.; Shender, B.S.; Paskoff, G. Viscoelastic Properties of the Cervical Spinal Ligaments under Fast Strain-Rate Deformations. Acta Biomater. 2008, 4, 117–125. [Google Scholar] [CrossRef] [PubMed]
- Troyer, K.L.; Estep, D.J.; Puttlitz, C.M. Viscoelastic Effects during Loading Play an Integral Role in Soft Tissue Mechanics. Acta Biomater. 2012, 8, 234–243. [Google Scholar] [CrossRef]
- Rigato, A.; Miyagi, A.; Scheuring, S.; Rico, F. High-Frequency Microrheology Reveals Cytoskeleton Dynamics in Living Cells. Nat. Phys. 2017, 13, 771–775. [Google Scholar] [CrossRef]
- Hampoelz, B.; Lecuit, T. Nuclear Mechanics in Differentiation and Development. Curr. Opin. Cell Biol. 2011, 23, 668–675. [Google Scholar] [CrossRef] [PubMed]
- Gosline, J.; Lillie, M.; Carrington, E.; Guerette, P.; Ortlepp, C.; Savage, K. Elastic Proteins: Biological Roles and Mechanical Properties. Philos. Trans. R. Soc. B Biol. Sci. 2002, 357, 121–132. [Google Scholar] [CrossRef] [PubMed]
- Balestrini, J.L.; Gard, A.L.; Gerhold, K.A.; Wilcox, E.C.; Liu, A.; Schwan, J.; Le, A.V.; Baevova, P.; Dimitrievska, S.; Zhao, L.; et al. Comparative Biology of Decellularized Lung Matrix: Implications of Species Mismatch in Regenerative Medicine. Biomaterials 2016, 102, 220–230. [Google Scholar] [CrossRef]
- Burgstaller, G.; Oehrle, B.; Gerckens, M.; White, E.S.; Schiller, H.B.; Eickelberg, O. The Instructive Extracellular Matrix of the Lung: Basic Composition and Alterations in Chronic Lung Disease. Eur. Respir. J. 2017, 50, 1601805. [Google Scholar] [CrossRef] [PubMed]
- Brown, A.E.X.; Litvinov, R.I.; Discher, D.E.; Purohit, P.K.; Weisel, J.W. Multiscale Mechanics of Fibrin Polymer: Gel Stretching with Protein Unfolding and Loss of Water. Science 2009, 325, 741–744. [Google Scholar] [CrossRef] [PubMed]
- Chaudhuri, O.; Gu, L.; Darnell, M.; Klumpers, D.; Bencherif, S.A.; Weaver, J.C.; Huebsch, N.; Mooney, D.J. Substrate Stress Relaxation Regulates Cell Spreading. Nat. Commun. 2015, 6, 6365. [Google Scholar] [CrossRef] [PubMed]


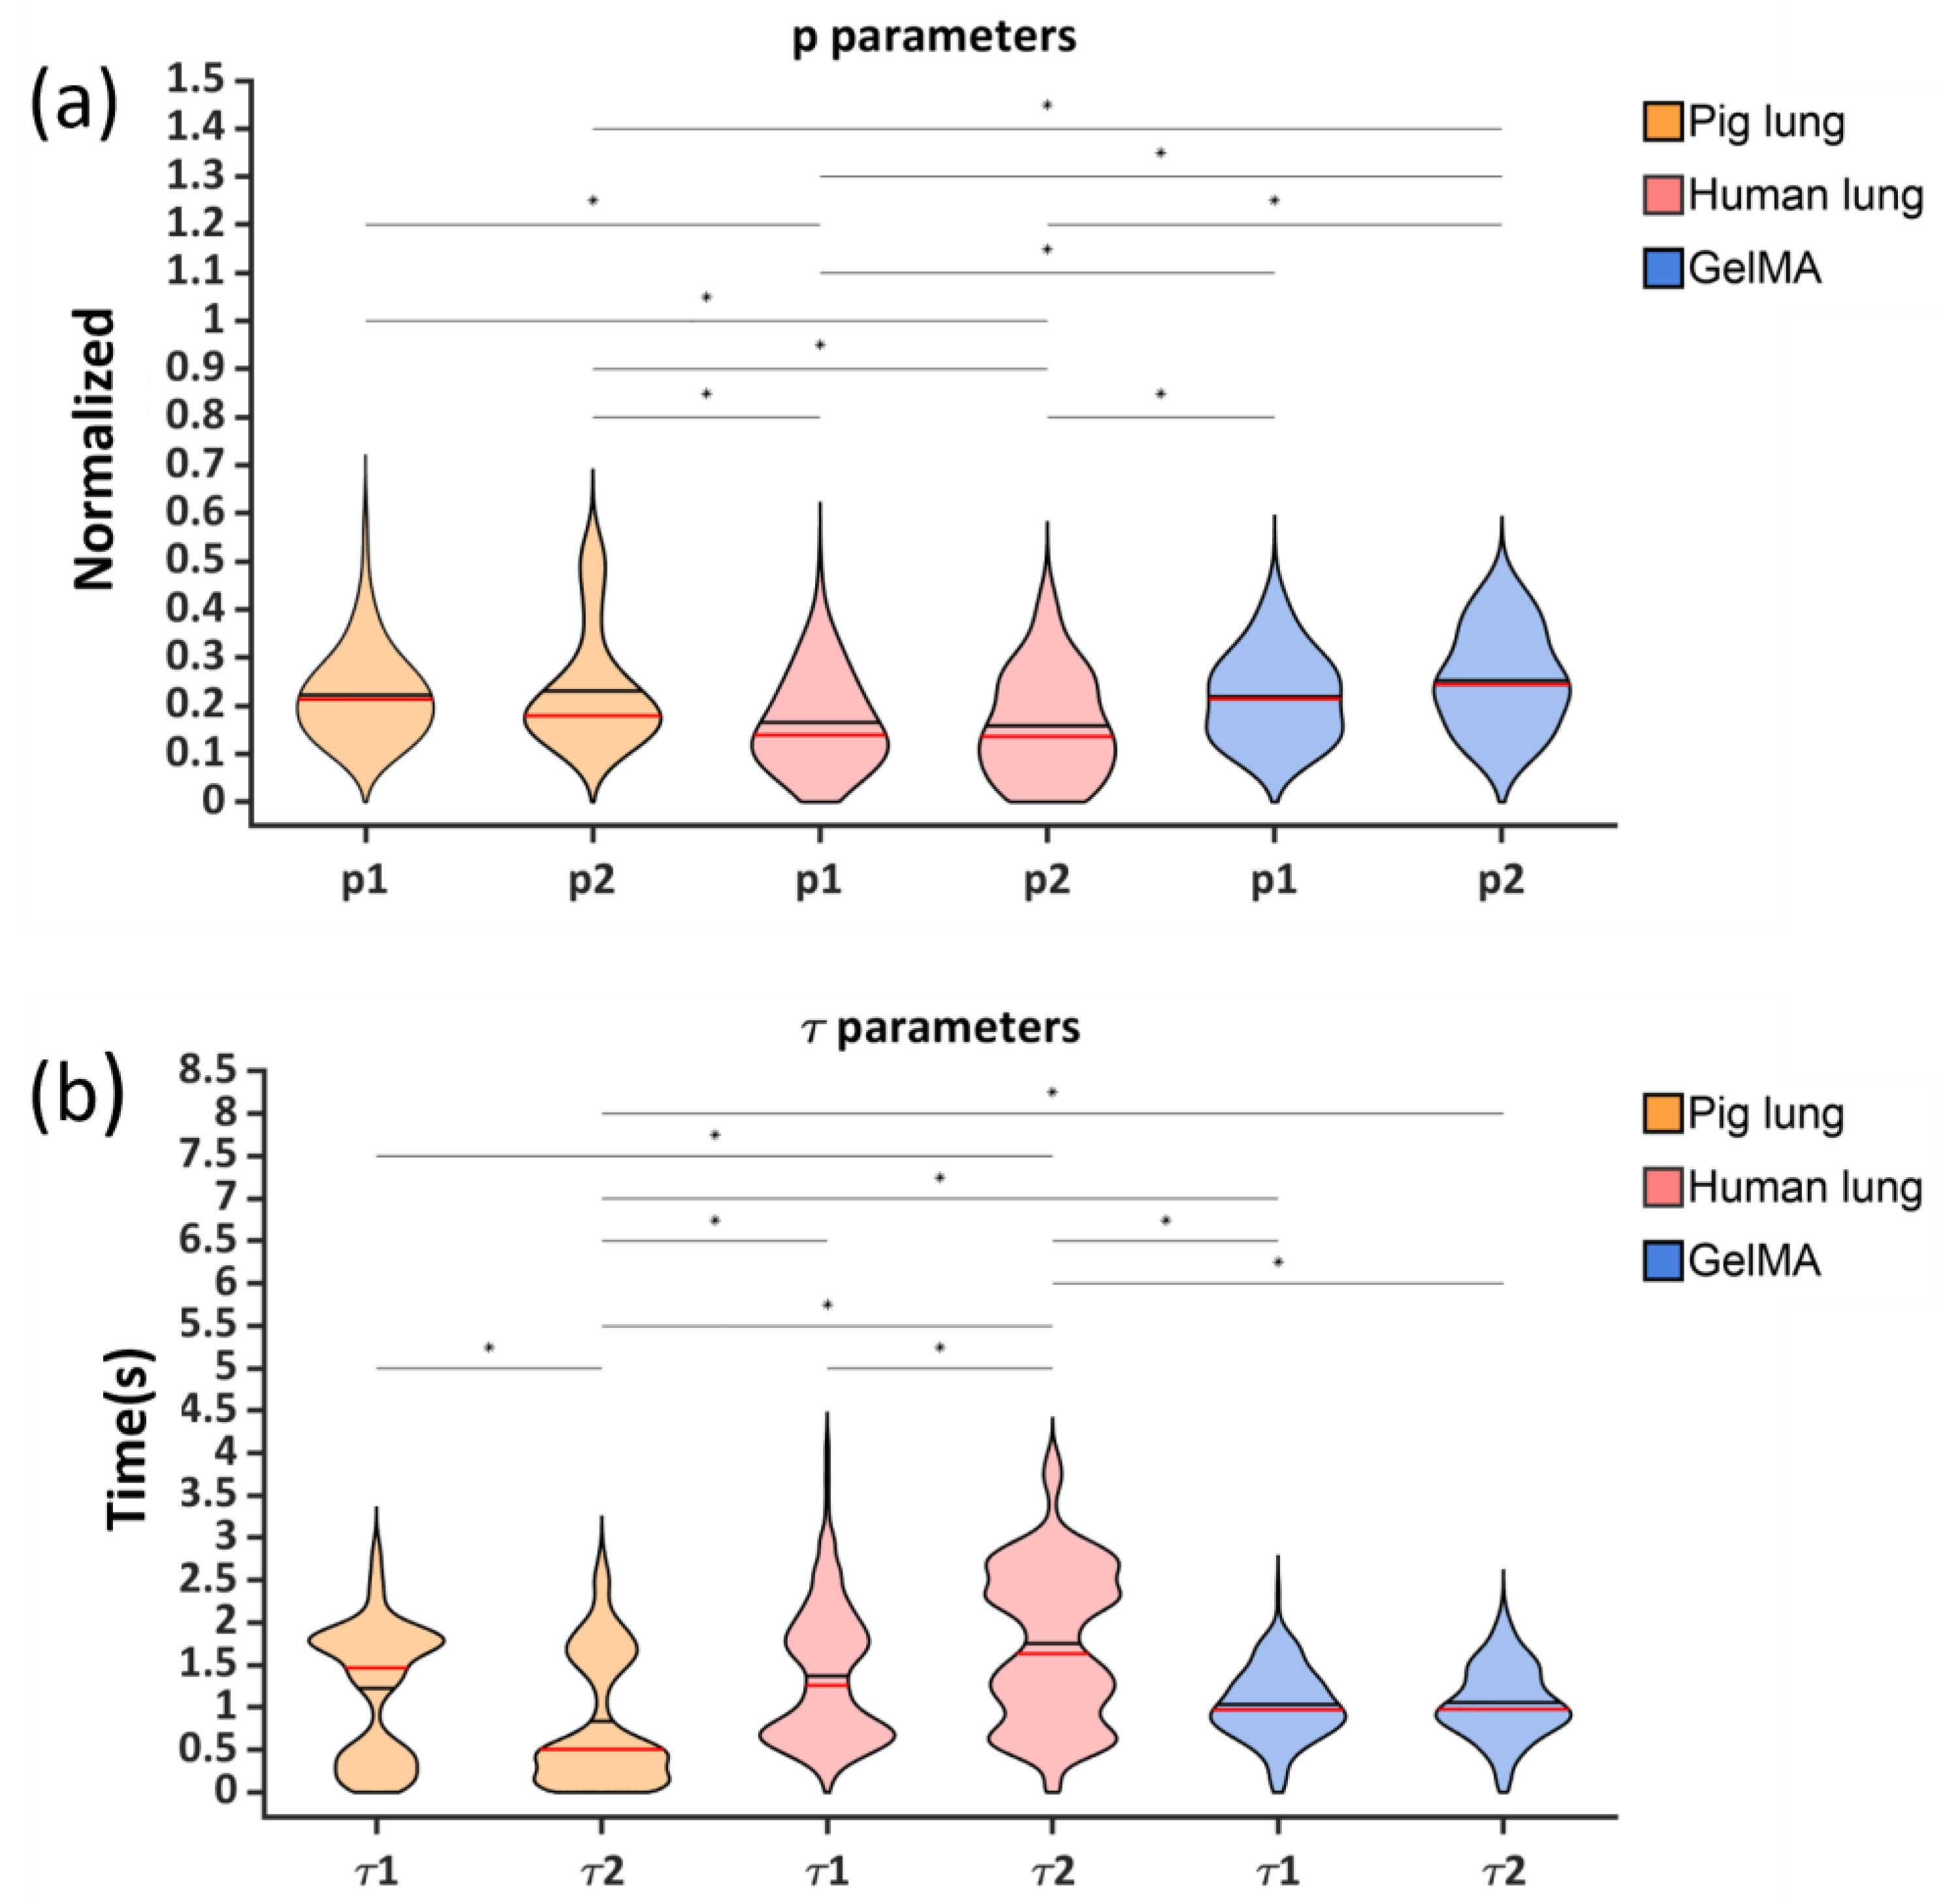
| Parameters | Pig Lung | Human Lung | GelMA |
|---|---|---|---|
| p1 | 0.22 ± 0.09 | 0.16 ± 0.09 | 0.22 ± 0.09 |
| p2 | 0.23 ± 0.12 | 0.16 ± 0.11 | 0.25 ± 0.10 |
| τ1 (s) | 1.22 ± 0.77 | 1.37 ± 0.78 | 1.04 ± 0.42 |
| τ2 (s) | 0.84 ± 0.76 | 1.76 ± 0.90 | 1.07 ± 0.42 |
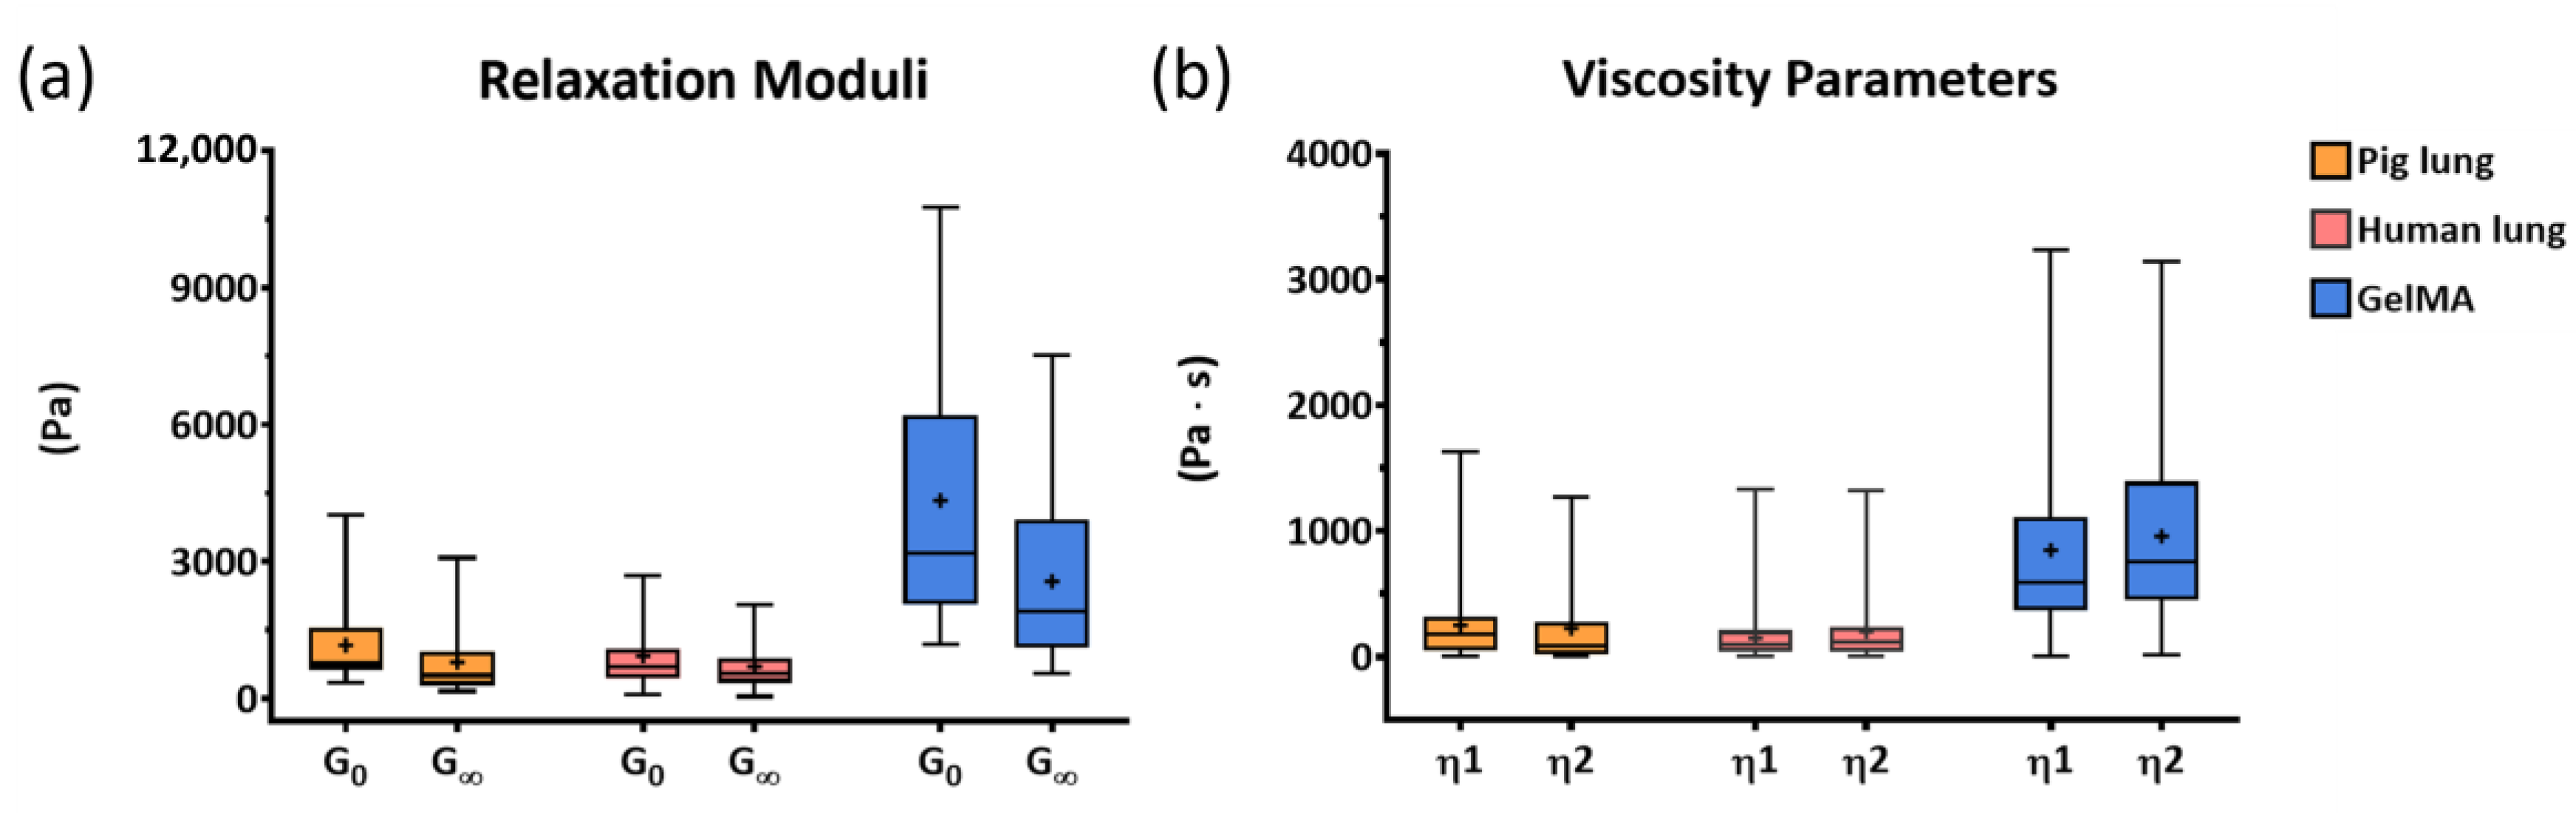
| Sample | G0 (Pa) | G∞ (Pa) |
|---|---|---|
| Pig lung | 1166.7 ± 995.5 | 792.7 ± 764.7 |
| Human lung | 929.1 ± 751.8 | 702.3 ± 548.2 |
| GelMA | 4339.2 ± 2689 | 2565 ± 1698 |
| Sample | η1 (Pa ∙ s) | η2 (Pa ∙ s) |
|---|---|---|
| Pig lung | 249.9 ± 263.4 | 225.7 ± 323.5 |
| Human lung | 148 ± 171.4 | 199.2 ± 262.6 |
| GelMA | 847.8 ± 733.1 | 957.2 ± 705.4 |
Disclaimer/Publisher’s Note: The statements, opinions and data contained in all publications are solely those of the individual author(s) and contributor(s) and not of MDPI and/or the editor(s). MDPI and/or the editor(s) disclaim responsibility for any injury to people or property resulting from any ideas, methods, instructions or products referred to in the content. |
© 2024 by the authors. Licensee MDPI, Basel, Switzerland. This article is an open access article distributed under the terms and conditions of the Creative Commons Attribution (CC BY) license (https://creativecommons.org/licenses/by/4.0/).
Share and Cite
Tosini, M.; Tänzer, T.; Villata, S.; Baruffaldi, D.; Monica, V.; Peracino, B.; Primo, L.; Frascella, F.; Pirri, F.; Audenino, A.; et al. A Methodological Approach for Interpreting and Comparing the Viscoelastic Behaviors of Soft Biological Tissues and Hydrogels at the Cell-Length Scale. Appl. Sci. 2024, 14, 1093. https://doi.org/10.3390/app14031093
Tosini M, Tänzer T, Villata S, Baruffaldi D, Monica V, Peracino B, Primo L, Frascella F, Pirri F, Audenino A, et al. A Methodological Approach for Interpreting and Comparing the Viscoelastic Behaviors of Soft Biological Tissues and Hydrogels at the Cell-Length Scale. Applied Sciences. 2024; 14(3):1093. https://doi.org/10.3390/app14031093
Chicago/Turabian StyleTosini, Marta, Torne Tänzer, Simona Villata, Désirée Baruffaldi, Valentina Monica, Barbara Peracino, Luca Primo, Francesca Frascella, Fabrizio Pirri, Alberto Audenino, and et al. 2024. "A Methodological Approach for Interpreting and Comparing the Viscoelastic Behaviors of Soft Biological Tissues and Hydrogels at the Cell-Length Scale" Applied Sciences 14, no. 3: 1093. https://doi.org/10.3390/app14031093