
Optimisation of Synchronous Grouting Mix Ratio for Shield Tunnels
1
College of Civil Engineering, Guangxi University of Science and Technology, Liuzhou 545026, China
2
College of Civil Engineering and Architecture, Guilin University of Technology, Guilin 541004, China
*
Author to whom correspondence should be addressed.
Appl. Sci. 2024, 14(10), 4098; https://doi.org/10.3390/app14104098
Submission received: 13 April 2024
/
Revised: 8 May 2024
/
Accepted: 10 May 2024
/
Published: 11 May 2024
Abstract
:During shield construction in underground spaces, synchronous grouting slurry is poured between the surrounding rock and tunnel lining to ensure stability. For synchronous grouting slurries, few studies have investigated the relationship between the rheological parameters and physical properties, grout-segregation mechanism, and anti-segregation performance. Therefore, we explored the relationships between the slurry rheological parameters, segregation rate, and bleeding rate. Cement, sand, fly ash, and bentonite were used to prepare the slurry, and the effects of different polycarboxylate water-reducing agents and dispersible latex powder dosages were studied. The rheological parameters of 16 groups of uniformly designed slurries were tested, and the data were fit using the Herschel–Bulkley model. The optimal mix ratio lowered the slurry segregation rate, and its rheological behaviour was consistent with the Herschel–Bulkley fluid characteristics. High-yield-shear-stress synchronous grouting slurries with high and low viscosity coefficients were less likely to bleed and segregate, respectively. The optimised slurry fluidity, 3 h bleeding rate, 24 h bleeding rate, segregation rate, coagulation time, and 28 days compressive strength were 257.5 mm, 0.71%, 0.36%, 3.1%, 6.7 h, and 2.61 MPa, respectively, which meet the requirements of a synchronous grouting slurry of shield tunnels for sufficiently preventing soil disturbance and deformation in areas surrounding underground construction sites.
1. Introduction
To alleviate urban traffic, it is necessary to further develop and utilise underground spaces. Shield tunnel construction is a core technology in the development of urban underground public spaces. During the shield construction process, to prevent soil disturbance or deformation in the surrounding area of the construction site [1], the waterproof and anti-seepage performance of the segment lining structure must be enhanced. This requires shield synchronous grouting to be poured between the surrounding rock and tunnel lining [2,3,4]. In actual projects, grouting slurry is usually required to have good fluidity and stability to avoid problems such as segregation, stratification, and bleeding. Therefore, the relationship between the grout components and physical properties has been studied worldwide. Additionally, the flow and deformation properties of grout have been studied based on the rheology theory, and the relationship between material characteristic parameters and engineering properties has been established [5,6,7].
Research on slurry mix ratios has mainly focused on the influence of slurry components and their contents on slurry properties. By studying the effects of the dosage of bentonite, water-reducing agents, and fly ash [8,9,10] on the volume shrinkage deformation [8,10], time loss of fluidity [9], bleeding rate, setting time [10], mechanical properties [11], and the water retention rate of slurry [12], it was found that as the cement dosage increases, the slurry setting time and bleeding rate decrease, and the compressive strength increases. As the fly ash dosage increases, the slurry workability improves. As the bentonite dosage increases, the water retention and slurry viscosity increase. Based on these findings, the proportion of slurry components was optimised, and an admixture suitable for synchronous grouting slurry was developed [13]. In addition, by using styrene–acrylic emulsion, pure acrylic emulsion, and emulsified asphalt [14] to modify the synchronous grouting fluid, the effects of these three components on the performance of mortar were analysed in detail and it was found that for highly permeable aquifers, turbidity and system pH must also be considered [15].
Several related studies have been conducted on the rheological properties of slurries, and the addition of rice husk ash has been shown to affect the rheological properties of mortar. As the amount of rice husk ash increases, the yield stress and plastic viscosity of repair mortar increase. Rice husk ash does not change the rheological type of cement slurries [16]. The addition of a thickener reduces mortar fluidity but increases the yield stress and plastic viscosity [17,18]. Although anionic viscosity modifiers can increase the yield stress of slurries, the improvement effect weakens as the dosage increases, and a super absorbent resin viscosity regulator can increase the yield stress and plastic viscosity of slurries [18]. Shear-resistant synchronous grouting mortar differs from conventional grout because its properties are similar to toothpaste and retain high fluidity after a long interval [19].
Studies on the rheological properties of slurries have been performed using numerical simulations. Abramian et al. [20] used numerical simulation methods to simulate the rheology of granular materials in the Navier–Stokes solver program. Liu [21] used the plastic analysis method to calculate the critical yield stress and performed a bounded analysis on it. Cui [22] used the generalised moving object method to simulate the movement and static segregation of coarse aggregates and studied the effects of mortar yield stress and viscosity on the movement process of aggregates. Liu et al. [17] established a method that considered flocculation, hydration, and particle aggregation. The novel yield stress evolution model was jointly affected by the interaction between the cement paste and the three factors. These results show that the rheological model of the grouting material conforms to the Herschel–Bulkley (H–B) model and that the yield stress increases with time.
Although researchers have conducted many related studies on the effects of the mix ratio or addition of new components on the rheological parameters and physical properties of slurries, there are few studies on the relationship between the rheological parameters and physical properties of slurries. Simultaneously, the grout segregation mechanism of the synchronous grouting slurry of shield tunnels and the anti-segregation performance have been rarely discussed [8,9,10,11,12,13,14,15,16,17,18]. Therefore, the effects of each slurry component on the fluidity, free bleeding rate, and segregation rate of a mortar-truncated cone were investigated in this study. The relationships between the bleeding rate, segregation rate, and rheological properties of the slurry, and easy delamination, segregation, bleeding, and tube blocking of the slurry in practical engineering were established. The rheological index was obtained based on nonlinear fitting of the obtained rheological parameter data by investigating the rheological properties of the grouting slurry. A three-dimensional scatter plot was used to explore the relationship between the rheological parameters of the slurry, bleeding rate, and segregation rate. Combined with MATLAB, the mix proportion was optimised to produce a high-performance synchronous grouting slurry that can maintain stability over long distances and transportation times and prevent easy stratification, segregation, bleeding, and pipe blocking in a newly mixed grouting slurry of shield tunnels.
2. Materials and Methods
2.1. Raw Materials
The cement selected was a P.O 42.5 grade ordinary Portland cement (Yangchun Hailuo Cement Co., Ltd., Canton, China), because Portland cement possesses good frost resistance, wear resistance [23], and corrosion resistance [24], and this grade of silicate concrete can guarantee a certain level of strength. The fly ash (Guangzhou Yueyu Concrete Building Materials Co., Ltd., Canton, China) used was grade II with a fineness, sieve residue, water demand ratio, loss on ignition, water content, sulphur trioxide content, and stability of 45 μm, 23%, 102%, 3.47%, 0.6%, 1.6%, and 4.3 mm, respectively. Material fluidity, early strength, and elastic modulus should be ensured [25], and type II fly ash should be selected to improve the performance of grouting slurry at a lower cost [26]. The bentonite used was composed of sodium, which can enhance the impermeability and crack resistance of the slurry [27]. The chemical compositions of the three materials are listed in Table 1. A polycarboxylate high-efficiency water-reducing agent was used, with a water-reducing rate of 40–50%. A redispersible latex powder (herein latex powder) was used. River sand is commonly used in engineering projects, and river sand with a fineness modulus of 2.1 was selected as the aggregate.
2.2. Single Factor Test
Single-factor multilevel experiments were conducted using the water-reducing agent and latex powder as variables to determine their optimal dosages. The mixing ratios for a single addition of the water-reducing agent are listed in Table 2. After a single addition of the water-reducing agent, the optimal water-reducing agent dosage was 1.46 kg/m3, and a composite admixture test was conducted with the latex powder. The test mix proportions are presented in Table 3.
2.3. Uniform Test
According to the single-factor test, the fly ash–cement content was 2.84. The water–cement, bentonite–water, cement–sand, water reducer–cement, and latex powder–cement ratios were 0.73–0.88, 0.20–0.35, 0.64–0.79, 0.1–0.4%, and 0.05–0.125%, respectively. Based on the above five factors, a uniform test was designed, and the number of tests was set to four times the number of test factors to improve the test accuracy. Sixteen groups of experiments were arranged using a uniform design table [28], as listed in Table 4.
2.4. Performance Testing
- (1)
- Fluidity, bleeding, and segregation rates
Referring to the cementitious grout (JC/T 986-2018) [29], grouting materials for prestressed structure in highway engineering (JT/T 946-2022) [30], and technical specification for application of self-compacting concrete (JGJT 283-2012) [31] standards, we conducted truncated cone fluidity, cement slurry free-bleeding rate, and a mixture of anti-segregation jumping table tests to analyse the fluidity, free-bleeding rate, and segregation rate of the mortar, respectively.
- (2)
- Rheological properties test
An R/SP-SST soft solid testing rheometer (AMETEK Brookfield, Inc., Middleboro, MA, USA) was used with a V40-20 rotor to simulate the shear flow state, test the rheological parameters of the shield tunnel synchronous grouting slurry, and establish a rheological curve. RHEO2000 was used to collect and analyse the experimental data.
The test followed the following process: (1) pre-shearing process: the slurry was stirred at a shear rate of 100 s−1 for 60 s, dropped to 0 s−1, and then stopped for 30 s; (2) data collection process: the shear rate increased from 0 to 100 s−1, and a total of 60 data points were measured. A high shear rate was applied at the beginning of the pre-shearing to break the static structure of the freshly mixed slurry and then left to stand for 30 s to dissipate the residual stress caused by the pre-shearing process [32].
2.5. Mix Proportion Optimisation and Verification
Based on the theoretical model, the rheological test results of the slurry were nonlinearly fit to obtain the rheological index. Using IBM SPSS Statistics 25, a multiple linear regression analysis was performed with the yield shear stress and viscosity coefficient as dependent variables to analyse the influence of the five experimental factors on the yield shear stress and viscosity coefficient of the slurry. IBM SPSS Statistics 25 was used to analyse the test results and obtain the regression equation. The regression equation under specific constraints was optimised using the MATLAB R2018a optimisation toolbox, and the fmincon function was adopted from the nonlinear constraint optimisation methods to obtain the optimal mix proportion [33,34] and conduct experimental verification. This function, which is based on the principles of the Sequential Quadratic Programming (SQP) algorithm, is a highly efficient computational method for solving nonlinearly constrained optimisation problems [35].
3. Results and Discussion
3.1. Single Factor Test
Figure 1 shows the effect of the water-reducing agent dosage on slurry fluidity, segregation rate, and bleeding rate. As shown in Figure 1a, the water-reducing agent significantly affected the fluidity of the slurry. As the water-reducing agent dosage increased, the fluidity of the grouting slurry increased significantly. This is because the water-reducing agent can destroy the floc structure formed by cement hydration, release the free water in the mortar [36], and reduce the friction between the slurry particles [37]. As shown in Figure 1b,c, the addition of a water-reducing agent causes the segregation rate and bleeding rate of the slurry to decrease first and then increase with the increase in dosage. This is because the addition of a water-reducing agent can release the free water in the mortar and allow it to further participate in the hydration reaction [36], improving the water retention of the slurry [12], which subsequently reduces both the segregation rate and bleeding rate of the slurry. However, as the dosage of the water-reducing agent continues to increase, more and more flocculation structures are destroyed [38], and it can also inhibit the hydration reaction [39], thereby reducing the stability of the mortar [40]. This ultimately leads to an increase in the segregation rate and bleeding rate of the slurry.
When the water-reducing agent dosage was 1.46 kg/m3, the segregation rate was low and the fluidity was 255 mm, which meets the performance index requirements of Type 2 mortar as stipulated in the gelatin-type dry-mixed mortar for shield-driving grouting (Q/ZTJHN1-2019) [41]. Therefore, the water-reducing agent dosage was determined to be 1.46 kg/m3.
As shown in Figure 2a, with the increase in latex powder content, the fluidity of the slurry first increases and then decreases. This is because the water-soluble protective colloidal coating of redispersible latex powder particles can prevent aggregation between particles, and latex powder has air entrainment properties, which can introduce a large number of tiny bubbles, allowing polymer particles and tiny bubbles to produce a “ball-bearing effect” in the cement slurry [42,43]. Therefore, the addition of latex powder increases the fluidity of the slurry [44,45]. However, as the latex powder content further increases, the fluidity of the slurry decreases. This is because the dissolved latex powder becomes more viscous, increasing the viscosity of the mortar [46] and the internal friction of the slurry [47], resulting in a decrease in slurry fluidity. As shown in Figure 2b, with the increase in latex powder content, the segregation rate of the slurry generally shows a downward trend. This is because the incorporation of latex powder can increase the water retention of the slurry [48], enhance the hydration within the slurry, as well as cohesion and adhesion [49,50], thereby improving mortar stability [40] and reducing the segregation rate. However, when the content exceeds 0.37 kg/m3, the segregation rate increases slightly. This is because when the latex powder content is too high, it can adhere to the surface of cement particles, impeding the contact between cement and water and weakening the hydration reaction [51], which in turn increases the slurry segregation rate.
3.2. Uniform Test
3.2.1. Effects of Water–Cement, Bentonite–Water, Cement–Sand, Water Reducer–Cement, and Latex Powder–Cement Ratios on Fluidity, Segregation Rate, and Bleeding Rate
The effects of the water–cement, bentonite–water, cement–sand, water reducer–cement, and latex powder–cement ratios on the fluidity, segregation rate, and bleeding rate of the slurry are shown in Table 5, Table 6 and Table 7, respectively.
Because the rheological curve trends of each test group were roughly the same and the slurry in group 16 had better anti-segregation and anti-bleeding properties, the rheological curve of the group 16 slurry was selected for analysis. The shear stress τ, shear rate γ, and apparent viscosity η–shear rate γ characteristic curves of the rheological test of the group 16 samples are shown in Figure 3a,b. The rheology of synchronous grouting slurry can reflect its flow and deformation patterns under different shear rates and express the corresponding relationship between the shear stress and rate [52]. Therefore, the rheological parameters—yield shear stress τ0 and viscosity coefficient K—can quantitatively describe the flow state of the synchronous grouting slurry. When the shear rate was lower than 10 s−1, the shear stress decreased, and the apparent viscosity decreased rapidly as the shear rate increased. When the shear rate reached 10 s−1, the shear stress of the grouting slurry increased linearly with increasing shear rate, and the viscosity was stable.
To quantify the rheological parameters of a fresh slurry, a suitable mathematical model must be selected to characterise its rheological properties. Research has shown that the Newtonian fluid, according to Bingham [53], improved Bingham (M–B) [54] and H–B models [55] can be used for rheological performance analyses, as shown in Equations (1)–(4), respectively. However, the synchronous grouting slurry in shield tunnels possesses a yield stress, which makes the Newtonian fluid model unsuitable for describing its rheological properties. Therefore, the three other models are used in the article to mathematically fit the test points of 16 experimental groups, and the results show that the R2 of the H-B model is better than the other two models in 11 groups. In addition, it can be seen from Figure 3a,b that the changing trends of the shear stress and viscosity of the slurry are consistent with the H–B law. For materials such as fresh concrete, mortar, and cement paste, the relationship between the shear rate and viscosity coefficient changes nonlinearly, which is consistent with the H–B model [17]. Therefore, this study used the H–B model to fit and analyse the relationship curve between the shear stress and rate. The τ–γ curve fitting results are shown in Figure 3c, where the rheological index is 1.73.
Newtonian fluid model:
Bingham model:
M–B model:
H–B model:
The rheological test results of the remaining 15 groups of slurries were fitted nonlinearly according to the H–B model, and the rheological indices of each test group are summarised in Table 8.
The coefficients of determination (R2) for the yield shear stress and viscosity coefficient were 0.943 and 0.633, respectively. The regression model equations are as follows:
where τ0 is the yield shear stress (Pa); K is the viscosity coefficient; and x1, x2, x3, x4, and x5 are the water–cement, bentonite–water, cement–sand, water reducer–cement, and latex powder–cement ratios, respectively.
Equations (5) and (6) show that the yield shear stress of the prepared shield tunnel synchronous grouting slurry was affected by the five test factors from large to small: bentonite–water ratio > water–cement ratio > water reducer–cement ratio > cement–sand ratio > latex powder–cement ratio; among them, the bentonite–water ratio has the greatest impact on the yield shear stress. The viscosity coefficient of the prepared shield tunnel synchronous grouting slurry was affected by the five test factors from large to small: bentonite–water ratio > water reducer–cement ratio > water–cement ratio > latex powder–cement ratio > cement–sand ratio; among them, the bentonite–water ratio has the greatest impact on the viscosity coefficient. The yield shear stress of the slurry increases linearly as the bentonite–water and latex powder–cement ratios increase and decreases linearly as the water–cement, cement–sand, and water reducer–cement ratios increase. The viscosity coefficient of the slurry increases linearly as the cement–sand, water reducer–cement, and latex powder–cement ratios increase and decreases linearly as the water–cement and bentonite–water ratios increase.
3.2.2. Effect of Slurry Rheology on Bleeding and Segregation Rates
The slurry bleeding rate was selected to explore the influence of rheology on the bleeding phenomenon, and a three-dimensional scatter plot of the yield shear stress, viscosity coefficient, and bleeding rate was generated.
As shown in Figure 4, the synchronous grouting slurry of a shield tunnel with a low yield shear stress and viscosity coefficient is more likely to cause bleeding. However, a synchronous grouting slurry with a high yield shear stress and high viscosity coefficient is less likely to bleed. According to the mechanic analysis of aggregate particles in the suspension state, when slurry aggregate particles are in the suspension state and the settling velocity is 0 m/s, the formula of medium resistance subjected to the slurry is F = π2a2τ0/4; that is, the greater the yield shear stress of the slurry, and the greater the medium resistance it can provide [56]. The high viscosity coefficient provides greater internal friction force within the slurry [47]. Studies have shown that the slurry viscosity coefficient is positively correlated with consistency [57], and at this time, the slurry has a low moisture content [58], thus making it less prone to bleeding.
When the yield shear stress τ0 of the synchronous grouting slurry is 15 Pa ≤ τ0 < 20 Pa and the viscosity coefficient K is 0 Pa·s ≤ K < 400 × 10−4 Pa·s, the bleeding rate is zero, and the slurry did not bleed. When the yield shear stress τ0 is 5 Pa ≤ τ0 < 17.5 Pa and the viscosity coefficient K is 0 Pa·s ≤ K < 600 × 10−4 Pa·s, the bleeding rate is controlled within the range of 0.2637–0.5275%. When the yield shear stress τ0 is 0 Pa ≤ τ0 < 17.5 Pa and the viscosity coefficient K is 600 × 10−4 Pa·s ≤ K < 1400 × 10−4 Pa·s, the bleeding rate is controlled in the range of 0.5275–1.055%. When the yield shear stress τ0 is 0 Pa ≤ τ0 < 5 Pa and the viscosity coefficient K is 200 × 10−4 Pa·s ≤ K < 400 × 10−4 Pa·s, the bleeding rate is controlled in the range of 1.846–2.11%.
Considering the segregation rate to explore the influence of rheology on the segregation phenomenon, a three-dimensional scatter plot of the yield shear stress, viscosity coefficient, and segregation rate was generated.
As shown in Figure 5, the synchronous grouting slurry of a shield tunnel with a low yield shear stress and high viscosity coefficient is more likely to produce segregation, whereas synchronous grouting slurry with a high yield shear stress and low viscosity coefficient is less likely to produce segregation. The segregation of mortar depends on the stress state of the mortar aggregate; that is, the segregation of mortar is determined by its viscous resistance [59]. According to the mechanical analysis of suspended aggregate particles [56], it can be seen that when the yield shear stress of the slurry is higher, the viscous resistance of the aggregates in the slurry is also higher, the acceleration of aggregate sedimentation decreases [60], and the slurry is less likely to segregate at this time [59].
When the yield shear stress τ0 of the synchronous grouting slurry is 5 Pa ≤ τ0 < 20 Pa and the viscosity coefficient K is 0 Pa·s ≤ K < 200 × 10−4 Pa·s, the segregation rate is less than 0.075%, and the slurry does not segregate. When the yield shear stress τ0 is 2.5 Pa ≤ τ0 < 15 Pa and the viscosity coefficient K is 200 × 10−4 Pa·s ≤ K < 400 × 10−4 Pa·s, the segregation rate is controlled within the range of 0.075–2.05%. When the yield shear stress τ0 is 10 Pa ≤ τ0 < 20 Pa and the viscosity coefficient K is 400 × 10−4 Pa·s ≤ K < 1000 × 10−4 Pa·s, the segregation rate can be controlled in the range of 2.05–9.95%. When the yield shear stress τ0 is 0 Pa ≤ τ0 < 5 Pa and 20 Pa ≤ τ0 < 25 Pa and the viscosity coefficient K is 800 × 10−4 Pa·s ≤ K < 1000 × 10−4 Pa·s and 0 Pa·s ≤ K < 200 × 10−4 Pa·s, the segregation rate can be controlled in the range of 11.92–13.9%.
4. Mix Ratio Optimisation
The optimal mix ratios [33,34] are listed in Table 9. The construction mix ratio of the slurry when its performance was optimal is listed in Table 10. Because the calculated mix ratio was not among the 16 sets of uniform tests, the optimised mix ratio was experimentally verified. The test results are listed in Table 11.
The test results show that the slurry fluidity was 250–260 mm, the 3 h bleeding rate was less than 0.79%, the initial setting time was more than 6 h, and the compressive strength was more than 2.5 MPa after 28 d. Therefore, the optimised mortar meets all the requirements for type II mortar as stipulated in the gelatin-type dry-mixed mortar for shield-driving grouting (Q/ZTJHN1-2019) [41], in terms of all its performances.
5. Conclusions
This paper investigates the effects of the dosages of water reducer and latex powder on the fluidity, segregation rate, and bleeding rate of mortar. It reveals the degree of influence of five mixed proportion factors on the rheological parameters of mortar, as well as the impact of rheological parameters on the segregation rate and bleeding rate of mortar. Finally, the mortar mix proportion is optimised under specific constraints and validated through experimentation. The conclusions are as follows:
- (1)
- As the water-reducing agent dosage increased, the fluidity of the synchronous grouting slurry increased, and the segregation rate first decreased and then increased. When the water-reducing agent dosage was 0.73, the slurry segregation rate was the lowest, and as the latex powder dosage increased, the slurry fluidity first increased and then decreased. The slurry segregation rate was lowest when the latex powder dosage was 0.37.
- (2)
- The rheological behaviour of the synchronous grouting slurry conformed to the H–B model. When the shear rate was lower than 10 s−1, the yield shear stress of the slurry decreased, and the viscosity decreased rapidly as the shear rate increased. When the shear rate was 10 s−1, the shear stress increased linearly as the shear rate increased, and the viscosity was stable. The fitting results indicate that the regression model is highly accurate.
- (3)
- After conducting a multiple linear regression analysis, it was found that the bentonite–water ratio has the greatest impact on the rheological properties of the grouting slurry.
- (4)
- Slurries with a high a yield shear stress and viscosity coefficient were unlikely to bleed, and slurries with a high yield shear stress and low viscosity coefficient were unlikely to segregate. When the yield shear stress τ0 of the slurry was 15 Pa ≤ τ0 < 20 Pa and the viscosity coefficient K was 0 Pa·s ≤ K < 400 × 10−4 Pa·s, the slurry bleeding rate was zero and no bleeding occurred. When the yield shear stress τ0 was 5 Pa ≤ τ0 < 20 Pa and the viscosity coefficient K was 0 Pa·s ≤ K < 200 × 10−4 Pa·s, the segregation rate was less than 0.075% and no segregation occurred.
- (5)
- Through the multi-objective programming optimisation method and MATLAB optimisation toolbox, a mix ratio that meets the required specifications was obtained. The optimised slurry fluidity, 3 h bleeding rate, 24 h bleeding rate, segregation rate, setting time, and 28 d compressive strength were 257.5 mm, 0.71%, 0.36%, 3.1%, 6.7 h, and 2.61 MPa, respectively, which meet the requirements of synchronous grouting slurry for shield tunnels.
- (6)
- The optimised grouting slurry meets the requirements for the synchronous grouting slurry in shield tunnels, effectively preventing soil disturbance and deformation in the surrounding areas of underground construction sites. However, in addition to optimising the slurry properties, improving construction techniques can also enhance the quality of shield tunnel construction. It is recommended to further investigate and establish a more standardised method for synchronous grouting in shield tunnelling.
Author Contributions
Conceptualisation, H.Z. and Y.Z.; methodology, H.Z.; software, Y.Z.; validation, H.Z., Y.Z. and W.Z.; formal analysis, H.Z.; investigation, X.H.; resources, W.Z.; data curation, Y.Z.; writing—original draft preparation, Y.Z.; writing—review and editing, Y.Z. and Q.Z.; visualisation, Y.Z.; supervision, H.Z.; project administration, H.Z.; funding acquisition, H.Z. All authors have read and agreed to the published version of the manuscript.
Funding
This research was funded by the Key Research & Development Program of Guangxi (Grant No. AB23026091).
Institutional Review Board Statement
Not applicable.
Informed Consent Statement
Not applicable.
Data Availability Statement
The data presented in this study are available on request from the corresponding author. The data are not publicly available due to privacy.
Acknowledgments
We would like to express our gratitude to all those who have provided support. Their assistance has been invaluable.
Conflicts of Interest
The authors declare no conflict of interest. The funders had no role in the design of the study; in the collection, analyses, or interpretation of data; in the writing of the manuscript; or in the decision to publish the results.
References
- Wang, Z.; Jin, D.; Shi, C. Spatial Variability of Grouting Layer of Shield Tunnel and Its Effect on Ground Settlement. Appl. Sci. 2020, 10, 5002. [Google Scholar] [CrossRef]
- Zhou, Z.; Hu, J.; Liu, Z.; Lu, S. Influence Mechanism of Grout Time-Dependent Behavior for Backfill Grouting of Shield Tunnel on Surrounding Rock Stress and Deformation. China Railw. Sci. 2022, 43, 86–93. [Google Scholar] [CrossRef]
- Xu, Z.; Pan, D.; Li, S.; Zhang, Y.; Bu, Z.; Liu, J. A grouting simulation method for quick-setting slurry in karst conduit: The sequential flow and solidification method. J. Rock Mech. Geotech. Eng. 2022, 14, 423–435. [Google Scholar] [CrossRef]
- Ma, J.; Sun, A.; Jiang, A.; Guo, N.; Liu, X.; Song, J.; Liu, T. Pressure Model Study on Synchronous Grouting in Shield Tunnels Considering the Temporal Variation in Grout Viscosity. Appl. Sci. 2023, 13, 10437. [Google Scholar] [CrossRef]
- Tan, Y.; Qian, Y.; Tan, M. Printability region for 3D concrete printing using slump and slump flow test. Compos. Part B Eng. 2019, 174, 106968. [Google Scholar] [CrossRef]
- Souza, M.T.; Ferreira, I.M.; de Guzi, M.; Senff, L.; de Novaes, O. 3D printed concrete for large-scale buildings: An overview of rheology, printing parameters, chemical admixtures, reinforcements, and economic and environmental prospects. J. Build. Eng. 2020, 32, 101833. [Google Scholar] [CrossRef]
- Kostrzanowska-Siedlarz, A.; Golaszewski, J. Rheological properties and the air content in fresh concrete for self compacting high performance concrete. Constr. Build. Mater. 2015, 94, 555–564. [Google Scholar] [CrossRef]
- Liang, J. Study on the Proportion of Backfill-grouting Materials and Grout Deformation Propertiesof Shield Tunnel. Master’s Thesis, Hohai University, Nanjing, China, 2006. [Google Scholar] [CrossRef]
- Xu, J.; Lin, W.; Xu, K.; Lin, J.; Wang, B.; Miao, Q.; Ding, Q. Study on Rapid-hardening High-performance Simultaneous Grouting Material for Shield-bored Tunnels. Tunn. Constr. 2014, 34, 95–100. [Google Scholar] [CrossRef]
- Li, X.; Yang, Z.; Wang, Y.; Liu, L.; Li, R. Experimental study on the material proportioning and performance of pre-mixed shield mortar. Fly Ash Compr. Util. 2017, 3, 41–44. [Google Scholar] [CrossRef]
- da Motta, C.A.O.; de Souza, J.; Martins, V.; Shaeffer, L.; Rossini, E.G.; Biehl, L.V.; de Jesus Pacheco, D.A.; Martins, C.O.D.; Medeiros, J.L.B. Enhancing composite materials through fly ash reinforcement through powder metallurgy. Mater. Chem. Phys. 2023, 307, 128124. [Google Scholar] [CrossRef]
- Huang, D.; Wang, X.; Xia, Z.; Ruan, L.; Lu, Q.; Wang, S. Experimental Study on the Effects of Fly Ash Content on the Properties of Synchronous Grouting Slurry in Shield Tunneling. Compr. Util. 2019, 8, 74–77. [Google Scholar] [CrossRef]
- Yang, Z.; He, Z.; Liu, Y.; Chen, P.; Li, D. Recycle Application of the Shield Waste Slurry in Backfill Grouting Material: A Case Study of a Slurry Shield Tunnelling in the River-crossing Fuzhou Metro. Mod. Tunn. Technol. 2019, 56, 192–199+205. [Google Scholar] [CrossRef]
- Wang, J.; Song, P.; Tang, J.; Wang, Y.; Ma, Y.; Wang, Q. Study on basic properties of the cementitious simultaneous grouting material in shield engineering. New Build. Mater. 2018, 45, 22–25. [Google Scholar] [CrossRef]
- Wang, S.; Lin, Z.; Peng, X.; Wang, X.; Tu, G.; Song, Z. Research and evaluation on Water-dispersion resistance of synchronous grouting slurry in shield tunnel. Tunn. Undergr. Space Technol. 2022, 129, 104679. [Google Scholar] [CrossRef]
- Duan, P.; Li, S.; Wang, P. Effect of Rice Husk Ash Content on Rheological and Mechanical Properties of Repaired Mortar and Its Mechanism Analysis. Mater. Rep. 2023, 37, 247–253. [Google Scholar]
- Liu, J.; Zhao, W.; Sun, B.; Jiang, T.; Wang, Q. Time-dependent Characteristics of Rheological Properties and Yield Stress Evolution of Grouting Materials. China Civ. Eng. J. 2024, 5, 1–15. [Google Scholar] [CrossRef]
- Zhang, C.; Yu, J.; Kong, X.; Cai, Y. Effect of Chemical Admixtures on Rheological Properties of Mortars. J. Chin. Ceram. Soc. 2020, 48, 622–631. [Google Scholar] [CrossRef]
- Gu, J. Quality Control for Shearing Day Powder Mortar Grouting in Shielding Construction. Constr. Technol. 2018, 2, 13–14+19. [Google Scholar] [CrossRef]
- Abramian, A.; Staron, L.; Lagree, P.-Y. The slumping of a cohesive granular column: Continuum and discrete modeling. J. Rheol. 2020, 64, 1227. [Google Scholar] [CrossRef]
- Liu, Y.; Balmforth, N.J.; Hormozi, S. Axisymmetric viscoplastic dambreaks and the slump test. J. Non-Newton. Fluid Mech. 2018, 258, 45–57. [Google Scholar] [CrossRef]
- Cui, W.; Meng, M.; Song, H. CFD Numerical Simulation of Movement and Static Segregation of Self-compacting Concrete Aggregate. J. Build. Mater. 2021, 24, 39–44. [Google Scholar] [CrossRef]
- Wang, G.; Qu, J.; Wang, B.; Jia, R.; Qu, T. Durability analysis and inspection of Portland cement materials. Guangdong Chem. Ind. 2021, 48, 231–232. [Google Scholar] [CrossRef]
- Shao, Y. Study on the Effect of Different Fe/Al Ratios of Iron Phase on the Sulfate Resistance of Portland Cement. Master’s Thesis, University of Jinan, Jinan, China, 2024. [Google Scholar] [CrossRef]
- Cheng, B.C.; Liu, R.; Li, X.H. Effects of fly and coal bottom ash ratio on backfill material performance. Constr. Build. Mater. 2022, 319, 125831. [Google Scholar] [CrossRef]
- Xue, Y. Study on the performance of fly ash geopolymers made from different grades of fly ash as raw materials. Eng. Constr. 2022, 36, 1147–1149. [Google Scholar] [CrossRef]
- Chen, W.; Zhang, Z.; Meng, E.; Li, Q. Impermeability and Crack Resistance of Bentonite and Basalt Fiber Modified Cement Mortar. Bull. Chin. Ceram. Soc. 2023, 42, 439–447. [Google Scholar] [CrossRef]
- Zhang, Z.; Pang, X. Application of Uniform Design Method in Determination of Silt Stiffness Parameters. Railw. Eng. 2022, 62, 126–130. [Google Scholar] [CrossRef]
- JC/T 986-2018; Cementitious Grout. China Building Materials Industry Press: Beijing, China, 2018.
- JT/T 946-2022; Grouting Material for Prestressed Structure in Highway Engineering. China Communication Press: Beijing, China, 2022.
- JGJ/T 283-2012; Echnical Specification for Application of Self-Compacting Concrete. China Architecture & Building Press: Beijing, China, 2012.
- Kashani, A.; Provis, J.L.; Qiao, G.G.; van Deventer, J.S.J. The interrelationship between surface chemistry and rheology in alkali activated slag paste. Constr. Build. Mater. 2014, 65, 583–591. [Google Scholar] [CrossRef]
- Li, Y.; Du, Q.; Zhang, M. Application of MATLAB Optimization Toolbox in Mechanical Design Optimization. Electron. Technol. Softw. Eng. 2019, 11, 58. [Google Scholar] [CrossRef]
- Wang, S.; Zhu, H.; Wang, B.; Kou, L. Review of the Packing Theory for Optimization Design of Concrete Mix Proportion. Mater. Rep. 2021, 35, 3085–3091. [Google Scholar] [CrossRef]
- Wang, X. Analysis of Energy in RO/PRO Water Desalination Using Constrained Nonlinear Optimization. Master’s Thesis, China University of Petroleum, Qingdao, China, 2019. [Google Scholar] [CrossRef]
- Pang, M.; Ma, H.; Jiang, S.; Li, J. Integrating Frontier Research Achievements into the Innovative Experimental Program Teaching of Undergraduates. Shanxi Datong Univ. J. 2024, 40, 1–6. [Google Scholar]
- Zhang, K.; Pan, L.; LI, J.; Lin, C.; Cao, Y.; Xu, N.; Pang, S. How does adsorption behavior of polycarboxylate superplasticizer effect rheology and flowability of cement paste with polypropylene fiber. Cem. Concr. Compos. 2019, 95, 228. [Google Scholar] [CrossRef]
- Liu, F. Research on Prediction Performance of Self-Compacting Concrete Based on Uitra-Fine Mortar of Work. Master’s Thesis, Wuhan University of Science and Technology, Wuhan, China, 2021. [Google Scholar] [CrossRef]
- Kandemir, G. Effects of Antiwashout Admixtures on Fresh Concrete Properties. Aci Mater. J. 2015, 92, 164–171. [Google Scholar] [CrossRef] [PubMed]
- Cai, Y.; Liu, Q. Research progress on the stability of concrete mixtures and its influence on the durability of engineering structures. J. Xi’an Univ. Archit. Technol. (Nat. Sci. Ed.) 2023, 55, 492–503. [Google Scholar] [CrossRef]
- Q/ZTJHN1-2019; Gelatin Type Dry-Mixed Mortar for Shield-Driving Grouting. China Railway Construction South China Construction Co., Ltd.: Guangzhou, China, 2019.
- Xu, G. Study on Effect of Water-Cement Ratio and Mineral Admixtures, Rubber Powder Addition on Mortar Rheology Performance. Master’s Thesis, Henan University, Kaifeng, China, 2008. [Google Scholar] [CrossRef]
- Zhou, M.; Zhang, W. Effect of additives on perforance of dry-mixed mortar. Comcrete 2007, 6, 71–73. [Google Scholar] [CrossRef]
- Yang, Q.; Jiang, C. Effect of Polymer on Performance of Cement Based Building Sealing Mortar. J. Tongji Univ. (Nat. Sci.) 2016, 44, 107–112. [Google Scholar] [CrossRef]
- Hong, L. The Research on the Mechanisms and Applications of the Redispersible Emulsion Powder Used in the Dry—mixed Mortar. Fujian Archit. Constr. 2013, 24–25, 63. [Google Scholar]
- Chen, Y.; Zhu, Q.; Liu, N.; Yu, J. Preparation and properties of an underwater dispersion resistant repair mortar modified by EVA. New Build. Mater. 2018, 45, 118–121. [Google Scholar] [CrossRef]
- Li, D. Effect of functional materials on the properties of polymer modified waterproof mortar. New Build. Mater. 2023, 50, 107–109+127. [Google Scholar] [CrossRef]
- Zhang, C. Study on Preparation and Properties of Modified Repair Materials for Anticorrosive Formwork—Concrete Interface. Master’s Thesis, Anhui Jianzhu University, Hefei, China, 2023. [Google Scholar] [CrossRef]
- Yang, H.; Wu, W.; Ye, X.; Gui, H.; Zhou, Z. Research on performance of high flowability and ultra-high early strength polymer repairing mortar. New Build. Mater. 2020, 47, 42–45. [Google Scholar] [CrossRef]
- Qi, L.; Li, X.; Jiang, S. Influence of parameters of mix proportion on the properties of high strength repair mortar. Low Temp. Archit. Technol. 2018, 40, 9–10+26. [Google Scholar] [CrossRef]
- Wang, X. Effect of redispersible latex powder on the performance of low-temperature cementing cement slurry. Drill. Fluid Complet. Fluid 2015, 32, 65–67+71+107–108. [Google Scholar] [CrossRef]
- Tan, Z.; Bernal, S.A.; Provis, J.L. Reproducible mini-slump test procedure for measuring the yield stress of cementitious pastes. Mater. Struct. 2017, 50, 235. [Google Scholar] [CrossRef]
- Dai, X.; Aydin, S.; Yardimic, M.Y.; Lesage, K.; de Schutter, G. Influence of water to binder ratio on the rheology and structural Build-up of Alkali-Activated Slag/Fly ash mixtures. Constr. Build. Mater. 2020, 264, 120253. [Google Scholar] [CrossRef]
- Rifaai, Y.; Yahia, A.; Mostafa, A.; Aggoun, S.; Kadri, E.H. Rheology of fly ash-based geopolymer: Effect of NaOH concentration. Constr. Build. Mater. 2019, 223, 583–594. [Google Scholar] [CrossRef]
- Palacios, M.; Alonso, M.M.; Varga, C.; Puertas, F. Influence of the alkaline solution and temperature on the rheology and reactivity of alkali-activated fly ash pastes. Cem. Concr. Compos. 2019, 95, 277–284. [Google Scholar] [CrossRef]
- Liu, P. Study on the Influence of Solid Properties on the Fluidity of Coal mine Filling Slurry. Ph.D. Thesis, China Coal Research Institute, Beijing, China, 2021. [Google Scholar] [CrossRef]
- Liu, Y.; Chen, J.; Li, N.; Meng, J.; Lv, X.; Zhou, S.; Ma, Q.; Wang, C. Formation and viscosity characteristics of cyclopentane hydrate slurry with wax and surfactant. Low-Carbon Chem. Chem. Eng. 2024, 49, 113–123. [Google Scholar] [CrossRef]
- Zhou, C.; Qin, X.; Xu, C. Experimental Study on the Influencing Factors of Working Performance of Gangue-based Slurry. J. Munic. Technol. 2023, 41, 202–206+212. [Google Scholar] [CrossRef]
- Beris, A.N.; Tsamopoulos, J.A.; Armstrong, R.C.; Brown, R.A. Creeping motion of a sphere through a Bingham plastic. J. Fluid Mech. 1985, 158, 219–244. [Google Scholar] [CrossRef]
- Dhonde, H.B. Fresh and Hardened Properties of Self-Consolidating Fiber-Reinforced Concrete. ACI Mater. J. 2007, 104, 491–500. [Google Scholar] [CrossRef]
Figure 1.
Influence of water reducer dosage on (a) fluidity, (b) segregation rate, and (c) bleeding rate of synchronous grouting slurry in shield tunnels.
Figure 1.
Influence of water reducer dosage on (a) fluidity, (b) segregation rate, and (c) bleeding rate of synchronous grouting slurry in shield tunnels.
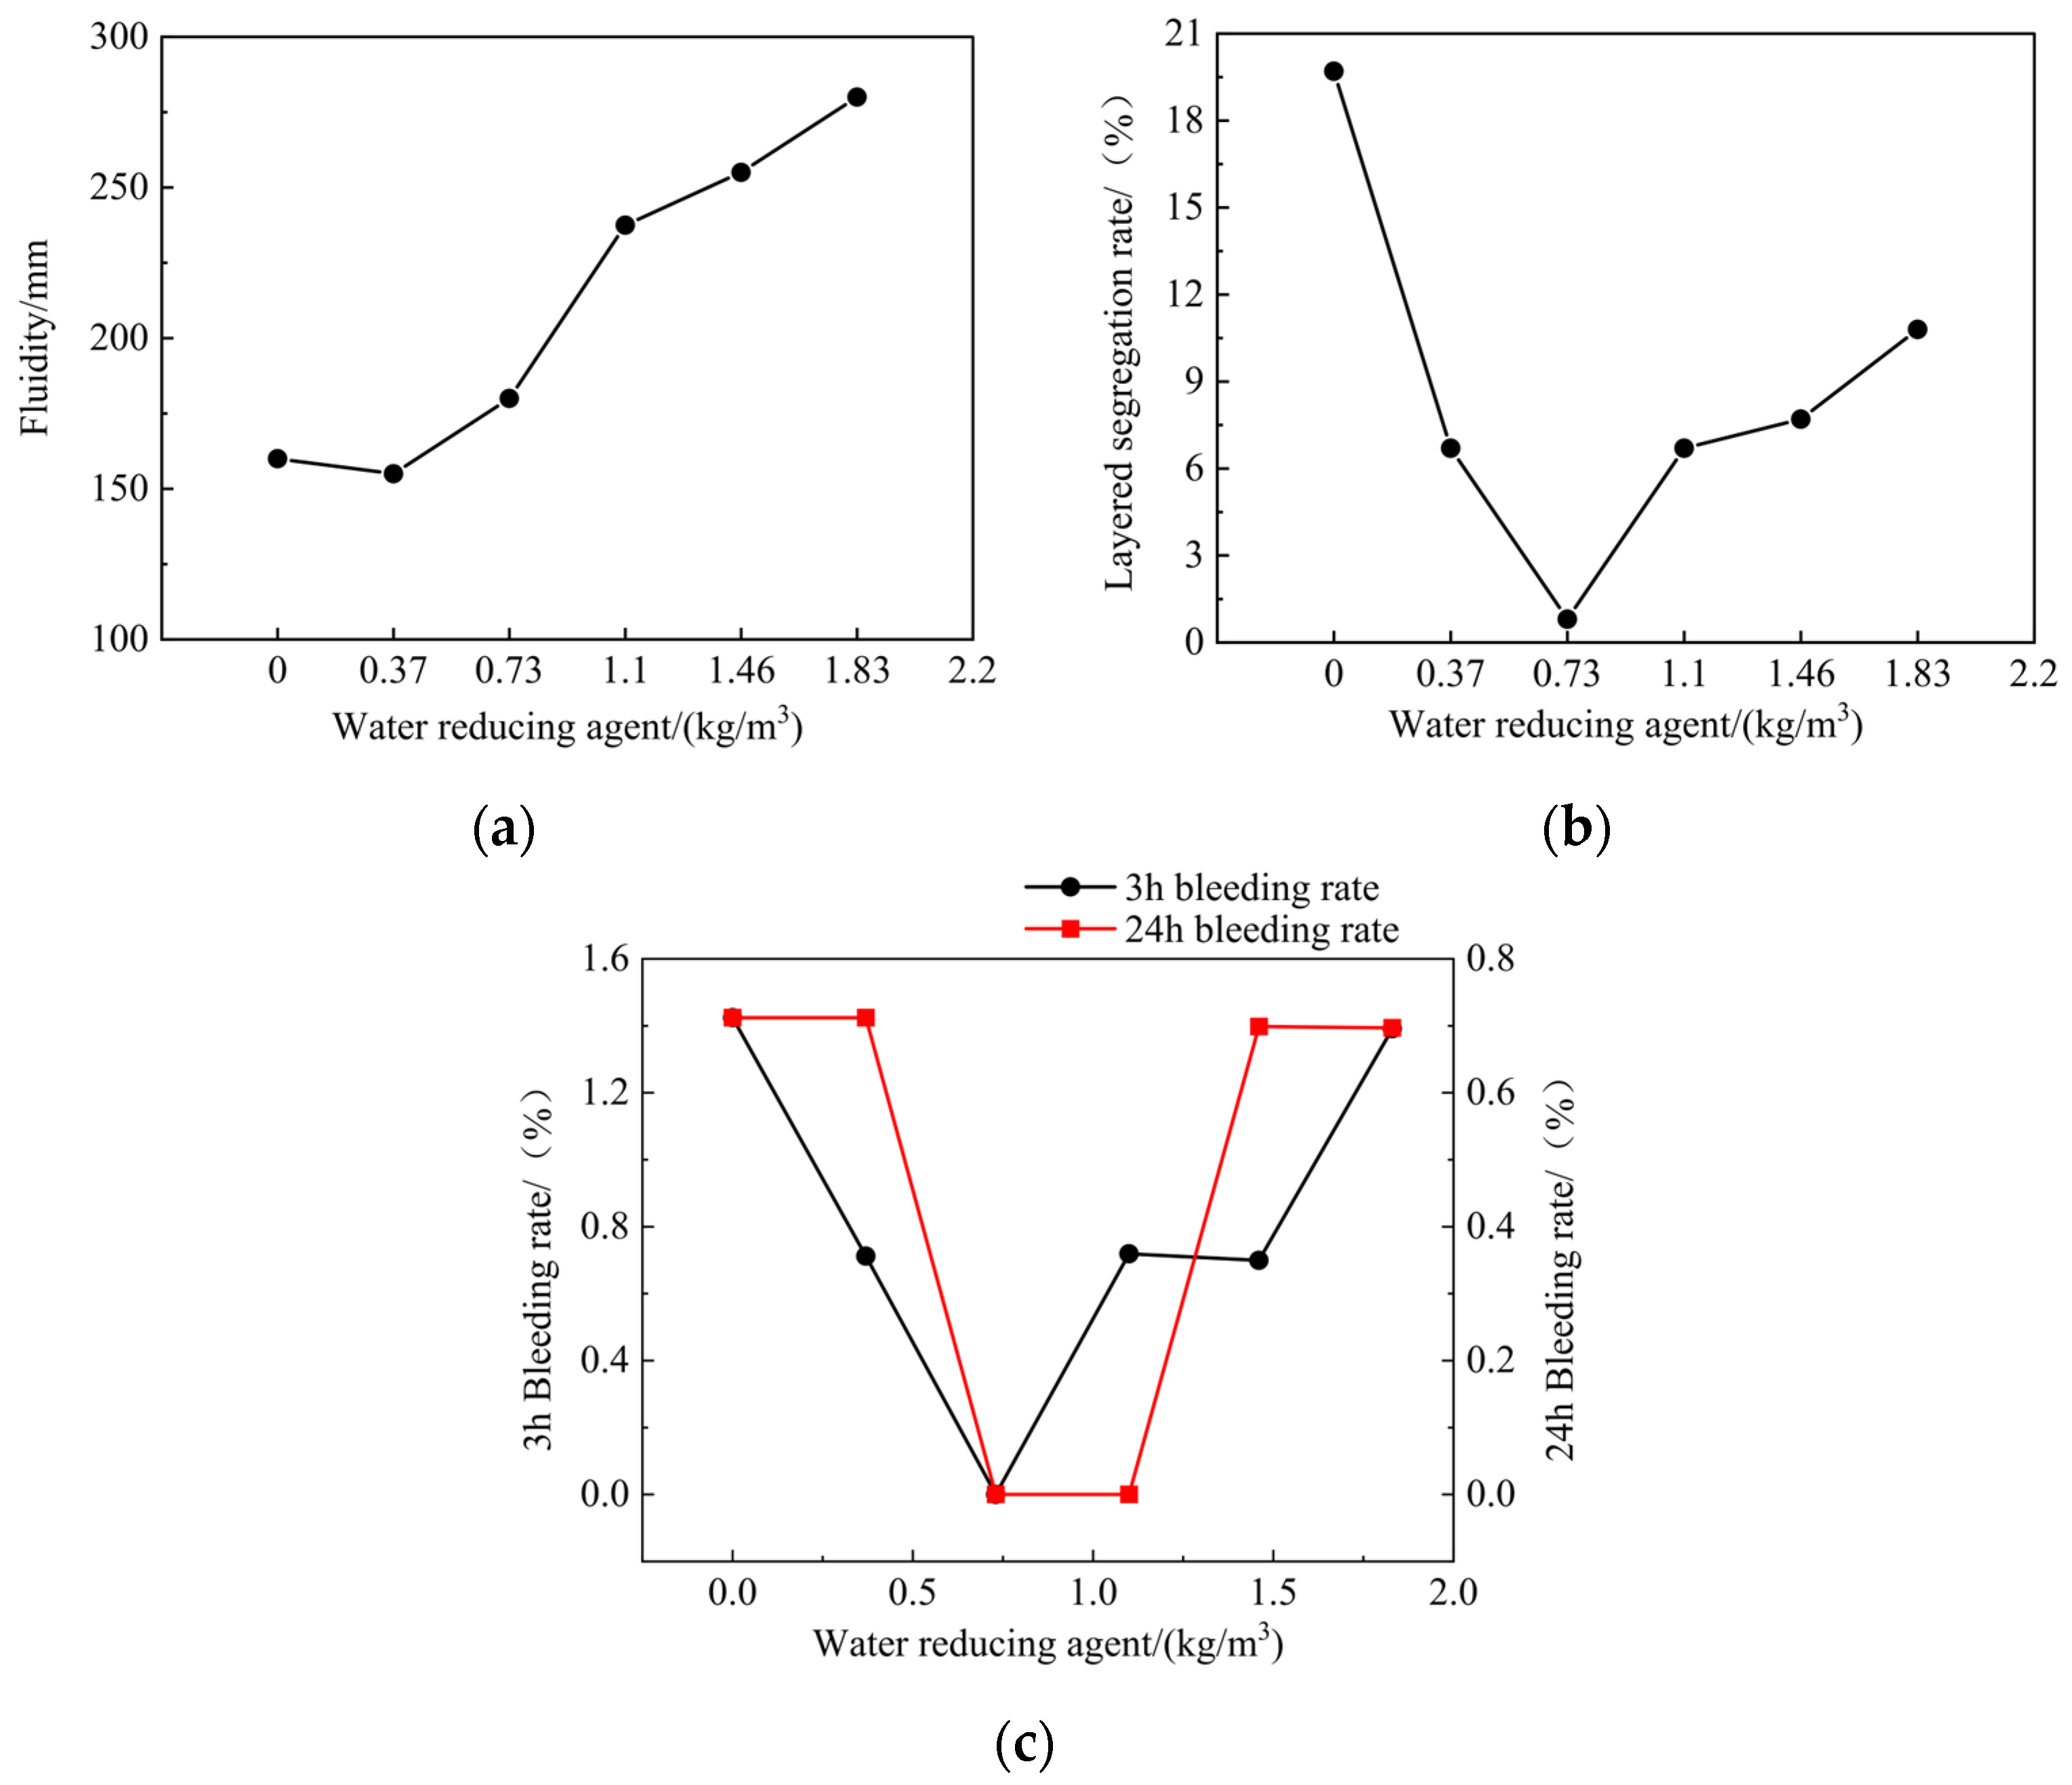
Figure 2.
Influence of latex powder dosage on (a) fluidity, (b) segregation rate, and (c) bleeding rate of synchronous grouting slurry in shield tunnels.
Figure 2.
Influence of latex powder dosage on (a) fluidity, (b) segregation rate, and (c) bleeding rate of synchronous grouting slurry in shield tunnels.
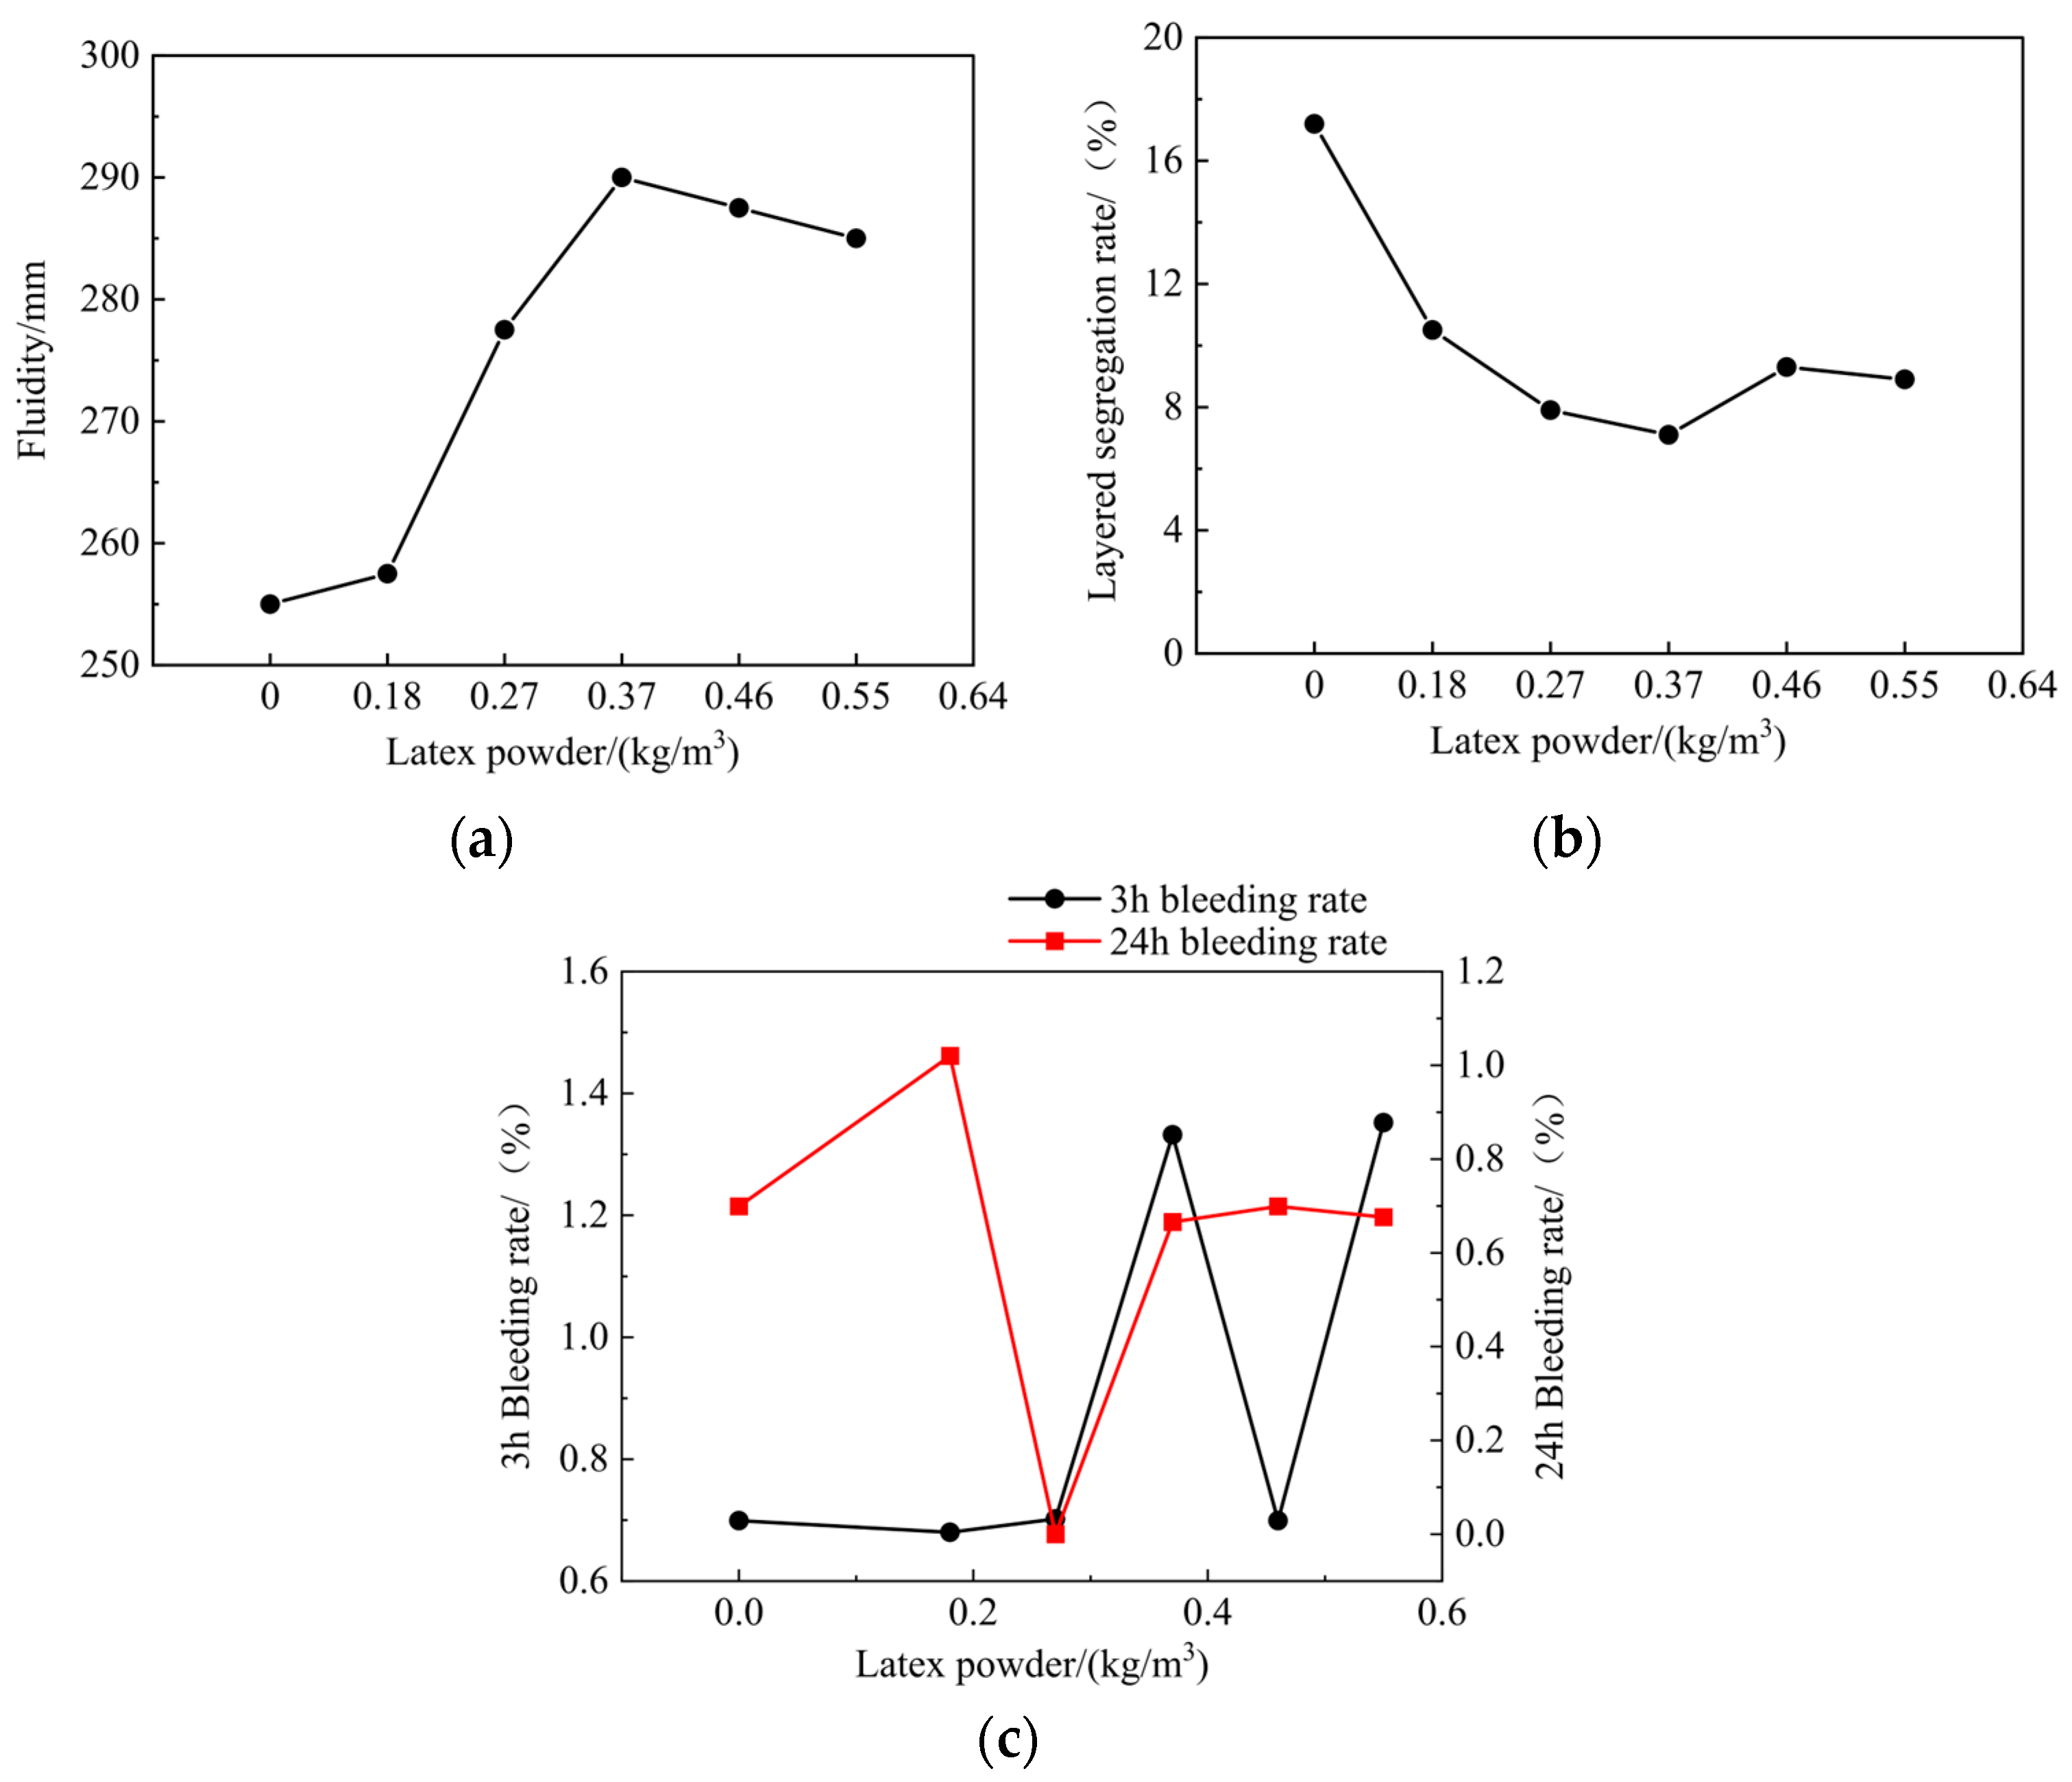
Figure 3.
The 16th experimental group: (a) τ-γ curve, (b) η-γ curve, and (c) τ-γ fitting curve.
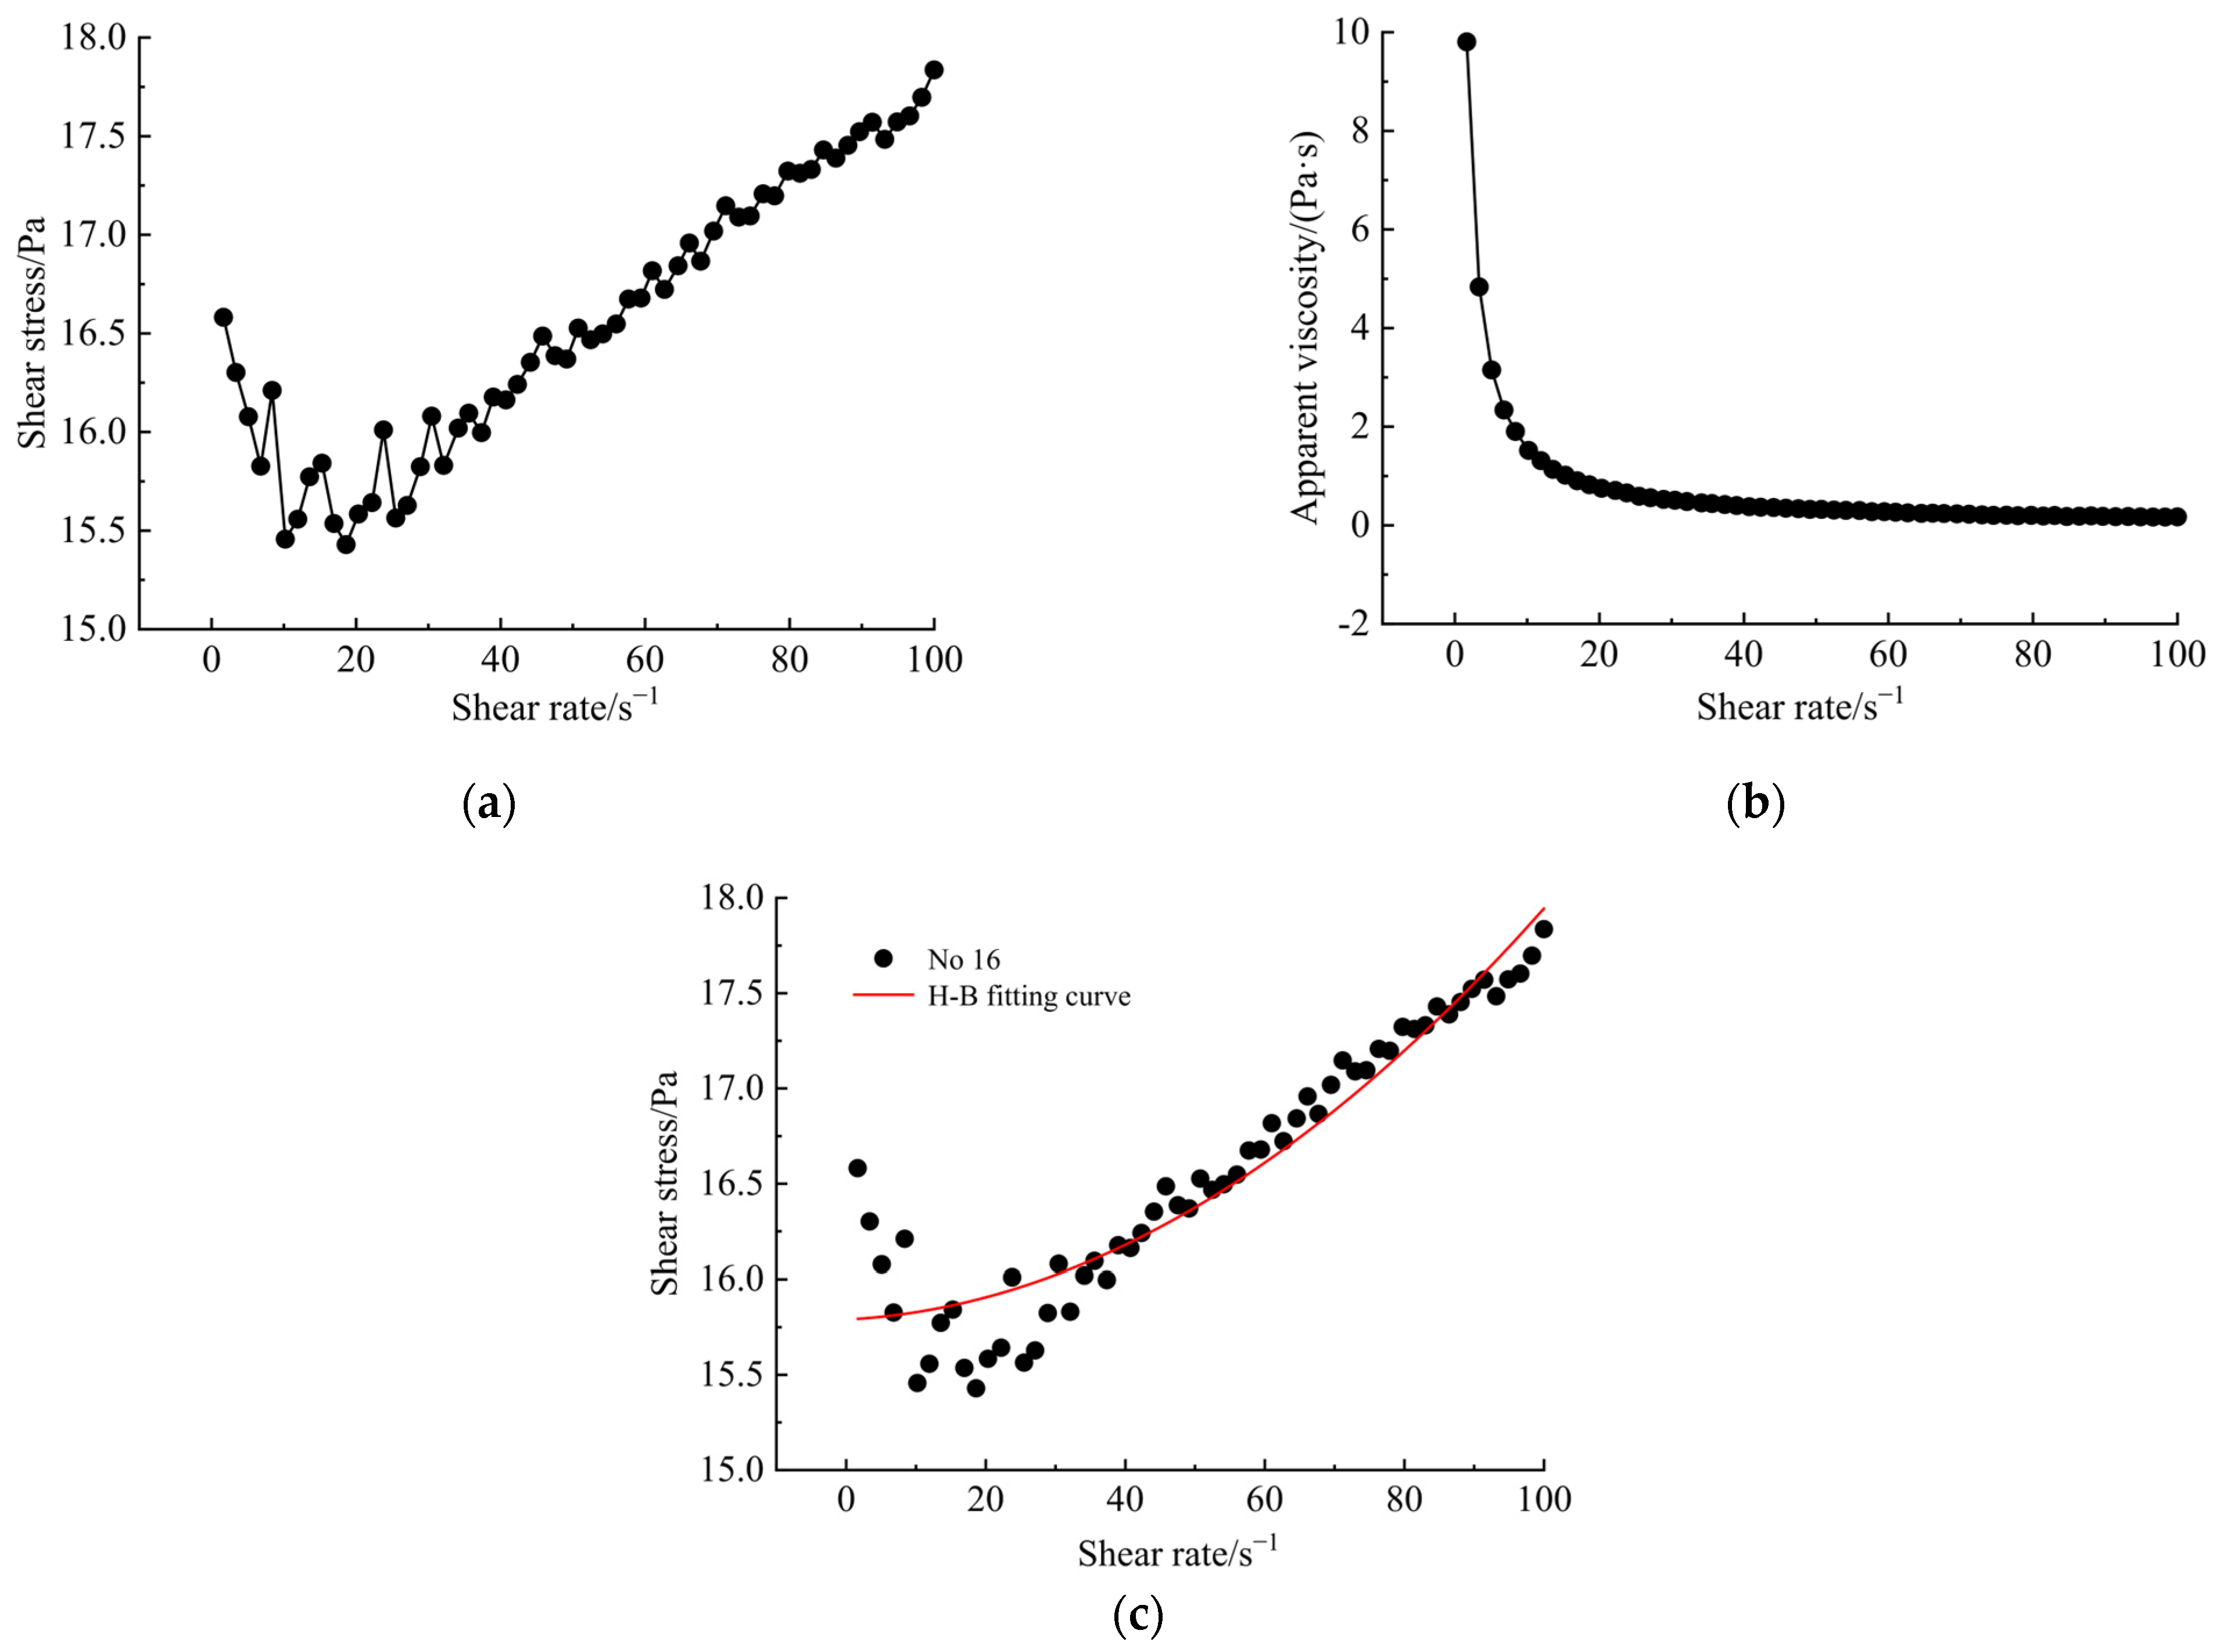
Figure 4.
A 3D scatter plot of yield shear stress, viscosity coefficient, and bleeding rate.
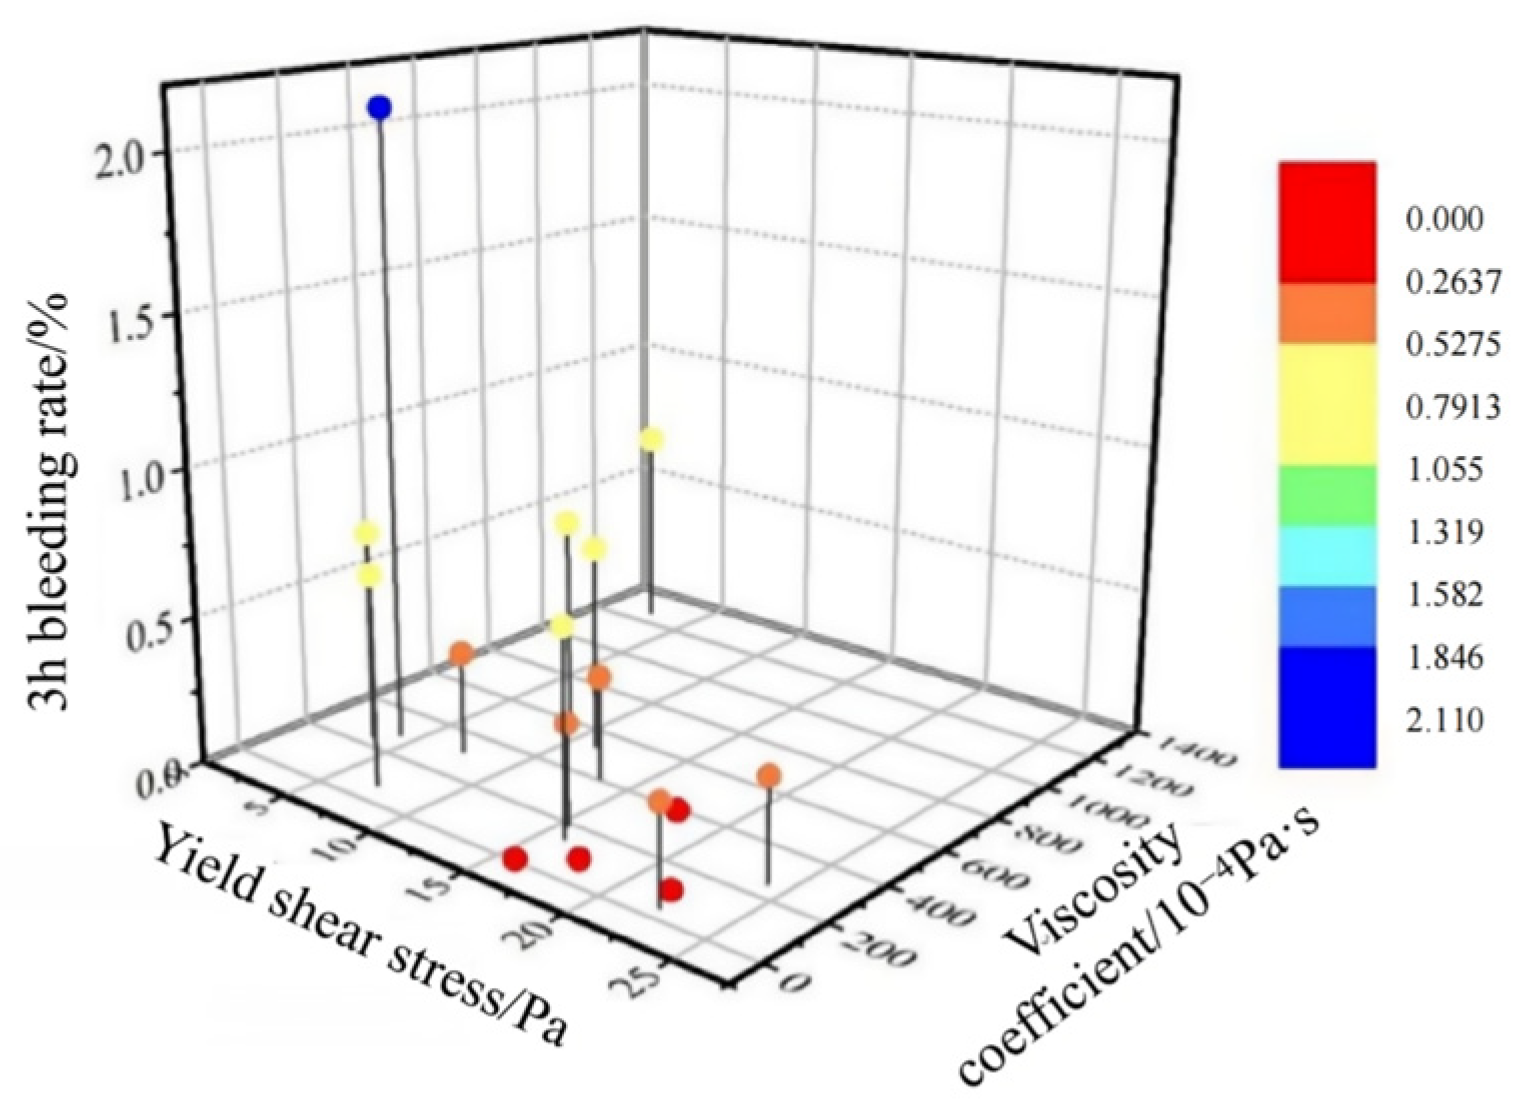
Figure 5.
A 3D scatter plot of yield shear stress, viscosity coefficient, and segregation rate.


Table 1.
Chemical composition of cementitious material.
| Title | SiO2 | Al2O3 | CaO | MgO | SO3 | Fe2O3 | Na2O | K2O | Loss |
|---|---|---|---|---|---|---|---|---|---|
| [%] | [%] | [%] | [%] | [%] | [%] | [%] | [%] | [%] | |
| Cement | 21.44 | 5.85 | 61.28 | 1.25 | 2.01 | 2.75 | — | — | 5.42 |
| Fly ash | 58.12 | 27.93 | 2.72 | 0.64 | 0.83 | 4.85 | 0.13 | 1.31 | 3.47 |
| Bentonite | 72.15 | 13.42 | 2.69 | 2.36 | — | 1.59 | 0.55 | 0.36 | 6.88 |
Table 2.
The test mix proportion for single admixtures.
| No. Test | Cement | Fly Ash | Sand | Bentonite | Water Reducing Agent |
|---|---|---|---|---|---|
| [kg/m3] | [kg/m3] | [kg/m3] | [kg/m3] | [kg/m3] | |
| A1 | 95 | 270 | 570 | 65 | 0.00 |
| A2 | 95 | 270 | 570 | 65 | 0.37 |
| A3 | 95 | 270 | 570 | 65 | 0.73 |
| A4 | 95 | 270 | 570 | 65 | 1.10 |
| A5 | 95 | 270 | 570 | 65 | 1.46 |
| A6 | 95 | 270 | 570 | 65 | 1.83 |
Table 3.
The test mix proportion for compound admixtures.
| No. Test | Cement | Fly Ash | Sand | Bentonite | Water Reducing Agent | Latex Powder |
|---|---|---|---|---|---|---|
| [kg/m3] | [kg/m3] | [kg/m3] | [kg/m3] | [kg/m3] | [kg/m3] | |
| B1 | 95 | 270 | 570 | 65 | 1.46 | 0.00 |
| B2 | 95 | 270 | 570 | 65 | 1.46 | 0.18 |
| B3 | 95 | 270 | 570 | 65 | 1.46 | 0.27 |
| B4 | 95 | 270 | 570 | 65 | 1.46 | 0.37 |
| B5 | 95 | 270 | 570 | 65 | 1.46 | 0.46 |
| B6 | 95 | 270 | 570 | 65 | 1.46 | 0.55 |
Table 4.
Uniform experimental design mix proportion for synchronous grouting slurry in shield tunnels.
Table 4.
Uniform experimental design mix proportion for synchronous grouting slurry in shield tunnels.
| No. Test | Ratio of Water to Cementitious Material Content | Ratio of Bentonite to Water Content | Ratio of Cementitious Material to Sand Content | Ratio of Water Reducer to Cementitious Material Content | Ratio of Latex Powder to Cementitious Material Content |
|---|---|---|---|---|---|
| [%] | [%] | [%] | [%] | [%] | |
| 1 | 88 | 20 | 64 | 0.30 | 0.100 |
| 2 | 73 | 20 | 69 | 0.20 | 0.075 |
| 3 | 73 | 25 | 64 | 0.10 | 0.125 |
| 4 | 73 | 30 | 74 | 0.30 | 0.050 |
| 5 | 88 | 35 | 74 | 0.10 | 0.075 |
| 6 | 78 | 35 | 64 | 0.20 | 0.050 |
| 7 | 73 | 35 | 69 | 0.40 | 0.100 |
| 8 | 88 | 25 | 79 | 0.40 | 0.050 |
| 9 | 83 | 25 | 74 | 0.20 | 0.100 |
| 10 | 83 | 30 | 64 | 0.40 | 0.075 |
| 11 | 78 | 25 | 69 | 0.30 | 0.075 |
| 12 | 78 | 30 | 79 | 0.10 | 0.100 |
| 13 | 78 | 20 | 74 | 0.40 | 0.125 |
| 14 | 83 | 20 | 69 | 0.10 | 0.050 |
| 15 | 83 | 35 | 79 | 0.30 | 0.125 |
| 16 | 88 | 30 | 69 | 0.20 | 0.125 |
Table 5.
Test results of truncated cone fluidity for synchronous grouting slurry in shield tunnels.
| No. Test | Diffusion Diameter | Vertical Diffusion Diameter | Fluidity |
|---|---|---|---|
| [mm] | [mm] | [mm] | |
| 1 | 230 | 235 | 232.5 |
| 2 | 100 | 100 | 100.0 |
| 3 | 95 | 95 | 95.0 |
| 4 | 170 | 170 | 170.0 |
| 5 | 95 | 95 | 95.0 |
| 6 | 90 | 90 | 90.0 |
| 7 | 95 | 100 | 97.5 |
| 8 | 255 | 260 | 257.5 |
| 9 | 235 | 235 | 235 |
| 10 | 105 | 110 | 107.5 |
| 11 | 110 | 120 | 115.0 |
| 12 | 105 | 110 | 107.5 |
| 13 | 190 | 195 | 192.5 |
| 14 | 165 | 165 | 165.0 |
| 15 | 100 | 100 | 100.0 |
| 16 | 115 | 115 | 115.0 |
Table 6.
Test results of anti-segregation jumping table for synchronous grouting slurry in shield tunnels.
Table 6.
Test results of anti-segregation jumping table for synchronous grouting slurry in shield tunnels.
| No. Test | Dry Weight of Upper Aggregate | Dry Weight of Middle Aggregate | Dry Weight of Lower Aggregate | Layered Segregation Rate |
|---|---|---|---|---|
| [g] | [g] | [g] | [%] | |
| 1 | 840.6 | 850.4 | 886.3 | 1.1 |
| 2 | 848.7 | 912.6 | 920.7 | 7.1 |
| 3 | 834.0 | 945.6 | 941.7 | 12.3 |
| 4 | 786.3 | 853.7 | 854.4 | 8.1 |
| 5 | 763.4 | 769.1 | 779.9 | 0.7 |
| 6 | 849.1 | 901.0 | 893.4 | 5.9 |
| 7 | 853.4 | 868.0 | 879.9 | 1.7 |
| 8 | 730.5 | 749.6 | 749.5 | 2.6 |
| 9 | 804.2 | 811.9 | 819.2 | 0.9 |
| 10 | 884.0 | 886.6 | 875.4 | 0.3 |
| 11 | 865.1 | 861.4 | 888.1 | −0.4 |
| 12 | 799.6 | 798.6 | 802.9 | −0.1 |
| 13 | 815.1 | 822.4 | 845.9 | 0.9 |
| 14 | 864.3 | 848.0 | 858.1 | −1.9 |
| 15 | 702.7 | 807.5 | 759.7 | 13.9 |
| 16 | 817.5 | 813.0 | 795.3 | −0.6 |
Table 7.
Test results of free bleeding rate for synchronous grouting slurry in shield tunnels.
| No. Test | Initial Pulp Surface | 3 h Bleeding Surface | 3 h Expansion Surface | 24 h Bleeding Surface | 24 h Expansion Surface | 3 h Bleeding Rate | 24 h Bleeding Rate |
|---|---|---|---|---|---|---|---|
| [mm] | [mm] | [mm] | [mm] | [mm] | [%] | [%] | |
| 1 | 284 | 286 | 282 | 286 | 276 | 280 | 278 |
| 2 | 282 | 296 | 284 | 296 | 282 | 294 | 282 |
| 3 | 296 | 298 | 298 | 298 | 296 | 298 | 296 |
| 4 | 284 | 292 | 284 | 292 | 284 | 292 | 284 |
| 5 | 290 | 292 | 288 | 294 | 286 | 292 | 288 |
| 6 | 280 | 280 | 280 | 280 | 280 | 280 | 280 |
| 7 | 294 | 332 | 294 | 332 | 292 | 332 | 294 |
| 8 | 276 | 282 | 276 | 280 | 274 | 278 | 276 |
| 9 | 280 | 290 | 280 | 290 | 280 | 288 | 280 |
| 10 | 288 | 304 | 290 | 304 | 288 | 304 | 288 |
| 11 | 282 | 296 | 282 | 296 | 280 | 294 | 280 |
| 12 | 296 | 300 | 296 | 300 | 296 | 300 | 296 |
| 13 | 284 | 290 | 286 | 292 | 284 | 290 | 284 |
| 14 | 282 | 282 | 282 | 282 | 280 | 280 | 280 |
| 15 | 292 | 302 | 292 | 302 | 292 | 300 | 292 |
| 16 | 286 | 302 | 286 | 302 | 286 | 302 | 286 |
Table 8.
Fitting results of different rheological models.
| No. Test | Bingham | M–B | H–B | ||||||||
|---|---|---|---|---|---|---|---|---|---|---|---|
| τ0 | η0 | R2 | τ0 | η0 | c | R2 | τ0 | K | n | R2 | |
| [Pa] | [×10−4 Pa·s] | [Pa] | [×10−4 Pa·s] | [×10−5] | [Pa] | [×10−4 Pa·s] | |||||
| 1 | 4.18 | 155.30 | 0.97163 | 4.11 | 197.40 | −4.14 | 0.97589 | 4.11 | 287.10 | 0.87 | 0.97331 |
| 2 | 8.20 | 388.50 | 0.97377 | 8.07 | 464.40 | −7.36 | 0.97557 | 8.10 | 622.40 | 0.90 | 0.97450 |
| 3 | 15.07 | 475.40 | 0.96384 | 15.21 | 394.00 | 8.00 | 0.96508 | 15.32 | 190.50 | 1.19 | 0.96751 |
| 4 | 17.58 | 530.30 | 0.98770 | 17.61 | 510.90 | 1.91 | 0.98757 | 17.67 | 393.30 | 1.06 | 0.98812 |
| 5 | 15.81 | 337.60 | 0.95364 | 15.91 | 281.50 | 5.52 | 0.95457 | 16.00 | 139.10 | 1.19 | 0.95679 |
| 6 | 21.16 | 604.20 | 0.92924 | 21.56 | 368.70 | 23.16 | 0.93740 | 21.71 | 110.00 | 1.36 | 0.94267 |
| 7 | 23.50 | 838.10 | 0.97218 | 23.86 | 628.60 | 20.60 | 0.97574 | 24.08 | 257.00 | 1.25 | 0.97767 |
| 8 | 3.31 | 210.30 | 0.96393 | 3.28 | 230.60 | −2.00 | 0.96388 | 3.41 | 239.80 | 0.93 | 0.96366 |
| 9 | 8.29 | 204.30 | 0.98397 | 8.26 | 221.10 | −1.66 | 0.98413 | 7.34 | 315.40 | 0.98 | 0.98382 |
| 10 | 13.25 | 553.10 | 0.98300 | 13.27 | 542.60 | 1.03 | 0.98272 | 13.36 | 408.80 | 1.06 | 0.98318 |
| 11 | 11.18 | 442.70 | 0.98103 | 11.08 | 504.20 | −6.05 | 0.98195 | 11.13 | 530.10 | 0.95 | 0.98094 |
| 12 | 18.28 | 258.20 | 0.97408 | 18.41 | 182.10 | 7.48 | 0.97926 | 17.54 | 92.40 | 1.28 | 0.98196 |
| 13 | 3.02 | 229.30 | 0.97944 | 2.84 | 334.40 | −10.34 | 0.99281 | 2.59 | 1264.80 | 0.66 | 0.99424 |
| 14 | 6.97 | 188.60 | 0.97535 | 7.04 | 145.50 | 4.24 | 0.97831 | 7.09 | 67.10 | 1.22 | 0.98006 |
| 15 | 21.96 | 347.80 | 0.88915 | 22.29 | 157.20 | 18.75 | 0.90503 | 22.34 | 38.70 | 1.47 | 0.91153 |
| 16 | 15.45 | 218.70 | 0.85224 | 15.79 | 18.70 | 19.67 | 0.89730 | 15.76 | 7.47 | 1.73 | 0.90098 |
Table 9.
Optimal mix ratio.
| Ratio of Water to Cementitious Material Content | Ratio of Bentonite to Water Content | Ratio of Cementitious Material to Sand Content | Ratio of Water Reducer to Cementitious Material Content | Ratio of Latex Powder to Cementitious Material Content |
|---|---|---|---|---|
| [%] | [%] | [%] | [%] | [%] |
| 75 | 18 | 63 | 0.30 | 0.05 |
Table 10.
Mixture ratio of high-performance grouting slurry behind shield tunnel wall.
| Cement | FLY ASH | Sand | Bentonite | Water | Water Reducing Agent | Latex Powder |
|---|---|---|---|---|---|---|
| [kg/m3] | [kg/m3] | [kg/m3] | [kg/m3] | [kg/m3] | [kg/m3] | [kg/m3] |
| 143.490 | 407.510 | 874.610 | 74.390 | 413.250 | 1.653 | 0.276 |
Table 11.
Verification of test results.
| Fluidity | 3 h Bleeding Rate | 24 h Bleeding Rate | Segregation Rate | Setting Time | 28 d Strength |
|---|---|---|---|---|---|
| [mm] | [%] | [%] | [%] | [h] | [MPa] |
| 257.50 | 0.71 | 0.36 | 3.1 | 6.70 | 2.61 |
Disclaimer/Publisher’s Note: The statements, opinions and data contained in all publications are solely those of the individual author(s) and contributor(s) and not of MDPI and/or the editor(s). MDPI and/or the editor(s) disclaim responsibility for any injury to people or property resulting from any ideas, methods, instructions or products referred to in the content. |
© 2024 by the authors. Licensee MDPI, Basel, Switzerland. This article is an open access article distributed under the terms and conditions of the Creative Commons Attribution (CC BY) license (https://creativecommons.org/licenses/by/4.0/).
Share and Cite
MDPI and ACS Style
Zhou, H.; Zhang, Y.; Zhu, W.; Zhong, Q.; Huang, X. Optimisation of Synchronous Grouting Mix Ratio for Shield Tunnels. Appl. Sci. 2024, 14, 4098. https://doi.org/10.3390/app14104098
AMA Style
Zhou H, Zhang Y, Zhu W, Zhong Q, Huang X. Optimisation of Synchronous Grouting Mix Ratio for Shield Tunnels. Applied Sciences. 2024; 14(10):4098. https://doi.org/10.3390/app14104098
Chicago/Turabian StyleZhou, Hongmei, Yixiang Zhang, Wanxu Zhu, Qingyu Zhong, and Xinyu Huang. 2024. "Optimisation of Synchronous Grouting Mix Ratio for Shield Tunnels" Applied Sciences 14, no. 10: 4098. https://doi.org/10.3390/app14104098
Note that from the first issue of 2016, this journal uses article numbers instead of page numbers. See further details here.