
Research on Seismic Performance of a Two-Story, Two-Span Underground Subway Station with Split Columns Based on the Quasi-Static Method
1
State Key Laboratory of Performance Monitoring and Protecting of Rail Transit Infrastructure, East China Jiaotong University, Nanchang 330013, China
2
Civil and Environmental Engineering Department, Technical University of Catalonia, 08034 Barcelona, Spain
3
College of Resources, Environment and Architectural Engineering, Chifeng University, Chifeng 024000, China
*
Author to whom correspondence should be addressed.
Appl. Sci. 2024, 14(10), 4077; https://doi.org/10.3390/app14104077
Submission received: 18 December 2023
/
Revised: 29 April 2024
/
Accepted: 1 May 2024
/
Published: 10 May 2024
(This article belongs to the Special Issue Seismic Analysis and Design of Ocean and Underground Structures)
Abstract
:The behavior of center columns in shallow-buried underground subway station structures resembles that of high-rise buildings. In both cases, these columns experience significant vertical loads during earthquake events and are susceptible to brittle failure due to inadequate deformation capacity. In this study, the design concept of split columns, commonly employed in high-rise structures, is adapted for application in a two-story, two-span subway station. Initially, a comparative analysis was conducted using quasi-static pushover analysis to assess the horizontal deformation characteristics of traditional and split columns under high axial loads. Subsequently, a comprehensive quasi-static pushover analysis model encompassing the soil–structure interaction was formulated. This model was employed to investigate differences in seismic performance between traditional and innovative underground structures, considering internal forces, deformation capacity, and plastic damage of crucial elements. The analysis results demonstrate that the incorporation of split columns in a two-story, two-span subway station enhances the overall seismic performance of the structure. This enhancement arises from the fact that split columns mitigate excessive shear forces while effectively utilizing their vertical support and horizontal deformation capacities.
1. Introduction
In the field of urban transportation, the integration of a high-capacity rapid public transportation system, centered around subway projects, assumes a pivotal role in the establishment of a contemporary and all-encompassing transportation network. Benefiting from the policy support, the urban rail transit sector in China is experiencing a rapid and comprehensive expansion, evidenced by substantial growth in both the length and quantity of operational routes. By the end of 2022, a total of 308 operational urban rail transit lines had been inaugurated across 55 cities in China, reflecting an annual rise of 8.8%. Impressively, the cumulative length of these operational lines had expanded to reach 10,287.45 km, marking a noteworthy year-on-year increase of 11.7%. This substantial mileage places China at the forefront globally in terms of total operational urban rail transit network length.
In 2016, China issued and implemented Seismic Ground Motion Parameters Zonation Map of China (GB18306-2015) [1], which completely eliminated the non-seismic zones. Most cities with a subway under construction in China are currently located in strong seismic activity zones, which means that underground structures in service, under construction, or proposed face seismic threats at any time. The historical records of seismic damage to structures demonstrate a noteworthy resemblance between underground constructions and surface buildings. When subjected to the effects of strong seismic events, underground structures are susceptible to varying degrees of damage and disruption [2]. For example, the Great Hanshin earthquake in 1995 caused the complete destruction of more than 30 columns in the Daikai subway station in Kobe City, resulting in the collapse of and damage to the overall structure [3]. In addition, the Wenchuan earthquake and the Chi-Chi earthquake caused damage to numerous urban underground structures and mountain tunnels [4,5]. In response to the complete collapse of the Daikai subway station in the Great Hanshin earthquake, scholars around the world have carried out research work from theoretical analysis, model tests, and numerical simulations [6,7,8,9,10]. Regarding the seismic damage mechanism of the Daikai station, many scholars believe that the overburden on the underground structure tends to lose its structural stability under the action of ground shaking, especially the inertial force of the vertical component effects of earthquakes. The incongruous deformation capacity of the sidewalls and center columns caused by the change in force distribution results in damage to the structure [11,12].
In order to protect underground structures from earthquake damage, the traditional seismic design generally aims to strengthen the structure itself. For example, in the structural design of the Daikai station, the safety factor of the center column is about 3. In addition, the seismic control techniques for underground structures can be divided into two main categories: one is used to install seismic damping materials around the structure; the other is used to install appurtenant devices to protect key components. Gao et al. [13] analyzed the effect of damping materials on the dynamic response of tunnels, and concluded that the smaller the ratio of elastic modulus between the damping layer and the surrounding rock, the more obvious the seismic damping effect. Zhao et al. [14] and Chen et al. [15] proposed a seismic isolation layer for underground structures and carried out theoretical analyses and experimental studies. Starting from the Daikai station, Ma et al. [16] and Xu et al. [17] studied the seismic damping effect of friction bearings at the top of the center column. Chen et al. [18,19] discussed the damping effect of the shear plate damper and lead-core rubber bearing installed on the center columns in subway stations and found that they could effectively reduce the structural internal forces. Du et al. [20] and Chen et al. [21] also proposed the use of a swaying column to mitigate the possible damage to underground structures. In addition, Yue et al. [22] and Ma et al. [23] strengthened the center column with carbon fiber and verified its effect by numerical simulation and experimental studies. Bu et al. [24,25] evaluated the seismic performances of underground structures with either a transverse traditional rigid layout or sliding interior columns via numerical analysis.
Similarly, the center columns in high-rise buildings generally need to bear large axial pressure. Such reinforced concrete columns have a relatively large shear span and are prone to shear damage. Li et al. [26,27] introduced the techniques of split columns, including the bearing capacity, seismic performance of split column frames and nodes, design, and construction recommendations. Hao et al. [28] conducted a series of experiments involving cyclic lateral loading on split columns and subsequently proposed a computational model to assess their load-carrying capacity. Li [29] used ABAQUS finite element software to analyze the effect of the separation ratio on the damage mode and load carrying capacity of split columns. In cases where the load-carrying capacity is comparable to that of monolithic columns, split columns exhibit a significant reduction in lateral stiffness and a notable increase in ductility, thereby demonstrating improved deformation and energy dissipation capabilities [30,31]. This feature of split columns is suitable for mitigating seismic hazards of underground structures. Du et al. [32] proposed a US patent for the application of split columns in underground structures, and Xu et al. [33] initially explored the seismic reduction effect of split columns in underground structures through integral dynamic time analysis.
In this study, taking a two-story and two-span subway station as a research case, the split column technology was adopted from the perspective of improving the seismic performance of underground structures. Based on the existing studies, the three-dimensional quasi-static pushover analysis models of the center column and soil–structure system were established using ABAQUS/CAE V 6.14 [34]. Additionally, the differences in seismic performance between the prototype and the new underground structure were compared from the perspective of the internal forces, deformation capacity, and plastic damage of critical members, which provide reference and guidance for the application of the split column technology in underground structures.
2. The Split Column Technology
The split columns are several independent unit columns divided using partition plates, and each unit column is independently reinforced. The structural diagram of split columns is shown in Figure 1. When cast-in-place reinforced concrete columns are used, partition plates are generally set between unit columns, and there is a bond between the unit column and the partition plates. In terms of assembled reinforced concrete columns, partition plates are not necessary, and frictional contact between unit columns is produced directly. Experimental and theoretical studies [27,28,29,30,31] have shown that when the split column technology is used in the ground buildings, although the flexural bearing capacity of the column is reduced, the shear bearing capacity remains basically unchanged, and the deformation capacity and ductility are significantly improved.
Taking the cast-in-place reinforced concrete column as an example, the loading process can be divided into three stages according to the degree of friction effect between the partition plate and the unit column. The strain distribution law of concrete in the cross section of the split column at different stress stages is shown in Figure 2, where w1 is the width of the unit column and w2 is the width of the partition plate. When the horizontal load on the split column is small, there is an effective bond between the partition plate and the concrete. The unit column on both sides of the partition plate is guaranteed to deform in a coordinated manner, and the strain distribution of the cross-section is similar to that of the monolithic column at that time. Furthermore, when the horizontal load increases to a certain degree, the bond between the partition plate and the concrete is gradually broken. The friction between the two restrains the deformation of the concrete on both sides of the partition plate, resulting in a smaller strain at the inner edge of the unit column. When the horizontal load continues to increase, the bond between the partition plate and the concrete is completely destroyed, and the friction between them is completely eliminated. The partition plate will no longer restrain the deformation of the concrete on both sides. Therefore, each unit column works independently, and the neutral axes of each unit columns move to their section center, respectively.
According to the distribution characteristics of strain within the cross section of the split column, the force of the split column is simplified as shown in Figure 3. Assuming that the height of the column is H, forces causing the bending deformation of the unit column are the horizontal load P and the shear force Qf, where Qf is the distributed shear force along the column height (i.e., the interaction friction between unit column and partition plate). When the bond between the unit column and the partition plate is intact or with large friction, the Qf would be larger, and the loading condition of the column is closer to the monolithic one. When there is no friction between the unit column and the partition plate, Qf is 0 with the unit columns working independently.
3. The Overview of the Subway Station
The engineering case of the subway station is shown in Figure 4, which is a typical two-story and two-span rectangular frame structure. The dimensions of the subway station measure 18.0 m in width and 11.9 m in height. The burial depth of the station is 5 m. The thicknesses of sidewalls, the top, middle, and bottom slabs are 800 mm, 750 mm, 450 mm, and 800 mm, respectively, and the cross section of the center column is 800 mm × 800 mm. In the longitudinal direction of the station, the axis spacing of the center column is 6 m. The reinforcement ratios for the left and right sidewalls as well as the top and bottom slabs are 1.41%, while they are 1.26% and 2.69% for the middle slabs and columns, respectively. The reinforcement of the traditional monolithic center column is shown in Figure 5a. In addition, the split column applied in this station structure is the traditional center column equally separated into four-unit columns, and the new seismic reduction system is called split column structure. The split-column structure is identical to the prototype structure in all aspects, including member size and cross-sectional reinforcement rate, except for the cross-sectional form of the center column. As shown in Figure 5b, each unit column in the split column is equipped with eight reinforcement bars with the diameter of 26 mm, and the reinforcement rate of the whole section is 2.65%, which is comparable to that of the original center column.
4. Finite Element Model
In this study, the seismic performance of the subway station structure is examined by using the quasi-static pushover analysis method. Considering the efficiency and the influence of calculation error, the length of the soil and structure model along the longitudinal direction of the station is 30 m in the soil–structure system. As shown in Figure 6, the total width of the soil–structure model is 140 m, which meets the requirement of more than seven times of the structural width. The model is fixed at the bottom, while the lateral boundaries are bundled, i.e., the soil nodes at the same height are bundled together for a consistent movement [35]. Both soil and structure are discretized by using C3D8R elements in ABAQUS, and the finite element mesh of soil is finer at the location near the station structure, in order to reduce the calculation error. Friction contact is set between the soil and the structure with kinetic friction coefficient taken as 0.4 [36,37]. In order to simplify the numerical model, the partition plate unit is not established in this model. The adjacent sides of each unit column are directly set as friction contact as well, and the kinetic friction coefficient is taken as 0.8 [38]. When assessing the internal force response of the central column, the analysis is conducted on the middle section of the subway station. The center column and section numbers are shown in Figure 6, where C1 and C2 denote the upper column and lower column, and S1 and S2 denote the bottom column sections, respectively.
Concrete is simulated by creating solid elements and using the Concrete Damage Plasticity model proposed by Lee et al. [39] and Lubliner et al. [40], which describes the change in concrete stiffness in tension and compression by introducing a tensile damage factor and a compressive damage factor. Its material properties are defined in ABAQUS software as shown in Table 1, Table 2 and Table 3 and Figure 7 [41]. In addition, the reinforcement rebar is simulated by creating truss elements with an ideal elasto-plastic intrinsic model. The initial elastic modulus, Poisson’s ratio, and yield stress is taken as 200 GPa, 0.3, and 335 MPa, respectively. The reinforcement is placed in the station concrete by embedding method, and the slip between the reinforcement and concrete is not considered in the numerical calculation process [42].
The site soil is divided into six layers, and the vertical distance from the soil surface to the bedrock is 40 m. The Davidenkov model is used for the site soil, which has been applied to the simulation of sandy soil liquefaction analysis of complex non-uniform sites, structural damage evaluation of large-scale subway stations, simulation of shield tunnels, and has shown excellent applicability [43,44,45]. The material parameters of each soil layer are shown in Table 4., and the shear modulus ratio varies with shear strain as follows:
In Equation (1), G and γ are the shear modulus and shear strain, respectively. Gmax is the maximum shear modulus of the soil. A, B and γ0 are the fitting parameters related to soil properties.
5. The Pushover Analysis of the Center Column
5.1. Analysis Methods
When subjected to seismic loading, the deformation mode of underground structures differs greatly from that of ground buildings. When a vertical member of a ground building (such as a bridge pier) is statically pushed over, a certain vertical pressure is first applied to achieve a predetermined axial pressure ratio, and then the member is loaded step by step through force control or displacement control until damaged. As shown in Figure 8 (left), the top of the member is often set without any restraints. For underground structures, the rotational degrees of freedom at the top of the center column are constrained to a large extent due to the restraining effect of the overlying soil and the top plate. Therefore, in order to truly reflect the deformation behavior of the center column during the earthquake, the top of the model is imposed with rotation constraints during pushover, and its loading pattern is shown in Figure 8 (right). In the pushover analysis of the center column, there are two analysis steps. Firstly, the axial pressure is applied to the top of the center column. The axial pressure considers two working conditions, one is considering only the self-weight of the soil and structure, and the other is considering both the self-weight and the vertical inertia force. In the second analysis step, the horizontal displacement is applied to the top of the center column. As shown in Table 5, the pushover analysis of the center column includes 16 cases.
5.2. Analysis Results
Before the pushover analysis of the center column, the axial pressure of the upper center column and lower center column need to be determined by static calculation, including the working conditions with only gravity force and with both gravity force and vertical seismic load. The calculation model under gravity conditions is consistent with the model shown in Figure 6. One of the calculation models only applies the gravity of the structure and soil, while the other model adds vertical inertial force. After preliminary calculations, the axial forces of the upper and lower center columns are about 5869 kN and 6669 kN, respectively, when the gravity load is considered. Considering the seismic condition, and with reference to the results of Xu et al. [46], it is assumed here that the axial force of the center column increases by 50% when the vertical seismic action is considered. The lateral force–drift ratio curves of the center column under different working conditions are shown in Figure 9.
From the lateral force–drift ratio curves, it can be seen that for the various working conditions listed in Table 5, the lateral force shows a trend of increasing and then decreasing with the increase in the lateral drift ratio. When the horizontal drift increases to a certain degree, the lateral thrust of the column reaches the peak, which does not mean that the column fails at this time. However, if the column has sufficient ductility performance, the column still has the ability to bear the horizontal load after the peak lateral thrust. Therefore, when the lateral force falls to 85% of the peak value, it is defined as the damage state; that is, the column no longer has the bearing capacity.
From Figure 9, it can be seen that the ultimate lateral drift ratio of the center column decreases when vertical inertia forces are considered for both traditional and split columns compared to the gravity load-only condition. For example, the ultimate lateral drift ratio of the lower center column is 0.0116 in the gravity load-only condition, and the ultimate lateral drift ratio of the lower center column is only 0.0089 after considering the vertical inertia force, which is about 23% lower. The vertical inertia effect of the overlying soil is one of the key factors affecting the seismic performance of the center column, which should be given sufficient attention in the seismic design process of underground structures, especially the shallow ones. When the split column is adopted, for the same level of axial load, the horizontal deformation capacity of both the upper and lower columns shows an increasing trend. For example, in working condition UT-A-GE, the ultimate lateral drift ratio of the upper column is only 0.0095, and after adopting the form of the split column section, the ultimate lateral drift rate of the upper column is increased to 0.0121, with an increase rate of about 27%.
Figure 10 further shows the lateral force–drift ratio curves of the upper and lower columns when Mode B pushover analysis is used. The comparison between Figure 9 and Figure 10 shows that the lateral stiffness resistance of the center column is significantly increased when the top rotational freedom of the center column is constrained; moreover, the peak bearing capacity of the center column is much larger than that shown in Figure 9. Similarly, after considering both the gravity and vertical inertia forces, the deformation capacity of the traditional column is inferior, and the ultimate lateral drift ratio of the upper and lower columns are only 0.0064 and 0.0067. At this time, the lateral drift ratios of the split column when it is damaged are 0.0121 and 0.0109, respectively. Compared with the traditional center column, the ultimate lateral drift ratio of the split column is improved by more than 60%. In addition, when only the self-weight load is considered, the deformation capacity of the split column is stronger.
The seismic design code for urban rail transit structures mentions that the underground structure is considered to reach a damage state when the inter-story drift angle reaches 1/250. Figure 11 and Figure 12 show the concrete compressive and tensile damage graph for traditional and split columns under the combined action of gravity and vertical inertia forces at the lateral drift rate = 1/250 in both pushover modes. Among them, DAMAGEC represents compressive damage and DAMAGET represents tensile damage. It can be seen that the compression and tension damage to the concrete in split columns is much smaller than that of the concrete in monolithic column, which indicates that the split column still has a better load-bearing capacity at this time. In addition, by comparing the damage to the structure in the two pushover modes, it can also be found that the damage to the center column in the case of Mode A is mainly concentrated in the bottom of the column, while it is distributed at the ends of the column in the case of Mode B.
6. The Pushover Analysis of Soil–Structure System
6.1. Analysis Methods
The quasi-static pushover analysis is one of the most commonly used methods to study the seismic performance of underground structures. Liu et al. [47] established the pushover analysis method for underground structures based on their seismic response characteristics. In this method, gravity is first applied to the soil–structure system, and then horizontal inertial forces are applied to the system step by step until the structure is damaged, so as to obtain the seismic damage evolution process from the elastic to the elasto-plastic working state and finally to the failure. In the quasi-static pushover analysis of the soil–structure system, Jiang et al. [48] considered not only the gravity effect, but also the vertical seismic loads, so as to propose an improved pushover analysis method for underground structures. In the improved method, the loading conditions of the structure during earthquakes are simulated by applying horizontal and vertical inertia forces of certain distribution forms to the soil–structure system, respectively. The calculation models of the traditional and the improved pushover analysis method are shown in Figure 13 for Mode C and Mode D, respectively. The horizontal loads of Mode C and Mode D are the same in the form of inverted triangular distribution. The main difference between the two loading modes is the vertical loads, where Mode D includes vertical inertia forces in addition to gravity.
6.2. Analysis Results
Consistent with Section 5.2, it is assumed that the soil pressure of the overburden is increased by 50% considering the vertical earthquake effect [46]. The shear forces at the bottom of each center column of the structural mid-span under gravity are shown in Figure 14. From the figure, it can be seen that with the increase in applied horizontal acceleration, the lateral drift ratio of the center column is also increasing, and shear forces of each sections reach their peak with a lateral drift ratio of about 0.5%.
When the vertical load only considers the self-weight of soil and the structure, the shear force of traditional center column shows a gradual decrease after reaching the peak value. In contrast, although the peak shear force borne by the split column is only about 1/3 of that of the traditional one, its horizontal deformation capacity is excellent, and there is no obvious decreasing section. The split column can still bear the shear deformation even though the inter-story drift ratio has reached 1/100.
When the vertical loads consider both gravity and inertia forces, both the upper and the lower traditional columns show a significant decreasing trend after exceeding the peak shear force during the pushover process, and the decreasing trend in Figure 15 is more obvious than the decreasing trend in Figure 14. This step illustrates that the vertical inertia force of the overlying soil has an important influence on the seismic performance of underground structures. At this time, although the split column still needs to bear a large vertical pressure, its deformation capacity is outstanding and has good ductility performance.
Figure 16 presents the equivalent plastic strains of center column concrete under four typical cases of inter-story drift ratio, which are 1/1000, 1/550, 1/250, and 1/100 [49,50], corresponding to their respective color areas in Figure 16. Upon implementing the split column configuration, it is observed that the concrete’s equivalent plastic strain throughout various phases consistently registers lower values in comparison to the traditional monolithic column. When the inter-story drift ratio reaches 1/100, the maximum equivalent plastic strain of concrete in the split column is about 0.25%. The zones of concrete damage are uniformly distributed around the top and bottom sections of split column, representing a prominent departure from the failure pattern exhibited by the prototype monolithic columns.
In addition, comparing Figure 11, Figure 12 and Figure 16, it can also be found that the equivalent plastic strain distribution mode shown in Figure 12 is closer to that shown in Figure 16, which means that Mode B is preferred for the pushover analysis of underground structures. Specifically, the horizontal drift is applied while the rotation degrees of freedom at the top of the column are also restrained. This particular pushover methodology serves to accurately simulate the stress distribution within columns of underground structures, thereby yielding more authentic seismic performance curves.
7. Conclusions
This study draws inspiration from the seismic design concept of split columns in high-rise building structures, and sets up split columns in a two-story, two-span subway station to form a new structural system. Through quasi-static pushover analysis of the middle column and soil–structure system, the main conclusions obtained are as follows:
- (1)
- When the cross-sectional area and the longitudinal reinforcement ratio is similar, the horizontal bearing capacity of split columns is reduced compared to traditional columns, and the stiffness of split columns is basically lower than that of traditional columns under various loading displacements.
- (2)
- Compared to traditional columns, split column components have better displacement capacity, and the ultimate inter-story drift ratio of split columns under high axial compression ratio is 1.5-fold higher than that of traditional columns.
- (3)
- Although the ability of split columns to share shear and bending moments is reduced compared to traditional columns, they still have higher vertical bearing capacity under larger horizontal deformations, and the damage to split columns is much smaller than that of traditional columns under the same inter-story displacement angle.
- (4)
- The working mechanism is to avoid the central column bearing excessive shear and bending forces, while fully utilizing the vertical support capacity and horizontal deformation capacity of split columns. Compared to traditional columns, the construction steps of split columns are more complex. To promote the application of split columns in underground structures, it is necessary to strengthen both experimental research and construction technology research.
Author Contributions
Conceptualization, Z.X. (Zigang Xu) and Z.X. (Zongyao Xia); methodology, Z.X. (Zigang Xu) and R.H.; software, Z.X. (Zongyao Xia); validation, Z.X. (Zigang Xu) and X.B.; formal analysis, Z.X. (Zongyao Xia); data curation, Z.X. (Zigang Xu); writing—original draft preparation, Z.X. (Zongyao Xia); writing—review and editing, X.B.; visualization, Z.X. (Zongyao Xia); project administration, Z.X. (Zigang Xu); funding acquisition, Z.X. (Zigang Xu) and R.H. All authors have read and agreed to the published version of the manuscript.
Funding
This research is jointly funded by the National Natural Science Foundation of China (No. 52108453), the Natural Science Foundation of Jiangxi Province in China (No. 20212BAB214014 and No. 20232BAB204084), the China Postdoctoral Science Foundation Project (No. 2023M741159), and the Natural Science Foundation of Inner Mongolia Autonomous Region in China (No. 2023QN05012).
Institutional Review Board Statement
Not applicable.
Informed Consent Statement
Not applicable.
Data Availability Statement
Data are available in a publicly accessible repository.
Conflicts of Interest
The authors declare no conflicts of interest.
References
- GB18306-2015; Seismic Ground Motion Parameters Zonation Map of China. Standardization Administration of China: Beijing, China, 2016. (In Chinese)
- Du, X.L.; Li, Y.; Xu, C.S.; Lu, D.; Xu, Z.; Jin, L. Review on damage causes and disaster mechanism of Daikai subway station during 1995 Osaka-Kobe Earthquake. Chin. J. Geotech. Eng. 2018, 40, 223–236. (In Chinese) [Google Scholar]
- Iida, H.; Hiroto, T.; Yoshida, N.; Iwafuji, M. Damage to Daikai subway station. Soils Found 1996, 36, 283–300. [Google Scholar] [CrossRef] [PubMed]
- Wang, W.L.; Wang, T.T.; Su, J.J.; Lin, C.H.; Seng, C.R.; Huang, T.H. Assessment of damage in mountain tunnels due to the Taiwan Chi-Chi earthquake. Tunn. Undergr. Space Technol. 2001, 16, 133–150. [Google Scholar] [CrossRef]
- Wang, Z.Z.; Gao, B.; Jiang, Y.J.; Yuan, S. Investigation and assessment on mountain tunnels and geotechnical damage after the Wenchuan earthquake. Sci. China Ser. E Technol. Sci. 2009, 52, 546–558. [Google Scholar] [CrossRef]
- Kuesel, T.R. Earthquake design criteria for subways. J. Struct. Div. 1969, 95, 1213–1231. [Google Scholar] [CrossRef]
- Liu, J.B.; Zhang, X.B. Practical seismic analysis of large underground structures: Theory and application. Sci. China Technol. Sci. 2018, 61, 1417–1425. [Google Scholar] [CrossRef]
- Jiang, L.; Chen, J.; Li, J. Seismic response of underground utility tunnels: Shaking table testing and FEM analysis. Earthq. Eng. Eng. Vib. 2010, 9, 555–567. [Google Scholar] [CrossRef]
- Ulgen, D.; Saglam, S.; Ozkan, M.Y. Dynamic response of a flexible rectangular underground structure in sand: Centrifuge modeling. Bull. Earthq. Eng. 2015, 13, 2547–2566. [Google Scholar]
- Jiang, X.; Wang, F.; Yang, H.; Sun, G.; Niu, J. Dynamic Response of Shallow-Buried Small Spacing Tunnel with Asymmetrical Pressure: Shaking Table Testing and Numerical Simulation. Geotech. Geol. Eng. 2018, 36, 2037–2055. [Google Scholar] [CrossRef]
- An, X.; Shawky, A.A.; Maekawa, K. The collapse mechanism of a subway station during the Great Hanshin earthquake. Cem. Concr. Compos. 1997, 19, 241–257. [Google Scholar] [CrossRef]
- Huo, H.; Bobet, A.; Fernández, G.; Ramírez, J. Load transfer mechanisms between underground structure and surrounding ground: Evaluation of the failure of the Daikai station. J. Geotech. Geoenviron. Eng. 2005, 131, 1522–1533. [Google Scholar] [CrossRef]
- Gao, F.; Shi, Y.C.; Yan, S.H.; Guan, B.S. Study of two shock absorption measures in tunnel. Chin. J. Rock Mech. Eng. 2005, 24, 222–229. (In Chinese) [Google Scholar] [CrossRef]
- Zhao, W.; Chen, W.; Yang, D. Interaction between strengthening and isolation layers for tunnels in rock subjected to SH waves. Tunn. Undergr. Space Technol. 2018, 79, 121–133. [Google Scholar] [CrossRef]
- Chen, Z.; Liang, S.; Shen, H.; He, C. Dynamic centrifuge tests on effects of isolation layer and cross-section dimensions on shield tunnels. Soil Dyn. Earthq. Eng. 2018, 109, 173–187. [Google Scholar] [CrossRef]
- Ma, C.; Lu, D.; Du, X. Seismic performance upgrading for underground structures by introducing sliding isolation bearings. Tunn. Undergr. Space Technol. 2018, 74, 1–9. [Google Scholar] [CrossRef]
- Xu, Z.; Du, X.; Xu, C.; Han, R. Numerical analyses of seismic performance of underground and aboveground structures with friction pendulum bearings. Soil Dyn. Earthq. Eng. 2020, 130, 105967. [Google Scholar] [CrossRef]
- Chen, Z.; Chen, W.; Bian, G. Seismic performance upgrading for underground structures by introducing shear panel dampers. Adv. Struct. Eng. 2014, 17, 1343–1357. [Google Scholar] [CrossRef]
- Chen, Z.; Zhao, H.; Lou, M. Seismic performance and optimal design of framed underground structures with lead-rubber bearings. Struct. Eng. Mech. 2016, 58, 259–276. [Google Scholar] [CrossRef]
- Du, X.L.; Wang, Z.L.; Liu, H.T. Study of a seismic new system of underground frame structure based on toughness design. Technol. Earthq. Disaster Prev. 2018, 13, 493–501. (In Chinese) [Google Scholar]
- Chen, Z.; Zhou, Y. Seismic performance of framed underground structures with self-centering energy-dissipation column base. Adv. Struct. Eng. 2019, 22, 2809–2822. [Google Scholar] [CrossRef]
- Yue, C.; Zheng, Y.; Deng, S. Shaking table test study on seismic performance improvement for underground structures with center column enhancement. J. Earthq. Tsunami 2019, 13, 1950009. [Google Scholar] [CrossRef]
- Ma, C.; Wang, Z.H.; Lu, D.C.; Du, X. Seismic damage evaluation of CFRP-strengthened columns in subway stations. Chin. J. Geotech. Eng. 2020, 42, 2249–2256. (In Chinese) [Google Scholar]
- Bu, X.; Ledesma, A.; López-Almansa, F. Low lateral stiffness underground structures for improved seismic performance. Appl. Kobe Daikai Stn. Eng. Struct. 2023, 291, 116388. [Google Scholar]
- Bu, X.; Xu, Z.; Ledesma, A.; López-Almansa, F. Seismic target drifts for underground railway stations. Cases of traditional rigid connections and sliding interior columns. Tunn. Undergr. Space Technol. 2024, 144, 105555. [Google Scholar] [CrossRef]
- Li, Z.X. Theory and technology of split reinforced concrete columns. Eng. Mech. 2005, 22, 128–140. (In Chinese) [Google Scholar] [CrossRef]
- Li, Z.X.; Hao, Y.C.; Zhang, J.Y. Research on seismic behavior of interior beam-column joints of reinforced concrete frames. J. Build. Struct. 2001, 22, 55–60. (In Chinese) [Google Scholar]
- Hao, Y.C.; Hu, Q.C.; Xu, Y.F.; Kang, G.Y. Experimental study on bearing capacity of separated columns under horizontal cyclic loading. J. Build. Struct. 1999, 20, 18–25. (In Chinese) [Google Scholar]
- Li, R.W. Experimental Study on the Mechanical Behavior of Split Columns with Different Separation Ratios. Master’s Thesis, Yantai University, Yantai, China, 2017. (In Chinese). [Google Scholar]
- Li, Z.X.; Hao, Y.C.; Zhou, B.; Kang, G.; Hu, Q.; Xu, Y. Model experimental study on seismic behavior of reinforced concrete frame with split columns. J. Build. Struct. 2003, 24, 1–10. (In Chinese) [Google Scholar]
- Ma, Q.Y.; Zhao, G.Q.; Jiang, C.Y. Experimental research on seismic performance of central column in subway station. Build. Struct. 2021, 51, 77–85. (In Chinese) [Google Scholar]
- Du, X.L.; Xu, Z.G.; Xu, C.S. n-Shape Prefabricated Connective Split Column for Underground Structures. U.S. Patent 10669719 B2, 18 December 2023. [Google Scholar]
- Xu, C.S.; Wang, Y.X.S.; Du, X.L.; Xu, Z.; Zhang, Z. Seismic mitigation effects of split columns in underground station structures. Chin. J. Geotech. Eng. 2021, 43, 624–633. (In Chinese) [Google Scholar]
- Hibbitt; Karlsson; Sorensen. ABAQUS/Explicit: User’s Manual; Hibbitt, Karlsson and Sorenson Incorporated: Birmingham, AL, USA, 2001. [Google Scholar]
- Kampitsis, A.E.; Sapountzakis, E.J.; Giannakos, S.K.; Gerolymos, N.A. Seismic soil-pile-structure kinematic and inertial interaction-A new beam approach. Soil Dyn. Earthq. Eng. 2013, 55, 211–224. [Google Scholar] [CrossRef]
- Bu, X.; Ledesma, A.; López-Almansa, F. Novel seismic design solution for underground structures. Case study of a 2-story 3-bay subway station. Soil Dyn. Earthq. Eng. 2022, 153, 107087. [Google Scholar] [CrossRef]
- Yang, J.; Zhuang, H.; Wang, W.; Zhou, Z.; Chen, G. Seismic performance and effective isolation of a large multilayered underground subway station. Soil Dyn. Earthq. Eng. 2021, 142, 106560. [Google Scholar]
- Nie, X.; Liu, T. Experimental and numerical study on bending behavior of concrete-concrete composite beams. China Civ. Eng. J. 2022, 55, 14–25. (In Chinese) [Google Scholar]
- Lee, J.; Fenves, G.L. Plastic-Damage Model for Cyclic Loading of Concrete Structures. J. Eng. Mech. 1998, 124, 892–900. [Google Scholar] [CrossRef]
- Lubliner, J.; Oliver, J.; Oller, S.; Oñate, E. A plastic-damage model for concrete. Int. J. Solids Struct. 1989, 25, 299–326. [Google Scholar] [CrossRef]
- Zhuang, H.; Hu, Z.; Wang, X.; Chen, G. Seismic responses of a large underground structure in liquefied soils by FEM numerical modelling. Bull. Earthq. Eng. 2015, 13, 3645–3668. [Google Scholar] [CrossRef]
- Xu, Z.; Zhuang, H.; Xia, Z.; Yang, J.; Bu, X. Study on the effect of burial depth on seismic response and seismic intensity measure of underground structures. Soil Dyn. Earthq. Eng. 2023, 166, 107782. [Google Scholar] [CrossRef]
- Jiang, J.; El Nggar, H.M.; Xu, C.; Zhong, Z.; Du, X. Effect of ground motion characteristics on seismic fragility of subway station. Soil Dyn. Earthq. Eng. 2021, 143, 106618. [Google Scholar] [CrossRef]
- Jiang, J.; El Naggar, M.H.; Xu, C.; Du, X. Effect of parameters associated with soil-to-structure relative stiffness on seismic fragility curves of subway station. Tunn. Undergr. Space Technol. 2023, 135, 105057. [Google Scholar] [CrossRef]
- Jiang, J.; El Naggar, M.H.; Du, X.; Du, X. Seismic fragility curves for shallow buried subway station using pushover-based method. Tunn. Undergr. Space Technol. 2023, 135, 105059. [Google Scholar] [CrossRef]
- Xu, Z.; Du, X.; Xu, C.; Jiang, J.; Han, R. Simplified equivalent static methods for seismic analysis of shallow buried rectangular underground structures. Soil Dyn. Earthq. Eng. 2019, 121, 1–11. [Google Scholar] [CrossRef]
- Liu, J.B.; Wang, W.H.; Dasgupta, G. Pushover analysis of underground structures: Method and application. Sci. China Technol. Sci. 2014, 57, 423–437. [Google Scholar] [CrossRef]
- Jiang, J.; Xu, C.; El Naggar, H.M.; Du, X.; Xu, Z.; Assaf, J. Improved pushover method for seismic analysis of shallow buried underground rectangular frame structure. Soil Dyn. Earthq. Eng. 2021, 140, 106363. [Google Scholar] [CrossRef]
- Du, X.; Jiang, J.; El Naggar, M.H.; Xu, C.; Xu, Z. Interstory drift ratio associated with performance objectives for shallow-buried multistory and span subway stations in inhomogeneous soil profiles. Earthq. Eng. Struct. Dyn. 2021, 50, 655–672. [Google Scholar] [CrossRef]
- Zhong, Z.; Shen, Y.; Zhao, M.; Li, L.; Du, X. Seismic performance evaluation of two-story and three-span subway stations in different engineering sites. J. Earthq. Eng. 2022, 26, 7505–7535. [Google Scholar] [CrossRef]
Figure 1.
Structural diagram of split columns.

Figure 2.
The strain distribution of the split column.
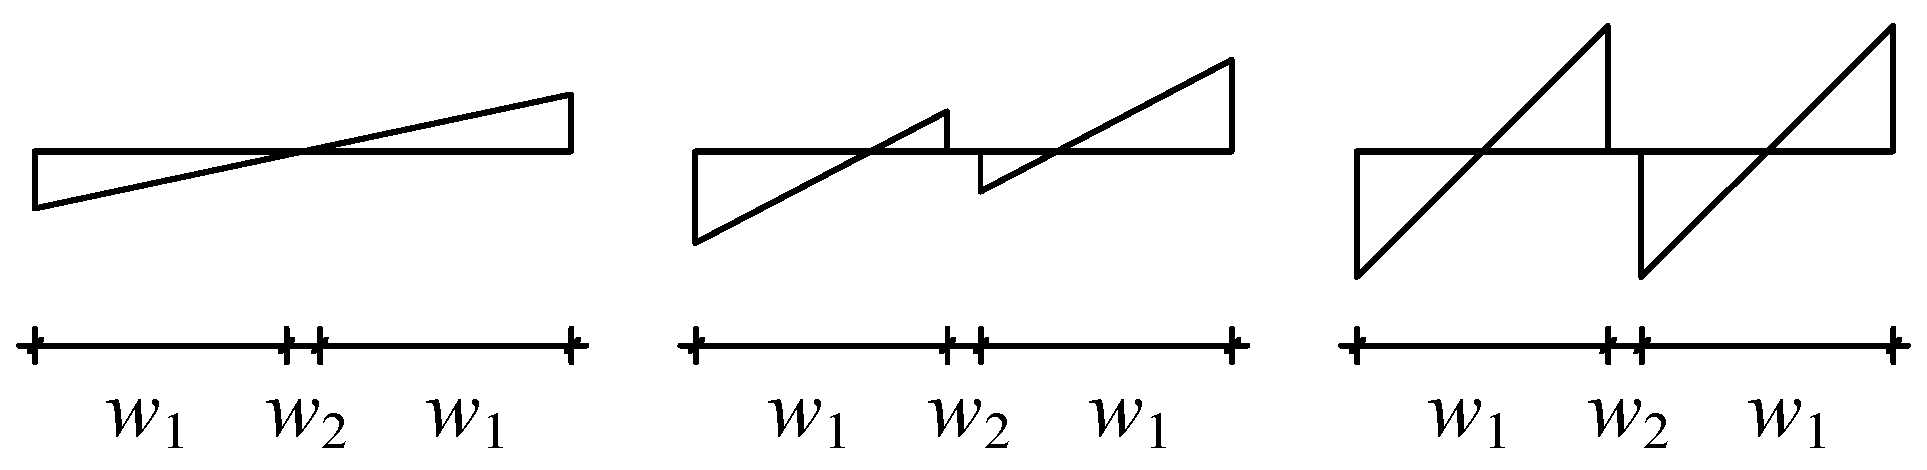
Figure 3.
Analysis of the load condition of the split column.

Figure 4.
Three-dimensional diagram of an underground station.
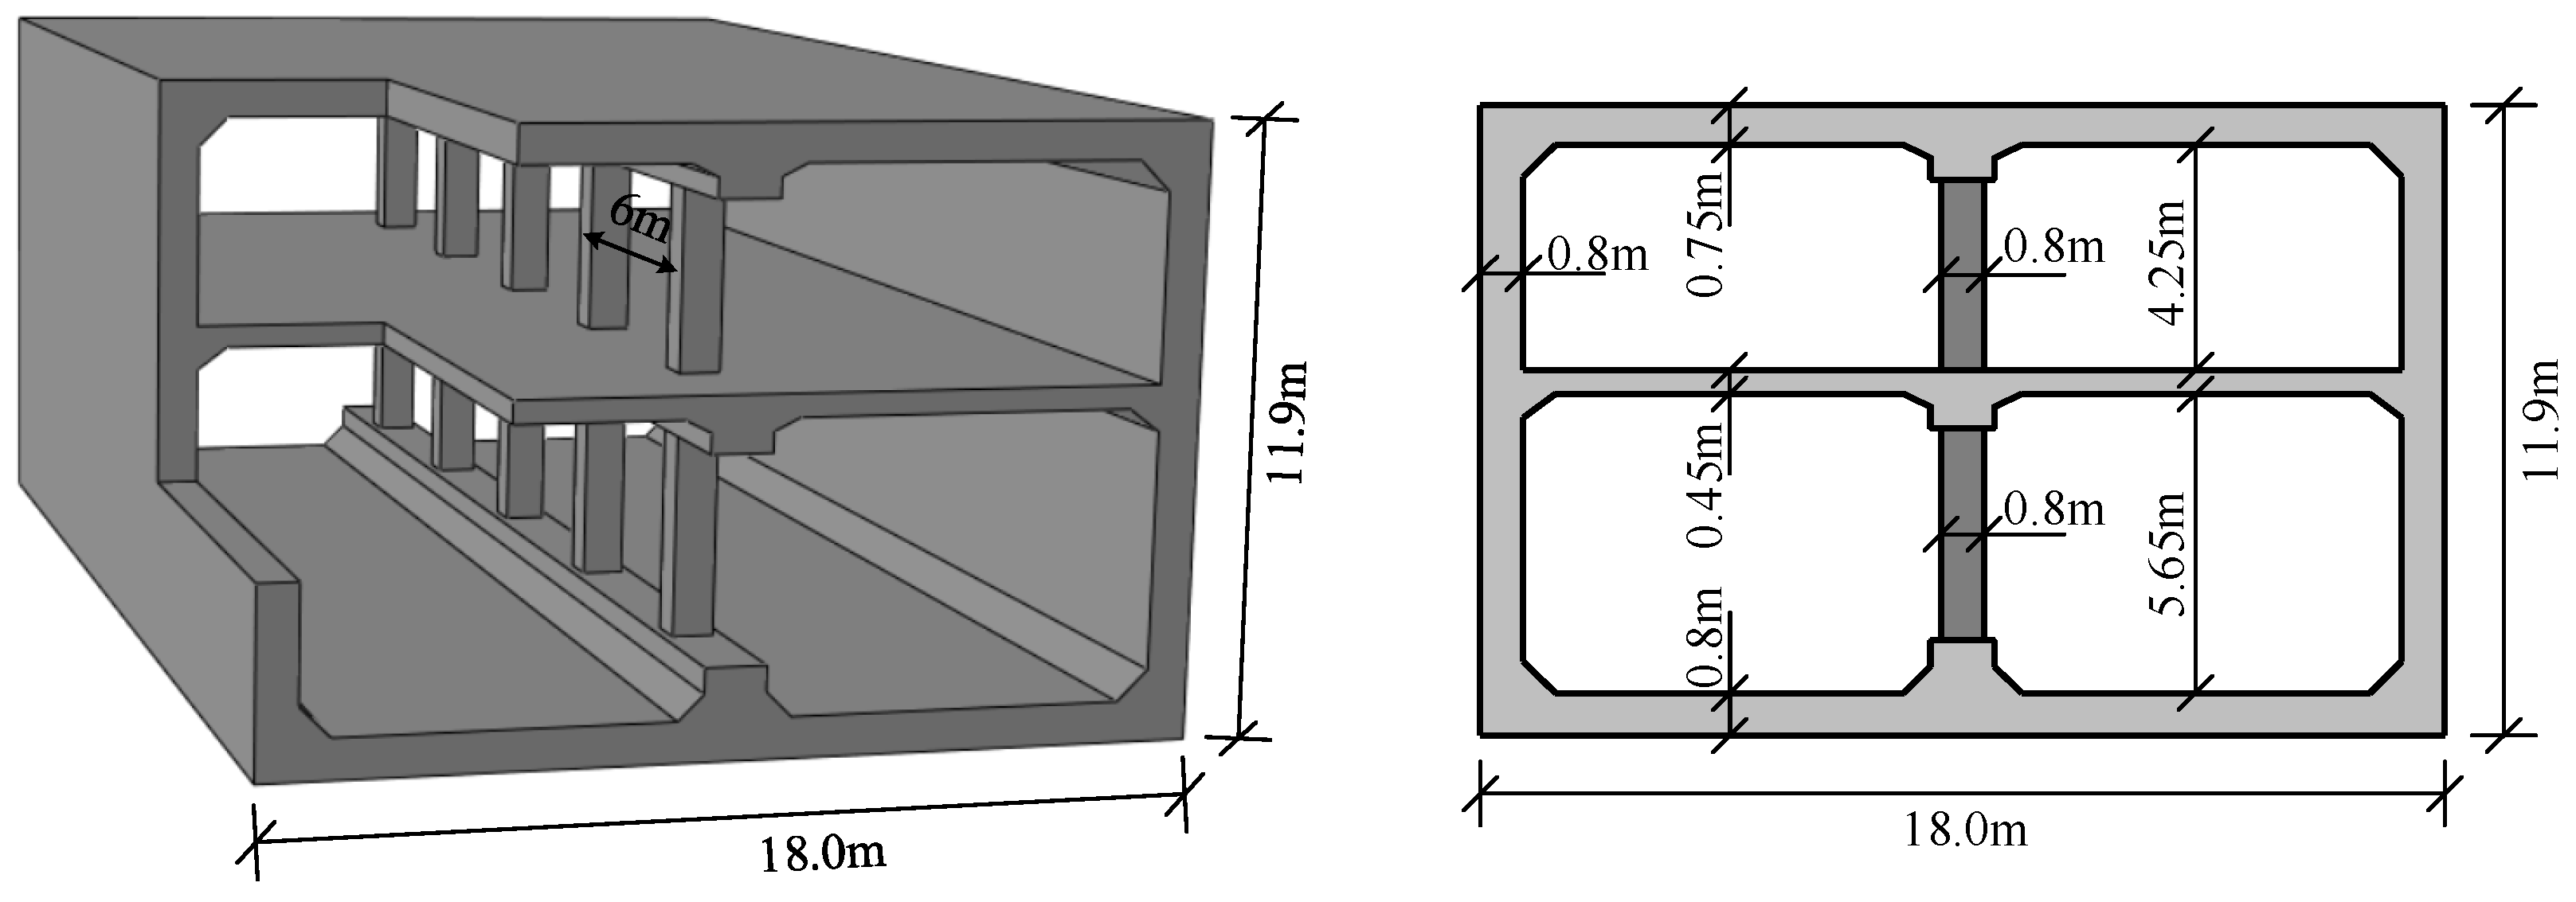
Figure 5.
Three-dimensional diagram of an underground station. (a) Original center column reinforcement. (b) Split column reinforcement.
Figure 5.
Three-dimensional diagram of an underground station. (a) Original center column reinforcement. (b) Split column reinforcement.

Figure 6.
Finite element model for pushover analysis of the soil–structure system.

Figure 7.
Material parameters of concrete. (a) Compressive behavior of concrete. (b) Tensile behavior of concrete.
Figure 7.
Material parameters of concrete. (a) Compressive behavior of concrete. (b) Tensile behavior of concrete.
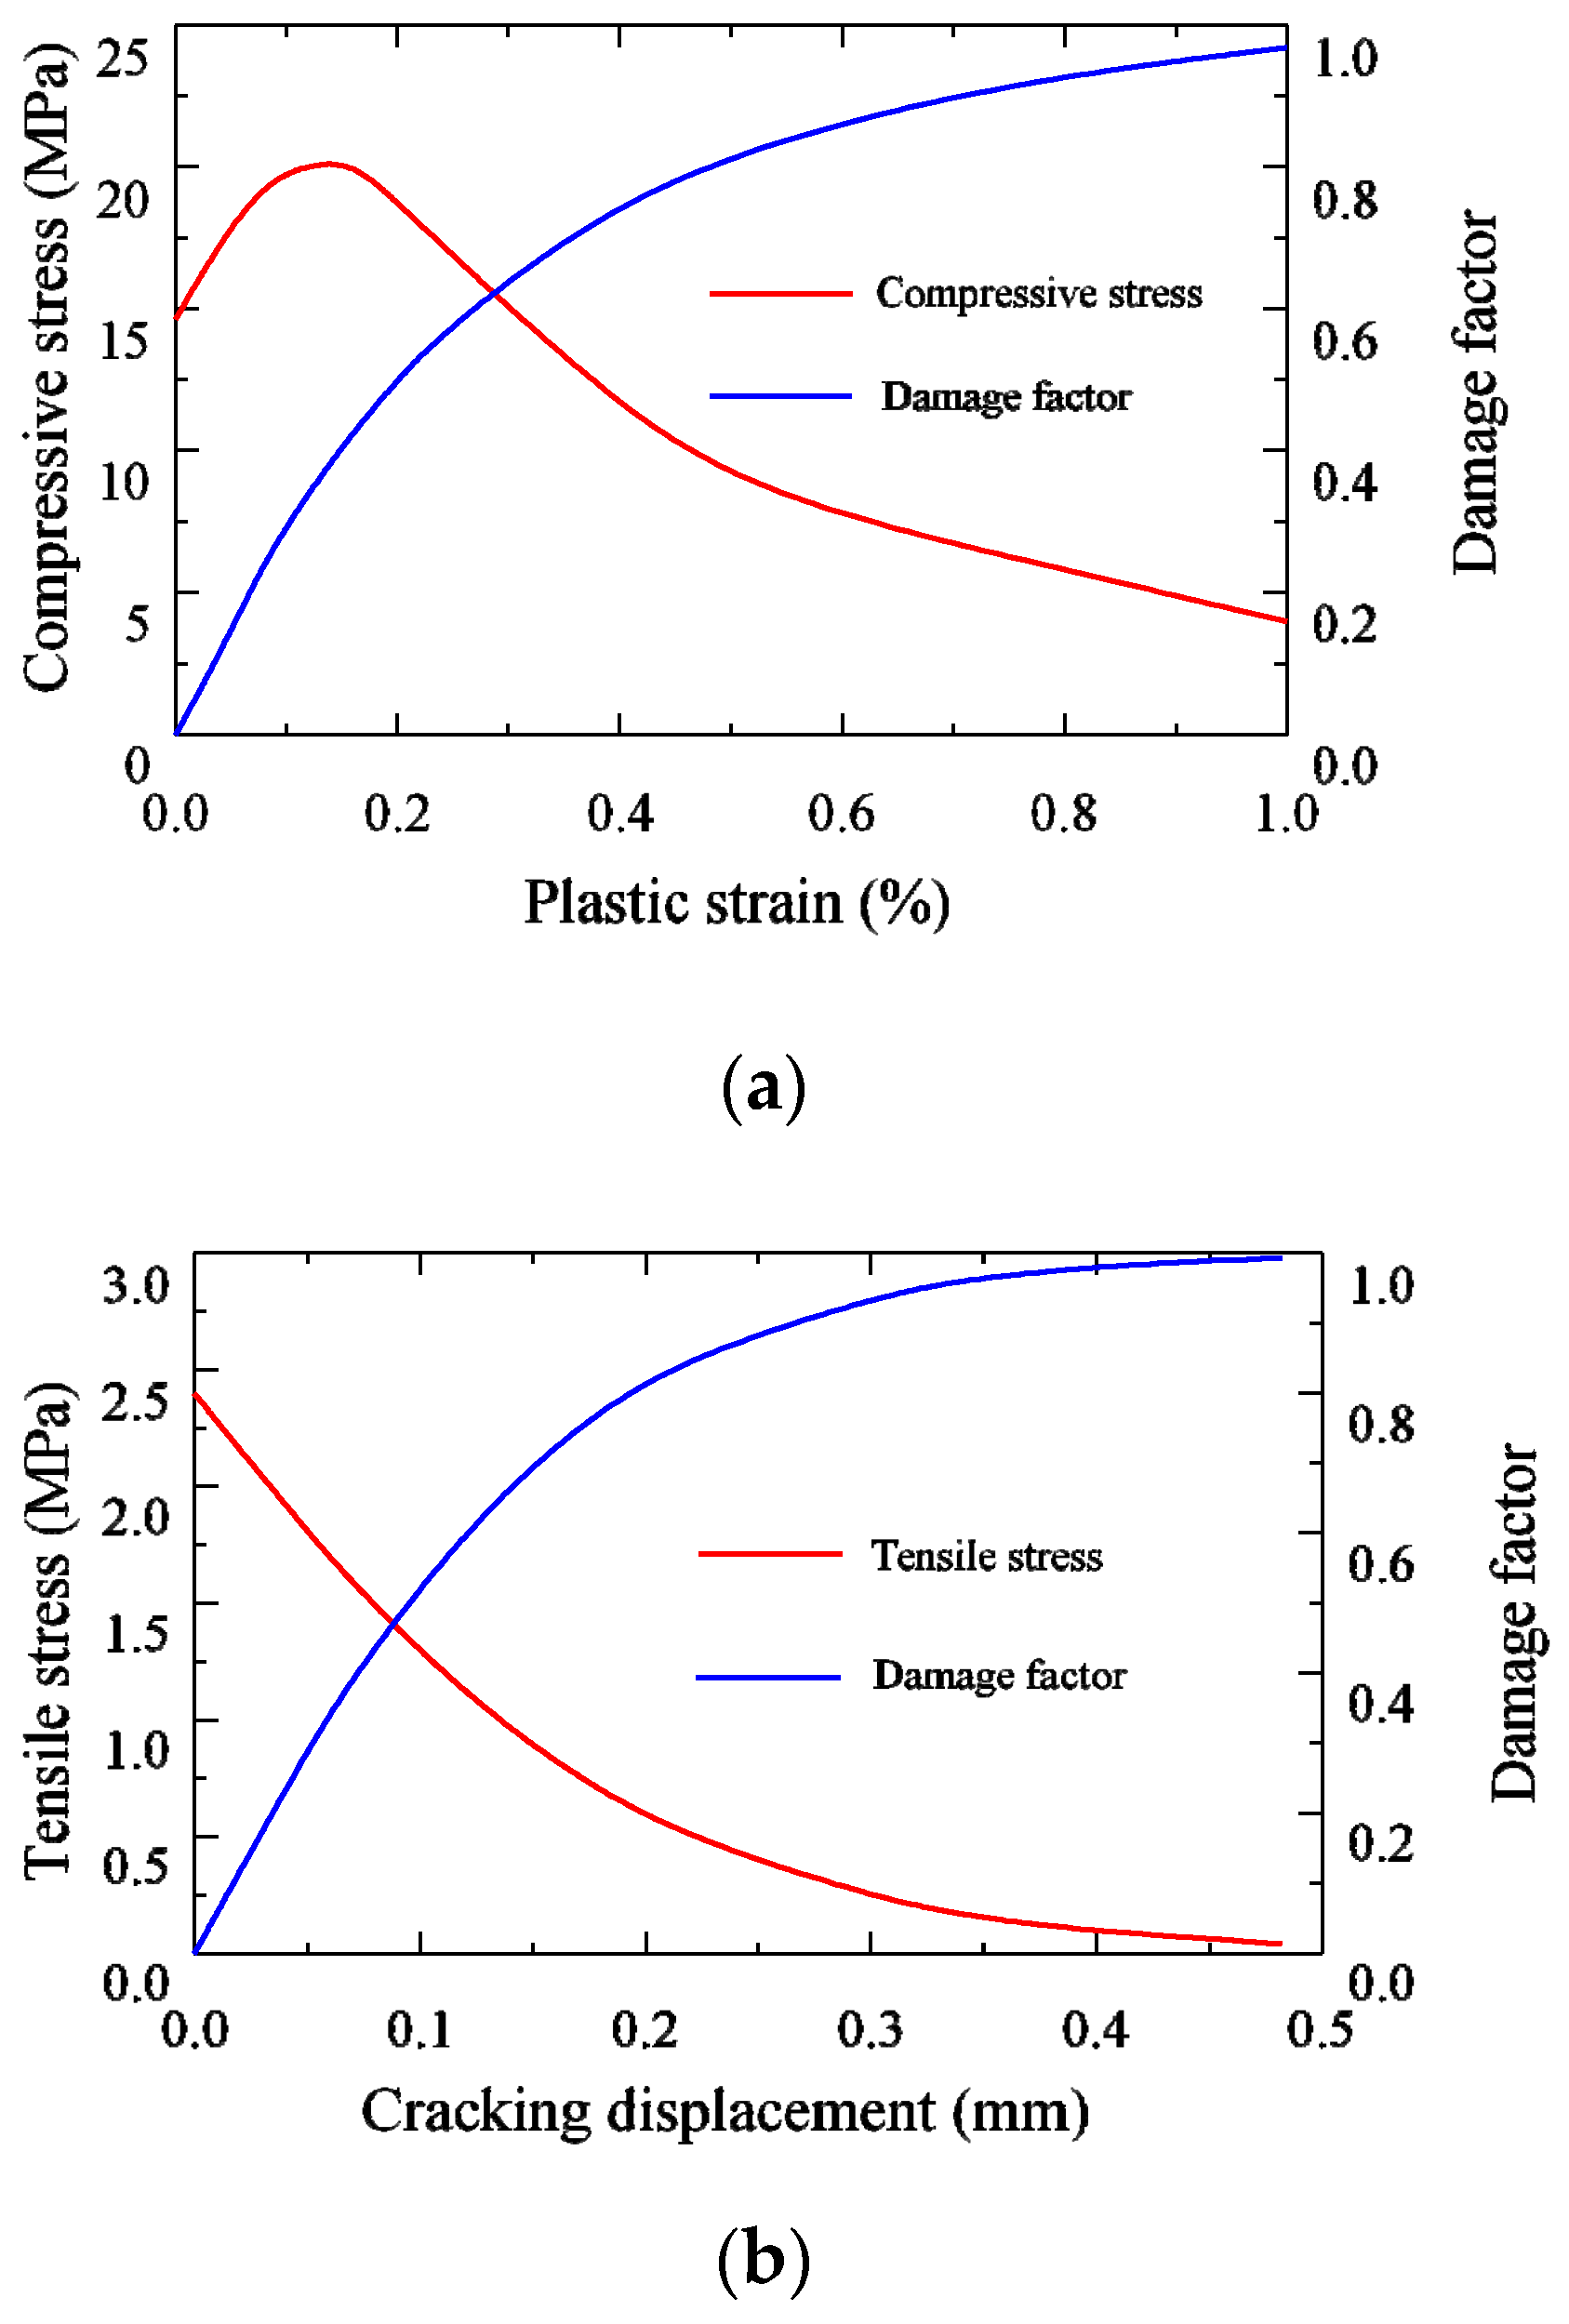
Figure 8.
Pushover modes of center column.
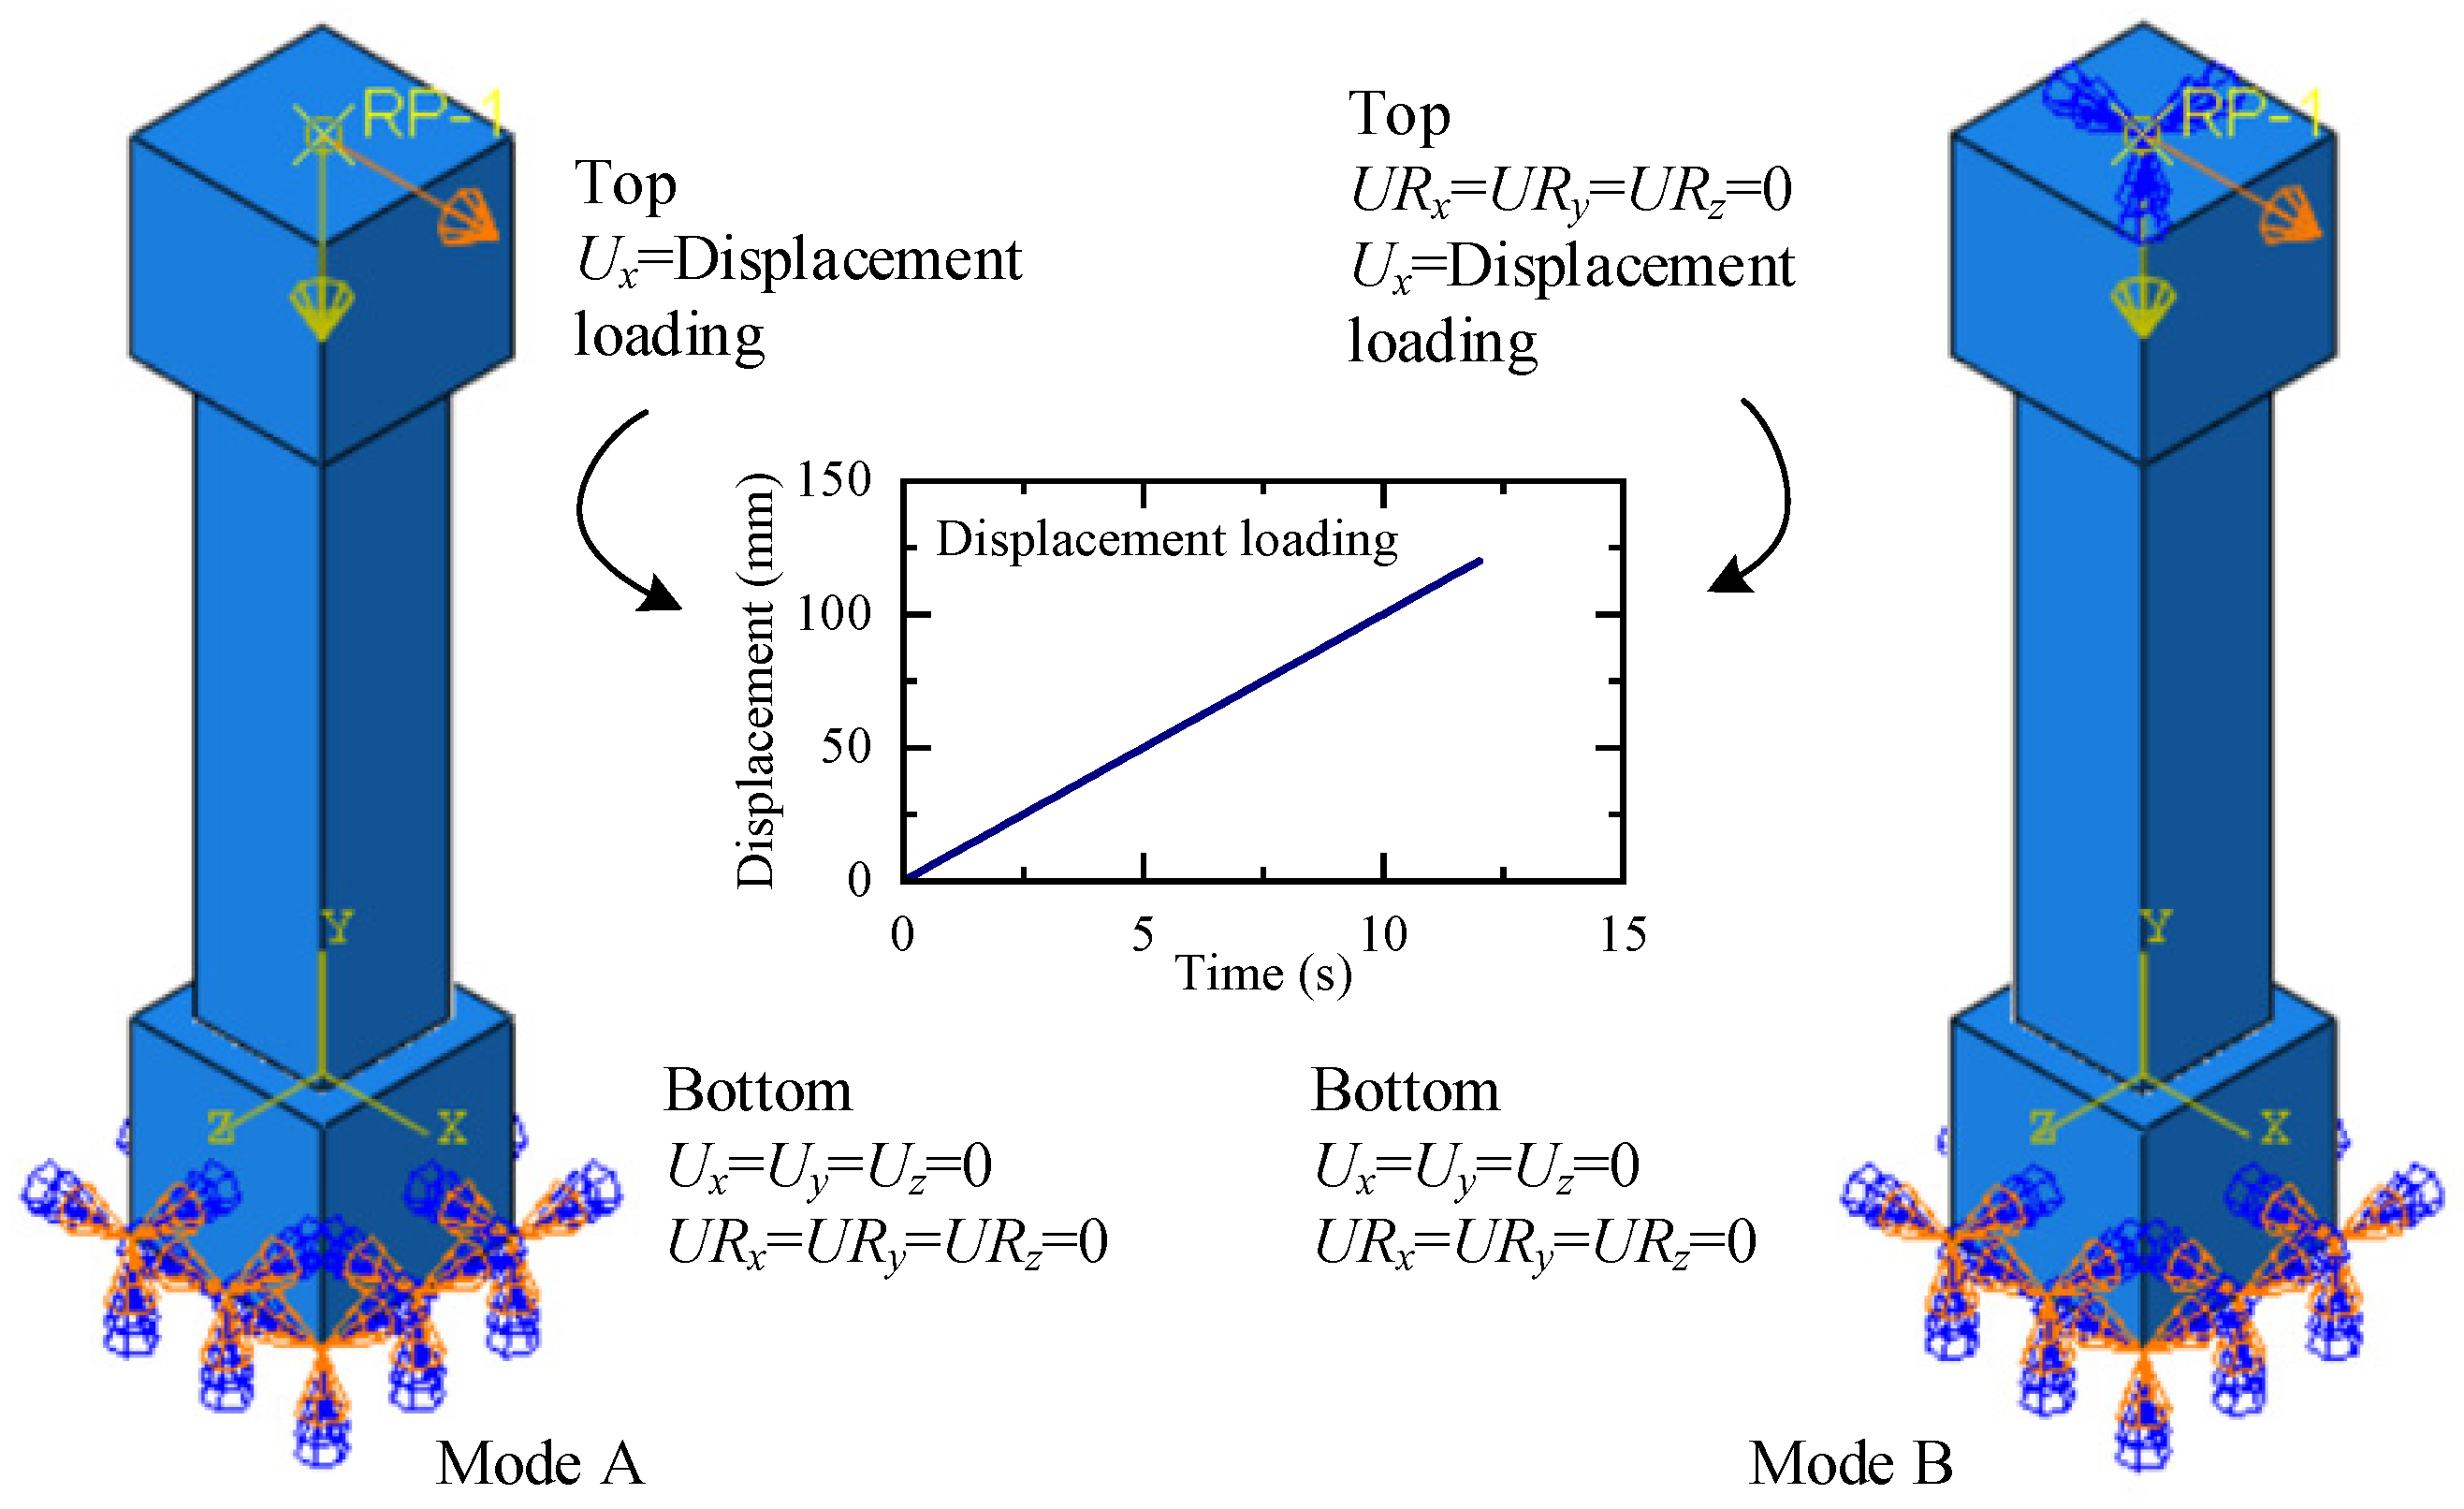
Figure 9.
Lateral force–drift ratio curves of columns by Mode A. (a) Upper column. (b) Lower column.
Figure 9.
Lateral force–drift ratio curves of columns by Mode A. (a) Upper column. (b) Lower column.
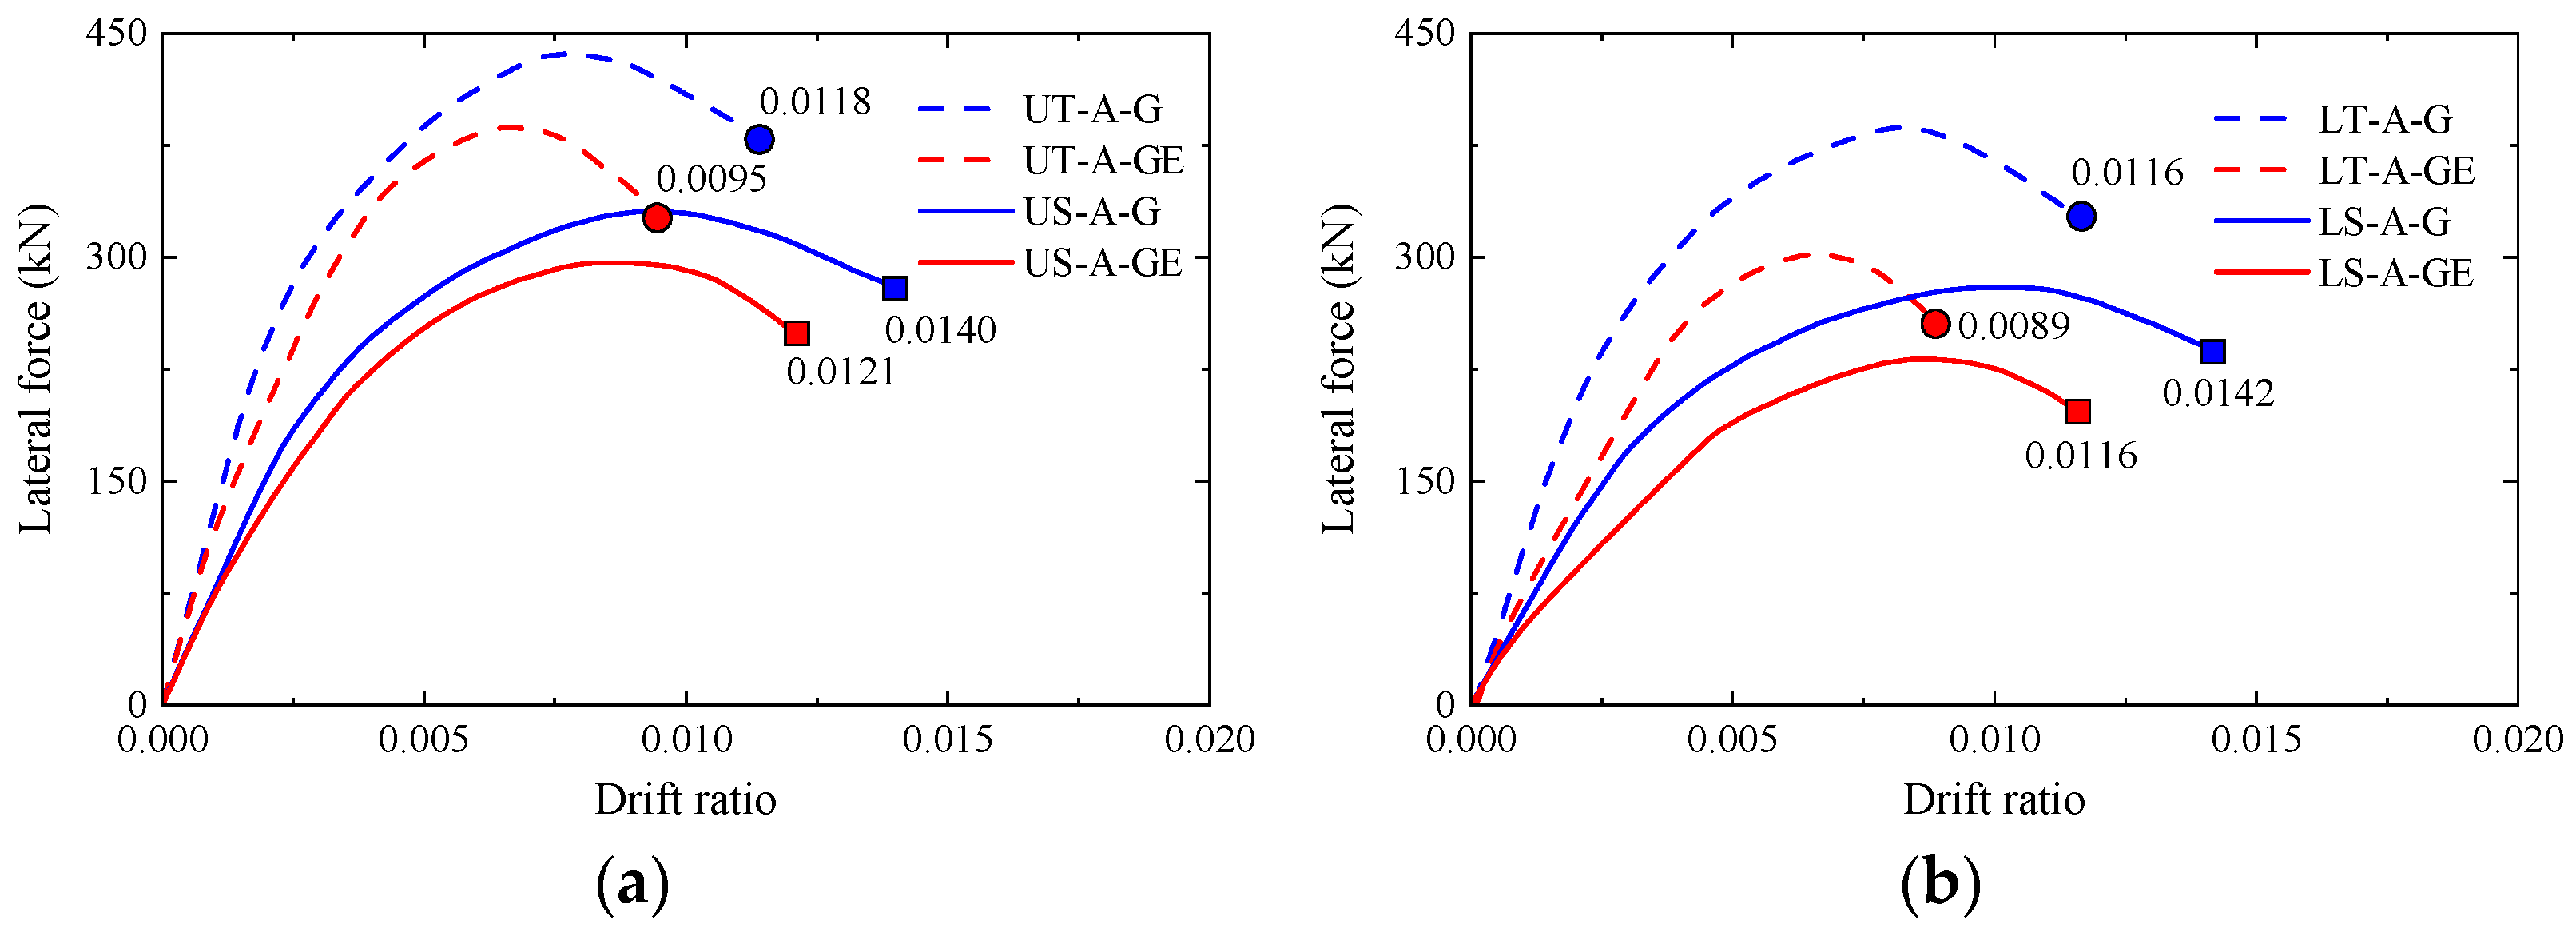
Figure 10.
Lateral force–drift ratio curves of columns by Mode B. (a) Upper column. (b) Lower column.
Figure 10.
Lateral force–drift ratio curves of columns by Mode B. (a) Upper column. (b) Lower column.

Figure 11.
Concrete damage to the columns by Mode A. (a) UT-A-GE. (b) US-A-GE. (c) LT-A-GE. (d) LS-A-GE.
Figure 11.
Concrete damage to the columns by Mode A. (a) UT-A-GE. (b) US-A-GE. (c) LT-A-GE. (d) LS-A-GE.
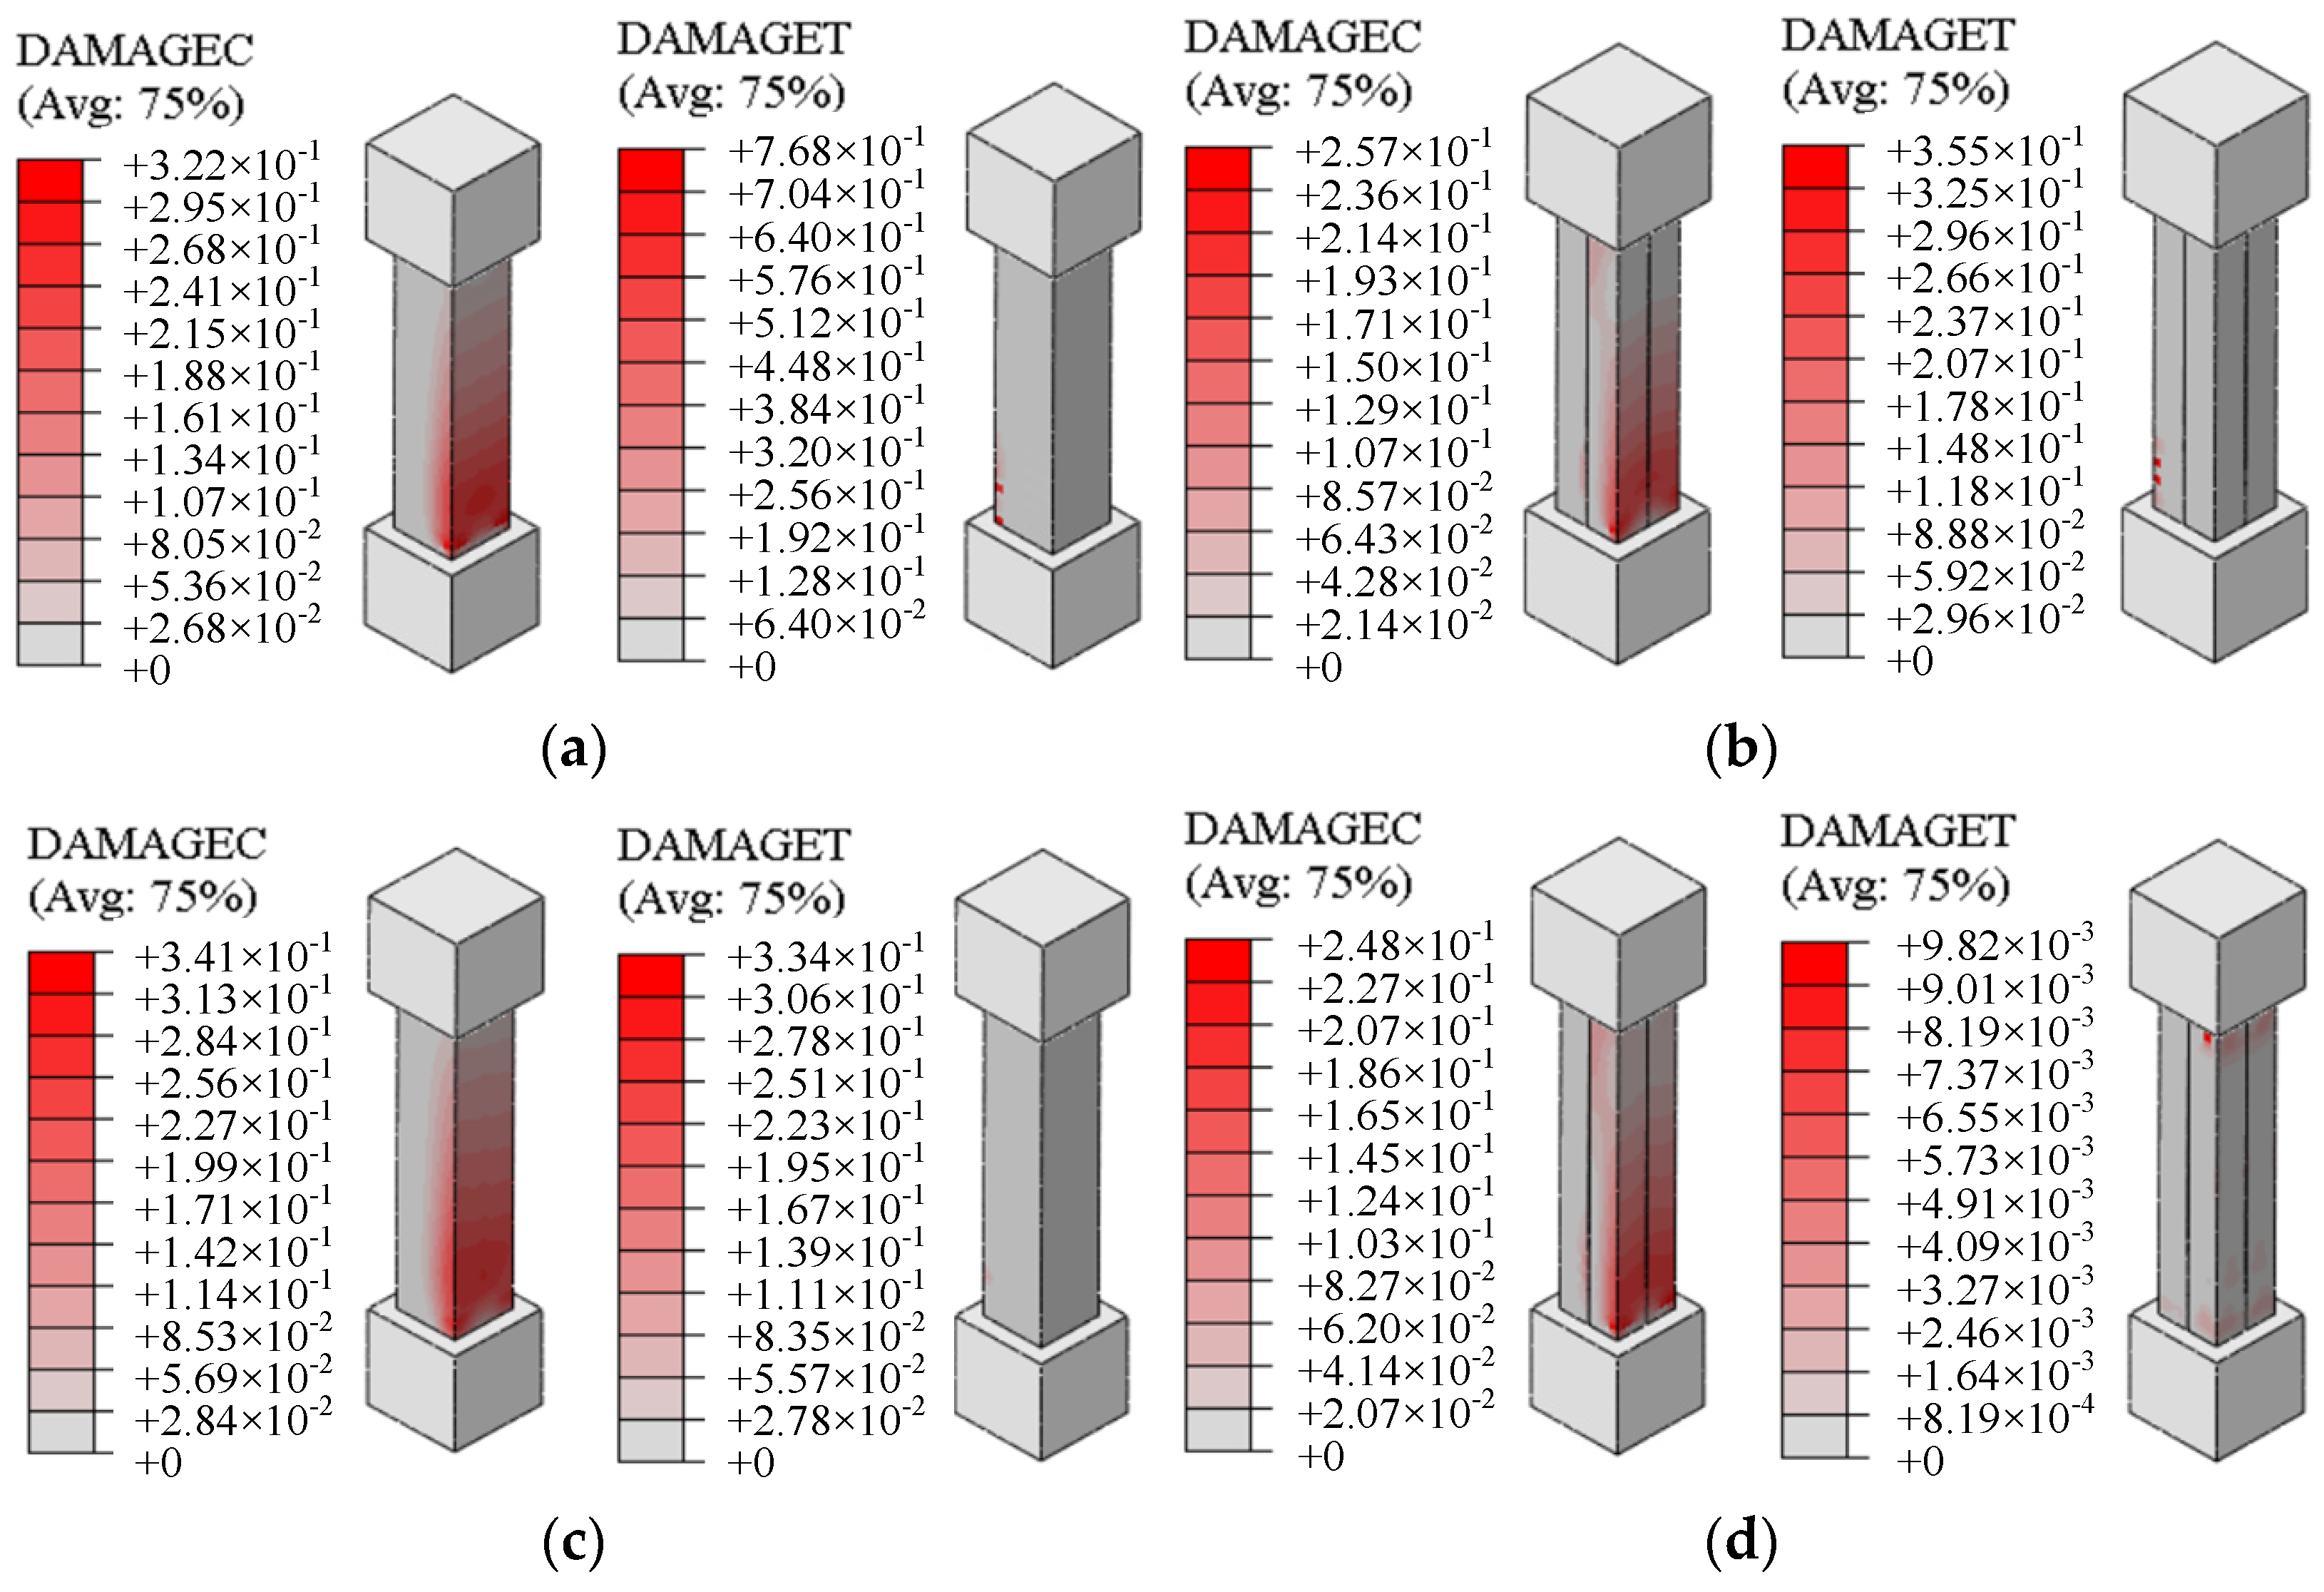
Figure 12.
Concrete damage to the columns by Mode B. (a) UT-B-GE. (b) US-B-GE. (c) LT-B-GE. (d) LS-B-GE.
Figure 12.
Concrete damage to the columns by Mode B. (a) UT-B-GE. (b) US-B-GE. (c) LT-B-GE. (d) LS-B-GE.
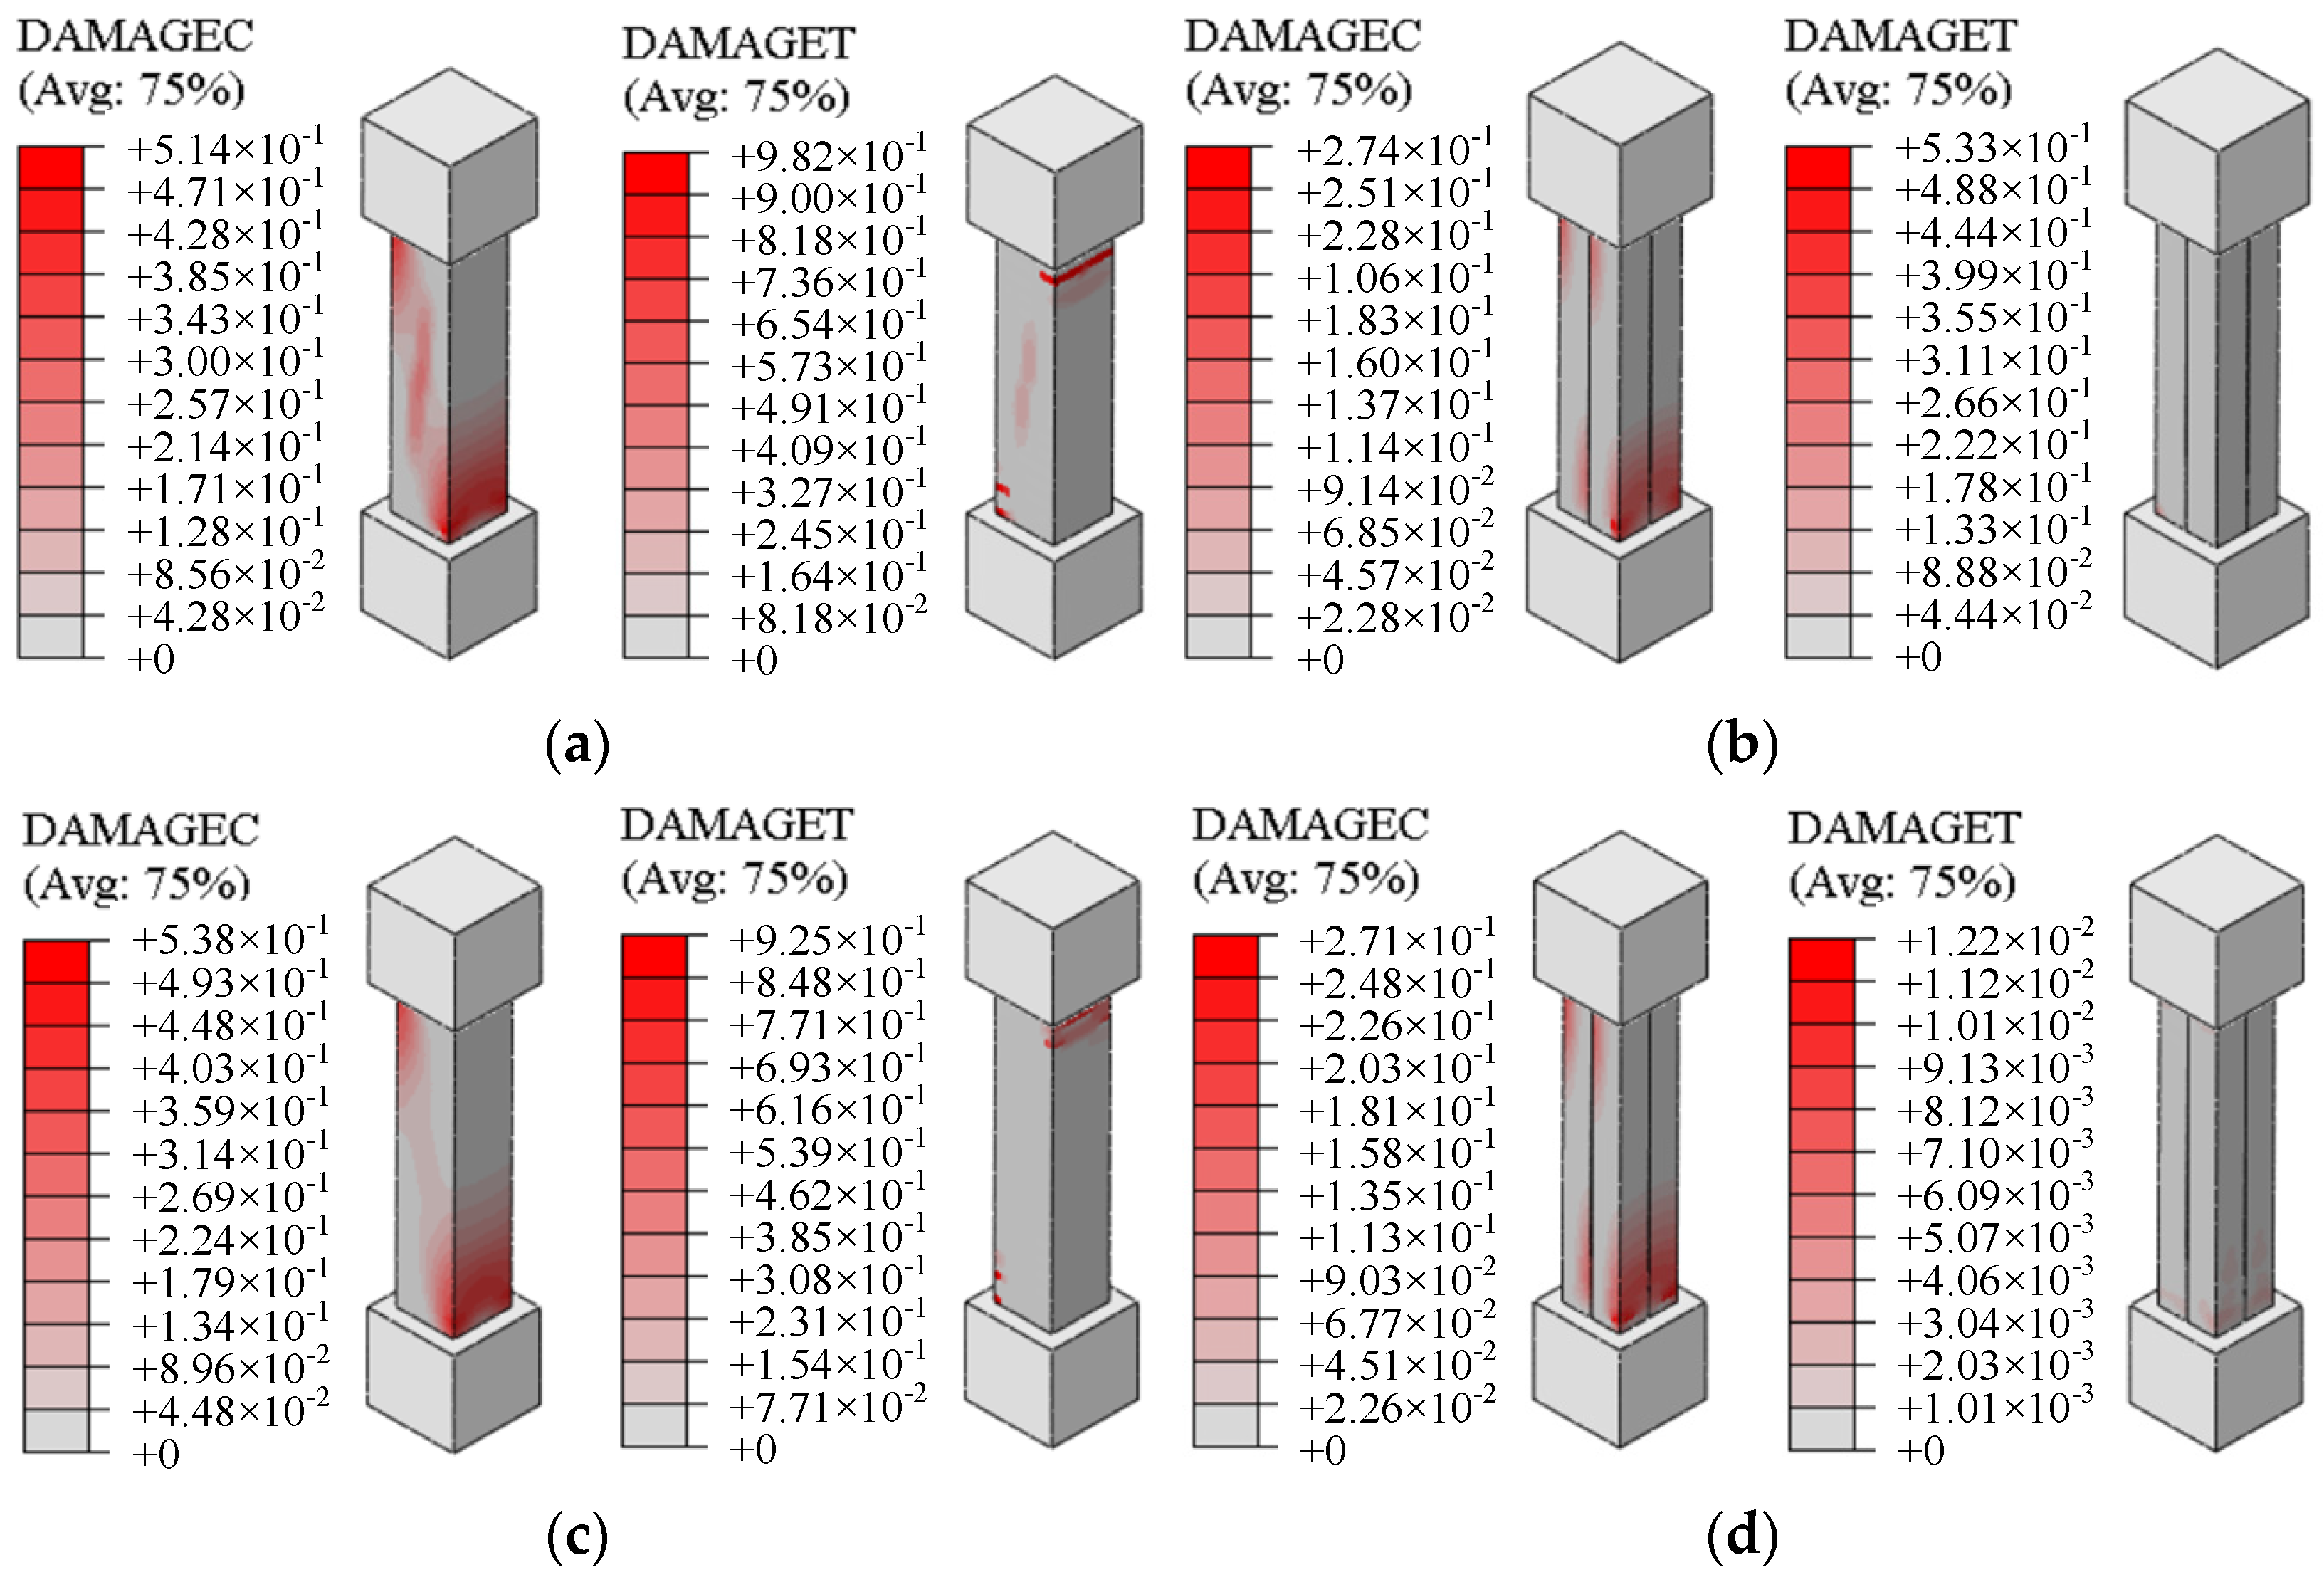
Figure 13.
Pushover modes of the soil–structure system.

Figure 14.
Lateral force–drift ratio curves of columns in the soil–structure system under gravity. (a) Upper column. (b) Lower column.
Figure 14.
Lateral force–drift ratio curves of columns in the soil–structure system under gravity. (a) Upper column. (b) Lower column.

Figure 15.
Lateral force–drift ratio curves of columns in the soil–structure system under gravity and vertical earthquake effect. (a) Upper column. (b) Lower column.
Figure 15.
Lateral force–drift ratio curves of columns in the soil–structure system under gravity and vertical earthquake effect. (a) Upper column. (b) Lower column.
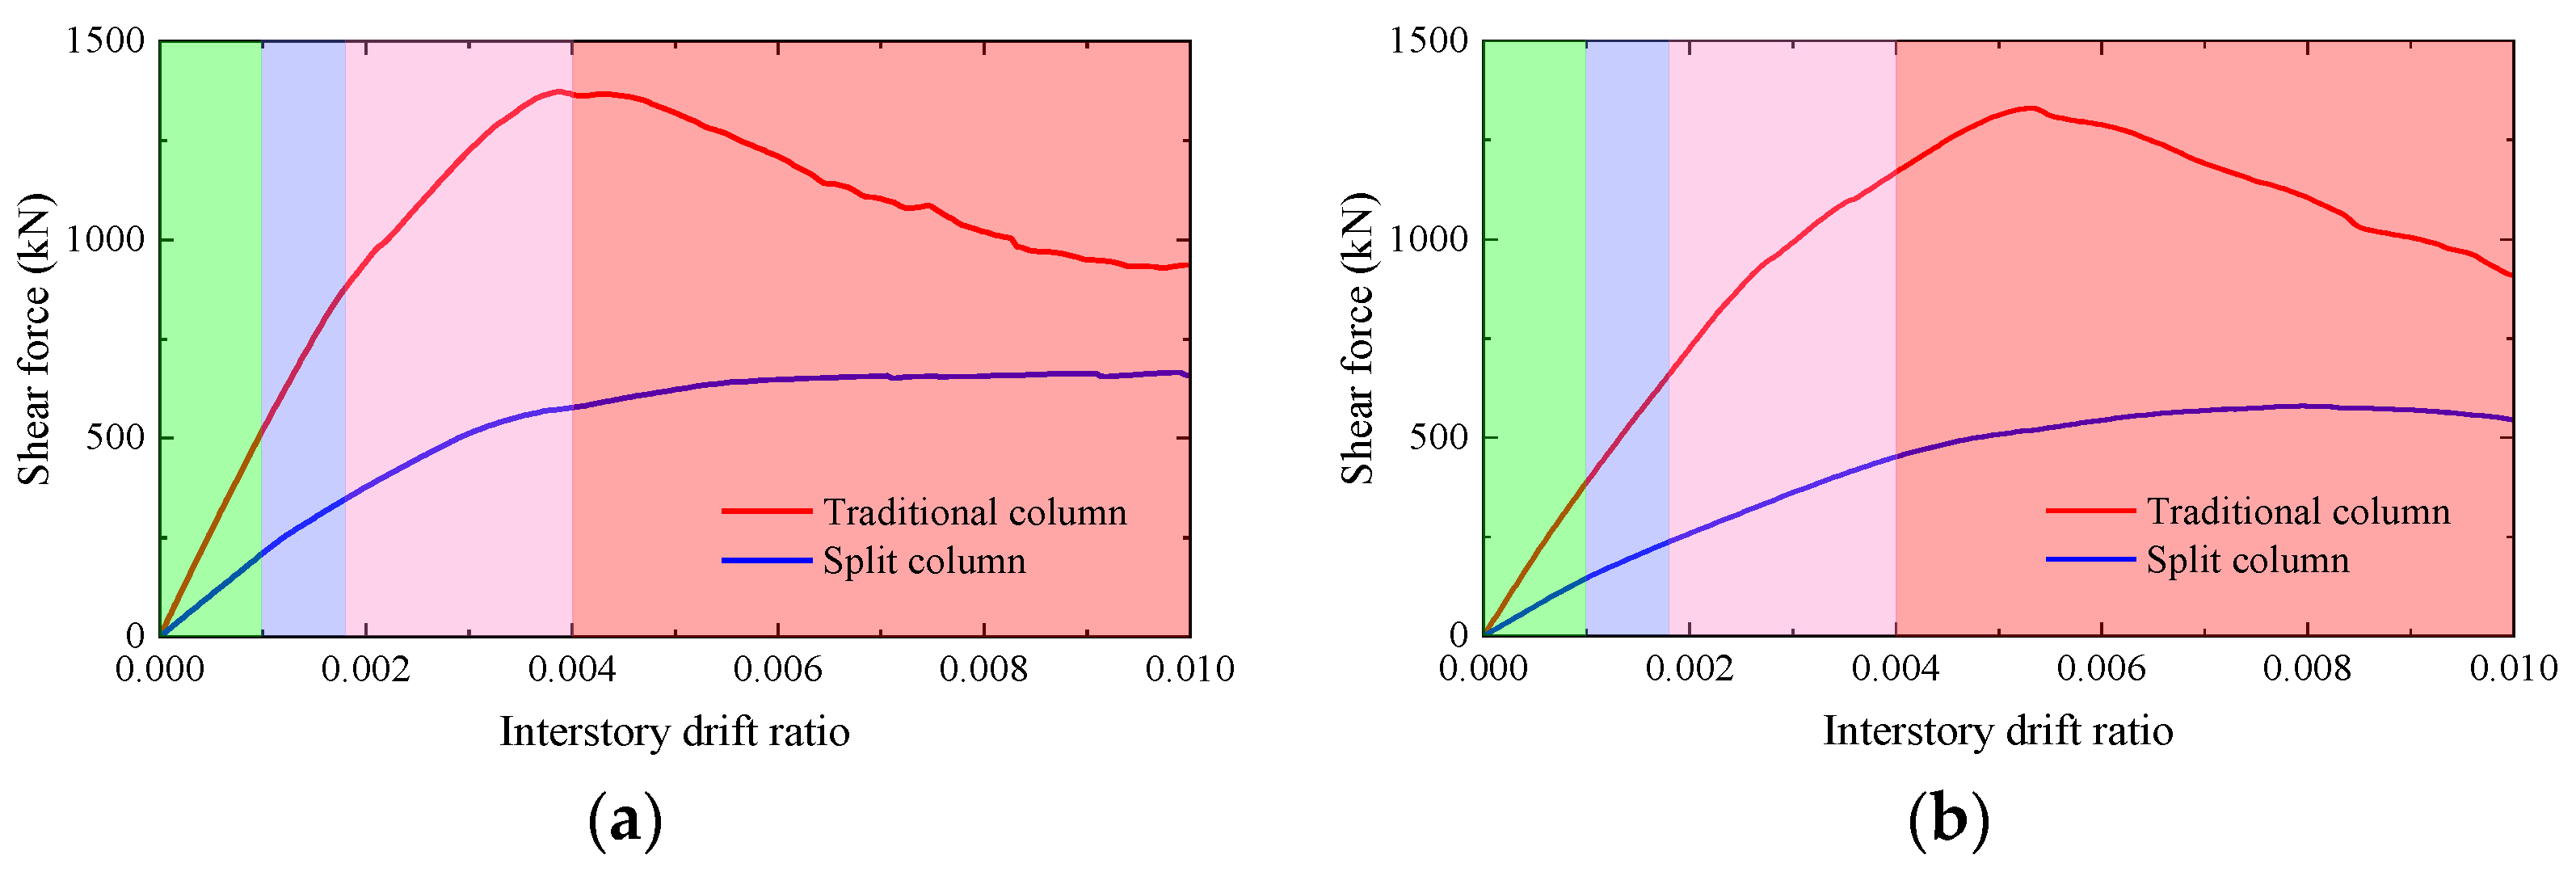
Figure 16.
Equivalent plastic strain development of concrete in the center column. (a) Upper traditional column. (b) Upper split column. (c) Lower traditional column. (d) Lower split column.
Figure 16.
Equivalent plastic strain development of concrete in the center column. (a) Upper traditional column. (b) Upper split column. (c) Lower traditional column. (d) Lower split column.


Table 1.
Material properties of the concrete.
| Parameters | Value | Parameters | Value |
|---|---|---|---|
| Density | 2450 kg/m3 | Limited compressive yield stress | 20.1 MPa |
| Elastic modulus | 30 GPa | Initial tensile yield stress | 2.4 MPa |
| Poisson’s ratio | 0.18 | Compression stiffness recovery parameter | 1 |
| Dilation angle | 36.31° | Tensile stiffness recovery parameter | 0 |
| Initial compressive yield stress | 13 MPa |
Table 2.
Compressive stress and damage factor versus plastic strain of the concrete.
| Plastic Strain | Compressive Stress (MPa) | Compressive Damage Factor | Plastic Strain | Compressive Stress (MPa) | Compressive Damage Factor |
|---|---|---|---|---|---|
| 0 | 14.64 | 0 | 2.4 × 10⁻³ | 17.25 | 0.566 |
| 4.0 × 10⁻⁴ | 17.33 | 0.113 | 3.6 × 10⁻³ | 12.86 | 0.714 |
| 8 × 10⁻⁴ | 19.44 | 0.246 | 5.0 × 10⁻³ | 8.66 | 0.824 |
| 1.2 × 10⁻³ | 20.10 | 0.341 | 7.5 × 10⁻³ | 6.25 | 0.922 |
| 1.6 × 10⁻³ | 20.18 | 0.427 | 1.0 × 10⁻² | 3.98 | 0.969 |
| 2.0 × 10⁻³ | 18.72 | 0.501 |
Table 3.
Tensile stress and damage factor versus cracking displacement of the concrete.
| Cracking Displacement (mm) | Tensile Stress (MPa) | Tensile Damage Factor | Cracking Displacement (mm) | Compression Stress (MPa) | Tensile Damage Factor |
|---|---|---|---|---|---|
| 0 | 2.400 | 0 | 0.308 | 0.219 | 0.944 |
| 0.066 | 1.617 | 0.381 | 0.351 | 0.147 | 0.965 |
| 0.123 | 1.084 | 0.617 | 0.394 | 0.098 | 0.978 |
| 0.173 | 0.726 | 0.763 | 0.438 | 0.066 | 0.987 |
| 0.220 | 0.487 | 0.853 | 0.482 | 0.042 | 0.992 |
Table 4.
Parameters of soils.
| Soil Layer | Thickness (m) | Density (kg/m3) | Shear Wave Speed (m/s) | Poisson’s Ratio | A | B | γ0 (10−4) |
|---|---|---|---|---|---|---|---|
| Soil layer I | 4 | 1900 | 200 | 0.3 | 1.02 | 0.35 | 4.0 |
| Soil layer II | 4 | 1950 | 260 | 0.3 | 1.05 | 0.34 | 3.5 |
| Soil layer III | 4 | 1980 | 310 | 0.3 | 1.10 | 0.35 | 3.8 |
| Soil layer IV | 8 | 1950 | 335 | 0.3 | 1.10 | 0.35 | 3.8 |
| Soil layer V | 10 | 2000 | 430 | 0.3 | 1.10 | 0.35 | 3.8 |
| Soil layer VI | 10 | 2100 | 520 | 0.3 | 1.20 | 0.35 | 2.5 |
Table 5.
The pushover analysis of the working conditions of the center column.
| Case | Column | Cross Section | Pushover Mode | Horizontal Load |
|---|---|---|---|---|
| UT-A-G | upper | traditional | Mode A | Gravity |
| UT-A-GE | upper | traditional | Mode A | Gravity and earthquake load |
| UT-B-G | upper | traditional | Mode B | Gravity |
| UT-B-GE | upper | traditional | Mode B | Gravity and earthquake load |
| US-A-G | upper | split | Mode A | Gravity |
| US-A-GE | upper | split | Mode A | Gravity and earthquake load |
| US-B-G | upper | split | Mode B | Gravity |
| US-B-GE | upper | split | Mode B | Gravity and earthquake load |
| LT-A-G | lower | traditional | Mode A | Gravity |
| LT-A-GE | lower | traditional | Mode A | Gravity and earthquake load |
| LT-B-G | lower | traditional | Mode B | Gravity |
| LT-B-GE | lower | traditional | Mode B | Gravity and earthquake load |
| LS-A-G | lower | split | Mode A | Gravity |
| LS-A-GE | lower | split | Mode A | Gravity and earthquake load |
| LS-B-G | lower | split | Mode B | Gravity |
| LS-B-GE | lower | split | Mode B | Gravity and earthquake load |
Disclaimer/Publisher’s Note: The statements, opinions and data contained in all publications are solely those of the individual author(s) and contributor(s) and not of MDPI and/or the editor(s). MDPI and/or the editor(s) disclaim responsibility for any injury to people or property resulting from any ideas, methods, instructions or products referred to in the content. |
© 2024 by the authors. Licensee MDPI, Basel, Switzerland. This article is an open access article distributed under the terms and conditions of the Creative Commons Attribution (CC BY) license (https://creativecommons.org/licenses/by/4.0/).
Share and Cite
MDPI and ACS Style
Xu, Z.; Xia, Z.; Bu, X.; Han, R. Research on Seismic Performance of a Two-Story, Two-Span Underground Subway Station with Split Columns Based on the Quasi-Static Method. Appl. Sci. 2024, 14, 4077. https://doi.org/10.3390/app14104077
AMA Style
Xu Z, Xia Z, Bu X, Han R. Research on Seismic Performance of a Two-Story, Two-Span Underground Subway Station with Split Columns Based on the Quasi-Static Method. Applied Sciences. 2024; 14(10):4077. https://doi.org/10.3390/app14104077
Chicago/Turabian StyleXu, Zigang, Zongyao Xia, Xiangbo Bu, and Runbo Han. 2024. "Research on Seismic Performance of a Two-Story, Two-Span Underground Subway Station with Split Columns Based on the Quasi-Static Method" Applied Sciences 14, no. 10: 4077. https://doi.org/10.3390/app14104077
Note that from the first issue of 2016, this journal uses article numbers instead of page numbers. See further details here.