
Large-Scale Fire Tests of Battery Electric Vehicle (BEV): Slovak Case Study


1
Department of Fire Engineering, Faculty of Security Engineering, University of Zilina, Univerzitná 8215/1, 01026 Žilina, Slovakia
2
Fire Corps, Drieňová 22, 82686 Bratislava, Slovakia
*
Author to whom correspondence should be addressed.
Appl. Sci. 2024, 14(10), 4013; https://doi.org/10.3390/app14104013
Submission received: 21 February 2024
/
Revised: 9 April 2024
/
Accepted: 30 April 2024
/
Published: 9 May 2024
(This article belongs to the Special Issue Advanced Technologies in Environment Protection and Environmental Risk Assessment)
Abstract
:Due to the increasing number of battery electric vehicles (BEV) on the roads and the number of BEV accidents with the occurrence of a fire, full-scale fire tests of BEVs were carried out. For initiation, the BEVs were mechanically damaged, forming a gap with a size of 15 cm × 15 cm. The external heat source was a 300 kW propane burner with a maximum power of 54.0 kW and a length of 54 cm. The flame of the propane–butane fuel mixed in air at a temperature of 1970 °C was inserted directly into the battery pack. The increase in the temperature was monitored as a function of time through thermocouples at selected locations of the BEV until the point of initiation. Thermocouples were placed 10, 30, and 50 cm from the place of BEV surface. Accordingly, to obtain the temperature–time curves from the experiment measurement, critical temperatures were subsequently evaluated. The fire tests on BEVs can be described according to the individual phases of the fire. The external heat source started the initiation process at the 25 min time mark. Consequently, the phase of a developed fire with a dynamic course started. A sharp rise in temperature occurred. Within two minutes, the temperature rose to 1056.9 °C. After the initiation source was removed, there was decline in temperature and re-ignition to the stage of a fully developed fire. Thermocouples recorded temperatures in the range of 900 °C. The resulting dynamic process of a BEV fire with a sharp increase in temperature is a problem for the implementation of firefighting works and the liquidation of traffic accidents. Furthermore, foam extinguishing was part of the experiments. In both cases after the foam application, the temperature on the thermocouple T1 (distance was 10 cm from the surface of the BEV) dropped from 486.1 °C to 76 °C after 10 s of application.
1. Introduction
The use of LIBs is increasing due to the increase in the consequences of climate change, but also because of their secondary uses and the search for the ways for their effective disposal [1]. The issue of BEV safety against various factors comes into focus. One of the dominant risks is fire in BEVs in cases of undesirable and unpredictable events. The problem of BEV fire safety is also growing due to different classifications and views on the implementation of safety rules. American legislation (OSHA) favors the classification of EV traction batteries rather than mixtures, whereas European legislation considers lithium-ion EV traction batteries to be in accordance with the REACH regulation mainly as products [2]. Practice shows that many companies, even without legal obligation, prepare and provide Safety Data Sheets for lithium EV traction batteries [3]. SDS usually provide information on storage and manipulation. However, SDS also provide information on the chemical composition and possible hazards. Currently, mainly three types of LIBs are used [4]: Firstly, NCA–Nickel-Cobalt-Aluminum, which have a high energy density and a higher price, which is why they are used in electric cars of higher classes with a long range where every kilowatt hour of capacity matters. Secondly, NMC–Nickel-Manganese-Cobalt, which is also denoted by the abbreviation NMC. They have similar properties to NCA. And lastly, LiFePO4-Lithium-Iron-Phosphate, also known as LFP. They are safer and less expensive than NCA and NMC batteries, as they do not contain nickel or cobalt, but at the same time, they have a lower energy density.
There are several different energy storage systems (lithium ion batteries) in which lithium is used in its pure or bound form. In principle, there are distinguished primary (charging) and secondary (recharging) cells in EV traction batteries. In general, the secondary (recharging) cells are lithium-ion accumulators, which are the subject of scientific research [2,5]. It is a type of rechargeable battery composed of a fixed structure with four main parts: a cathode, an anode, a separator, and an electrolyte [6]. According to (Table 1):
- A positive electrode made of an intercalation material that has the ability to bind lithium ions.
- Negative electrode, made of a porous type of carbon.
- A separator that separates the positive and negative electrodes.
- The electrolyte, the role of which is to ensure the transfer of charge (ion) between the electrodes.
The NMC cathode is one of the most successful cathode combinations on the market [7,8]. From a chemical point of view, it is Li[NixCoyMnz] [O]2 (where 0 <x < 1, 0 < y < 1, 0 < z < 1, x + y + z = 1) including NCM333 (x:y:z = 3:3:3), NCM433 (4:3:3), NCM532 (5:3:2), NMC622 (6:2:2), and NCM811 (8:1:1), which were developed to improve the electrochemical properties [9,10]. The key to success lies in the right combination of nickel and manganese.

| Parameters | LIB Cathode Material | ||||
|---|---|---|---|---|---|
| Abbreviation/designation | LFP | LMO | LCO | NCM | NCA |
| Formula | LiFePO4 | LiMn2O4 | LiCoO2 | Li(NixCoyMnz)O2 | LiNi0.8Co0.15Al0.05O2 |
| Average voltage (V) | 3.2 (working range 2.5–3.65) | 3.7 (range 3–4.2) | 3.7 (range 3–4.2) | 3.6 (range 3–4.2) | 3.6 |
| Specific capacity * (mAh.g−1) | 130–140 | 100–120 | 135–150 | 160–220 | 180_200 |
| Cyclical life *, (100% DoD) | 2000–5000 1000–2000 | 300–700 500–2000 | 500–1000 | 800–2000 1000–2000 | 800–2000 |
| Safety performance * | excellent | good | low | low | low |
| Specific energy (Wh.kg−1) | 90–120 | 100–150 | 150–200 | 150–220 | 200–260 |
| Charging current (C) | 0.7–1 | 0.7–1 | 0.7–1 | 0.7–1 | 1 |
| Discharge current (C) | 1 | 1 | 1 | 1 | 1 |
| Application | Loads requiring high current and endurance. | Medical devices, electric drives. | Mobile phones, tablets, laptops. | Electric bicycles, healthcare, industry. | Healthcare, electric drives. |
| Comment | Safety, increased self-discharge. | High performance, safer than LCO. | High specific energy, high price Co. | High capacity and performance. | Similar properties to LCO. |
* [12].
Nickel is known for its high specific energy but poor stability. Manganese has the advantage of forming a spinel structure, thanks to which its low internal resistance and stability are achieved, but at the cost of a low specific energy. The combination of these two materials enhances each other’s strengths. The positive electrode combination is typically one-third nickel, one-third manganese, and one-third cobalt (NMC333). These three active materials can be easily mixed to suit a wide range of applications for automotive and energy storage systems (ESS) that need frequent cyclic charging [13]. They are also the target group of our research.
In addition to the degradation of the structure of the cathode materials, one of the main reasons for the failure of Ni-rich cathodes during cycling above 4.2 V is also the parasitic reaction arising from the interactions between the electrolytes and the highly reactive de-lithated cathodes. Even the listed materials—cathodes—are listed as products and have an SDS prepared like in references [14,15].
Electrolytes serve as a medium for the transfer of ionic charge. The electrolyte consists of an organic solvent and a conductive lithium salt (LiPF6). Although there are many possible solvents, lithium hexafluorophosphate (LiPF6) is almost exclusively used as the conductive salt. The exact chemical composition of the respective solvent mixture is usually a secret of the manufacturer. However, it is possible to find an overview of the components used by viewing the various data sheets. The flash point of the solvent components ranges from +160 °C to slightly below 0 °C. This explains the thermal instability of the lithium battery [2]. Conductive salt, e.g., also contains fluorine (F). The release of hydrofluoric acid (HF) in unconcentrated form can also lead to various dangerous situations with a damaged lithium battery.
In LIBs, the separator is a critical component with the function of preventing electronic contact and ensuring Li-ion transport between the two electrodes during battery operation. In addition to the requirement of wettability and porous properties, the required membrane should have high chemical/electrochemical stability, high thermal stability, and excellent mechanical properties to ensure a safe and reliable LIB (Table 3).
In general, common separators for LIBs (Table 3) are polyolefin membranes such as poly-ethylene (PE) and polypropylene (PP), but they would melt at temperatures of 130 and 170 °C [16]. During the melting process, the micropores of the separators are destroyed, isolating the path of Li-ions between the electrodes, and drastically increasing the internal resistance of the LIB [17]. If the separator is melted, an internal short will occur, which can lead to a lot of heat and trigger thermal leaks [16,18].
Table 3.
Switch-off temperatures and melting temperatures of various polyethylene (PE), polypropylene (PP), and three-layer hybrid PP/PE/PP membranes [1,19].
| Parameters | Membrane Composition of the Separator | ||||
|---|---|---|---|---|---|
| PE | PP | PP/PE/PP | PVDF | PE/PVDF | |
| Temperature of thermal degradation (°C) | 130–133 | 156–163 | 134–135 | ||
| Melting point (°C) | 139 | 162 | 165 | ||
| Thickness (μm) | 20 | 25–26 | |||
Depending on the required capacity and performance, the battery consists of several cells [1].
In the normal range of voltages and temperatures, only “shuttle transport of Li+” occurs in the electrolyte during insertion/extraction cycles at the cathode and anode. Under high temperature and high voltage conditions, the electrochemical reactions become more complex, namely, the decomposition of the solid electrolyte interface film at the anode, oxygen release at the cathode side, and other parasitic electrolyte/electrode side reactions. Decomposition of the SEI film and interfacial reactions initially accelerate the temperature rise, increasing the risk of oxygen release from active cathode materials [13]. These reactions eventually lead to LIB thermal runaway, which causes the battery to rupture and explode due to the reaction of the hot combustible gases from the battery with the ambient oxygen [20].
An illustrative explanation of thermal runway BEV was provided by Shahid and Chaab [21]. They refer to the thermal runway as “the phenomenon of exothermic chain reactions within the battery”. These reactions usually cause a sharp increase in the internal battery temperature, causing the inner structures of the battery to destabilize and degrade, which can lead to the total failure of the battery [21]. They also interpret the mechanism of the thermal runway with the subsequent promotion and method of extinguishing them, with an overview of already published studies. The Electrochemical Safety Research Institute [22] lists thermal runaway as one of the main risks associated with lithium-ion batteries. It is a phenomenon in which the lithium-ion cell enters an uncontrollable self-heating state [22].
Thermal runaway is the worst safety issues of BEVs [23,24]. Figure 1 shows the origin of thermal runaway in EV traction batteries, including electrolyte side reactions, the cathode, anode, and interfacial reactions at the electrode surface and Li plating. These side reactions are triggered by mechanical, thermal, and electrical damage (the term misuse is also often used). Breakdown of the separator and evolution of oxygen from the cathode side are the main causes of thermal runaway in batteries (as shown by the solid line in Figure 1—d). There are five types of causes of this phenomenon called “thermal runaway”, which are shown in Figure 1.
They are as follows:
- In the second type, separator defects (due to heat-induced shrinkage or mechanical damage) create short circuits in the battery and rapid discharge of the energy stored in it [26], accompanied by unwanted chemical chain reactions and the release of enormous amounts of heat.
- The third type is electrical abuse [27]. Electrolyte decomposition occurs at the cathode interface, especially at a high state of charge (SOC). This leads to the accumulation of heat and the subsequent release of oxygen from the cathode and damage to the separator.
- The fifth type occurs when the battery is mechanically damaged, resulting in a short circuit and/or air infiltration into the battery [30].
The main causes of battery safety accidents among these five categories are short circuits due to separator damage, and electrical and mechanical misuse [31].
Several studies have been devoted to the research of thermal runaway from the point of view of its causes [32,33,34,35,36,37,38].
Furthermore, MacNeil et al. [39] did a series of fire tests on BEV cars and batteries that were equipped with multiple thermocouples, voltage sensors, heat flow meters, smoke detectors, and gas sampling lines to UL 2580 [40] (minimum 590 °C, in 5 min, burning for 20 min, no explosions).
BEV car fire tests are in the spotlight [41] due to the current increase in the number of mentioned vehicles on the road. Sturm et al. [42] conducted experimental investigations during the safety project: fire tests with battery cells; fire tests with battery modules; and fire tests with BEVs, including a survey of firefighting procedures. Heat release and production of (toxic) substances were evaluated in a series of fire tests. Cui et al. [43] studied and addressed vehicle fires caused by lithium-ion batteries with thermal runaway. Their maximum external flame temperature achieved was 843.6 °C, and the maximum compartment flame temperature was 696.8 °C. Hodges et al. [44] summarized the published results of car fire tests, including BEVs, with peak HRR, THR, H, and loss mass results obtained. Moreover, fire tests on BEVs were carried out by Lecocq et al. [45], Watanabe et al. [46], Willstrand et al. [47], and Hynynen et al. [48].
Jaguemont and Bardé [49] discuss the issue of BEV test standardization in detail. They offer a list of the main security standards for LIBs. They also present tests labeled as “Thermal tests” that are focused on thermal heating and local heating. Jaguemont and Bardé [49] report the standard UL-9540A:2019 Test Method for the Evaluation of Thermal Leakage Propagation in Battery Energy Storage Systems [50].
This paper designs a full-scale fire experiment to explore the fire evolution process and characteristics of growth temperature. The aim of the article is to present the behavior of a mechanically damaged NMC battery that was subsequently exposed to an external initiation source. Monitoring the increase in temperature by the thermocouples at selected points near to the damage of the BEV served to monitor the origin and development of a BEV fire test.
2. Materials and Methods
2.1. Description of Samples–BEV with Lithium-Ion Cells
Two variants of full-scale tests were done on the same NMC EV traction battery model (Table 4).
2.2. Preparation and Course of the Experiment
The experiment was not conducted in accordance with any standard. The experiment was carried out at the selected fire station by Fire Corps Slovak Republic. During the preparation and performance of the experiment, the necessary safety instructions and occupational health and safety instructions were observed.
Kang et al. [41] experimentally verified the quantification of BEV fires using approximately 30 MJ/kg average effective heat of combustion. Kang et al. [41], in this context, emphasized the durability of LIB packaging, where it is a high property (approx. 45.9 MJ/kg), which is comparable to the properties of flammable fuels (e.g., n-pentane with 45.69 MJ/kg). Therefore, the method of mechanical damage to the cover of the LIB package was chosen to conduct the experiments.
Initially, a non-flammable surface was prepared. Thereafter, an experimental container was prepared (bath). Lastly, the LIB pack housing of the batteries were inserted into the container and mechanically damaged (Figure 2). Two gaps (size 15 cm × 15 cm) were created in the BEV. They are marked with number 1 and number 2 in Figure 2. The experimental data were collected at 1 s intervals. The specific locations of these sensors are shown in Figure 2. Three thermocouples were placed in each gap.
Thermocouples (type K thermocouples) were used to monitor temperatures. The placement of the thermocouples was based on expert discussion and knowledge gained from other experiments [51,52,53].
The first gap in the BEV had 2 thermocouples to measure temperatures inside and 1 thermocouple next to the gap:
- Thermocouple T3 (marked in blue) measured the temperature at a height of 30 cm above the BEV and at 50 cm from the red thermocouples (Figure 2a).
The same procedure was followed for the second gap. The position of thermocouples T1 and T2 in the hole is shown in green (Figure 2b).
The conditions of the experiment are shown in Table 5.
2.3. The Course of the Experiment
Kvasha et al. [54] did not observe a propagation effect, even with an internal or external explosion. He stated that heat leakage in one cell will not cause heat leakage in neighboring cells.
The explosion-proof design and performance of the BEV power supply should meet the IEC 60,079 standard, and the explosion-proof cavity in which the batteries were placed should withstand a static pressure of at least 1.5 MPa. Said barrier should prevent thermal runaway [55].
Some authors [54,55] indicate the limit pressure necessary to incite a thermal runway to be 0.8 MPa. Mechanical damage was carried out by manually removing the outer metal cover of the BEV, which had a size of 15 cm × 15 cm, and then applying a 300 kW propane burner with a maximum power of 54.0 kW and length of 54 cm to the encapsulated lithium-ion battery (LIB). The internal environment of the encapsulated package was not specified (atmosphere: air plus flammable gases). The flame of the propane–butane fuel mixed with air at a temperature of 1970 °C [56,57]. The application of thermal source was defined as the experiment start time. The pressure relief valve of the battery pack broke at 25 min in Test 1, and the battery pack began to release white smoke. Subsequently, the initiator was removed.
3. Results
3.1. Results of BEV Large-Scale Fire Test 1
The experiments were carried out under atmospheric conditions (Table 5), with intention to repeat the full-scale fire test on the BEV.
The experiment started at 09:50:30 with the real-experimental time = 0 s. At the beginning of the experiment, the external source of a 300 kW propane burner was inserted into the damaged LIB (Figure 3a). The process of heating took 25 min, and its subsequent initiation was accomplished at 10:15:00 (Figure 3b).
The temperature–time curves (Figure 4) quantify the events taking place during the experiment.
The most interesting temperature development is on thermocouple T1, located 10 cm above the edge of the damaged cover. After 25 min, the temperature on thermocouple T1 increased by 80 °C within 10 s. Then, for the next 10 s, it increased by 250 °C. Furthermore, within next 10 s, temperature raised again by 250°, and within 1 min, reached a temperature of 900 °C (Figure 5). Within next 30 s, the temperature reached a value of 1009 °C, and after another 10 s, it reached the maximum temperature of the experimental fire, 1056.9 °C (Figure 5). Thermocouple T2 copied the values of thermocouple T1 with a time delay of 1 m 50 s, because its position is 20 cm further from the place of initiation of the EV traction battery. Based on the values of the thermocouple T3, we can conclude that the released heat does not spread at 50 cm during the observed time interval.
The 3 min interval of the developed fire (Figure 6) was ended by removing the external 300 kW propane burner from the damaged part of the electric battery. This fact was automatically reflected in the temperature values measured using thermocouples T1 and T2 (Figure 5).
Interestingly, the temperature course on thermocouple T3 was placed at a distance of 50 cm from gap 1. A slight temperature jump (92 °C) on thermocouple T3 occurred in the 38th minute. At the indicated time, the secondary development of the fire occurred, which passed into the phase of a fully developed fire (Figure 7). Thermocouples T1 maintained a temperature of more than 900 °C, and T2 maintained a temperature of more than 750 °C.
After 59 min real experimental time, a sharp drop in temperature (76.5 °C) occurred in thermocouple T1. Again, a time delay (60 s) appeared on thermocouple T2. It is possible to assume that the combustible components (electrolyte, cathode) present in the electric battery burned, and from that time point, the temperature dropped to the ambient temperature. The exception was with thermocouple T1, where the temperature dropped to 43.3 °C.
3.2. Results of BEV Large-Scale Fire Test 2
The second experiment started at 11:38:04. The initiation phase—ignition—lasted until 11:42:00. Afterwards, the initiation temperature rose to 1028 °C within 10 s. The temperature was maintained for almost 30 s. Then, there followed a drop in temperature at an average of 100 °C a minute. The process lasted until 11:47:04, or a total of 5 min.
Why did such a change occur during the experiment? We assume that:
- The experiment was initiated on the second opening of the same EV traction battery, and a larger amount of released heat could already have been accumulated in the internal volume.
Also, in this experiment, thermocouple 2 recorded an increase in temperature (T2) with a 2 min delay, as in the case of Test 1.
Photo documentation (Figure 9) with a high-speed camera captured a 2 min moment of a sharp increase in temperature in the fire with accompanying effects. The color scale of the flame shows the burning process of Li-ions; after they burn out, the flame stabilizes to a luminous one.
Jaguemont and Bardé [49] wrote about the test of fire propagation by UL 2580 [40]. The conditions defined for the test were: the fully charged assembly is placed in the middle of the fire source; within 5 min of ignition, a minimum temperature of 590 °C should be reached and maintained for 20 min. The fire test BEV 2 fulfills the stated conditions.
4. Discussion
Comparisons of the results of these two experiments can be extensively discussed. In the beginning, it seemed that it made no sense. But, after studying the results, we came to an interesting conclusion. The course of the BEV fire was the same in both tests, regardless of the initial conditions. They differed primarily over time.
The common result of the obtained experiments is a sharp increase in temperature above 1000 °C within 2 min. In the first experiment, it was 1056.9 °C, and in the second experiment, it was 1028 °C, regardless of their initiation time.
In Figure 10a, we see a mutual comparison of temperatures (T1) in thermocouple 1 in real time. The above comparison shows a significant difference in the heating of the EV traction battery and the initiation time. The point is to point out the same sharp increase in temperature in a short time following the initiation. That is why, in Figure 10b, the curves are shown without real-time acceptance. The initiation point and temperature rise are shown.
Another common result is a 2 min delay in the temperature rise of T2, while the time–temperature curves of thermocouple 2 copy the course of the temperature rise of T1 in both cases. It could be concluded that, in both cases, the same heat release occurs in the same time regime. Voigt et al. [51] conducted fire tests on BEVs with two different batteries. The maximum temperatures in the tests reached values above 1000 °C for both types of batteries. Voigt et al. [51] used a pool fire (size: 0.5 m2, 60 L Ethanol) as an initiator. Nevertheless, the Battery Pack Type A test with the same parameters listed in Table 2 had the same temperature flow pattern as in the case of our first test. Two-stage thermal course was due to re-ignition.
Lastly, a common phenomenon is the method of extinguishing using a selected foam. The last monitored phase in the experiments was the extinguishing process (Figure 11). Test 1 was completed by applying the selected foam. A sharp drop in temperature from 486.1 °C to 76.5 °C was observed after 10 s of application on thermocouple T1, as seen in Figure 11. The second thermocouple registered a smooth decrease in T2 from 450 °C to 77 °C within 1 min 40 s. This is another delay in the event due to the remote location of the thermocouple from the source of the fire. Thermocouple 3 recorded the temperature changes of T3. At 50 cm from the source of the fire, there was no increase or decrease in temperature. The average value ranged from 70 °C to the ambient temperature.
The extinguishing in Test 2 used the same foam as Test 1, and has a comparable extinguishing process. On thermocouple 1, a drop in temperature (T1) from 720 °C to 97 °C was recorded within 40 s. The drop in temperature 2 was much smoother and took longer (Figure 11a,b).
It is difficult to compare the results of this research with the research of other authors. For example, Kang et al. [41] conducted a series of full-scale fire experiments about the thermal behaviors of battery electric vehicle (BEV) fires. The placement of the thermocouples for the abovementioned experiments was in the cabin for passengers, in the engine compartment, in the trunk, and in the tires. Additional thermocouples were additionally installed inside the LIB packs to observe the heat progress among internal LIB modules. Voltmeters were used to monitor the voltage drop of the modules to confirm thermal leakage.
5. Conclusions
Experiments on the full-scale fire tests of BEVs were one of the pilot tests carried out by firefighters in the Slovak Republic. The original experimental data obtained are difficult to verify and repeat.
On the experimental research, the following results were obtained:
- A mechanically damaged BEV (with intentionally made holes in the steel casing) could be initiated by an external initiator to the stage of a developed fire.
- An external 300 kW propane burner with a maximum power of 54 kW and a length of 54 cm, inserted directly into the battery pack, was initiated in fire test BEV 1 after 25 min. Fire test BEV 2 had a faster course of initiation due to the accumulation of flammable gases in the BEV.
- In both tests, a temperature above 1000 °C was reached. In the first test, the temperature reached 1056.9 °C just 2 min after the initiation. In the second test, the abovementioned process was repeated, and the maximum temperature reached was 1028 °C.
- When extinguishing the fire test BEV with foam, the temperature on thermocouple T1 (distance was 10 cm from the BEV surface) dropped from 486.1 °C to 76 °C after 10 s of application.
In the fully developed fire of Test 2, the temperature values obtained in the first test (above 1000 °C) were not reached. We are aware of the limits of our research, the deliberate method of initiation, and the limitations of the thermocouples used.
Despite this fact, we offer interesting results and a demonstration of the temperature increase in the event of a BEV fire. In the future, it is necessary to include radiometers in the measurements so that we can show the amount of HRR, THR, calorimetric value, and loos mass released. In this case, we only assume that, in both cases, the same heat release occurs in the case of the initiation of the BEV.
Author Contributions
Conceptualization, Z.T. and P.T.; methodology, J.S.; formal analysis, I.M.; investigation, J.S., Z.T., P.T. and K.S.; resources, I.M.; data curation, J.S. and K.S.; writing—original draft preparation, I.M.; writing—review and editing, I.M. and K.S.; visualization, I.M.; project administration, K.S. All authors have read and agreed to the published version of the manuscript.
Funding
This article was supported by Institute Grant of University of Žilina No. 12716 and the Cultural and Educational Grant Agency of the Ministry of Education, Science, Research and Sport of the Slovak Republic.
Institutional Review Board Statement
Not applicable.
Informed Consent Statement
Not applicable.
Data Availability Statement
No new data were created or analyzed in this study. Data sharing is not applicable to this article.
Conflicts of Interest
The authors declare no conflict of interest.
References
- Chen, Y.; Kang, Y.; Zhao, Y.; Wang, L.; Liu, J.; Li, Y.; Liang, Z.; He, X.; Li, X.; Tavajohi, N.; et al. A review of Lithium-Ion Battery Safety Concerns: The Issues, Strategies, and Testing Standards. J. Energy Chem. 2021, 59, 83–99. [Google Scholar] [CrossRef]
- Denios. Available online: https://www.denios.sk/servis/denios-know-how/sprievodca-bezpecnym-skladovanim-li-ion-baterii (accessed on 4 January 2024). (In Slovak).
- Batterie Spit Pulsa 800. Safety Data Sheet. Available online: https://www.itw.cz/file/EP/CS-FDS-Batterie-Li-Ion-P800.pdf (accessed on 8 January 2024). (In Czech).
- Electrend. Available online: https://legrand.sk/electrend/elektroinstalacie/ake-trendy-prinasa-akumulacia-elektrickej-energie/ (accessed on 8 January 2024). (In Slovak).
- Liu, K.; Liu, Y.; Lin, D.; Pei, A.; Cui, Y. Materials for lithium-ion battery safety. Sci. Adv. 2018, 4, eaas9820. [Google Scholar] [CrossRef] [PubMed]
- Liu, X.; Ren, D.S.; Hsu, H.J.; Feng, X.N.; Xu, G.L.; Zhuang, M.H.; Gao, H.; Lu, L.G.; Han, X.B.; Chu, Z.Y.; et al. Thermal Runaway of Lithium-Ion Batteries without Internal Short Circuit. Joule 2018, 2, 2047–2064. [Google Scholar] [CrossRef]
- Zhu, L.; Yan, T.-F.; Jia, D.; Wang, Y.; Wu, Q.; Gu, H.-T.; Wu, Y.-M.; Tang, W.-P. LiFePO4-Coated LiNi0.5Co0.2Mn0.3O2 Cathode Materials with Improved High Voltage Electrochemical Performance and Enhanced Safety for Lithium Ion Pouch Cells. J. Electrochem. Soc. 2019, 166, A5437. [Google Scholar] [CrossRef]
- Abe, Y.; Sawa, K.; Tomioka, M.; Watanabe, R.; Yodose, T.; Kumagai, S. Electrochemical performance of LiNi1/3Co1/3Mn1/3O2 cathode recovered from pyrolysis residue of waste Li-ion batteries. J. Electroanal. Chem. 2022, 922, 116761. [Google Scholar] [CrossRef]
- Bak, S.; Hu, E.; Zhou, Y.; Yu, X.; Senanayake, S.D.; Cho, S. Structural Changes and Thermal Stability of Charged LiNixMnyCozO2 Cathode Materials Studied by Combined in situ time-resolved XRD and Mass Spectroscopy. ACS Appl. Mater. Interfaces 2014, 6, 22594–22601. [Google Scholar] [CrossRef] [PubMed]
- Liang, C.P.; Kong, F.; Longo, R.C.; KC, S.; Kim, J.-S.; Jeon, S.; Choi, S.; Cho, K. Unraveling the Origin of Instability in Ni-rich LiNi1−2xCoxMnxO2 (NCM) Cathode Materials. J. Phys. Chem. C 2016, 120, 6383–6393. [Google Scholar] [CrossRef]
- Vilhelm, O. Composite Electrode Materials for Lithium-ion Batteries Based on LiFePO4. Diploma Ph.D. Thesis, Brno University of Technology, Faculty of Electrical Engineering and Communication, Brno, Czech Republic, 2011. (In Czech). [Google Scholar]
- Vavrus, B. New Trends in Stationary Battery Storage for a Family House. Bachelor‘s Thesis, Brno University of Technology, Faculty of Electrical Engineering and Communication, Brno, Czech Republic, 2018. (In Czech). [Google Scholar]
- Belharouak, I.; Lu, W.; Liu, J.; Vissers, D.; Amine, K. Thermal Behavior of Delithiated Li(Ni0.8Co0.15Al0.05)O2 and Li1.1(Ni1/3Co1/3Mn1/3)0.9O2 Powders. J. Power Sources 2007, 174, 905–909. [Google Scholar] [CrossRef]
- Cathode NCM 532. Safety Data Sheet. Available online: https://www.neicorporation.com/msds/NANOMYTE_BE-52E_NMC532_tape_SDS.pdf (accessed on 10 January 2024).
- Targray. NMC Battery Material. Available online: https://www.targray.com/li-ion-battery/cathode-materials/nmc (accessed on 10 January 2024).
- Chung, Y.S.; Yoo, S.H.; Kim, C.K. Enhancement of Meltdown Temperature of the Polyethylene Lithium-ion Battery Separator via Surface Coating with Polymers Having High Thermal Resistance. Ind. Eng. Chem. Res. 2009, 48, 4346–4351. [Google Scholar] [CrossRef]
- Orendorff, C.J. The role of Separators in Lithium-Ion Cell Safety. Electrochem. Soc. Interface 2012, 21, 61–65. [Google Scholar] [CrossRef]
- Wang, Q.S.; Sun, J.H. Enhancing the Safety of Lithium Ion Batteries by 4-isopropyl phenyl diphenyl phosphate. Mater. Lett. 2007, 61, 3338–3340. [Google Scholar] [CrossRef]
- Luo, L.; Gao, Z.; Zheng, Z.; Zhang, J. “Polymer-in-Ceramic” Membrane for Thermally Safe Separator Applications. ACS Omega 2022, 7, 35727–35734. [Google Scholar] [CrossRef] [PubMed]
- Kang, Y.; Liang, Z.; Zhao, Y.; Xu, H.; Qian, K.; He, X.; Li, T.; Li, J. Large-scale Synthesis of Lithium- and Manganese-rich Materials with Uniform Thin-film Al2O3 Coating for Stable Cathode Cycling. Sci. China Mater. 2020, 63, 1683–1692. [Google Scholar] [CrossRef]
- Shahid, S.; Agelin-Chaab, M. A review of thermal runaway prevention and mitigation strategies for lithium-ion batteries. Energy Convers. Manag. 2022, X, 100310. [Google Scholar] [CrossRef]
- Electrochemical Safety Research Institute. What is Thermal Runaway? Available online: https://ul.org/research/electrochemical-safety/getting-started-electrochemical-safety/what-thermal-runaway (accessed on 25 March 2024).
- Zhao, C.; Wang, T.; Huang, Z.; Wu, J.; Zhou, H.; Ma, M.; Xu, J.; Wang, Z.; Li, H.; Sun, J.; et al. Experimental study on thermal runaway of fully charged and overcharged lithium-ion batteries under adiabatic and side-heating test. J. Energy Storage 2021, 38, 102519. [Google Scholar] [CrossRef]
- Mallick, S.; Gayen, D. Thermal behavior and thermal runaway propagation in lithium-ion battery systems—A critical review. J. Energy Storage 2023, 62, 106894. [Google Scholar] [CrossRef]
- Jung, R.; Metzger, M.; Maglia, F.; Stinner, C.; Gasteiger, A.H. Oxygen Release and Its Effect on the Cycling Stability of LiNix MnyCozO2 (NMC) Cathode Materials for Li-Ion Batteries. J. Electrochem. Soc. 2017, 164, 1361–1377. [Google Scholar] [CrossRef]
- Wang, J.; Hu, Z.; Yin, X.; Li, Y.; Huo, H.; Zhou, J.; Li, L. Alumina/Phenolphthalein Polyetherketone Ceramic Composite Polypropylene Separator Film for Lithium Ion Power Batteries. Electrochim. Acta 2015, 159, 61–65. [Google Scholar] [CrossRef]
- Ren, D.; Feng, X.; Lu, L.; Ouyang, M.; Zheng, S.; Li, J.; He, X. An Electrochemical-thermal Coupled Overcharge-to-thermal-runaway Model for Lithium Ion Battery. J. Power Sources 2017, 364, 328–340. [Google Scholar] [CrossRef]
- Tarascon, J.M.; Armand, M. Issues and Challenges Facing Rechargeable Lithium Batteries. Nature 2001, 414, 359–367. [Google Scholar] [CrossRef]
- Kim, S.H.; Choi, K.H.; Cho, S.J.; Park, J.S.; Cho, K.Y.; Lee, C.K.; Lee, S.B.; Shim, J.K.; Lee, S.Y. A Shape-deformable and Thermally Stable Solid-state Electrolyte Based on a Plastic Crystal Composite Polymer Electrolyte for Flexible/safer Lithium-Ion Batteries. J. Mater. Chem. A 2014, 2, 10854–10861. [Google Scholar] [CrossRef]
- Liu, B.; Jia, Y.; Yuan, C.; Wang, L.; Gao, X.; Yin, S.; Xu, J. Safety Issues and Mechanisms of Lithium-Ion Battery Cell upon Mechanical Abusive Loading: A review. Energy Storage Mater. 2020, 24, 85–112. [Google Scholar] [CrossRef]
- Feng, X.; Ouyang, M.; Liu, X.; Lu, L.; Xia, Y.; He, X. Thermal Runaway Mechanism of Lithium ion Battery for Electric Vehicles: A review. Energy Storage Mater. 2018, 10, 246–267. [Google Scholar] [CrossRef]
- Rieh, J.S. Devices and Applications. Compr. Semicond. Sci. Technol. 2011, 5, 1–51. [Google Scholar]
- Zhang, Z.J.; Ramadass, P.; Fang, W. 18—Safety of Lithium-Ion Batteries. In Lithium-Ion Batteries; Pistoia, G., Ed.; Elsevier: Amsterdam, The Netherlands, 2014; pp. 409–435. [Google Scholar]
- Ziebert, C.; Melcher, A.; Lei, B.; Zhao, W.; Rohde, M.; Seifert, H.J. Chapter Six—Electrochemical—Thermal Characterization and Thermal Modeling for Batteries. In Micro and Nano Technologies, Emerging Nanotechnologies in Rechargeable Energy Storage Systems; Rodriguez-Martinez, L.M., Omar, N., Eds.; Elsevier: Amsterdam, The Netherlands, 2017; pp. 195–229. [Google Scholar]
- Warner, J.T. Lithium-ion battery operation. In Lithium-Ion Battery Chemistries 2019; Chapter 3; Elsevier: Amsterdam, The Netherlands, 2019; pp. 43–78. [Google Scholar]
- Pfrang, A.; Kriston, A.; Ruiz, V.; Lebedeva, N.; di Persio, F. Chapter Eight—Safety of Rechargeable Energy Storage Systems with a focus on Li-ion Technology. In Micro and Nano Technologies, Emerging Nanotechnologies in Rechargeable Energy Storage Systems; Rodriguez-Martinez, L.M., Omar, N., Eds.; Elsevier: Amsterdam, The Netherlands, 2017; pp. 253–290. [Google Scholar]
- Ferg, E.E.; Schuldt, F.; Schmidt, J. The challenges of a Li-ion starter lighting and ignition battery: A review from cradle to grave. J. Power Sources 2019, 423, 380–403. [Google Scholar] [CrossRef]
- Gerlitz, E.; Greifenstein, M.; Kaiser, J.F.; Mayer, D.; Lanza, G.; Fleischer, J. Systematic Identification of Hazardous States and Approach for Condition Monitoring in the Context of Li-ion Battery Disassembly. Procedia CIRP 2022, 107, 308–313. [Google Scholar] [CrossRef]
- MacNeil, D.; Lougheed, G.; Lam, C.; Carbonneau, G.; Kroeker, R.; Edwards, D.; Tompkins, j. Electric Vehicle Fire Testing. In Proceedings of the 8th EVS-GTR Meeting, Washington, DC, USA, 1–5 June 2015. [Google Scholar]
- UL 2580, “Standard for Safety for Batteries for Use in Electric Vehicles,” 1st Edition. NREL U.S. Department of Energy, Office of Energy, Efficiency & Renewable Energy. October 13, 2011. Available online: https://www.nrel.gov/docs/fy13osti/54404.pdf (accessed on 1 November 2012).
- Kang, S.; Kwon, M.; Choi, J.Y.; Choi, S. Full-scale fire testing of battery electric vehicles. Appl. Energy 2023, 332, 120497. [Google Scholar] [CrossRef]
- Sturm, P.; Fo¨ßleitner, P.; Fruhwirt, D.; Galler, R.; Wenighofer, R.; Heindl, S.F.; Krausbar, S.; Hegerf, O. Fire tests with lithium-ion battery electric vehicles in road tunnels. Fire Saf. J. 2022, 134, 103695. [Google Scholar] [CrossRef]
- Cui, Y.; Cong, B.; Liu, J.; Qiu, M.; Han, X. Characteristics and Hazards of Plug-In Hybrid Electric Vehicle Fires Caused by Lithium-Ion Battery Packs With Thermal Runaway. Front. Energy Res. 2022, 10, 878035. [Google Scholar] [CrossRef]
- Hodges, J.L.; Salvi, U.; Kapahi, U. Design fire scenarios for hazard assessment of modern battery electric and internal combustion engine passenger vehicles. Fire Saf. J. 2024, 146, 104145. [Google Scholar]
- Lecocq, A.; Bertana, M.; Truchot, B.; Marlair, G. Comparison of the fire consequences of an electric vehicle and an internal combustion engine vehicle. In Proceedings of the International Conference on Fires in Vehicles-FIVE 2012, Chicago, IL, USA, 27–28 September 2012; Volume 2, pp. 183–194. [Google Scholar]
- Watanabe, N.; Sugawa, O.; Suwa, T.; Ogawa, Y.; Hiramatsu, M.; Tomonori, H.; Miyanoto, H.; Okamoto, K.; Honma, M. Comparison of fire behaviors of an electric-battery-powered vehicle and gasoline-powered vehicle in a real-scale fire test. In Proceedings of the 2nd International Conference on Fires in Vehicles-FIVE 2012, Chicago, IL, USA, 27–28 September 2012; pp. 195–206. [Google Scholar]
- Willstrand, O.; Bisschop, R.; Blomqvist, P.; Temple, A.; Anderson, J. Toxic Gases from Fire in Electric Vehicles; RISE Research Institutes of Sweden: Goteborg, Sweden, 2020.
- Hynynen, J.; Willstrand, O.; Blomqvist, P.; Andersson, P. Analysis of combustion gases from large-scale electric vehicle fire tests. Fire Saf. J. 2023, 139, 103829. [Google Scholar] [CrossRef]
- Jaguemont, J.; Bardé, F. A critical review of lithium-ion battery safety testing and standards. Appl. Therm. Eng. 2023, 231, 121014. [Google Scholar] [CrossRef]
- UL 9540A—Test Method for Evaluating Thermal Runaway Fire Propagation in Battery Energy Storage Systems, 2019. 3th Edition. NREL U.S. Department of Energy, Office of Energy, Efficiency & Renewable Energy. Available online: https://natron.energy/files/resources/natron-ul-9540a-cell-report-revised-july-8-2020-final.pdf (accessed on 8 July 2020).
- Voigt, S.; Sträubig, F.; Palis, S.; Kwade, A.; Knaust, C. Experimental comparison of Oxygen Consumption Calorimetry and Sensible Enthalpy Rise Approach for determining the heat release rate of large-scale lithium-ion battery fires. Fire Saf. J. 2021, 126, 103447. [Google Scholar] [CrossRef]
- Cui, Y.; Liu, J.; Cong, B.; Han, X.; Yin, S. Characterization and assessment of fire evolution process of electric vehicles placed in parallel. Process Saf. Environ. Prot. 2022, 166, 524–534. [Google Scholar] [CrossRef]
- Held, M.; Tuchschmid, M.; Zennegg, M.; Figi, R.; Schreiner, C.; Mellert, L.D.; Welte, U.; Kompatscher, M.; Hermann, M.; Nachef, L. Thermal runaway and fire of electric vehicle lithium-ion battery and contamination of infrastructure facility. Renew. Sustain. Energy Rev. 2022, 165, 112474. [Google Scholar] [CrossRef]
- Kvasha, A.; Gutiérrez, C.; Osa, U.; Meatza, I.; Blazquez, J.A.; Macicior, H.; Urdampilleta, J.I. A comparative study of thermal runaway of commercial lit hium ion cells. Energy 2018, 159, 547–557. [Google Scholar] [CrossRef]
- Meng, L.Y.; Wang, G.F.; See, K.W.; Wang, Y.P.; Zhang, Y.; Zang, C.Y.; Li, S.; Xie, B. Explosion characteristic of CH4–H2-Air mixtures vented by encapsulated large-scale Li-ion battery under thermal runaway. Energy 2023, 278 Pt A, 4376439. [Google Scholar] [CrossRef]
- Marková, I.; Tureková, I. Theory of Fire and Analysis of Products, 1st ed.; EDIS Press UNIZA: Žilina, Slovakia, 2022; 215p. (In Slovak) [Google Scholar]
- Zhang, Y.; Li, Q.; Zhou, H. Chapter 5—Heat Transfer Calculation in Furnaces. In Theory and Calculation of Heat Transfer in Furnaces; Zhang, Y., Li, Q., Zhou, H., Eds.; Academic Press: Cambridge, MA, USA, 2016; pp. 131–172. [Google Scholar]
Figure 1.
Overview of LIB security issues by [1]. Legend: a—unwanted event; b—damages; c—abuses; d—cell structure; e—unwanted reaction.
Figure 1.
Overview of LIB security issues by [1]. Legend: a—unwanted event; b—damages; c—abuses; d—cell structure; e—unwanted reaction.
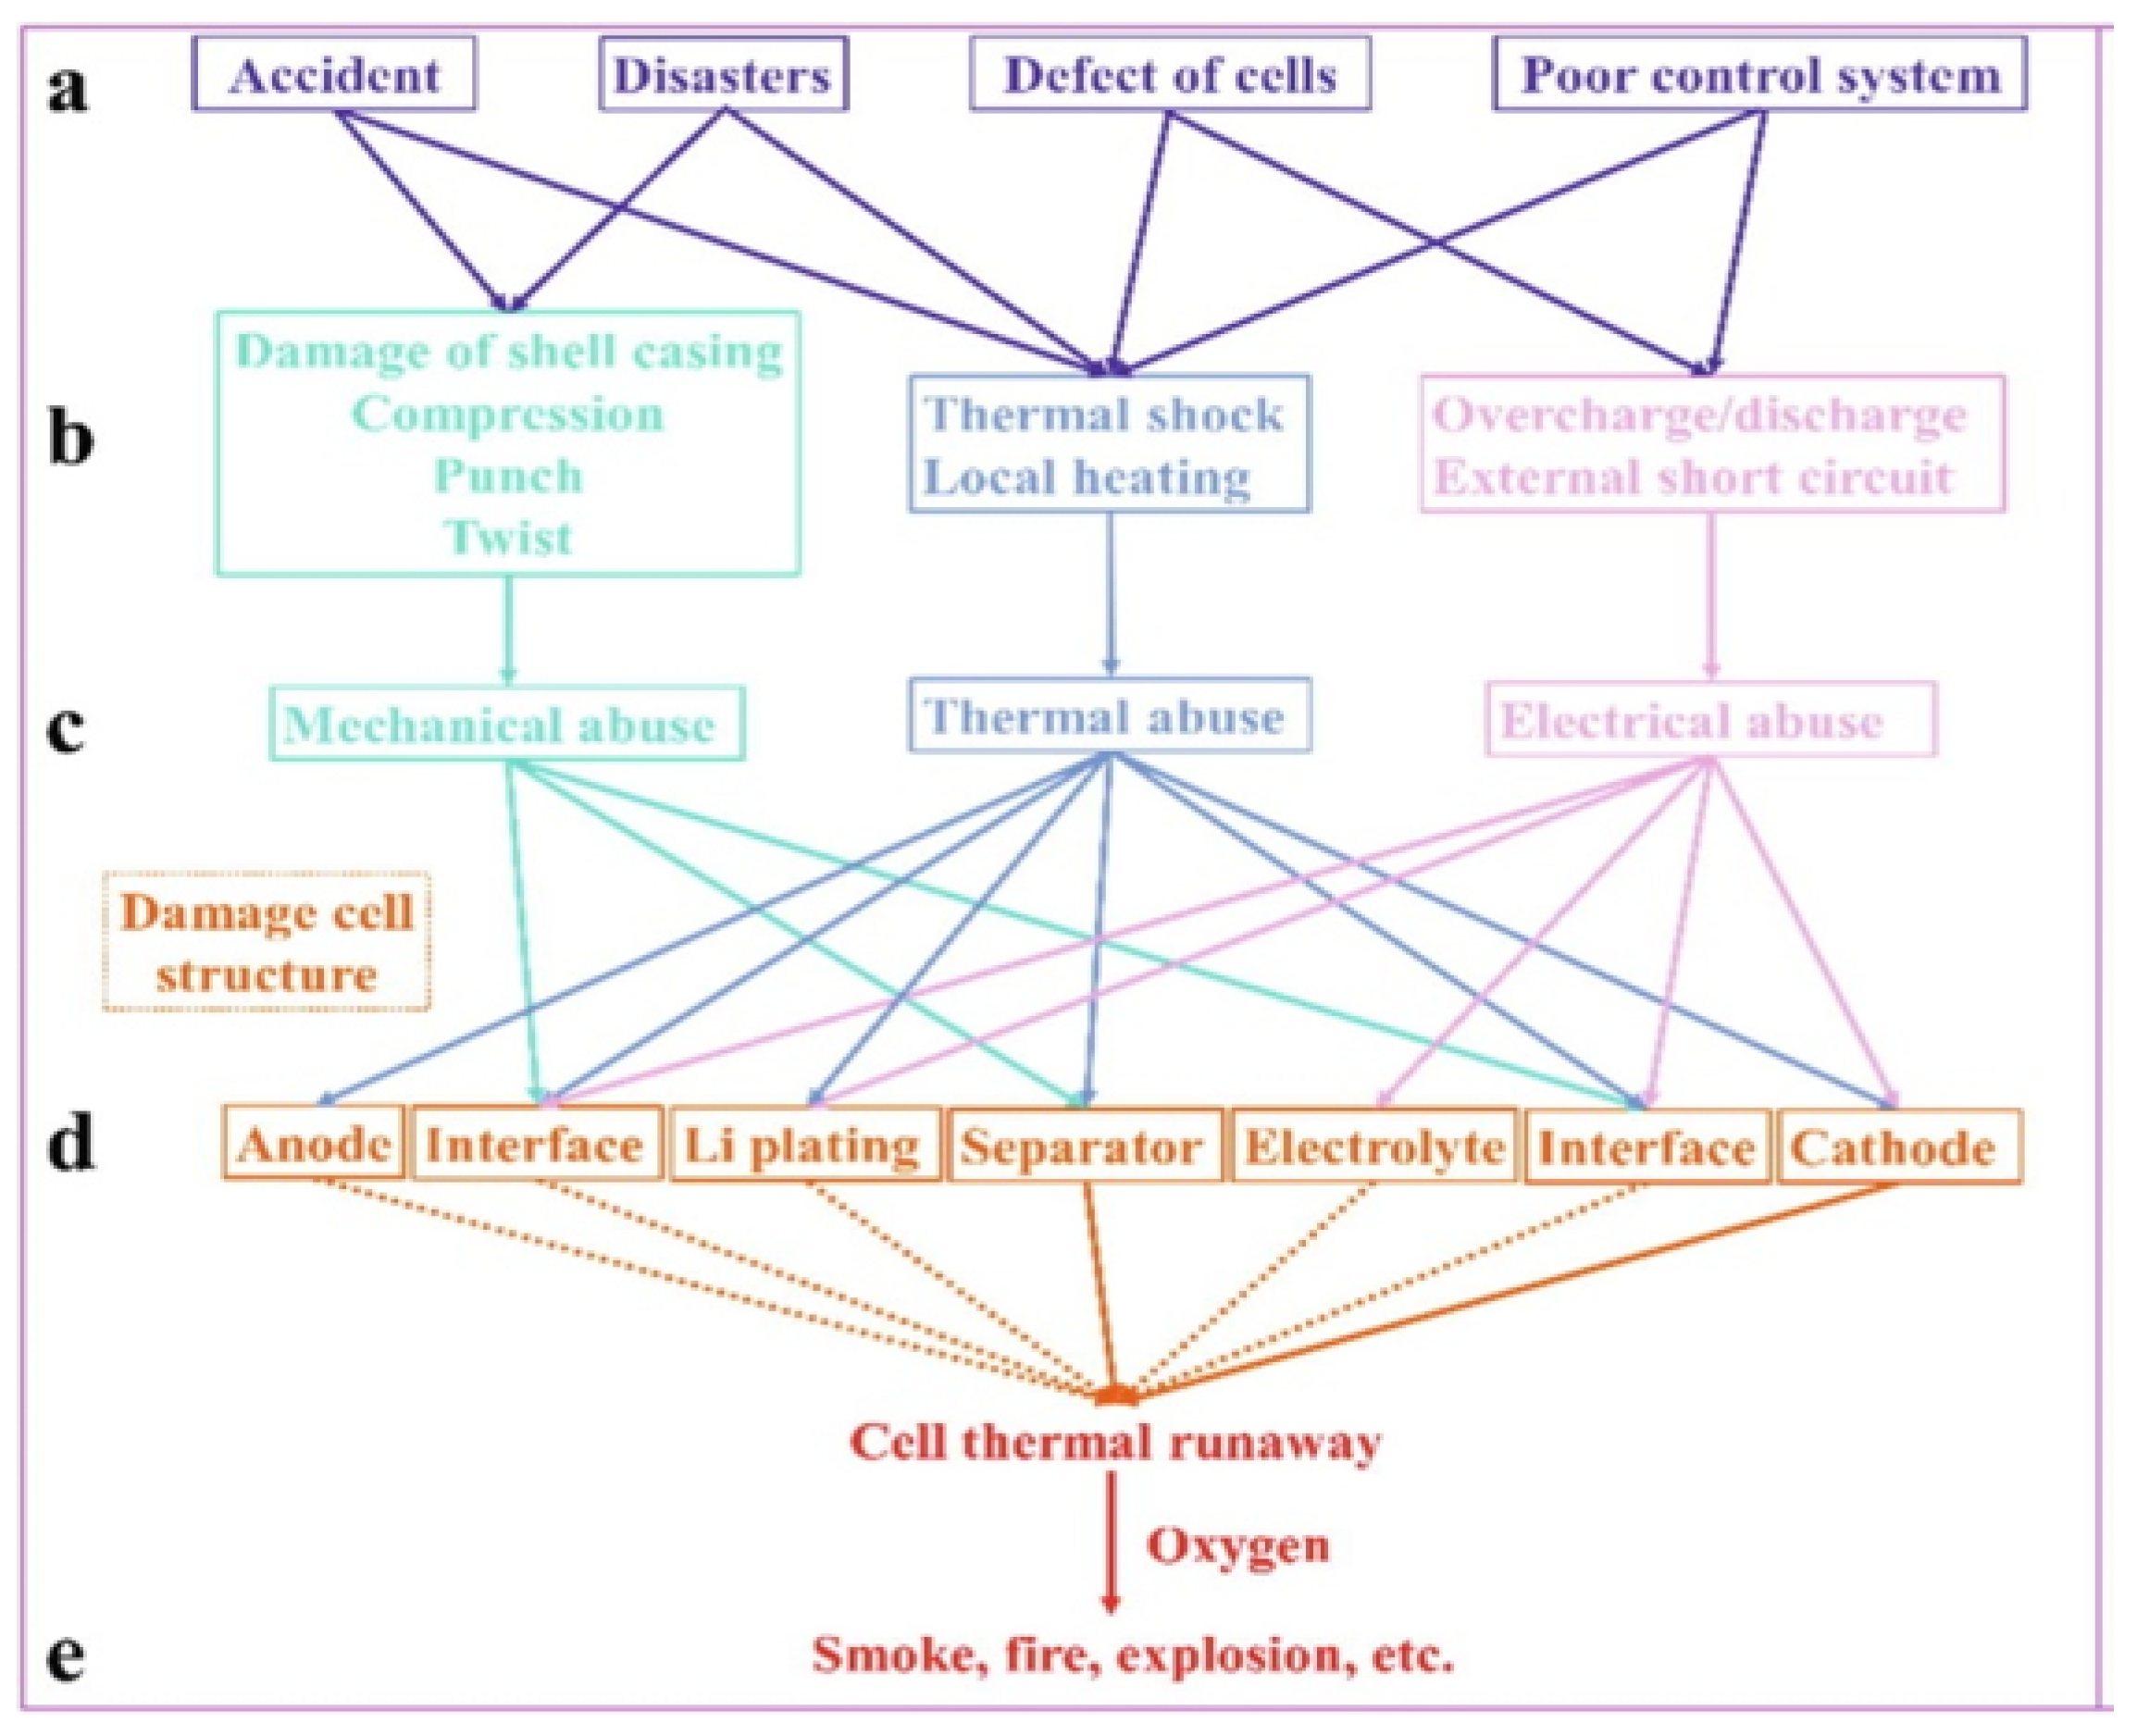
Figure 2.
Scheme: The top view of the BEV placement with the location of the indicated thermocouples. (a) First gap and the location of the red and blue thermocouples; (b) second gap and the location of the blue and green thermocouples; and (c) showing the position of the thermocouples and (d) the mechanical damage of the BEV.

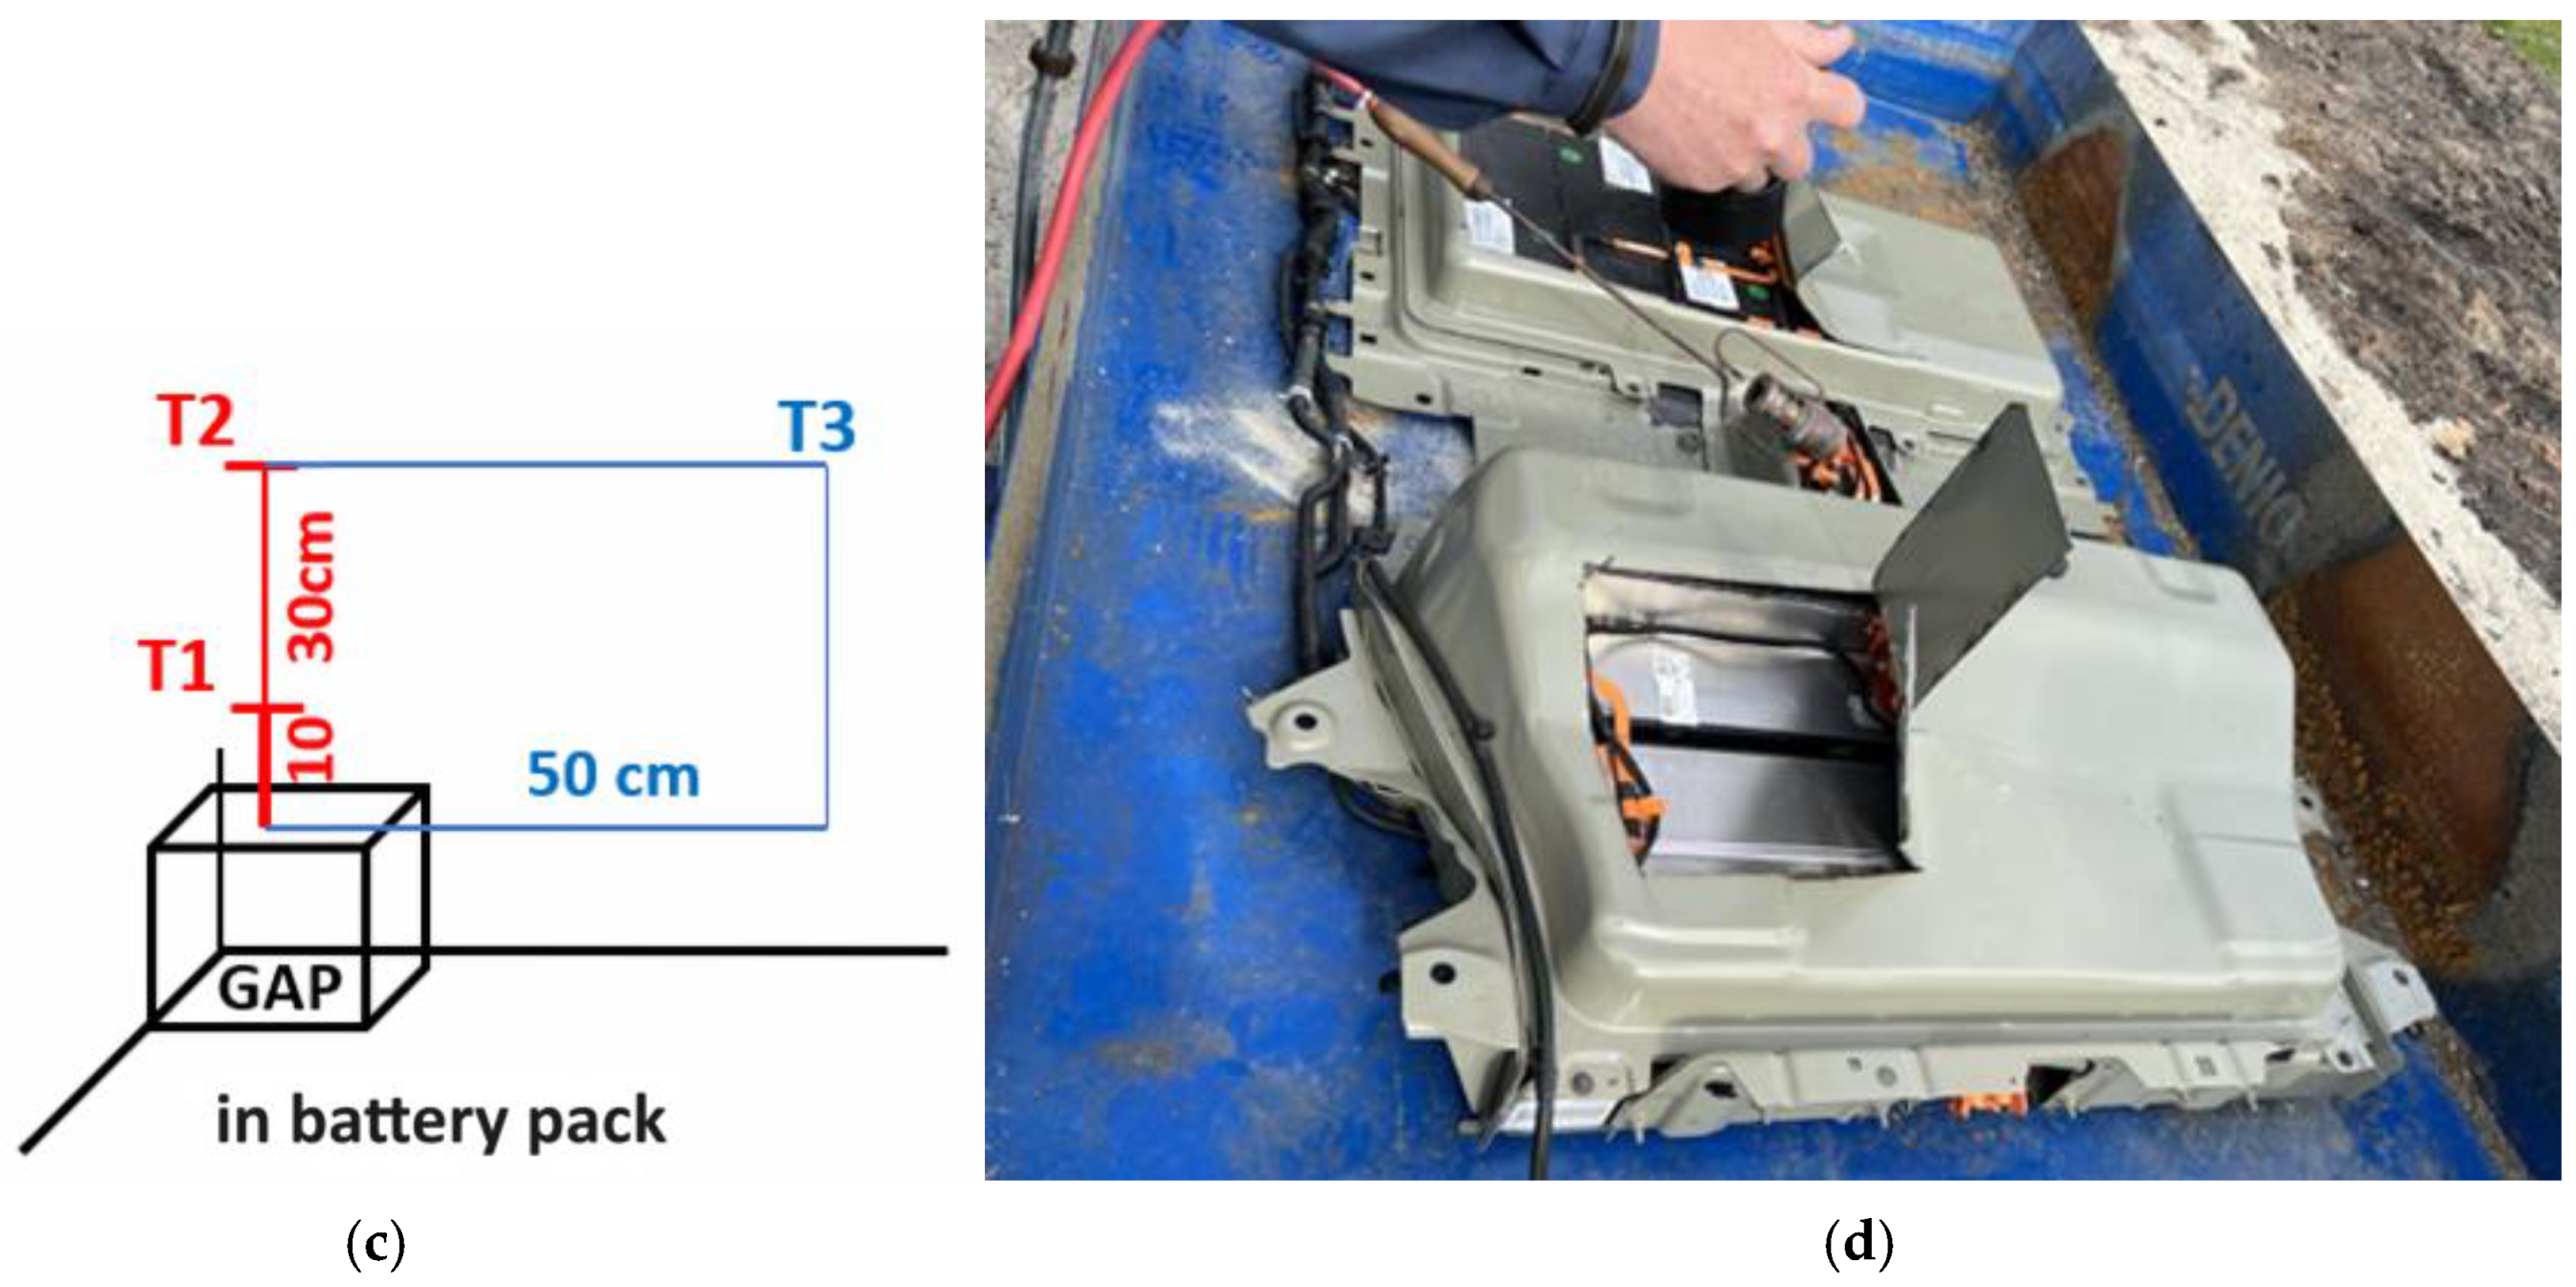
Figure 3.
Experiment preview: (a) Time 0 s, inserting the external initiator into the damaged cover of the EV traction battery; (b) real experimental time 1500 s (25 min), action of the external flame.
Figure 3.
Experiment preview: (a) Time 0 s, inserting the external initiator into the damaged cover of the EV traction battery; (b) real experimental time 1500 s (25 min), action of the external flame.
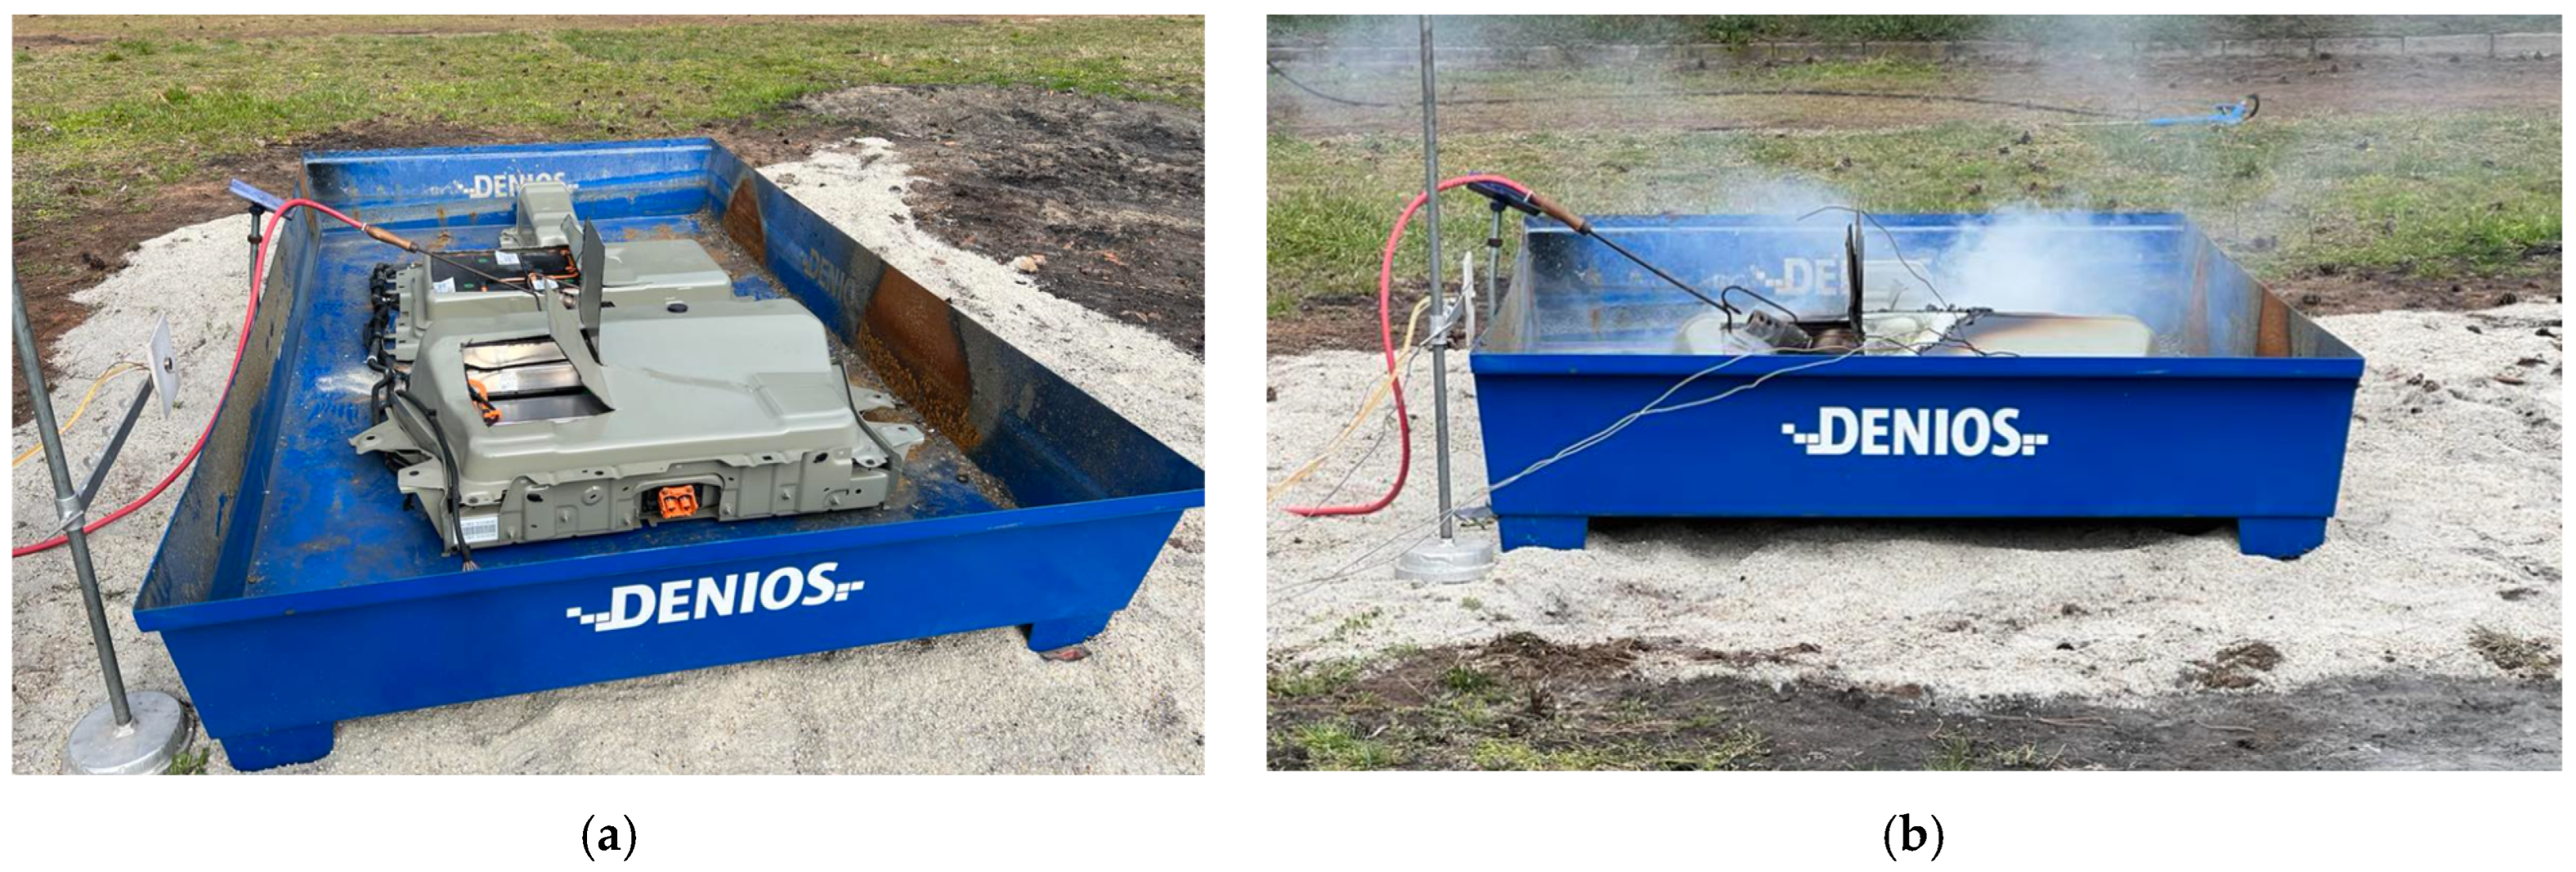
Figure 4.
Temperature changes during the fire of the EV traction battery. The green rectangle represents the section shown in detail in Figure 5, and the orange rectangle represents the section shown in detail in Figure 11a.
Figure 4.
Temperature changes during the fire of the EV traction battery. The green rectangle represents the section shown in detail in Figure 5, and the orange rectangle represents the section shown in detail in Figure 11a.
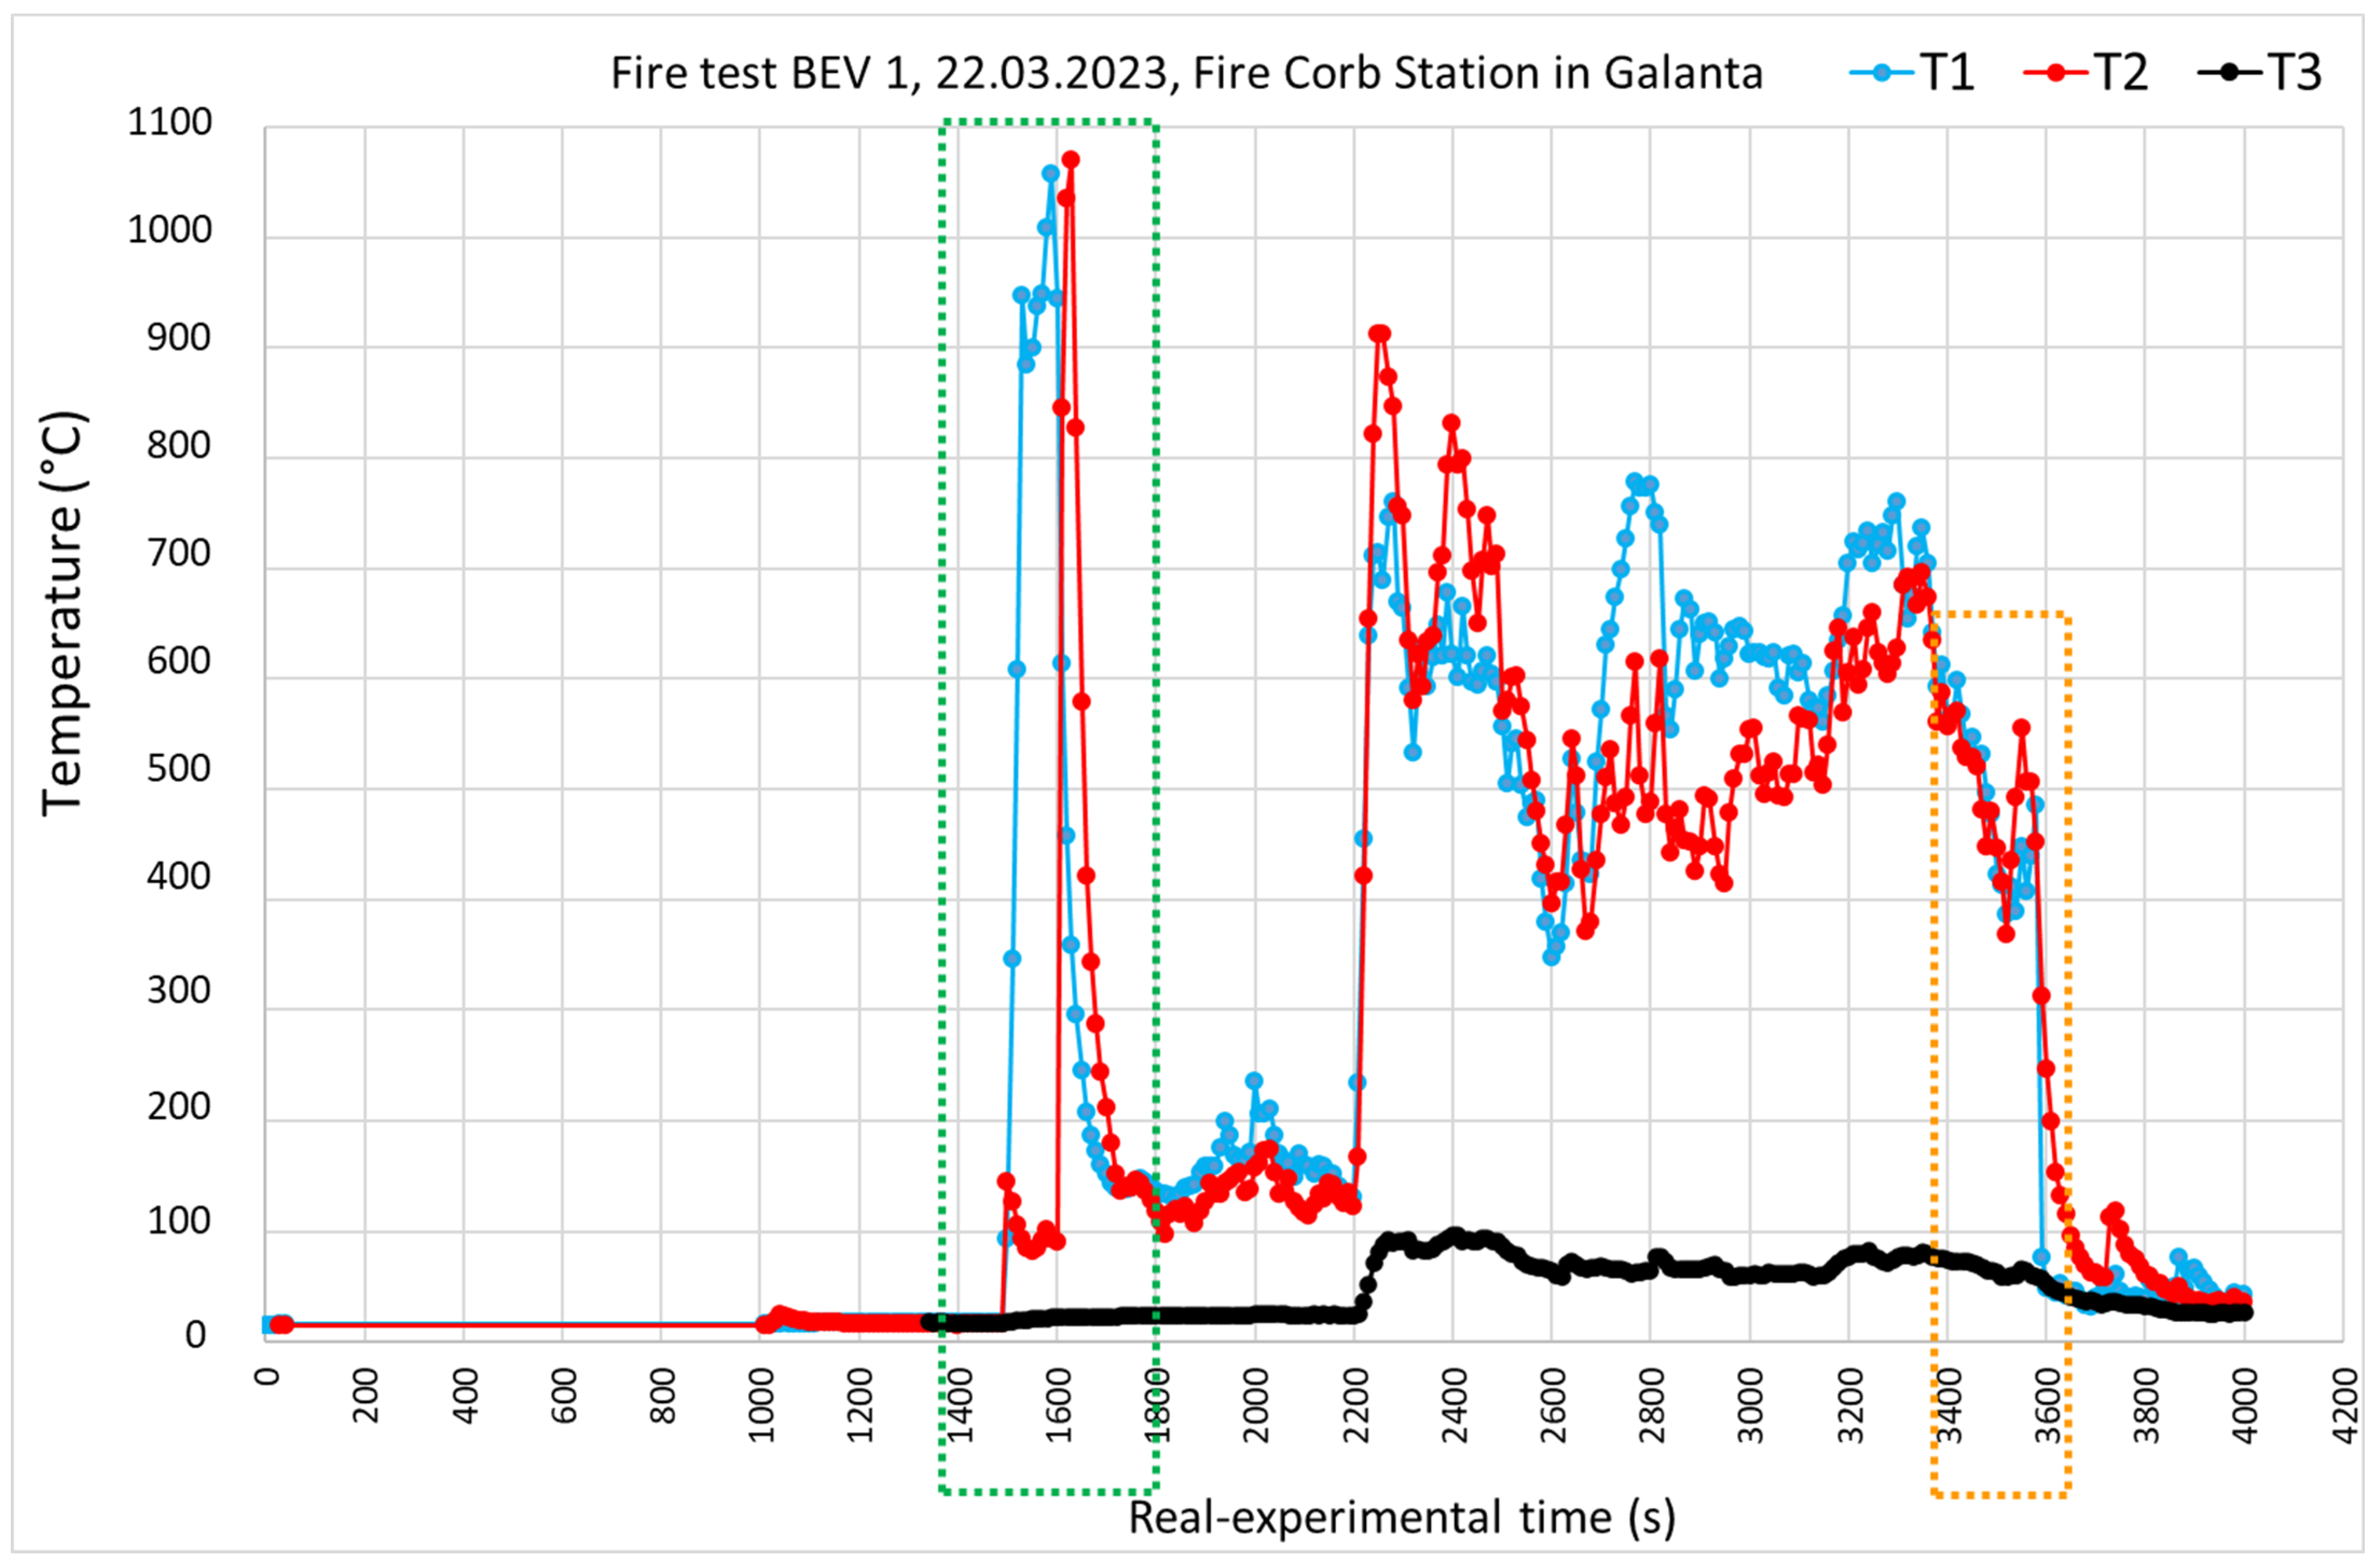
Figure 5.
Section (purple in Figure 1) of the temperature–time curves of the experiment Test 1 within time frame from 10:15:03 to 10:18:53.
Figure 5.
Section (purple in Figure 1) of the temperature–time curves of the experiment Test 1 within time frame from 10:15:03 to 10:18:53.

Figure 6.
Photo documentation of Test 1 within a time frame from 25 min to 28 min, real experimental time 3 min. Legend: The first row of images represents the course of the BEV fire in the first minute after 20 s (20, 40, and 60 s), the second row is the second minute after 20 s, and the third row of images is the progress in 3 slightly after 20 s.
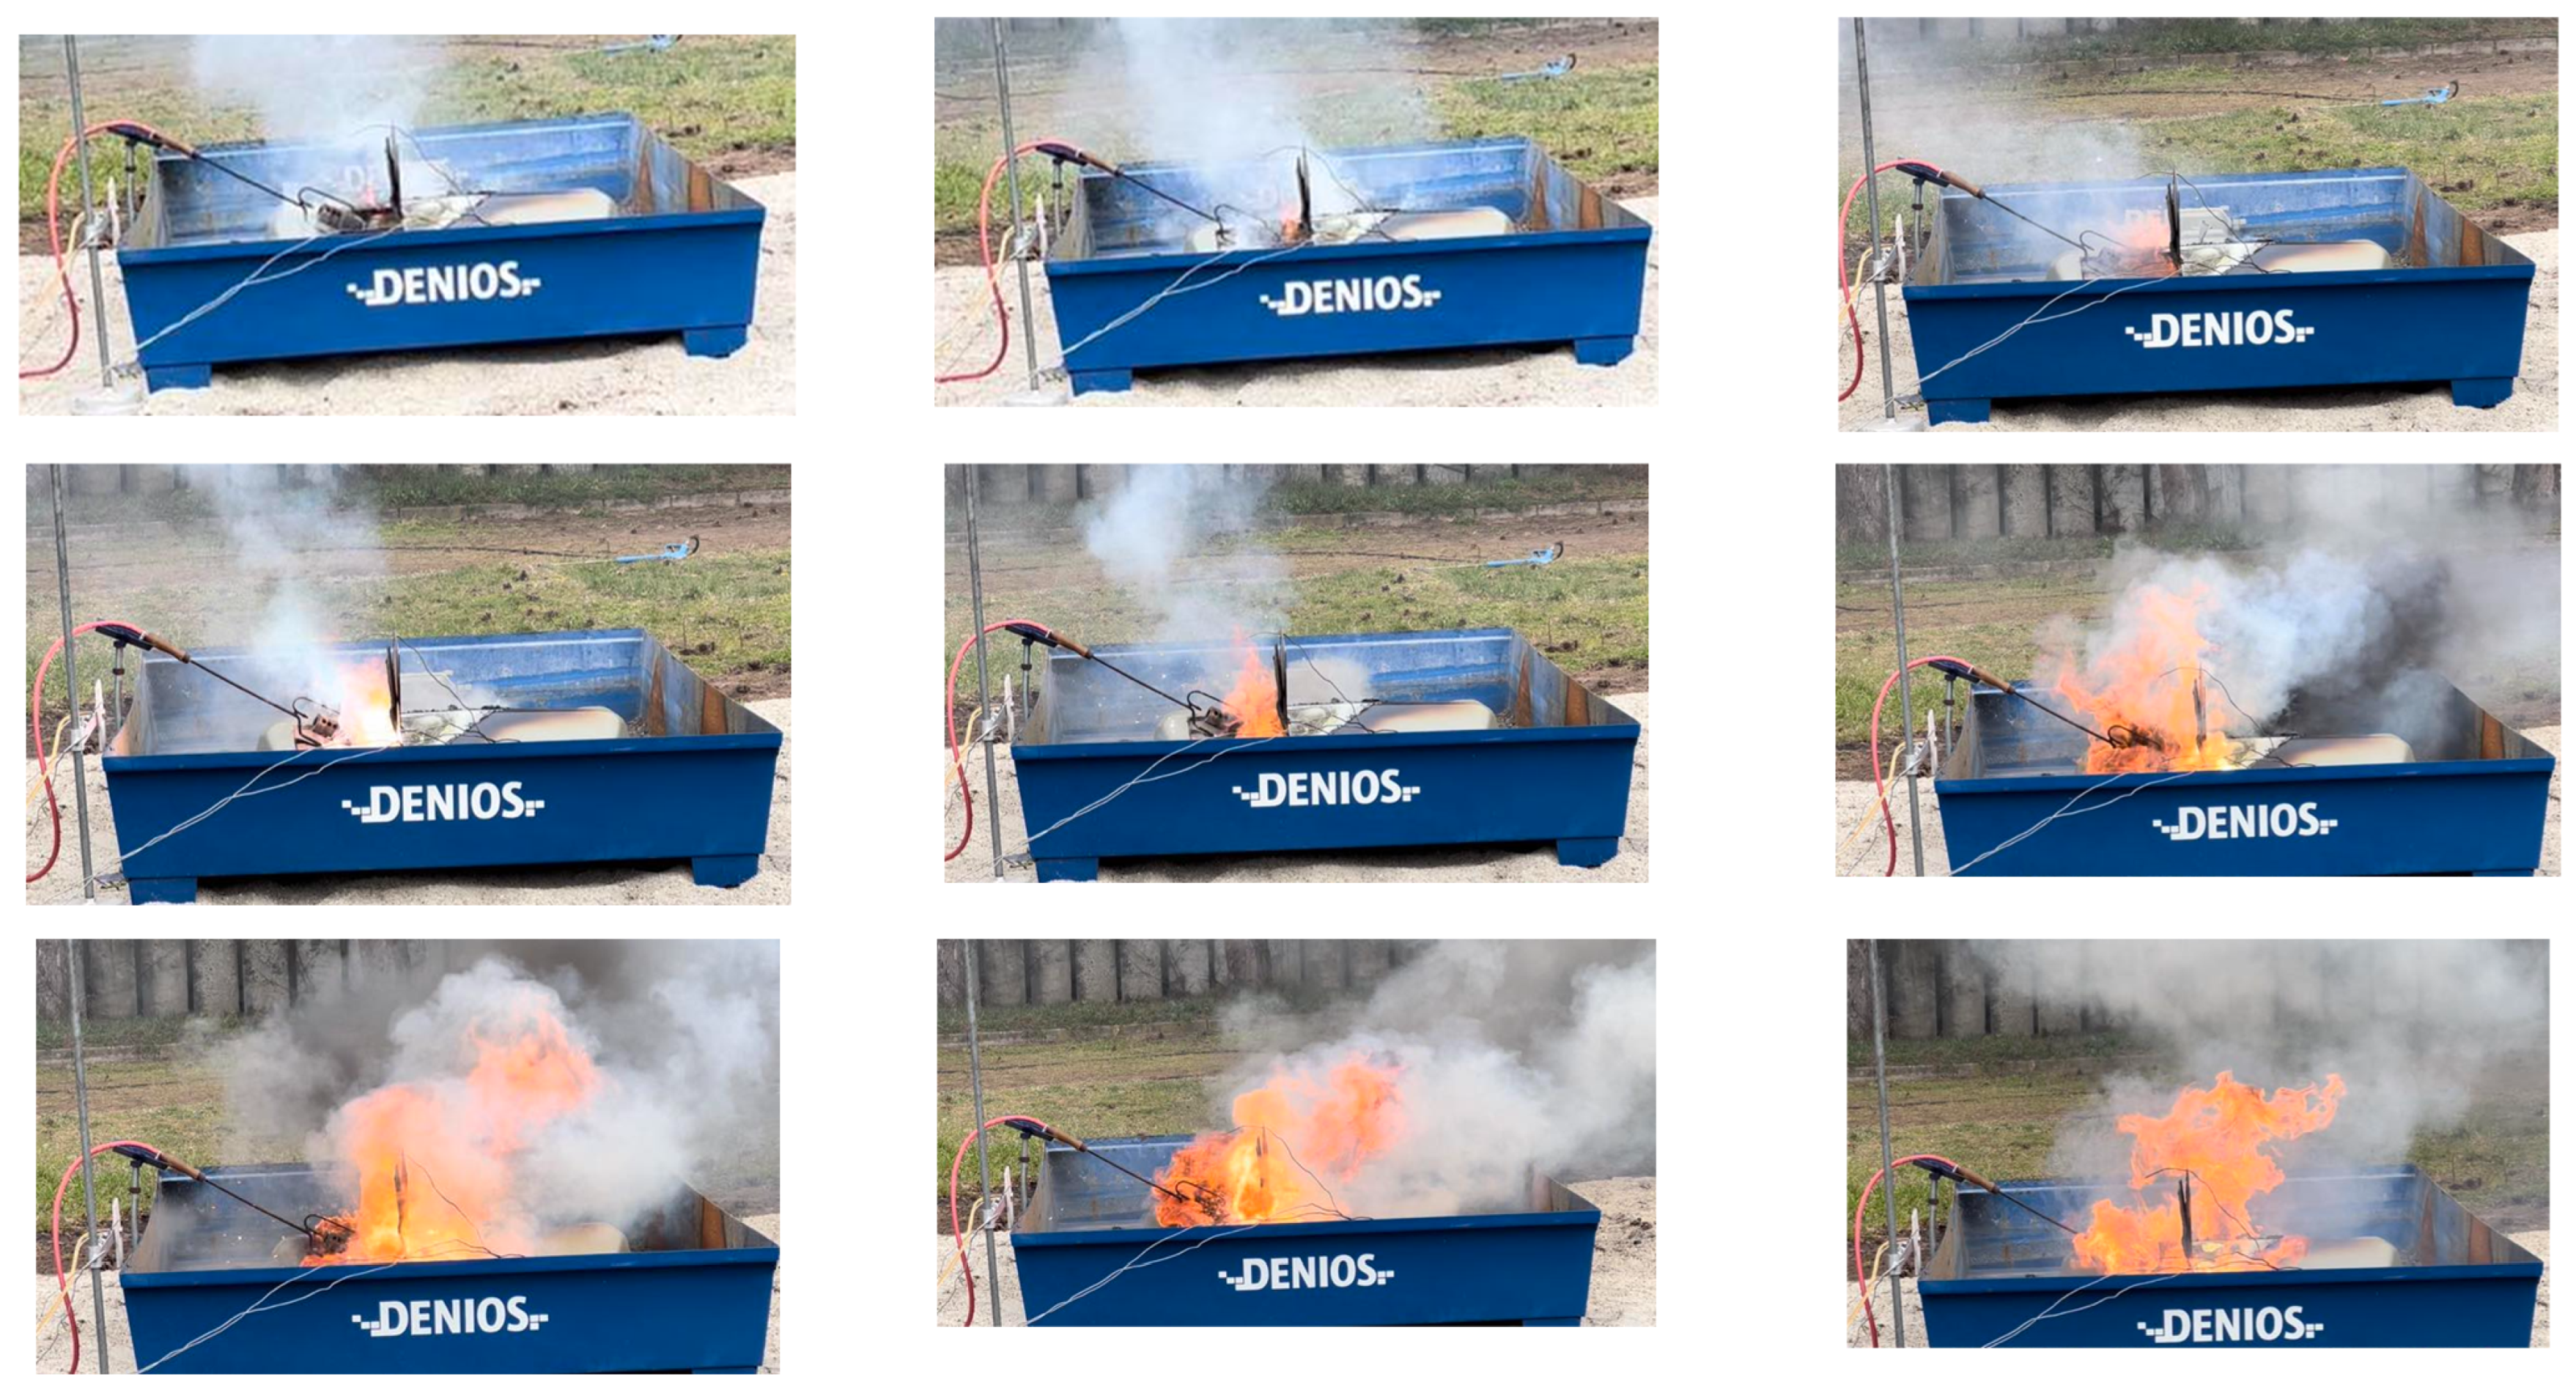
Figure 7.
Photo documentation of large-scale Test 1 in real experimental time: (a) 38 min; (b) 39 min; and (c) 40 min.
Figure 7.
Photo documentation of large-scale Test 1 in real experimental time: (a) 38 min; (b) 39 min; and (c) 40 min.

Figure 8.
Time–temperature curves in fire test BEV 2. The orange rectangle represents the section shown in detail in Figure 11b.
Figure 8.
Time–temperature curves in fire test BEV 2. The orange rectangle represents the section shown in detail in Figure 11b.
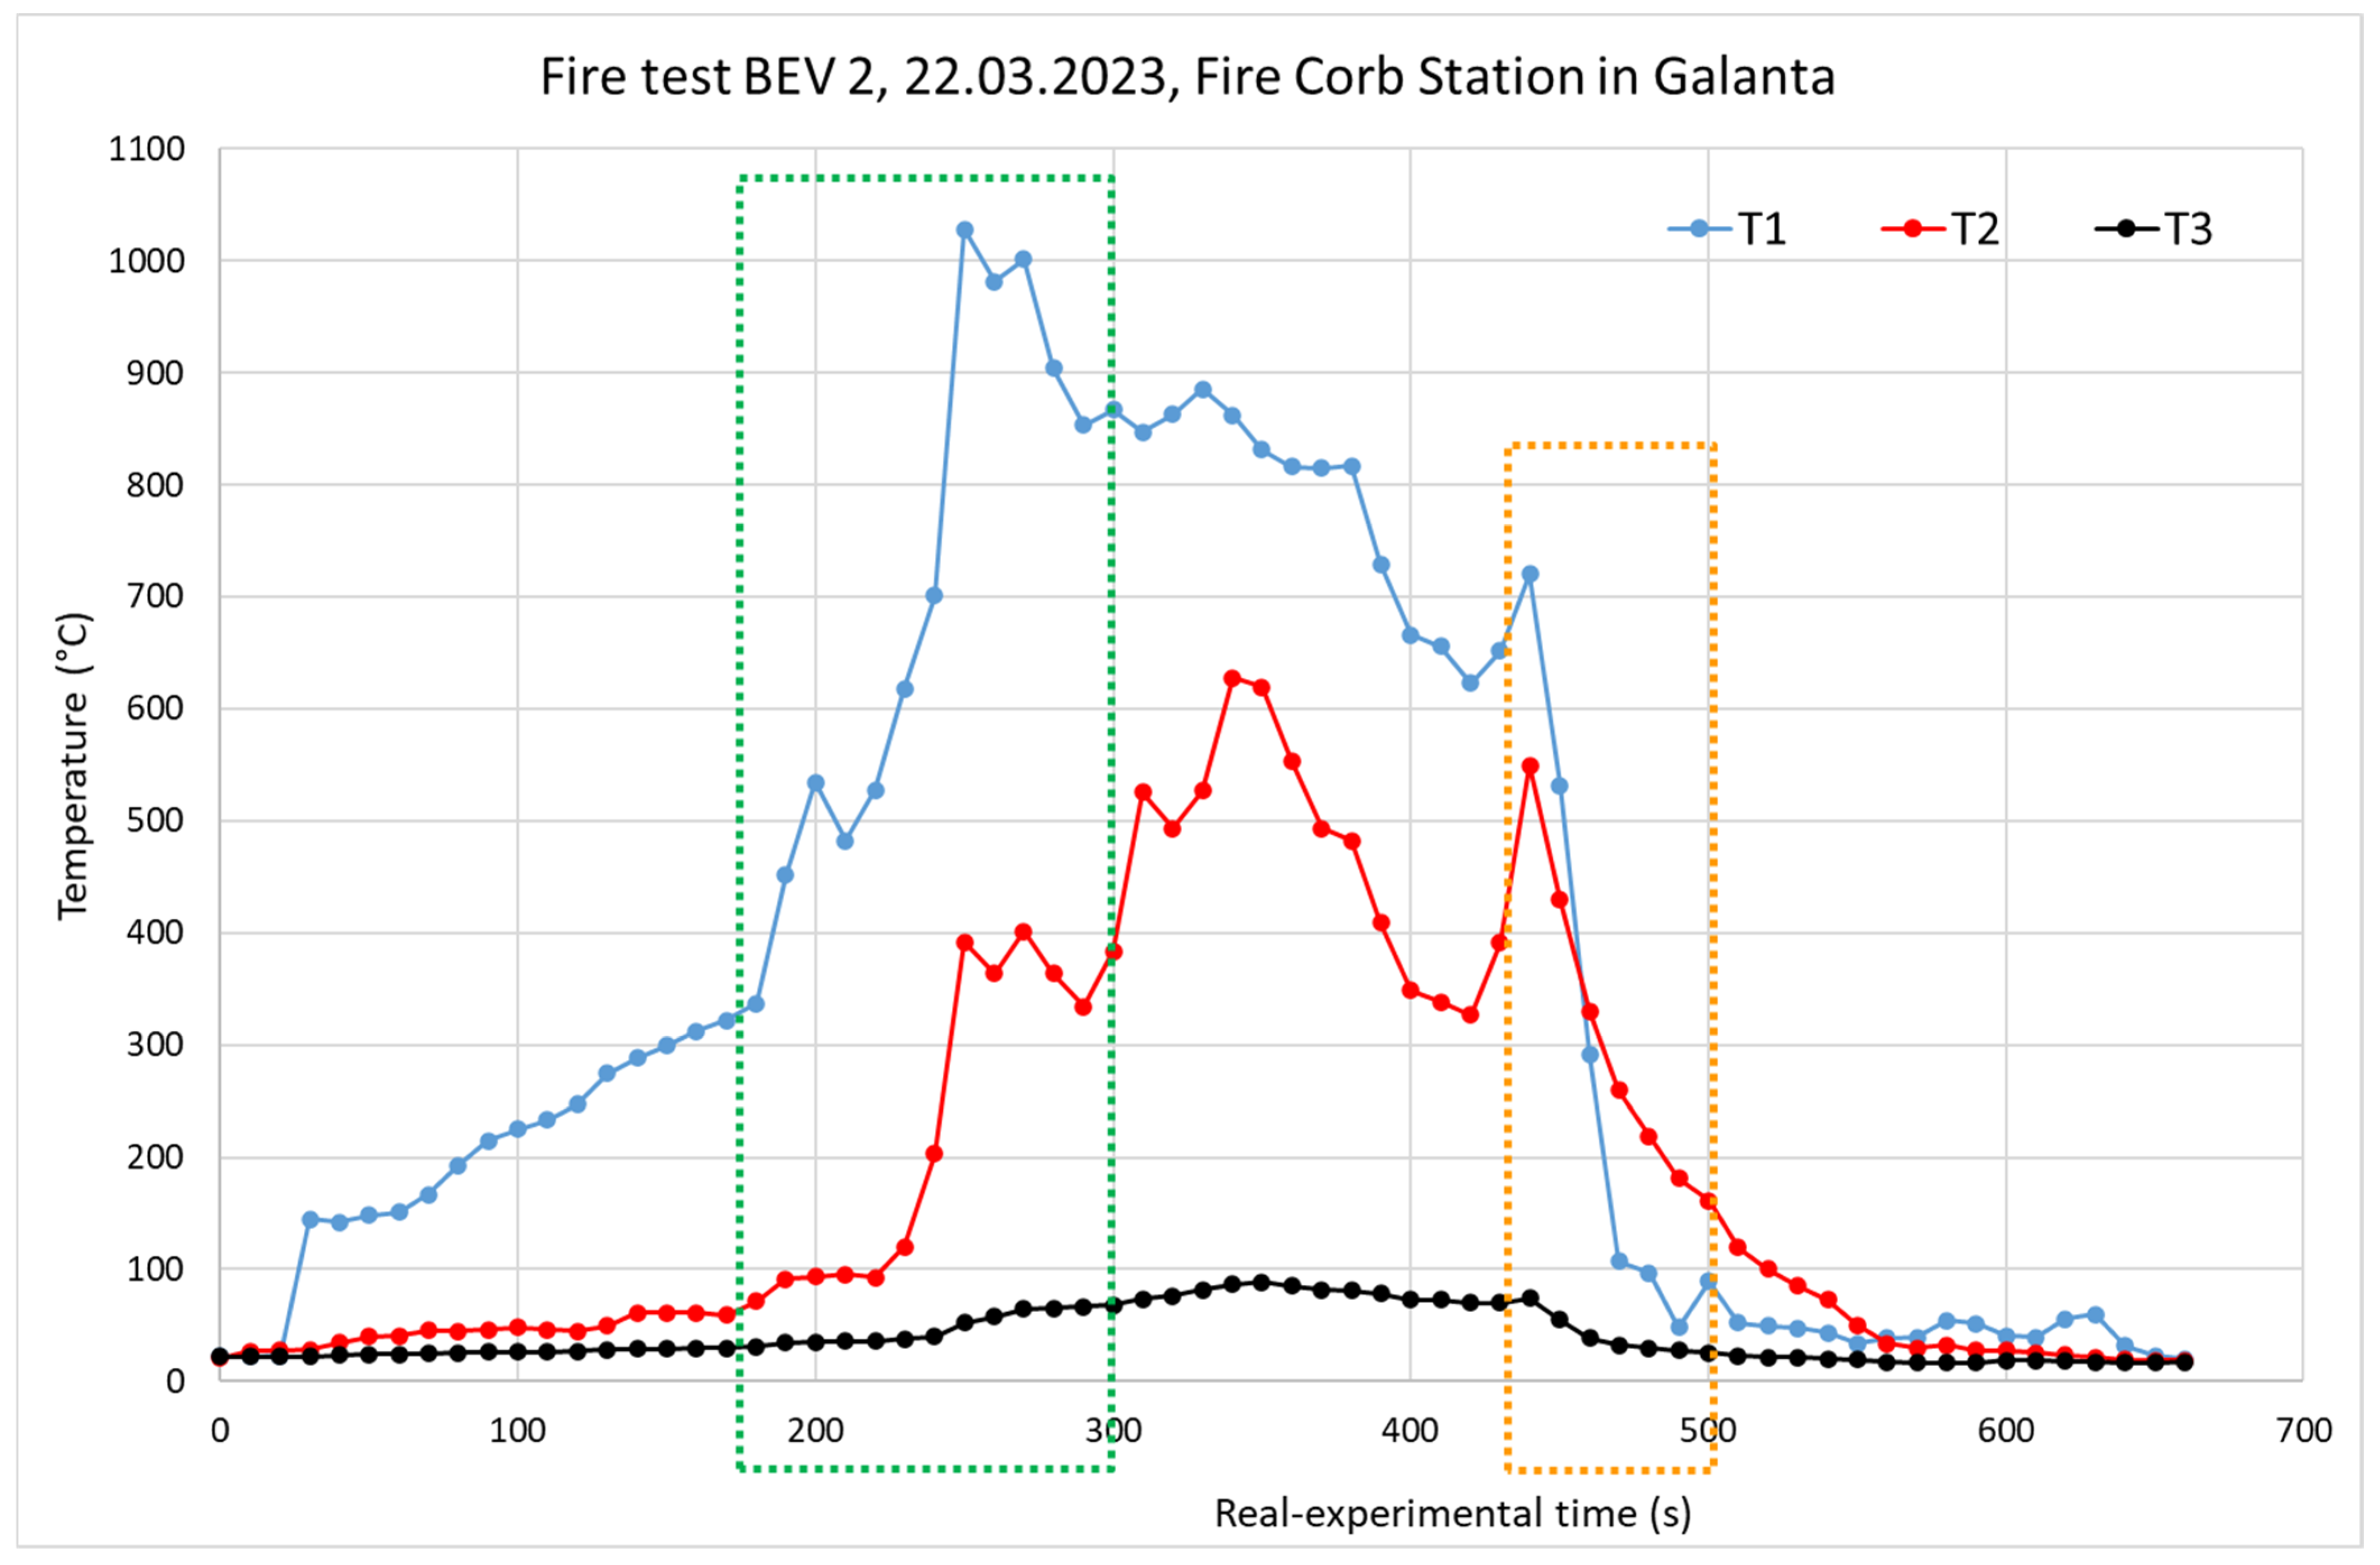
Figure 9.
Photo documentation of the EV traction battery fire in Test 2 in the two-minute interval within a time frame from 180 s to 300 s. The first nine images are a cross-section of the first minute, and the remaining four images represent 25 s of the sequence in the second minute.
Figure 9.
Photo documentation of the EV traction battery fire in Test 2 in the two-minute interval within a time frame from 180 s to 300 s. The first nine images are a cross-section of the first minute, and the remaining four images represent 25 s of the sequence in the second minute.
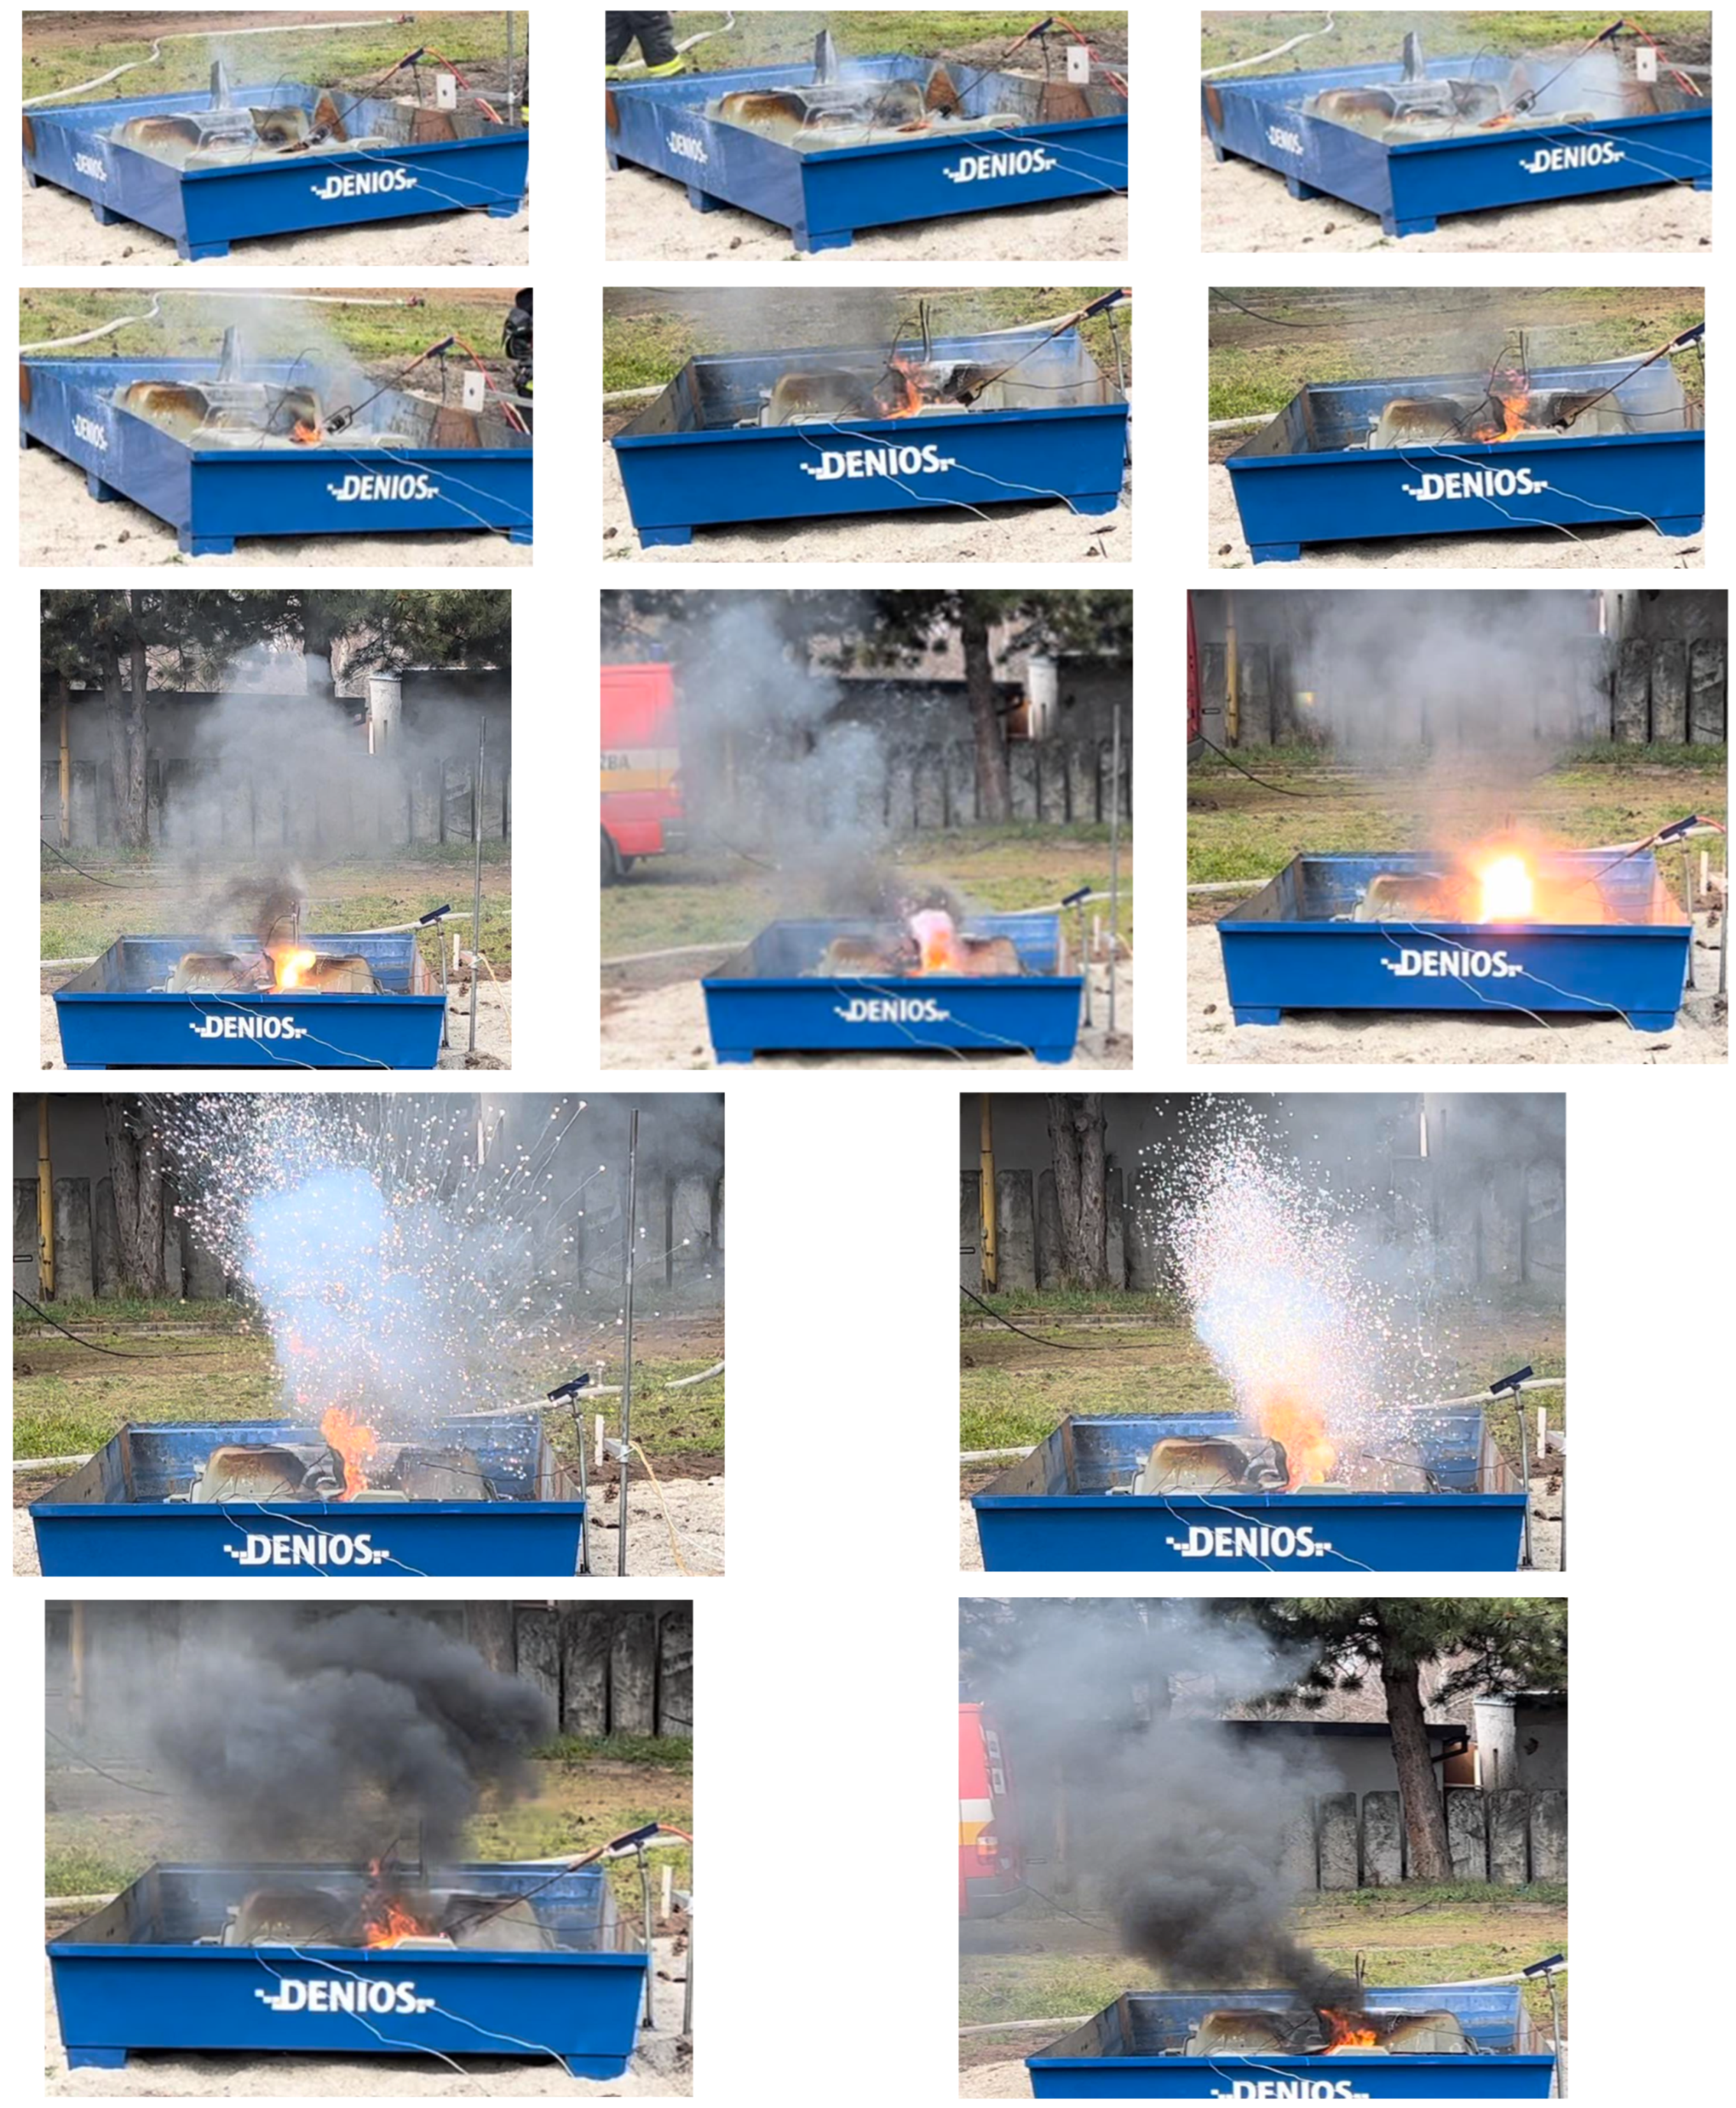
Figure 10.
Comparison of T1 from thermocouples 1 in both tests. (a) Real-time experiments considered; (b) regardless of the real time of the experiment.
Figure 10.
Comparison of T1 from thermocouples 1 in both tests. (a) Real-time experiments considered; (b) regardless of the real time of the experiment.
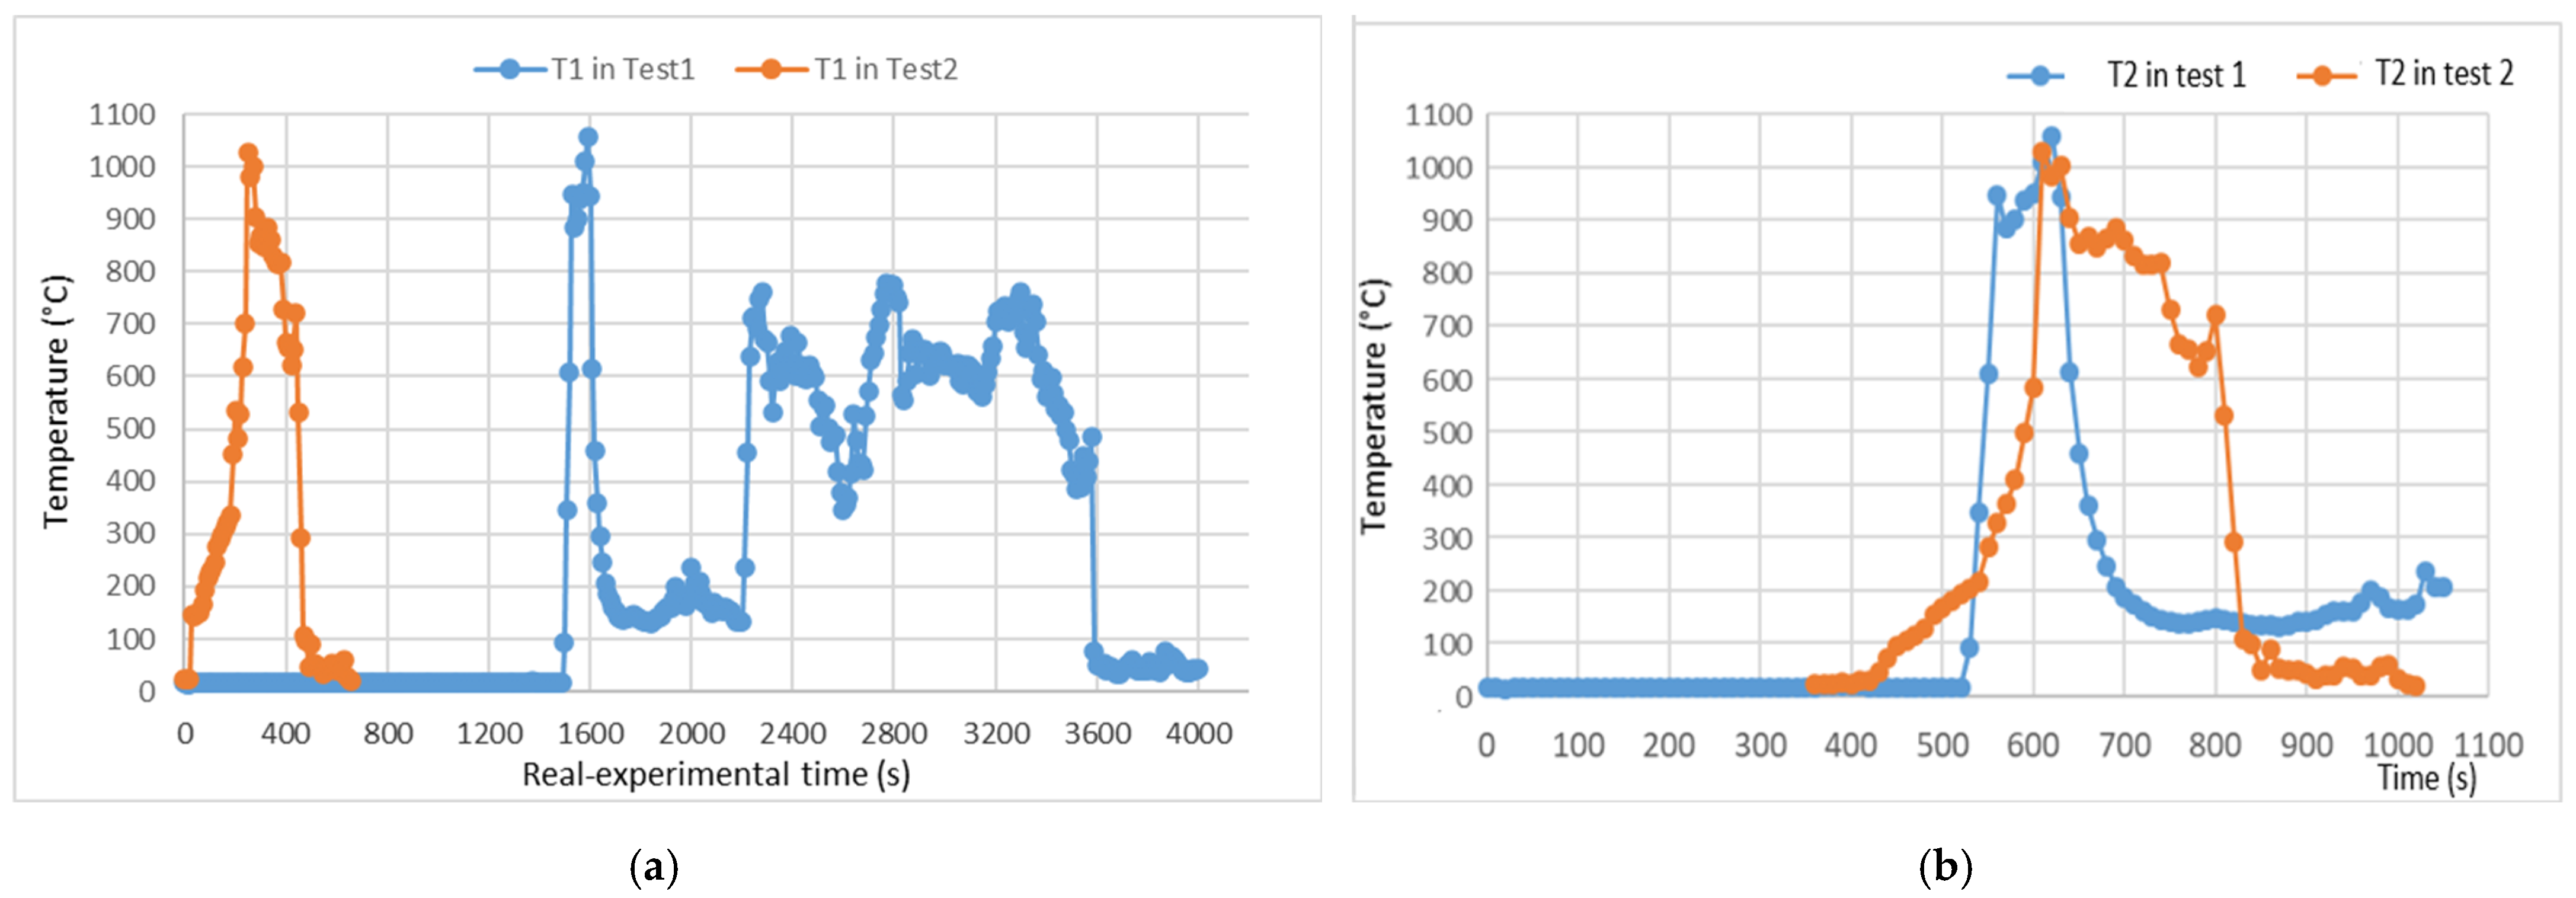
Figure 11.
A three-minute slice of the time–temperature curve of (a) fire test BEV 1 (real experimental time 3490–3700 s) and (b) fire test BEV 2 (real-experimental time 420–590 s).
Figure 11.
A three-minute slice of the time–temperature curve of (a) fire test BEV 1 (real experimental time 3490–3700 s) and (b) fire test BEV 2 (real-experimental time 420–590 s).

Table 1.
Composition of used LIBs.
| LIB Construction | Chemical Composition | |||
|---|---|---|---|---|
| Element | Formula | CAS ** | ||
| Steel label | Steel | 65997-19-5 | ||
| Modul/cell | Cathode | Lithium Iron Phosphate (LFP) | LiFePO4 (LFP) | 15365-14-7 |
| NMC * | Li [M *]m[O]n | 346417-97-8 | ||
| The base of the cathode | Aluminum | Al | 7429-90-5 | |
| Anode | Carbon as graphite | C | 7440-44-0 | |
| Carbon (black) | C | 1333-86-4 | ||
| Copper | Cu | 7440-50-8 | ||
| Electrolyte | Organic solvents data | Ethylene Carbonate EC | C3H4O3 | 96-49-1 |
| Diethyl Carbonate DEC | 105-58-8 | |||
| Dimethyl Carbonate DMC | C3H6O3 | 616-38-6 | ||
| Ethyl Methyl Carbonate EMC | C4H8O3 | 623-53-0 | ||
| Ethylene Acetate EA | 96-49-1 | |||
| Propylene Carbonate PC | 108-32-7 | |||
| Lithium salt | Lithium Hexafluorophosphate | LiPF6 | 21324-40-3 | |
| Carboxymethyl Cellulose Sodium Salt | 9004-32-4 | |||
| Separator | Poly(vinylidene fluoride-co-hexafluoropropylene) | PVDF | 9011-17-0 | |
| Polyvinylidene difluoride | PVDF | 24937-79-9 | ||
| Styrene-Butadiene rubber | SBR | 96-49-1 | ||
| Poly(vinylidene fluoride-co-hexafluoropropylene) | PVDF | 9011-17-0 | ||
* Table 2 provides a more detailed description of NMC LIB. ** Is a unique numeric identifier chemical substance. Designates only one substance.
Table 4.
Characteristics of the investigated BEV with a lithium-ion battery module.
| Parameter | Ti Battery Pack |
|---|---|
| Number of modules in pack | 18 |
| Cell type | Prismatic, 3.7 V; 62 Ah; weight 0.95 kg |
| Cells per Module | 12 |
| Anode material | Graphite |
| Cathode material | LiNiMnCoO2; NMC (811 or 523) |
| Separator | Ceramic coated microporous polyolefin |
| Electrolyte | Organic carbonates |
| Conducting salt | LiPF6 |
| Nominal voltage | 400 V (3.68 V per cell) |
| Energy capacity pack | 51 kWh |
| Specific energy | 143 Wh/kg (pack); 228 Wh.kg−1 (Module) |
| SOC | Usable 94.3% |
Table 5.
Conditions of the experiment.
| Monitored Parameters | Values |
|---|---|
| Ambient temperature (°C) | 23.5 |
| Pressure (kPa) | 101.3 |
| Humidity (%) | 56 |
| Wind velocity (km.h−1) | 0.35 |
Disclaimer/Publisher’s Note: The statements, opinions and data contained in all publications are solely those of the individual author(s) and contributor(s) and not of MDPI and/or the editor(s). MDPI and/or the editor(s) disclaim responsibility for any injury to people or property resulting from any ideas, methods, instructions or products referred to in the content. |
© 2024 by the authors. Licensee MDPI, Basel, Switzerland. This article is an open access article distributed under the terms and conditions of the Creative Commons Attribution (CC BY) license (https://creativecommons.org/licenses/by/4.0/).
Share and Cite
MDPI and ACS Style
Svetlík, J.; Tancos, Z.; Tancos, P.; Markova, I.; Slastan, K. Large-Scale Fire Tests of Battery Electric Vehicle (BEV): Slovak Case Study. Appl. Sci. 2024, 14, 4013. https://doi.org/10.3390/app14104013
AMA Style
Svetlík J, Tancos Z, Tancos P, Markova I, Slastan K. Large-Scale Fire Tests of Battery Electric Vehicle (BEV): Slovak Case Study. Applied Sciences. 2024; 14(10):4013. https://doi.org/10.3390/app14104013
Chicago/Turabian StyleSvetlík, Jozef, Zoltan Tancos, Petr Tancos, Iveta Markova, and Kristian Slastan. 2024. "Large-Scale Fire Tests of Battery Electric Vehicle (BEV): Slovak Case Study" Applied Sciences 14, no. 10: 4013. https://doi.org/10.3390/app14104013
Note that from the first issue of 2016, this journal uses article numbers instead of page numbers. See further details here.