
Attention-Oriented CNN Method for Type 2 Diabetes Prediction
by
 and
and
Jian Zhao
1,2,3, 
Hanlin Gao
1,2,3,
Chen Yang
2,4,5,
Tianbo An
1,2,3,
Zhejun Kuang
1,2,3,* and
Lijuan Shi
2,3,5 1
College of Computer Science and Technology, Changchun University, Changchun 130022, China
2
Jilin Provincial Key Laboratory of Human Health Status Identification Function & Enhancement, Changchun 130022, China
3
Key Laboratory of Intelligent Rehabilitation and Barrier-Free for the Disabled, Changchun University, Ministry of Education, Changchun 130022, China
4
College of Cyber Security, Changchun University, Changchun 130022, China
5
College of Electronic Information Engineering, Changchun University, Changchun 130012, China
*
Author to whom correspondence should be addressed.
Appl. Sci. 2024, 14(10), 3989; https://doi.org/10.3390/app14103989
Submission received: 13 March 2024
/
Revised: 23 April 2024
/
Accepted: 4 May 2024
/
Published: 8 May 2024
(This article belongs to the Section Computing and Artificial Intelligence)
Abstract
:Diabetes is caused by insulin deficiency or impaired biological action, and long-term hyperglycemia leads to a variety of tissue damage and dysfunction. Therefore, the early prediction of diabetes and timely intervention and treatment are crucial. This paper proposes a robust framework for the prediction and diagnosis of type 2 diabetes (T2DM) to aid in diabetes applications in clinical diagnosis. The data-preprocessing stage includes steps such as outlier removal, missing value filling, data standardization, and assigning class weights to ensure the quality and consistency of the data, thereby improving the performance and stability of the model. This experiment used the National Health and Nutrition Examination Survey (NHANES) dataset and the publicly available PIMA Indian dataset (PID). For T2DM classification, we designed a convolutional neural network (CNN) and proposed a novel attention-oriented convolutional neural network (SECNN) through the channel attention mechanism. To optimize the hyperparameters of the model, we used grid search and K-fold cross-validation methods. In addition, we also comparatively analyzed various machine learning (ML) models such as support vector machine (SVM), logistic regression (LR), decision tree (DT), random forest (RF), and artificial neural network (ANN). Finally, we evaluated the performance of the model using performance evaluation metrics such as precision, recall, F1-Score, accuracy, and AUC. Experimental results show that the SECNN model has an accuracy of 94.12% on the NHANES dataset and an accuracy of 89.47% on the PIMA Indian dataset. SECNN models and CNN models show significant improvements in diabetes prediction performance compared to traditional ML models. The comparative analysis of the SECNN model and the CNN model has significantly improved performance, further verifying the advantages of introducing the channel attention mechanism. The robust diabetes prediction framework proposed in this article establishes an effective foundation for diabetes diagnosis and prediction, and has a positive impact on the development of health management and medical industries.
1. Introduction
In today’s era, humanity faces huge challenges in the fight against diabetes, both in industrialized and emerging countries [1]. Diabetes usually manifests as metabolic disorders, caused by environmental, genetic and other factors. The main clinical manifestation is hyperglycemia. Long-term symptoms of hyperglycemia can lead to damage to the eyes, kidneys, and cardiovascular and cerebrovascular organs, dysfunction, and even organ failure [2]. Typical cases of diabetes usually manifest as polyuria, polydipsia, polyphagia, and weight loss. In the field of diabetes research, researchers refer to this phenomenon as the symptoms of “three more and one less”. In the medical field, diabetes is divided into type 1 diabetes (T1DM), type 2 diabetes (T2DM) and gestational diabetes (GDM) [3]. T1DM usually manifests in individuals under 30 years of age. This particular form of diabetes presents itself quite suddenly, and patients frequently present with symptoms such as excessive urination, excessive thirst, and elevated blood glucose levels [4]. In many instances, the first indication of T1DM is ketoacidosis, accompanied by decreased levels of serum insulin and C-peptide. Furthermore, these patients tend to exhibit positivity for islet cell antibodies (ICA), insulin antibodies (IAA), or glutamic acid decarboxylase antibodies (GAD) [5]. For patients afflicted with T1DM, treatment with oral medications in isolation proves ineffective, necessitating the implementation of insulin therapy to effectively manage blood glucose levels [6]. T2DM often occurs in middle-aged and elderly people, and excessive obesity is one of the important causes of its onset. It often occurs in conjunction with diseases such as hypertension, dyslipidemia, and arteriosclerosis. The disease is subtle, and in its initial stages, there may be no symptoms or only mild fatigue and thirst. Diabetic patients need to undergo a glucose tolerance test to confirm the diagnosis. In patients with T2DM, serum insulin is normal or elevated in the early stage and decreases in the late stage [7]. GMD is one of the common complications during pregnancy. Excessive obesity, older childbearing age, past history of GDM, family history of T2DM, and race are the main risk factors for GDM [8]. In recent years, surveys of diabetes patients have shown that from 1980 to 2014, the incidence of diabetes among adults increased by 3.8%. This increase is particularly rapid in developing countries [9]. Statistics in 2017 show that there are approximately 450 million people estimated to have diabetes worldwide, and this number is expected to increase significantly to approximately 693 million by 2045 [10]. Another statistical study shows the seriousness of diabetes, reporting that there are approximately 5 billion people with diabetes worldwide, and this number will increase to 25% and 51% by 2030 and 2045, respectively [11].
Among individuals diagnosed with diabetes, T2DM accounts for approximately 95% of cases [12]. Because identifying diabetes in its early stages is challenging, many patients with T2DM suffer from lasting complications before being diagnosed. These complications increase patient injury and mortality [13]. Although a complete cure for diabetes remains elusive, careful blood sugar control can be achieved through timely intervention, reasonable treatment, and lifestyle changes. Under the guidance of a skilled healthcare professional, a customized treatment plan can be developed based on each patient’s unique situation [14]. Therefore, accurate early prediction of diabetes has the potential to control its development and avoid its onset. Although many researchers have conducted extensive research efforts on diabetes diagnosis, there is still room for improvement in the field of diabetes prediction, making it an extremely difficult task.
The contributions of this study are summarized in the following points:
- We propose a robust T2DM prediction framework to aid the clinical diagnosis of diabetes. In particular, in order to deal with problems such as normality and class imbalance in the dataset, we adopted data-preprocessing methods of outlier replacement and missing value filling. Feature selection is performed, and the most important risk factors are screened out through comprehensive analysis of variance and logistic regression. In addition, we reasonably allocate class weights for class imbalance situations. Through these processing methods, we aim to ensure the quality and consistency of the data and improve the performance and stability of the model.
- We design a CNN for diabetes prediction and establish a new attention-oriented convolutional neural network (SECNN) by introducing a channel attention mechanism. By introducing a channel attention layer to adjust the weight of each channel, the network can selectively focus on the most relevant and useful features in the input data, improving the expressive ability and performance of the model. By using the NHANES dataset and the PID dataset for testing, the performance is improved significantly. Compared with CNN, the accuracy is increased by 0.94% and 1.89% respectively, which is better than other methods discussed in this article.
- We use both the PIMA dataset and the NHANES dataset for model evaluation to provide more comprehensive and reliable model performance evaluation results and enhance the model’s generalization ability and application reliability.
2. Related Work
We discuss existing work from two perspectives, data preprocessing and model classification, to highlight the research contributions of this article. We focus on studies published in recent years, as the latest research shows improved performance in the diabetes field. For a summary of the historical and current performance of algorithms in diabetes research, see the literature review [15].
In recent years, many methods for diabetes risk prediction studies have been proposed and published. They use various dataset-preprocessing methods to preprocess the data and use various machine learning methods for risk prediction. Commonly used methods include support vector machine (SVM) [16], artificial neural network (ANN) [17], AdaBoost (AB) [18], logistic regression (LR) [19], decision tree (DT) [20] and random forest (RF) [21], etc. In [22], Maniruzzaman et al. use the group median and median to fill missing values and outliers respectively, and use RF for feature selection. SVM, NB, LR, DT, RF, AB, Gaussian Process Classification (GPC) and Quadratic Discriminant Analysis (QDA) are used for classification, among which RF has the best performance with an accuracy of 92.26%. In [23], Maniruzzaman et al. use LR for feature selection, and use NB, DT, AB and RF to predict patients with diabetes. RF has the best performance and an accuracy of 94.25%. In [24], Naz Huma and Ahuja Sachin use the ANN, Naive Bayes (NB), DT and DL methods for classification. Among them, the DL method achieves an accuracy of 98.07%. In [25], Hasan Kazi Amit and Hasan Md. Al Mehedi use analysis of variance and LR for feature selection, and SVM, LR, DT, RF, ANN and ensembling for classification, among which RF achieves the best performance with an accuracy of 90%. In [26], Hasan et al. use outlier rejection, missing value filling, data standardization, and feature selection to preprocess the data, and use KNN, DT, RF, AB, NB, XB, multi-layer perceptron (MLP) and ensembling for classification. Ensembling has the best performance, and the area under the ROC curve (AUC) achieves a score of 95%. In [27], Sivaranjani et al. use principal component analysis (PCA) and mean for feature selection and missing value filling before using SVM and RF for classification. They compare the classification performance of RF and SVM, where the RF model is the best, with an accuracy of 83%. In [28], Khanam et al., after preprocessing the dataset, use eight ML models including DT, RF and neural network (NN) for classification, among which NN achieves the best performance with an accuracy of 88.6%. In [29], Olisah et al. use Spearman correlation for feature selection, polynomial regression for missing value replacement, and their self-designed Quadratic Growth Deep Neural Network (2GDNN) for classification. The accuracy rates on the PID dataset and LMCH dataset are 97.34% and 97.24%, respectively. In [30], Rastogi et al. use RF, SVM, LR and NB to test the PIMA Indian dataset, and logistic regression has the highest performance, achieving an accuracy of 82.46%. It fully demonstrates the application and effect of different machine learning models in diabetes prediction and classification.
In recent studies, ensemble machine learning models have shown significant potential in diabetes prediction. Santosh Kumar et al. [31] use a multi-layer feedforward neural network (MLFNN) for classification after preprocessing the PID dataset, achieving an accuracy of 84.17%. Further, Mani Abedini et al. [32] propose an innovative integrated hierarchical model by first independently training decision tree (DT) and random forest (RF) models, and then passing the prediction results of these models as input to a neural network, in this way, fusing the output of the previous classifier to achieve higher overall prediction accuracy, with a test accuracy of 83%. Similarly, Roy et al. [33] evaluate the performance of RF, LGBM, LR and SVM after data preprocessing and find that LGBM performs the most outstandingly, with an accuracy rate as high as 86%. Ahmed et al. [34] explore an FMDP model integrating ML methods, which combines support vector machine (SVM) and artificial neural network (ANN), and achieve a prediction accuracy of 94.87% in diabetes diagnostic analysis. In addition, Abnoosian et al. [35] develop an ensemble machine learning model (EMLM) using the Iraqi diabetes dataset, which achieves an accuracy of 97% on the preprocessed dataset. These studies highlight the effectiveness of integrated machine learning models in improving diabetes prediction accuracy and provide new directions and ideas for future research.
Deep learning has great potential in diabetes risk prediction. In [7], Wu et al. demonstrate a groundbreaking use of CNN to establish a T2DM risk prediction model. The established model has high prediction accuracy in the training set, validation set, and test set, which are 94.5%, 91.0%, and 89.0%, respectively.
These relevant documents are summarized in Table 1 in chronological order.
3. Materials and Methods
This section mainly introduces the datasets and methods used in this study. This part is divided into three parts. Section 3.1, Section 3.2 and Section 3.3 respectively describe the dataset used in this experiment, the framework proposed in this study, and the experimental hardware configuration and evaluation indicators.
3.1. Datasets
Dataset Description
This study utilized the National Health and Nutrition Examination Survey (NHANES) and publicly available PIMA India (PID) datasets. The NHANES dataset includes demographic, questionnaire, physical examination, and laboratory data from 1999–2000 to 2015–2016 for a total of 37,079 cases, including 4852 diabetic and 32,227 non-diabetic patients. This dataset is not only used in diabetes research but also widely used in the research of other diseases, such as coronary heart disease [36]. As part of an effort to assess the health and nutritional status of adults and children in the United States, this dataset collects a wide range of data from basic demographic information to detailed biochemical markers. The 51 variables covered include basic demographic characteristics such as gender, age, annual household income, and the ratio of household income to the poverty line. Additionally, the dataset includes detailed physiological measurements, such as body mass index, blood pressure, weight, and height. In terms of hematological indicators, multiple parameters, such as white blood cells, red blood cells, and hemoglobin, were analyzed. In terms of biochemical markers, key parameters such as cholesterol, creatinine and glucose are collected, which are extremely important for assessing an individual’s health status. Lifestyle factors such as physical labor intensity and health insurance status are also taken into consideration, as well as family history of chronic diseases such as diabetes and heart disease. People with diabetes are marked as 0 in the dataset, and people without diabetes are marked as 1. In this study, the feature importance is analyzed, and a description of the 25 key variables that are screened out is shown in Table 2.
The latter is composed of information from 768 women near Phoenix, Arizona, USA [37]. There are cases in pregnant women and can therefore be considered to include data on gestational diabetes. In this dataset, there are 268 instances of diabetics and 500 instances of non-diabetics. The dataset contains 9 different attributes, consisting of 8 independent variables and 1 dependent variable, and outcome is used as the diabetes target variable. The characteristics of this dataset are described in Table 3.
3.2. Proposed Framework
In this paper, our proposed T2DM prediction framework is shown in Figure 1. Next, we will describe and analyze each stage in detail to ensure readers’ understanding of the entire framework.
3.2.1. Data Preprocessing
In the framework proposed in this article, data preprocessing is a key step, including missing value filling, outlier replacement, feature importance analysis, data standardization and sample weight assignment. Below, we describe these steps in detail.
Missing Value Padding
Missing values [38] refer to the lack of information in the features used for prediction in the dataset. The presence of missing values affects the performance of the classifier and causes the classifier to make incorrect predictions. Furthermore, outliers in the data can have severe impacts on analytical and statistical models, especially in data processing that requires high accuracy and reliability. Therefore, correctly handling missing values is a necessary step in the data-preprocessing process. In our study, we use average values to fill in missing values. This method can maintain the continuity of data distribution without introducing outliers and improve the performance of model classification. Specifically, it can be expressed as (1):
where x represents the feature value in the sample, and we fill in the missing values by calculating the average of the non-missing values in the feature, assuming that x contains N sample instances, among which there are M non-missing values. We use to calculate, which can be expressed as (2)
where the sum of all non-missing values in feature x is represented as . By using to fill the position of the missing value , the integrity and consistency of the data can be effectively maintained.
Outlier Imputation
Outliers [39] are data points that are significantly different from other values in the dataset. Outliers can occur due to measurement errors, data entry errors, or extreme events. Handling outliers is a key step to ensure the robustness and accuracy of the classifier. In this article, we first use the interquartile range (IQR) to detect outliers in the dataset [40]. The principle of IQR is to calculate the difference between the first quartile and the third quartile. Specifically, it can be expressed as (3):
where and represent the first quartile and the third quartile, respectively. We set the threshold to 1.5 [41] and determine the maximum and minimum values by calculating the upper and lower edges, respectively. Exceeding this score will be regarded as an outlier, which can be expressed as (4) and (5):
Feature Importance Analysis
Feature importance analysis is an important part of data preprocessing, aiming to identify risk factors that have a significant impact on the occurrence and development of diabetes to help us better understand the mechanisms and risk factors of the disease. In this study, we use LR and analysis of variance (ANOVA) to comprehensively identify important risk factors that influence diabetes.
Analysis of variance is a statistical method used to compare the means of two or more groups for significant differences. It can be used to analyze whether the effect between the independent variable and the dependent variable is statistically significant. Analysis of variance mainly calculates the F statistic, that is, the F value test, and determines whether the independent variable is statistically significant by comparing the mean square error (MSB) between groups and the mean square error (MSW) within the group. If the MSB is significant, it means that the difference between the groups is large, and it can be inferred that there is a significant difference in the means between the groups.
LR is a statistical method commonly used in risk factor analysis, which can help determine which independent variables have a significant impact on the dependent variable. During the selection process, we want to find the most relevant features from a large number of features. We first use LR to evaluate the importance of each feature, and then use p-values based on the model to evaluate the significance and influence of the independent variables in the model. p-values range from 0 to 1 [42]. We set the threshold p = 0.05 to judge the significance of the independent variable. If the p-value is less than 0.05, we consider the independent variable to have a significant effect on the dependent variable.
We analyze the importance of each feature based on the F-score obtained by ANOVA. After feature selection, we further use the LR method to analyze the selected most important risk factors for the independent variables. If the p value is less than the preset significance level, then the null hypothesis can be rejected, and it is considered that there is a significant difference in the mean components between groups. Through such research design and methods, we hope to identify key factors that have an important impact on patients with diabetes and provide strong support for further prediction and intervention measures.
Data Standardization
The role of data standardization is to transform raw data into data from a standard distribution with specific properties. Its main purpose is to eliminate the dimensional differences between features and improve the training effect of the model. In this article, we use StandardScaler for standardization processing. This method analyzes the original data, calculates the standard deviation and mean of each feature, and performs standardization based on the standard deviation and mean. Specifically, it can be expressed as (6):
where z is the value for data standardization, x and u are the value of the original data and the mean of the original data, respectively, and s represents the standard deviation of the original data.
Assigning Class Weights
Most classifiers perform poorly when dealing with class imbalance in datasets. Because they are more targeted at categories with large sample sizes, categories with small sample sizes are handled relatively poorly. Therefore, detection in categories with small sample sizes faces huge challenges [43,44,45,46]. The category distribution diagram of the data samples used in this article is shown in Figure 2. There is a serious class imbalance in the dataset. This article uses the GridSearchCV function to perform grid search and cross-validation for logistic regression. We find the best weight parameters within a given weight range, and then reset the class weight through the class weight parameter of the scikit-learn tool to reduce the impact of class imbalance on model performance.
3.2.2. Convolutional Neural Network
Convolutional neural network (CNN) is a feed-forward neural network mainly used to process data with grid structure. Different from common neural network structures, the core idea of CNN is to extract the features of input data through convolutional layers and pooling layers, and classify through fully connected layers [47,48,49].
In this paper, we design a CNN model for T2DM prediction to predict diabetes. The structure of our proposed CNN model is shown in Figure 3. First, we use a convolutional layer to process the input data. This layer has 32 filters, and the size of each filter is set to 3 × 3. ReLU is used as the activation function of this layer to enhance the nonlinear capability of the model, the shape of the input data is (number of features, 1), where the number of features is the number of features of the preprocessed input data. Then, we use a pooling layer with the window size set to 2 to reduce the feature map size and retain key features. We add a dropout layer after the convolutional layer and set the dropout rate to 0.5 to reduce overfitting. Dropout [50], also known as random deactivation, is a commonly used regularization technology in CNN and is often used to prevent the over-fitting of network models. The dropout layer will randomly set a part of the input units to 0 to reduce their influence and improve the generalization ability of the model. We then add a second 1D convolutional layer with 64 3 × 3 filters and a ReLU activation function. This move aims to further extract and learn higher-level features in the input data. The dropout layer is applied again, and its dropout rate is still 0.5 to enhance the robustness of the model. Finally, we convert the output of the convolutional layer into a one-dimensional vector through a flattening layer for input to the subsequent fully connected layer. The fully connected layer can combine and map the correlation between different input features. We add a fully connected layer with 128 neurons and use ReLU as the activation function. Finally, a fully connected layer is added, using softmax as the activation function, for the binary classification prediction of T2DM. The above information is summarized in Table 4.
3.2.3. Attention-Oriented Convolutional Neural Networks
In this paper, we propose a novel Attention-Oriented Convolutional Neural Network (SECNN). The traditional CNN model uses the same weight on each feature channel. However, different features have different impacts on model performance. Therefore, we introduce the channel attention mechanism (SE) module in CNN to establish SECNN. The introduction of the SE module enables the network to dynamically allocate weights according to the importance of the channel, thereby making better use of feature channel information, increasing the model’s sensitivity to channel features, and automatically learning the importance of different features. Figure 4 shows the structure diagram of the SECNN model we established for T2DM prediction. The first part is the feature extraction part, which consists of a convolution module and a pooling module. The goal of this part is to extract useful features from the input data. The convolutional layer is used to capture local features in the input data, and the pooling layer is used to reduce the spatial size of the feature map and retain the most significant features. In the second part, we insert the SE module. After feature extraction, this module calculates the attention weight of each channel by learning learnable parameters and applies it to the channel of the feature map. The network can automatically adjust the weights based on the importance of each channel to better capture the feature channels that contribute to the task. The third part is the fully connected layer, which is used to perform high-dimensional mapping of the attention-weighted feature map to better adapt to the needs of the task.
3.2.4. Cross-Validation
K-fold cross-validation is a commonly used model evaluation method [51]. Its main principle is to divide the training set into K mutually exclusive subsets, of which K − 1 subsets are used for model training and one subset is used for model verification. The whole process is repeated K times, and finally the average of the evaluation results of the model K times is taken as the final performance evaluation result. Specifically, it can be expressed as (7):
where M is the final performance measure of the classifier, , n = 1, 2, …, and K is the performance measure of each fold. K-fold cross-validation can more effectively evaluate model performance and provide reliable estimation results when the dataset is limited.
3.3. Hardware Configuration and Evaluation Indicators
For experiments and evaluations, we conducted experiments on a computer with the following configuration: processor, Intel(R) Core(TM) i7-9700 CPU @ 3.00 GHz; memory, 16.0 GB (available memory: 15.8 GB); operating system, 64-bit operating system, x64-based processor; and operating system version, Windows 10. We used the Python programming language to implement and run our experimental code. The following is the information about the Python version and related libraries we used: Python version 3.9.13; NumPy library version 1.21.5; TensorFlow library version 2.12.0; and Scikit-learn library version 1.0.2. To maintain the reproducibility of the experiment, we recorded the unique identifier of the device and the version number of the operating system: Device ID 04672BC8-1EA6-416A-BF76-BD7CAD5F74E8, Product ID 00326-70000-00001-AA797. We used the above experimental environment for data preprocessing, model training and performance evaluation.
This article uses precision, recall, F1-Score, accuracy and AUC (area under the ROC curve) as evaluation indicators to evaluate the performance of the model.
Precision is one of the indicators to evaluate the performance of a classification model. It measures the proportion of samples predicted as positive by the classification model that are actually positive, i.e., instances that are correctly identified as diabetic among diabetic patients, and can be expressed as (8):
Recall, also known as the true rate, is an important indicator for evaluating model performance. It measures the ratio of correctly predicted positive examples to true positive examples in a classification model, i.e., instances correctly identified as diabetic patients. It can be expressed as (9):
The F1-Score is a more comprehensive performance evaluation in the case of class imbalance, which can be expressed as (10):
Accuracy is used to evaluate the accuracy of the model’s predictions on the dataset. The accuracy rate can tell us the overall classification accuracy of the model. It can be expressed as (11):
where and represent true positives and false positives respectively, and and sub-tables represent false positives and false negatives.
The AUC value is an indicator used to evaluate the performance of a binary classification model. The AUC value ranges from 0 to 1; the closer it is to 1, the better the model performance. The AUC value can help evaluate the overall predictive ability of the model under different thresholds, especially for imbalanced datasets. AUC can be specifically expressed as (12):
where represents the sum of true positive rankings, and is the correction term for the sum of expected rankings of the number of true positives. represents the total number of sample pairs used for normalization.
4. Results
This section introduces different experiments and their results, of which Section 4.1, Section 4.2 and Section 4.3 respectively give the results of data preprocessing, the performance evaluation comparison of the K-fold cross-validation and split testing, and the experiments of the comparative analysis of the K-fold cross-validation results.
4.1. Data-Preprocessing Results
4.1.1. Missing Value Padding and Outlier Imputation
We identify outliers in the PID dataset and NHANES dataset and process them using the median replacement method. The results are shown in Figure 5a. We can see that in the PID dataset, the features “pregnancy”, “blood pressure”, “skin thickness”, “insulin”, “BMI”, “diabetes spectrum function” and “age” are affected by outliers. Compared with deleting outliers, the method of using median replacement can retain the integrity and sample size of the data without affecting the consistency of other features, and can maintain the distribution characteristics and trends of the data. This replacement method improves the robustness and consistency of the data and improves the performance of the classifier. Therefore, replacing outliers with the median is an effective way to deal with outliers. In the processed PID dataset, the box plot after using the median to replace outliers is shown in Figure 5b. Similarly, in the NHANES dataset as shown in Figure 5c, the features “systolic blood pressure”, “diastolic blood pressure”, “weight”, “body mass index”, “hemoglobin”, “albumin”, “ALP”, “AST”, “ALT”, “cholesterol”, “creatinine”, “GGT”, “iron”, “LDH”, “phosphorus”, “bilirubin”, “protein”, “uric acid”, “HDL” and “glycated hemoglobin” are affected by outliers. After using the method of replacing outliers with medians to process the NHANES dataset, the box plot is shown in Figure 5d. In this way, we handle the outliers and present box plots of the processed dataset.
Figure 6 uses the kernel density estimation (KDE) function to show in detail the overall distribution of features in the PID dataset and the NHANES dataset before and after data preprocessing. Before preprocessing as shown in Figure 6a,c, the data features present a significant skewed distribution, being both left and right skewed. This distribution skewness may lead to low expected value estimates. In addition, some features also show obvious multimodality. After data preprocessing as shown in Figure 6b,d, the skewness of the feature distribution is significantly improved, the mean and median are closer, and the multimodality phenomenon is basically eliminated. This shows that data preprocessing significantly optimizes the statistical properties of the data and provides a more stable foundation for subsequent analysis work. As shown in Figure 7, we also construct correlation heatmaps for each PID and NHANES dataset. By qualitatively and quantitatively analyzing (a) and (c), and (b) and (d) in Figure 8, we find that the Pearson correlation coefficient between variables in the dataset is significantly enhanced after handling outliers and filling missing values. Taking the PID dataset as an example, the Pearson correlation coefficients between the variables “blood pressure”, “skin thickness” and “insulin” and the outcome variables are increased significantly compared with the correlation before data preprocessing.
4.1.2. Feature Importance Analysis Results
The feature importance analysis of the NHANES dataset and PID dataset is shown in Table 5 and Table 6, respectively. First, we select and sort the features of the NHANES dataset and the PID dataset according to the F-score obtained by ANOVA. This score represents the importance of the individual characteristics of the independent variable. Among them, a total of 24 features are screened out in the NHANES dataset, and 8 features are screened out in the PID dataset. Logistic regression is then used for further risk factor assessment. In order to determine the risk and impact of individual independent variables on the dependent variable, we generate p-values for each variable to investigate the relative risk of the independent variables on the outcome variable. The p-value ranges between 0 and 1 [42]. We define a p-value as statistically significant when it is less than 0.05. Age, Blood-Rel-Diabetes, Body-Mass-Index, Systolic, HDL, Cholesterol, Hemoglobin, Diastolic, ALT, AST, Gender, Protein, and Phosphorus are important risk factors related to diabetes. Similarly, glucose, age, BMI, and blood pressure are important risk factors related to diabetes in this dataset. Through further feature screening, analysis of significant features has made a significant contribution to medical research and clinical practice, deepening the understanding of disease mechanisms, guiding early diagnosis and personalized treatment, and effectively reducing medical intervention. This analysis also helps develop prevention strategies and manage health, improving public health.
4.1.3. Assigning Class Weights
In this paper, the GridSearchCV function is used to perform grid search and cross-validation of logistic regression. The purpose is to find the best category weight parameters within a given weight range to maximize the accuracy of the model on the training data. The obtained relationship between accuracy and category weight is shown in Figure 8, and the optimal category weight is shown in Table 7. Class weights are assigned to class processing by setting the class weight parameter of the scikit tool in the classification. The weight of class 0 of the HANES dataset is set to 0.5237, and the weight of class 1 is set to 0.4763. We set category 0 in the PID dataset to 0.5711 and category 1 to 0.4289.
4.2. Comparative Analysis of Deep Model Performance across Datasets
For this experiment, we use K-fold cross-validation on the PID dataset and NHANES dataset to divide the datasets into 3-fold, 5-fold, and 10-fold, respectively, to evaluate the proposed SECNN model, CNN model, and traditional ML model (SVM, LR, RF, and DT), and the experimental results are compared and summarized to verify our contribution in this paper.
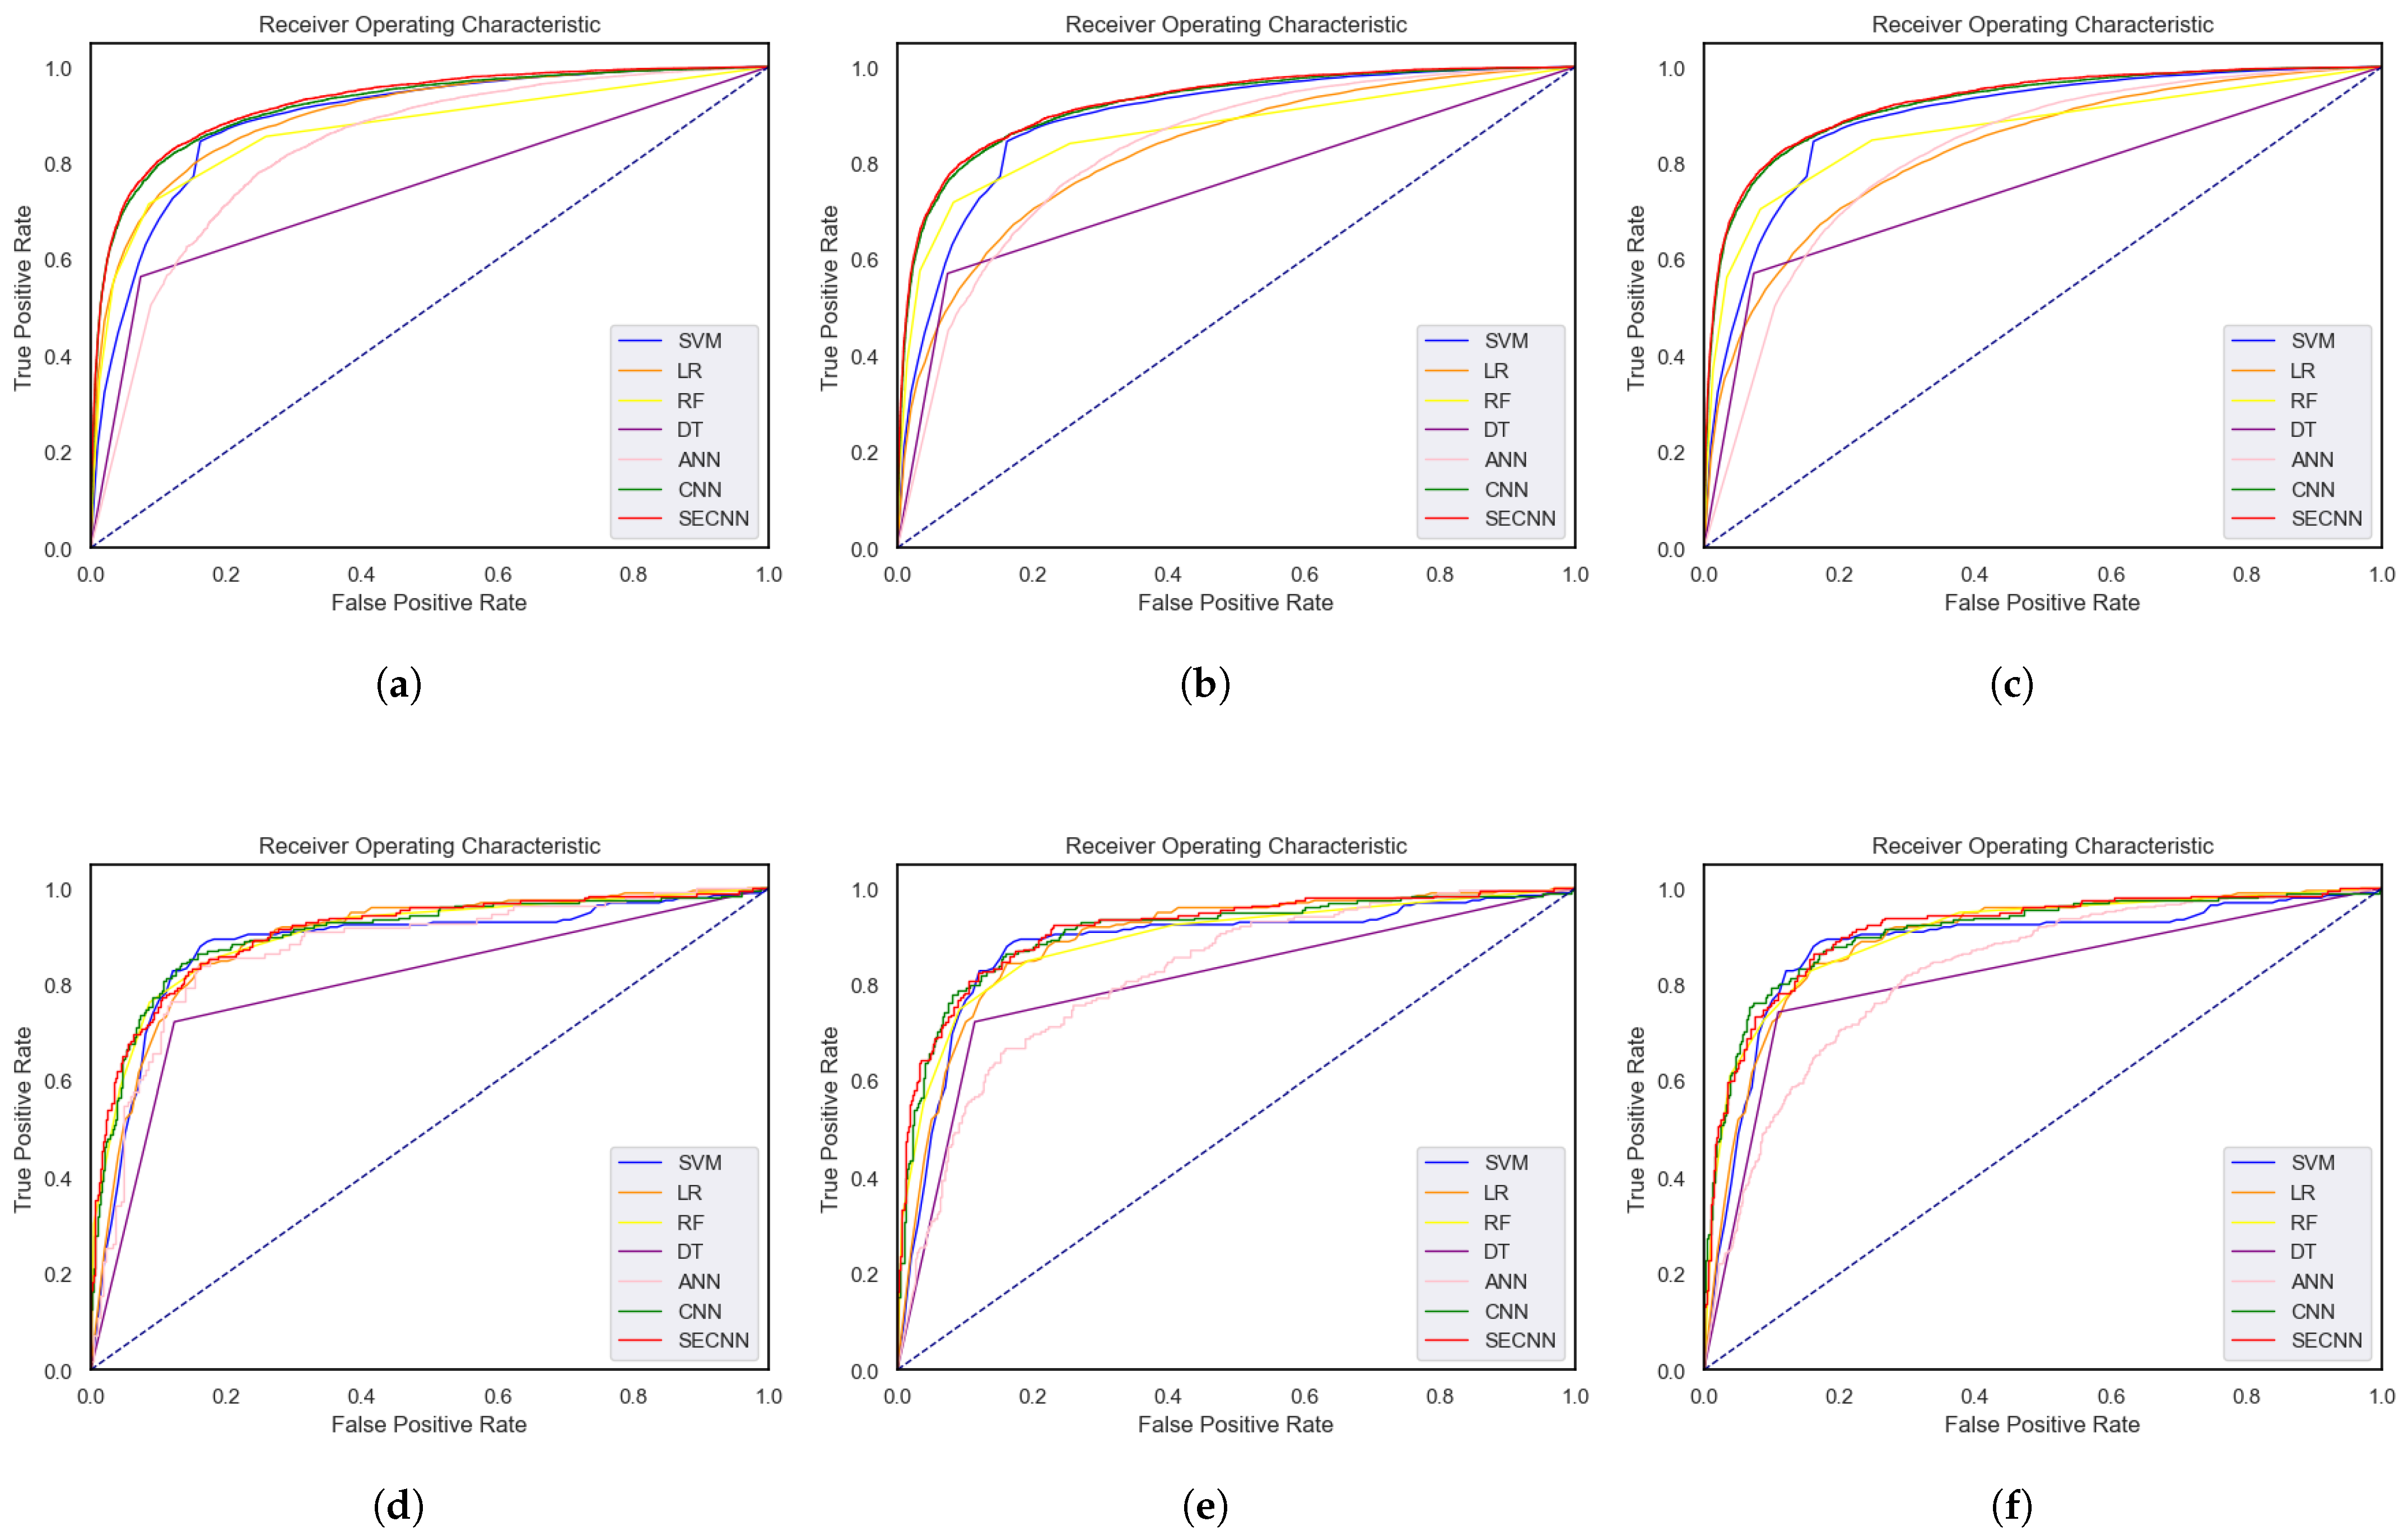
We use 3-fold, 5-fold and 10-fold cross-validation on the dataset, respectively. The ROC curves and accuracy comparisons of SECNN, CNN, SVM, RF, DT and LR are shown in Figure 9 and Figure 10 respectively. We can observe that as the partition fold number K increases, the accuracy of all models increases, and the model performance is the best when using 10-fold cross-validation. We find that compared to the traditional ML model, the DL model we propose exhibits superior performance. Compared with other models, the accuracy and AUC of all dataset partitioning protocols corresponding to the SECNN model are the highest. The model performance corresponding to the NHANES dataset and PID dataset is shown in Table 8 and Table 9, respectively. Compared with traditional ML models, our proposed SECNN model and CNN model perform better. This experiment uses precision, recall, F1-Score, accuracy and AUC as evaluation indicators to evaluate the performance of the model. When predicting using the NHANES dataset, the corresponding evaluation indicators of CNN achieve performance results of 92.77%, 93.18%, 92.74%, 93.18%, and 92.29%, respectively; SECNN achieves performance results of 93.85%, 94.12%, 93.78%, 94.12%, and 92.79%, respectively; and the RF performance is the best among the ML models, achieving performance results of 90.93%, 91.53%, 91.09%, 91.53%, and 86.63%, respectively. Compared with CNN, the performance of SECNN is improved by 1.08%, 0.94%, 1.04%, 0.94%, and 0.50%, respectively. CNN achieves performance results of 87.41%, 87.58%, 87.44%, 87.58%, and 91.37%, respectively; SECNN achieves performance results of 89.36%, 89.47%, 89.38%, 89.47%, and 91.70%, respectively; and the ML model has the best RF performance, achieving performance results of 87.50%, 87.58%, 87.53%, 87.58%, and 90.41%, respectively. Compared with CNN, the performance of SECNN is improved by 1.95%, 1.89%, 1.94%, 1.89%, and 0.33%, respectively. Compared with traditional ML models, we propose that both CNN and SECNN have significant improvements, among which SECNN has the best performance. This further validates the advantages of introducing the SE module in our research. It is proved that the SECNN model exhibits better fitting ability in T2DM prediction, indicating that the SECNN model can well adapt to the proposed diabetes prediction framework.
4.3. Literature Review and Comparison of Results
In this article, we comprehensively compare the performance of other researchers using various machine learning models on the NHANES and PID datasets in recent years as shown in Table 10. In particular, we focus on the models with the highest accuracy in each dataset in the literature and compare these results with our proposed state-of-the-art model SECNN. On the NHANES dataset, SECNN significantly surpasses other models with an accuracy of 94.12%. In the PID dataset, SECNN also performs well, with an accuracy of 89.47%, which is better than the compared models. This result further confirms the good adaptability of SECNN and its powerful prediction ability regarding medical data.Through these comparisons, we not only verify the broad applicability of SECNN as an efficient tool in processing a variety of medical datasets but also demonstrate the innovativeness of our research methods and the potential for practical applications. These results emphasize the importance of continuous exploration and optimization of SECNN in future medical data analysis applications, laying a solid foundation for future research.
5. Discussion
The classification of diabetes is a problem in both the computer field and the medical field. Diabetes prediction is considered a feasible solution in ML, especially in the DL field, which has attracted widespread attention. In the data-preprocessing stage, we use the mean value to fill in missing values because using the mean value can not only maintain the overall statistical characteristics of the original data but also avoid introducing additional bias. And in medical research, the mean value of a specific variable can often reflect the general characteristics of the group and ensure the quality of the dataset. The median value is used for outlier replacement because the median value is more robust against extreme values. When dealing with outliers, we must minimize the negative impact of these extreme values on model performance. As a non-parametric statistic, the median is not affected by extreme values, so it can maintain the consistency of the data when replacing outliers. Through ANOVA, we can determine which features are statistically significantly associated with the occurrence of diabetes, which provides a solid foundation for subsequent model building and ensures that the model can focus on the variables most likely to affect disease prediction. In this paper, we design a CNN and propose SECNN for diabetes prediction, and use five of the most popular ML algorithms to identify and classify T2DM, including SVM, LR, RF, DT, and ANN. Each model has its own pros and cons. For example, DT is easy to understand and fit, LR is simple and fast, and SVM is very accurate in classifying nonlinear data. The traditional CNN model uses the same weight on each feature channel. However, different features have different impacts on model performance, so we introduce the SE module to establish SECNN. After comparative analysis, the SECNN model has the best performance, and its performance is significantly improved compared to CNN. Taking the NHANES dataset as an example, the SECNN model shows significant performance improvement compared with the traditional CNN model. The precision rate is increased by 1.08 percentage points, indicating that the model’s accuracy in predicting positive classes has increased, that is, it can more accurately identify real positive examples. The recall rate is increased by 0.94 percentage points, indicating that the model captured positive classes. The sample proportion increased, reducing the number of missing positive examples. The F1 score is increased by 1.04 percentage points, which reflects a better balance between precision and recall. The accuracy is also increased by 0.94 percentage points, showing that the model has improved. The accuracy of judgments is improved in the overall sample. In addition, the AUC is increased by 0.50 percentage points, further verifying the model’s enhanced ability to distinguish categories. These improvements jointly demonstrate the advantages of the SECNN model in terms of prediction accuracy and reduction of classification errors, significantly improving the overall performance of the model. This shows that the introduction of the SE module can effectively improve the prediction performance of the model, making it more accurate in identifying patients with diabetes and having higher credibility and reliability in the prediction and diagnosis of diabetes.
The advantages of SECNN introducing the SE module in the diabetes prediction task are summarized as follows:
- Improved feature expression ability: The SE module enhances the model’s ability to express key features by adaptively weighting the features of different channels.
- Reduce the impact of redundant features: The SE module can automatically select and adjust the importance of channels, reduce the impact of redundant features, increase the model’s attention to key features, and improve the robustness and generalization ability of diabetes-related features.
5.1. Limitation
This article uses the NHANES dataset and the PID dataset for prediction. The PID dataset contains information on 768 women and includes samples representing pregnancy periods, so it can be regarded as a dataset representing pregnancy characteristics among diabetic patients. The NHANES dataset contains information on 37,079 samples. Compared with the PID dataset, the NHANES dataset has a larger number of samples and more feature information. This allows the NHANES dataset to solve the problem of less data and fewer features in the PID dataset to a certain extent. Although this study used the NHANES dataset and the PID dataset for prediction, there are still some limitations that need to be considered.
- Although the NHANES dataset has a larger sample size and more feature information, it does not have a subset for special groups such as children. This may result in results that are less accurate or applicable to age-specific prediction problems. Therefore, when making predictions using the NHANES dataset, one needs to carefully consider the age distribution of the sample and be careful to interpret the results as being applicable to specific age groups.
- Whether it is the PID dataset or the NHANES dataset, there are missing or incomplete data. The processing of these missing values may have a certain impact on the prediction results.
5.2. Future Work
In order to better predict specific groups, we hope to focus future research on the elderly and children, two specific groups, and establish a prediction framework suitable for these groups. By focusing on these specific groups, we can better understand and address their unique challenges and needs in diabetes prediction. Secondly, we recommend avoiding missing values and outliers during data collection to avoid affecting the performance of the model.
6. Conclusions
The prediction of diabetes is a very challenging task. In this paper, we propose a stable T2DM prediction framework aimed at improving the performance of diabetes prediction on the NHANES dataset and PID dataset. The framework employs a series of preprocessing steps, including missing value filling, outlier replacement, feature importance analysis, data standardization, and sample class weight assignment. And we propose the SECNN model and CNN model. Furthermore, our framework is also applicable to traditional ML models, which all show good performance in handling T2DM classification problems. On the PID dataset, the SECNN model achieves an accuracy of 89.4%, and the CNN model achieves an accuracy of 87.58%. On the NHANES dataset, the SECNN model achieves an accuracy of 94.12%, and the CNN model achieves an accuracy of 93.18%. Our proposed model exhibits excellent performance in T2DM prediction. These results demonstrate that our proposed SECNN model has excellent performance in T2DM prediction. Whether on the PID dataset or the NHANES dataset, the SECNN model can more accurately predict T2DM patients. This further verifies the superiority and adaptability of our proposed model in T2DM prediction.
Our research results show that the SECNN model exhibits excellent performance in predicting T2DM, validating the view that introducing the SE module can significantly improve performance. Furthermore, our proposed deep learning model shows better performance compared to traditional machine learning (ML) models. Therefore, we conclude that the T2DM prediction framework developed in this study incorporates advanced preprocessing steps and multiple machine learning models to significantly improve the prediction accuracy of type 2 diabetes. Experiments on NHANES and PID datasets verify the effectiveness of this framework. In particular, the SECNN model has proven its important value in the field of diabetes prediction with its excellent stability and excellent prediction performance. Furthermore, our method not only performs diabetes prediction but also provides insights into understanding the pathogenesis of diabetes. Therefore, this study not only provides an effective tool for the early diagnosis and treatment of T2DM but also deepens our understanding of the progression of the disease.
Author Contributions
Conceptualization, H.G.; methodology, H.G.; software, H.G.; validation, H.G., T.A. and C.Y.; formal analysis, H.G.; investigation, H.G.; resources, J.Z.; data curation, L.S.; writing—original draft preparation, H.G.; writing—review and editing, J.Z. and Z.K.; visualization, H.G.; supervision, J.Z. and Z.K.; project administration, J.Z.; funding acquisition, J.Z. All authors have read and agreed to the published version of the manuscript.
Funding
This work was partially supported by the Jilin Provincial Department of Science and Technology (Nos. YDZJ202303CGZH010, YDZJ202301ZYTS496, 20230401092YY, 20210101477JC).
Institutional Review Board Statement
Not applicable.
Informed Consent Statement
Not applicable.
Data Availability Statement
The data presented in this study are available in publicly available databases. The PIMA Indian Diabetes Dataset is accessible through the Kaggle platform at: https://www.kaggle.com/datasets/uciml/pima-indians-diabetes-database (accessed on 3 May 2024); Dataset from the National Health and Nutrition Examination Surveys (NHANES) are available through the Centers for Disease Control and Prevention’s NHANES database website at https://www.cdc.gov/nchs/nhanes/index.htm (accessed on 3 May 2024).
Conflicts of Interest
The authors declare no conflicts of interest.
References
- Misra, A.; Gopalan, H.; Jayawardena, R.; Hills, A.P.; Soares, M.; Reza-Albarrán, A.A.; Ramaiya, K.L. Diabetes in developing countries. J. Diabetes 2019, 11, 522–539. [Google Scholar] [CrossRef]
- Forbes, J.M.; Cooper, M.E. Mechanisms of diabetic complications. Physiol. Rev. 2013, 93, 137–188. [Google Scholar] [CrossRef]
- Care, D. Classification and diagnosis of diabetes. Diabetes Care 2017, 40, S11–S24. [Google Scholar]
- Atkinson, M.A.; Eisenbarth, G.S.; Michels, A.W. Type 1 diabetes. Lancet 2014, 383, 69–82. [Google Scholar] [CrossRef]
- Ziegler, A.G.; Nepom, G.T. Prediction and pathogenesis in type 1 diabetes. Immunity 2010, 32, 468–478. [Google Scholar] [CrossRef]
- Colman, P.G.; McNair, P.D.; Gellert, S.; Kewming, K.; Schmidli, R.S.; Steele, C.E.; Harrison, L.C. Development of autoantibodies to islet antigens during childhood: Implications for preclinical type 1 diabetes screening. Pediatr. Diabetes 2002, 3, 144–148. [Google Scholar] [CrossRef]
- Wu, J.H.; Li, J.; Wang, J.; Zhang, L.; Wang, H.D.; Wang, G.L.; Li, X.l.; Yuan, J.X. Risk prediction of type 2 diabetes in steel workers based on convolutional neural network. Neural Comput. Appl. 2020, 32, 9683–9698. [Google Scholar] [CrossRef]
- McIntyre, H.D.; Catalano, P.; Zhang, C.; Desoye, G.; Mathiesen, E.R.; Damm, P. Gestational diabetes mellitus. Nat. Rev. Dis. Prim. 2019, 5, 47. [Google Scholar] [CrossRef]
- Emerging Risk Factors Collaboration. Diabetes mellitus, fasting blood glucose concentration, and risk of vascular disease: A collaborative meta-analysis of 102 prospective studies. Lancet 2010, 375, 2215–2222. [Google Scholar] [CrossRef]
- Cho, N.H.; Shaw, J.; Karuranga, S.; Huang, Y.; da Rocha Fernandes, J.; Ohlrogge, A.; Malanda, B. IDF Diabetes Atlas: Global estimates of diabetes prevalence for 2017 and projections for 2045. Diabetes Res. Clin. Pract. 2018, 138, 271–281. [Google Scholar] [CrossRef]
- Saeedi, P.; Petersohn, I.; Salpea, P.; Malanda, B.; Karuranga, S.; Unwin, N.; Colagiuri, S.; Guariguata, L.; Motala, A.A.; Ogurtsova, K.; et al. Global and regional diabetes prevalence estimates for 2019 and projections for 2030 and 2045: Results from the International Diabetes Federation Diabetes Atlas. Diabetes Res. Clin. Pract. 2019, 157, 107843. [Google Scholar] [CrossRef]
- Mi, S.Q. Establishing and Validating of Type II Diabetes Incident Prediction Model of Chinese Adult at Individual Level; Chronic Center, Chinese Center for Disease Control and Prevention: Beijing, China, 2011. [Google Scholar]
- Basanta-Alario, M.L.; Ferri, J.; Civera, M.; Martínez-Hervás, S.; Ascaso, J.F.; Real, J.T. Differences in clinical and biological characteristics and prevalence of chronic complications related to aging in patients with type 2 diabetes. Endocrinol. Nutr. Engl. Ed. 2016, 63, 79–86. [Google Scholar] [CrossRef]
- Raz, I.; Riddle, M.C.; Rosenstock, J.; Buse, J.B.; Inzucchi, S.E.; Home, P.D.; Del Prato, S.; Ferrannini, E.; Chan, J.C.; Leiter, L.A.; et al. Personalized management of hyperglycemia in type 2 diabetes: Reflections from a Diabetes Care Editors’ Expert Forum. Diabetes Care 2013, 36, 1779–1788. [Google Scholar] [CrossRef]
- Khan, F.A.; Zeb, K.; Al-Rakhami, M.; Derhab, A.; Bukhari, S.A.C. Detection and prediction of diabetes using data mining: A comprehensive review. IEEE Access 2021, 9, 43711–43735. [Google Scholar] [CrossRef]
- Cortes, C.; Vapnik, V. Support-vector networks. Mach. Learn. 1995, 20, 273–297. [Google Scholar] [CrossRef]
- Reinhardt, A.; Hubbard, T. Using neural networks for prediction of the subcellular location of proteins. Nucleic Acids Res. 1998, 26, 2230–2236. [Google Scholar] [CrossRef]
- Kégl, B. The return of AdaBoost. MH: Multi-class Hamming trees. arXiv 2013, arXiv:1312.6086. [Google Scholar]
- Tabaei, B.P.; Herman, W.H. A multivariate logistic regression equation to screen for diabetes: Development and validation. Diabetes Care 2002, 25, 1999–2003. [Google Scholar] [CrossRef]
- Jenhani, I.; Amor, N.B.; Elouedi, Z. Decision trees as possibilistic classifiers. Int. J. Approx. Reason. 2008, 48, 784–807. [Google Scholar] [CrossRef]
- Breiman, L.; Cutler, R. Random forests machine learning. J. Clin. Microbiol. 2001, 2, 199–228. [Google Scholar]
- Maniruzzaman, M.; Rahman, M.J.; Al-MehediHasan, M.; Suri, H.S.; Abedin, M.M.; El-Baz, A.; Suri, J.S. Accurate diabetes risk stratification using machine learning: Role of missing value and outliers. J. Med. Syst. 2018, 42, 92. [Google Scholar] [CrossRef]
- Maniruzzaman, M.; Rahman, M.J.; Ahammed, B.; Abedin, M.M. Classification and prediction of diabetes disease using machine learning paradigm. Health Inf. Sci. Syst. 2020, 8, 7. [Google Scholar] [CrossRef]
- Naz, H.; Ahuja, S. Deep learning approach for diabetes prediction using PIMA Indian dataset. J. Diabetes Metab. Disord. 2020, 19, 391–403. [Google Scholar] [CrossRef]
- Hasan, K.A.; Hasan, M.A.M. Prediction of clinical risk factors of diabetes using multiple machine learning techniques resolving class imbalance. In Proceedings of the 2020 23rd International Conference on Computer and Information Technology (ICCIT), Dhaka, Bangladesh, 19–21 December 2020; pp. 1–6. [Google Scholar]
- Hasan, M.K.; Alam, M.A.; Das, D.; Hossain, E.; Hasan, M. Diabetes prediction using ensembling of different machine learning classifiers. IEEE Access 2020, 8, 76516–76531. [Google Scholar] [CrossRef]
- Sivaranjani, S.; Ananya, S.; Aravinth, J.; Karthika, R. Diabetes prediction using machine learning algorithms with feature selection and dimensionality reduction. In Proceedings of the 2021 7th International Conference on Advanced Computing and Communication Systems (ICACCS), Coimbatore, India, 19–20 March 2021; Volume 1, pp. 141–146. [Google Scholar]
- Khanam, J.J.; Foo, S.Y. A comparison of machine learning algorithms for diabetes prediction. ICT Express 2021, 7, 432–439. [Google Scholar] [CrossRef]
- Olisah, C.C.; Smith, L.; Smith, M. Diabetes mellitus prediction and diagnosis from a data preprocessing and machine learning perspective. Comput. Methods Programs Biomed. 2022, 220, 106773. [Google Scholar] [CrossRef]
- Rastogi, R.; Bansal, M. Diabetes prediction model using data mining techniques. Meas. Sens. 2023, 25, 100605. [Google Scholar] [CrossRef]
- Kumar, S.; Bhusan, B.; Singh, D.; kumar Choubey, D. Classification of diabetes using deep learning. In Proceedings of the 2020 International Conference on Communication and Signal Processing (ICCSP), Chennai, India, 28–30 July 2020; pp. 0651–0655. [Google Scholar]
- Abedini, M.; Bijari, A.; Banirostam, T. Classification of Pima Indian diabetes dataset using ensemble of decision tree, logistic regression and neural network. Int. J. Adv. Res. Comput. Commun. Eng. 2020, 9, 7–10. [Google Scholar] [CrossRef]
- Roy, K.; Ahmad, M.; Waqar, K.; Priyaah, K.; Nebhen, J.; Alshamrani, S.S.; Raza, M.A.; Ali, I. An enhanced machine learning framework for type 2 diabetes classification using imbalanced data with missing values. Complexity 2021, 2021, 9953314. [Google Scholar] [CrossRef]
- Ahmed, U.; Issa, G.F.; Khan, M.A.; Aftab, S.; Khan, M.F.; Said, R.A.; Ghazal, T.M.; Ahmad, M. Prediction of diabetes empowered with fused machine learning. IEEE Access 2022, 10, 8529–8538. [Google Scholar] [CrossRef]
- Abnoosian, K.; Farnoosh, R.; Behzadi, M.H. Prediction of diabetes disease using an ensemble of machine learning multi-classifier models. BMC Bioinform. 2023, 24, 337. [Google Scholar] [CrossRef] [PubMed]
- Dutta, A.; Batabyal, T.; Basu, M.; Acton, S.T. An efficient convolutional neural network for coronary heart disease prediction. Expert Syst. Appl. 2020, 159, 113408. [Google Scholar] [CrossRef]
- Smith, J.W.; Everhart, J.E.; Dickson, W.; Knowler, W.C.; Johannes, R.S. Using the ADAP learning algorithm to forecast the onset of diabetes mellitus. In Proceedings of the Annual Symposium on Computer Application in Medical Care; American Medical Informatics Association: Bethesda, MD, USA, 1988; p. 261. [Google Scholar]
- Lin, W.C.; Tsai, C.F. Missing value imputation: A review and analysis of the literature (2006–2017). Artif. Intell. Rev. 2020, 53, 1487–1509. [Google Scholar] [CrossRef]
- Cousineau, D.; Chartier, S. Outliers detection and treatment: A review. Int. J. Psychol. Res. 2010, 3, 58–67. [Google Scholar] [CrossRef]
- Bansal, R.; Gaur, N.; Singh, S.N. Outlier detection: Applications and techniques in data mining. In Proceedings of the 2016 6th International Conference-Cloud System and Big Data Engineering (Confluence), Noida, India, 14–15 January 2016; pp. 373–377. [Google Scholar]
- Vinutha, H.; Poornima, B.; Sagar, B. Detection of outliers using interquartile range technique from intrusion dataset. In Information and Decision Sciences: Proceedings of the 6th International Conference on FICTA; Springer: Singapore, 2018; pp. 511–518. [Google Scholar]
- Storey, J.D.; Tibshirani, R. Statistical significance for genomewide studies. Proc. Natl. Acad. Sci. USA 2003, 100, 9440–9445. [Google Scholar] [CrossRef]
- Batista, G.E.; Prati, R.C.; Monard, M.C. A study of the behavior of several methods for balancing machine learning training data. ACM SIGKDD Explor. Newsl. 2004, 6, 20–29. [Google Scholar] [CrossRef]
- Sun, Y.; Wong, A.K.; Kamel, M.S. Classification of imbalanced data: A review. Int. J. Pattern Recognit. Artif. Intell. 2009, 23, 687–719. [Google Scholar] [CrossRef]
- Weiss, G.M. Mining with rarity: A unifying framework. ACM SIGKDD Explor. Newsl. 2004, 6, 7–19. [Google Scholar] [CrossRef]
- Roshan, S.E.; Asadi, S. Improvement of Bagging performance for classification of imbalanced datasets using evolutionary multi-objective optimization. Eng. Appl. Artif. Intell. 2020, 87, 103319. [Google Scholar] [CrossRef]
- Oyedotun, O.K.; Khashman, A. Document segmentation using textural features summarization and feedforward neural network. Appl. Intell. 2016, 45, 198–212. [Google Scholar] [CrossRef]
- Konomi, M.; Sacha, G. Feedforward neural network methodology to characterize thin films by Electrostatic Force Microscopy. Ultramicroscopy 2017, 182, 243–248. [Google Scholar] [CrossRef] [PubMed]
- Wang, Y.; Li, Y.; Wang, J.; Lv, H. An optical flow estimation method based on multiscale anisotropic convolution. Appl. Intell. 2024, 54, 398–413. [Google Scholar] [CrossRef]
- Srivastava, N.; Hinton, G.; Krizhevsky, A.; Sutskever, I.; Salakhutdinov, R. Dropout: A simple way to prevent neural networks from overfitting. J. Mach. Learn. Res. 2014, 15, 1929–1958. [Google Scholar]
- Arlot, S.; Celisse, A. A survey of cross-validation procedures for model selection. Stat. Surv. 2010, 4, 40–79. [Google Scholar] [CrossRef]
- Deo, R.; Panigrahi, S. Performance assessment of machine learning based models for diabetes prediction. In Proceedings of the 2019 IEEE Healthcare Innovations and Point of Care Technologies (HI-POCT), Bethesda, MD, USA, 20–22 November 2019; pp. 147–150. [Google Scholar]
Figure 1.
Robust diabetes prediction framework proposed in this article.

Figure 2.
Datasets category distribution chart, where (a) represents the category distribution of the NHANES dataset, and (b) represents the category distribution of the PID dataset.
Figure 2.
Datasets category distribution chart, where (a) represents the category distribution of the NHANES dataset, and (b) represents the category distribution of the PID dataset.
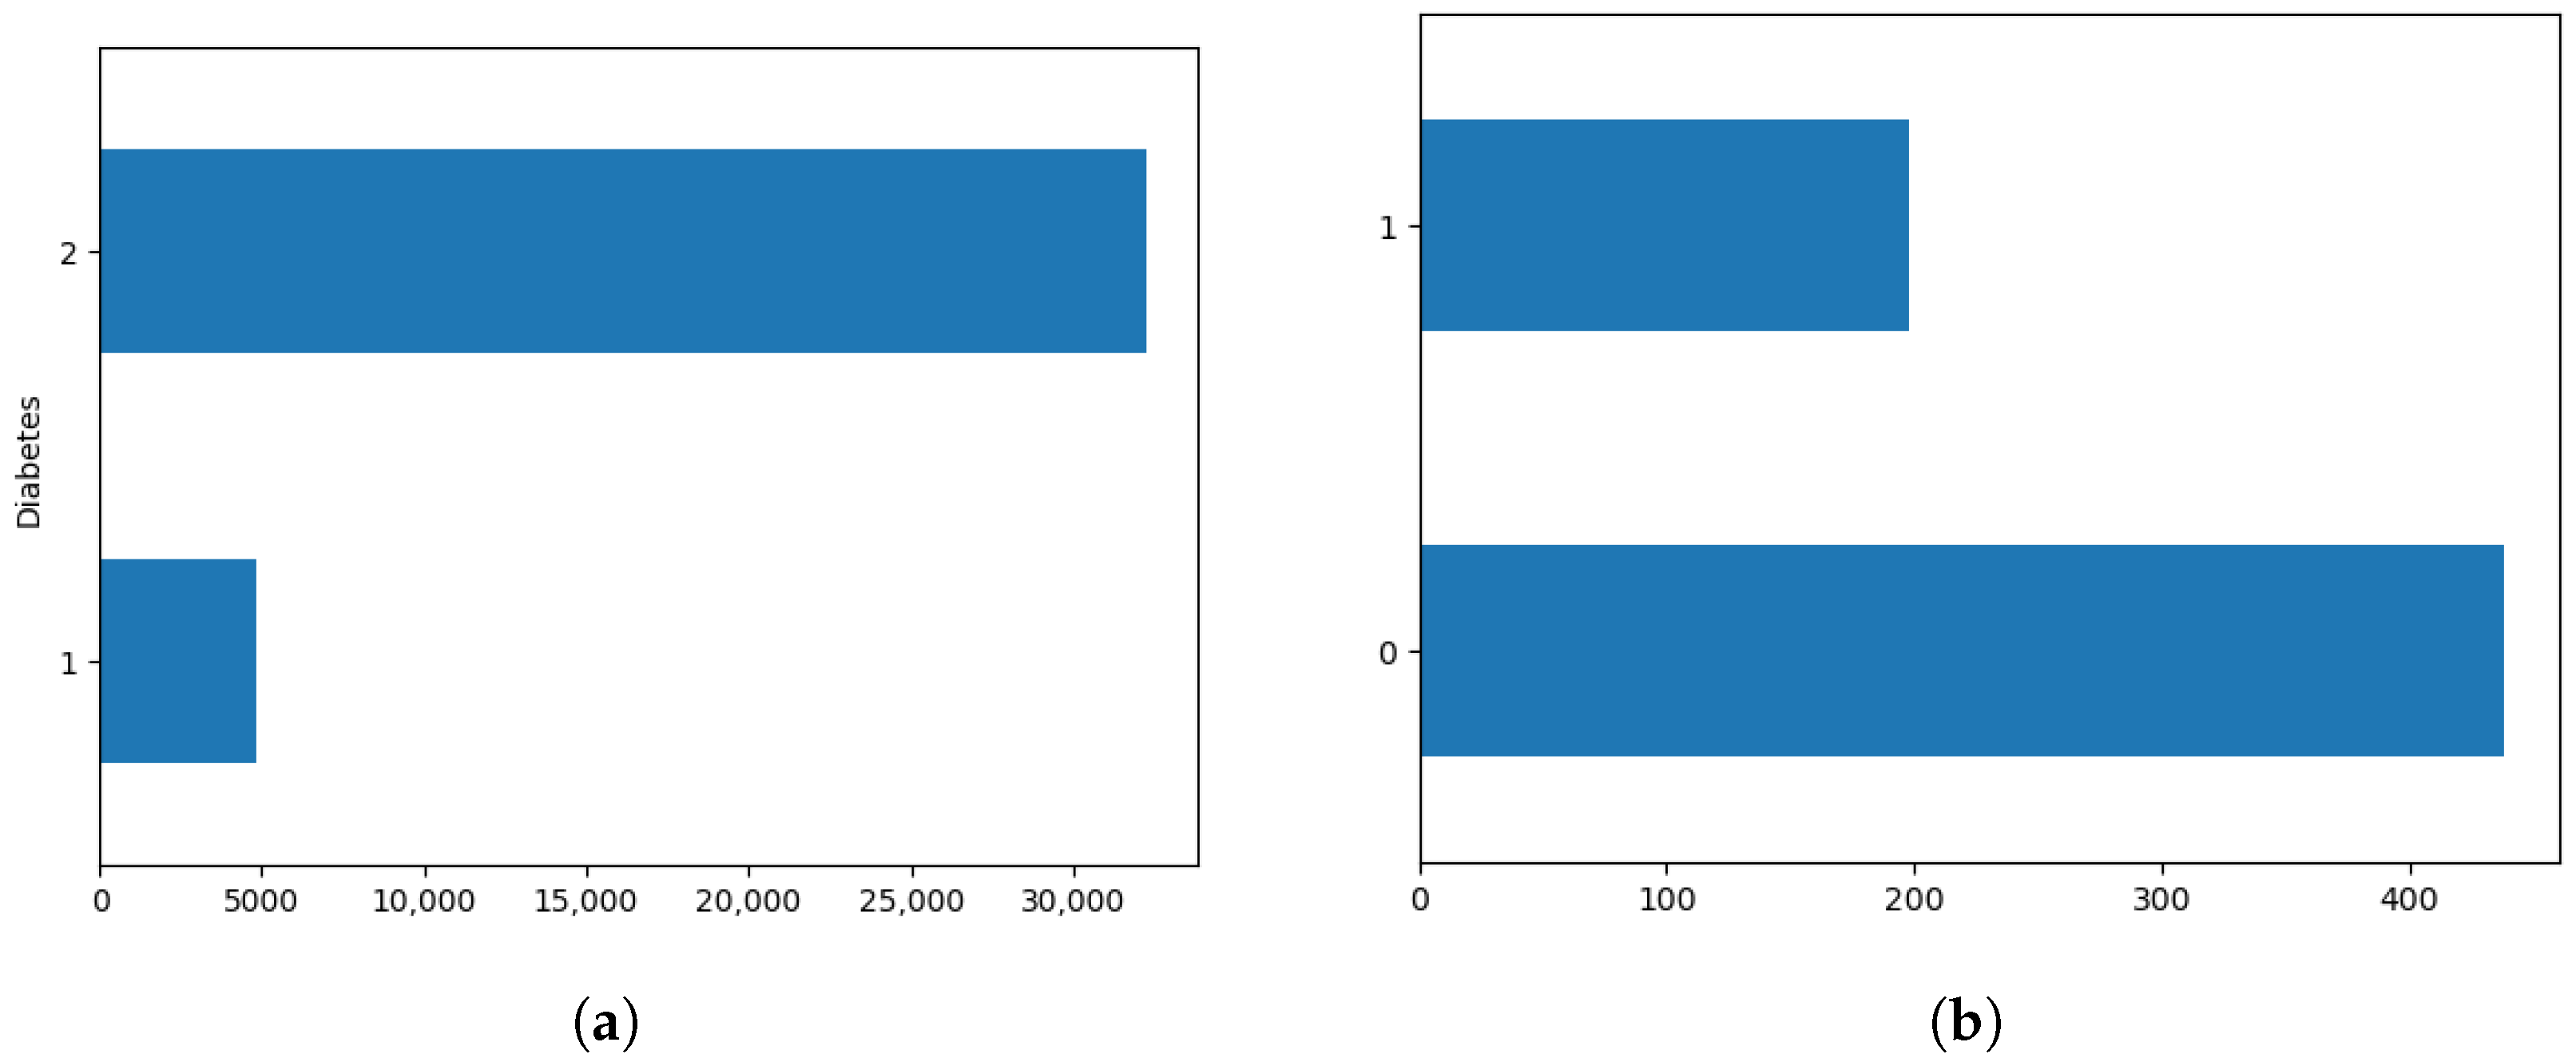
Figure 3.
The structure diagram of the CNN model proposed in this article.
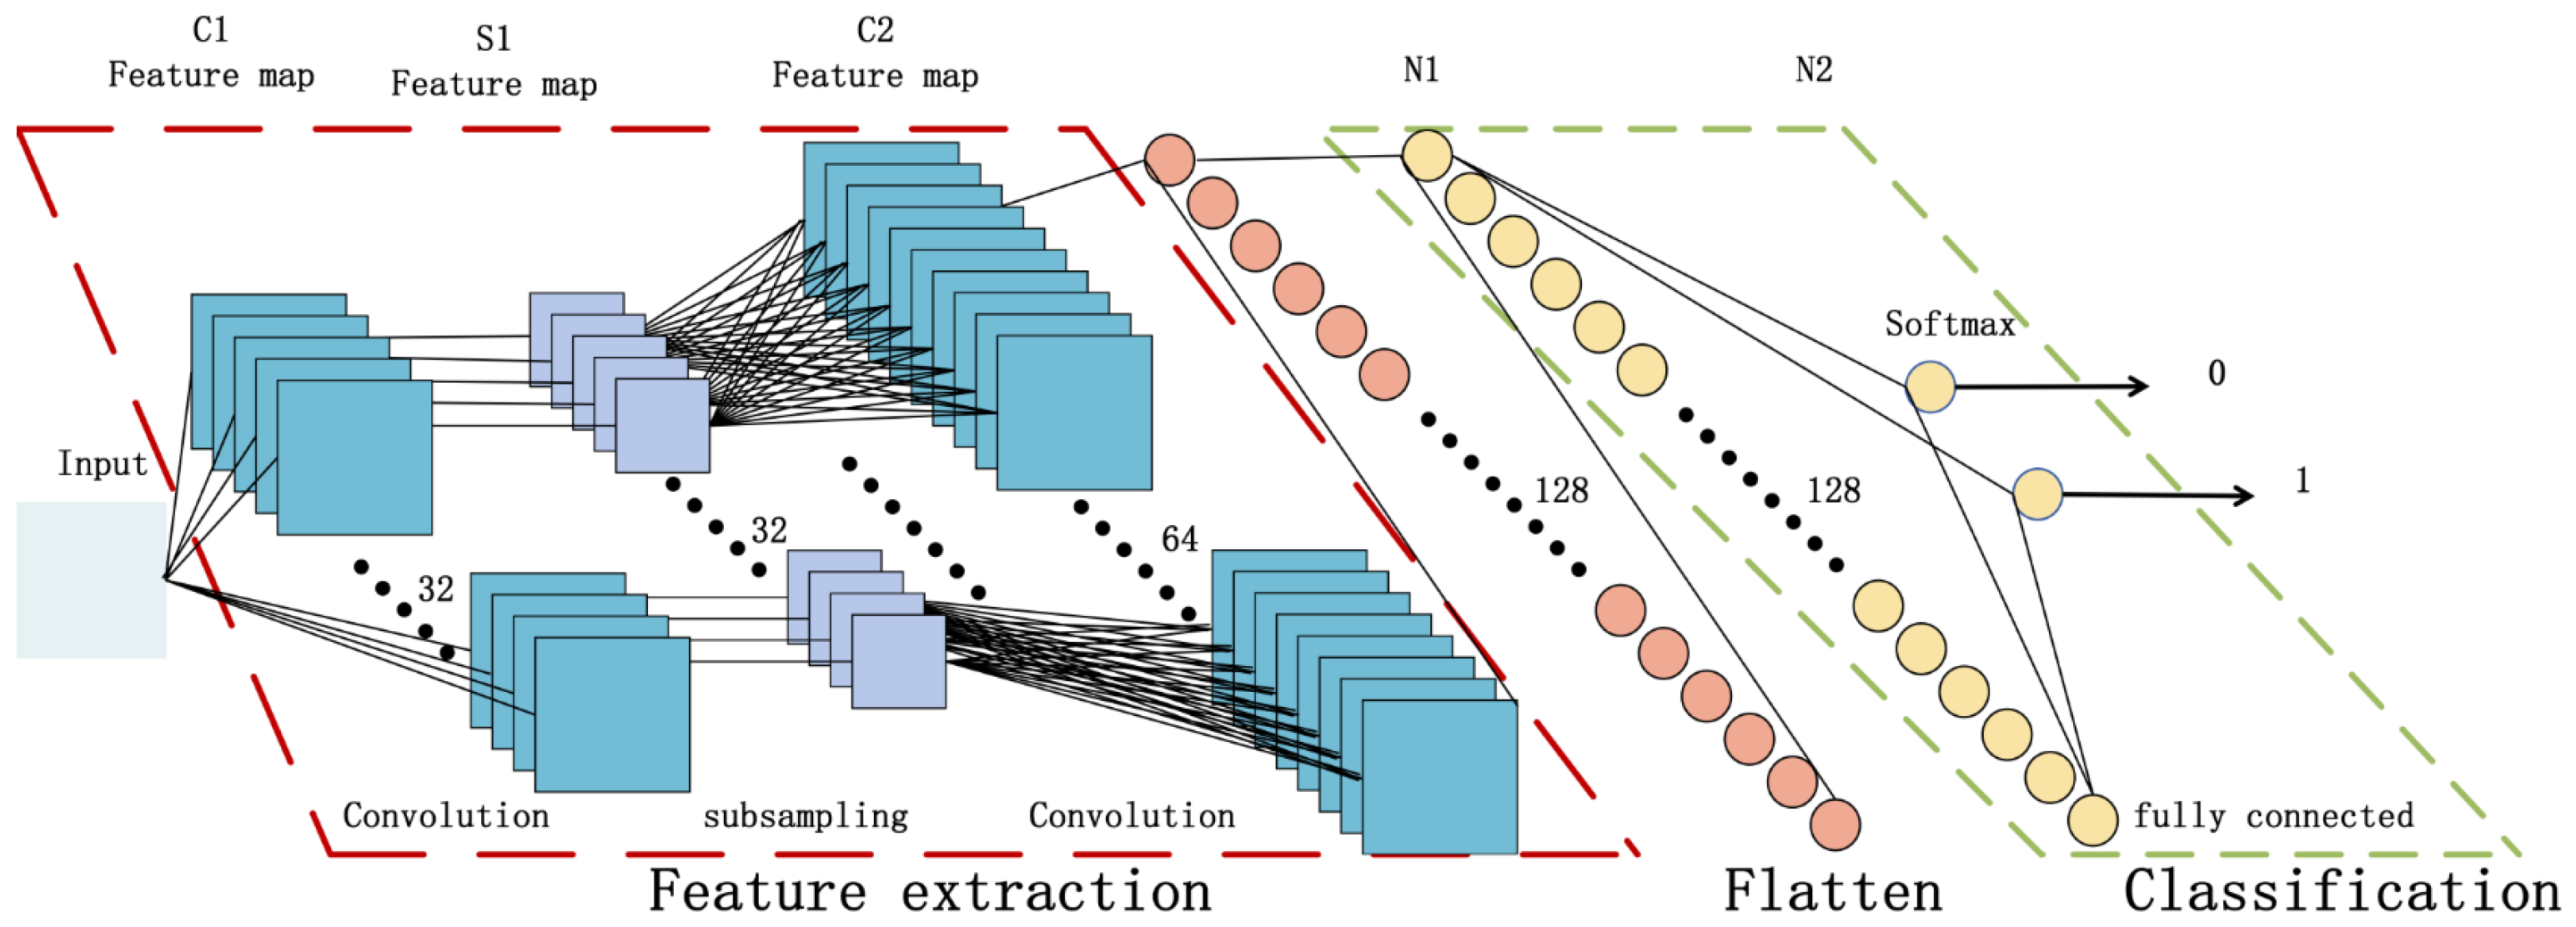
Figure 4.
SECNN model established for T2DM prediction.

Figure 5.
Boxplots before and after outlier processing in the PID dataset and NHANES dataset, where (a) is the box plot of the PID dataset before outlier processing, (b) is the box plot of the PID dataset after outlier processing, (c) is the box plot of the NHANES dataset before outlier processing, and (d) is the box plot of the NHANES dataset after outlier processing.
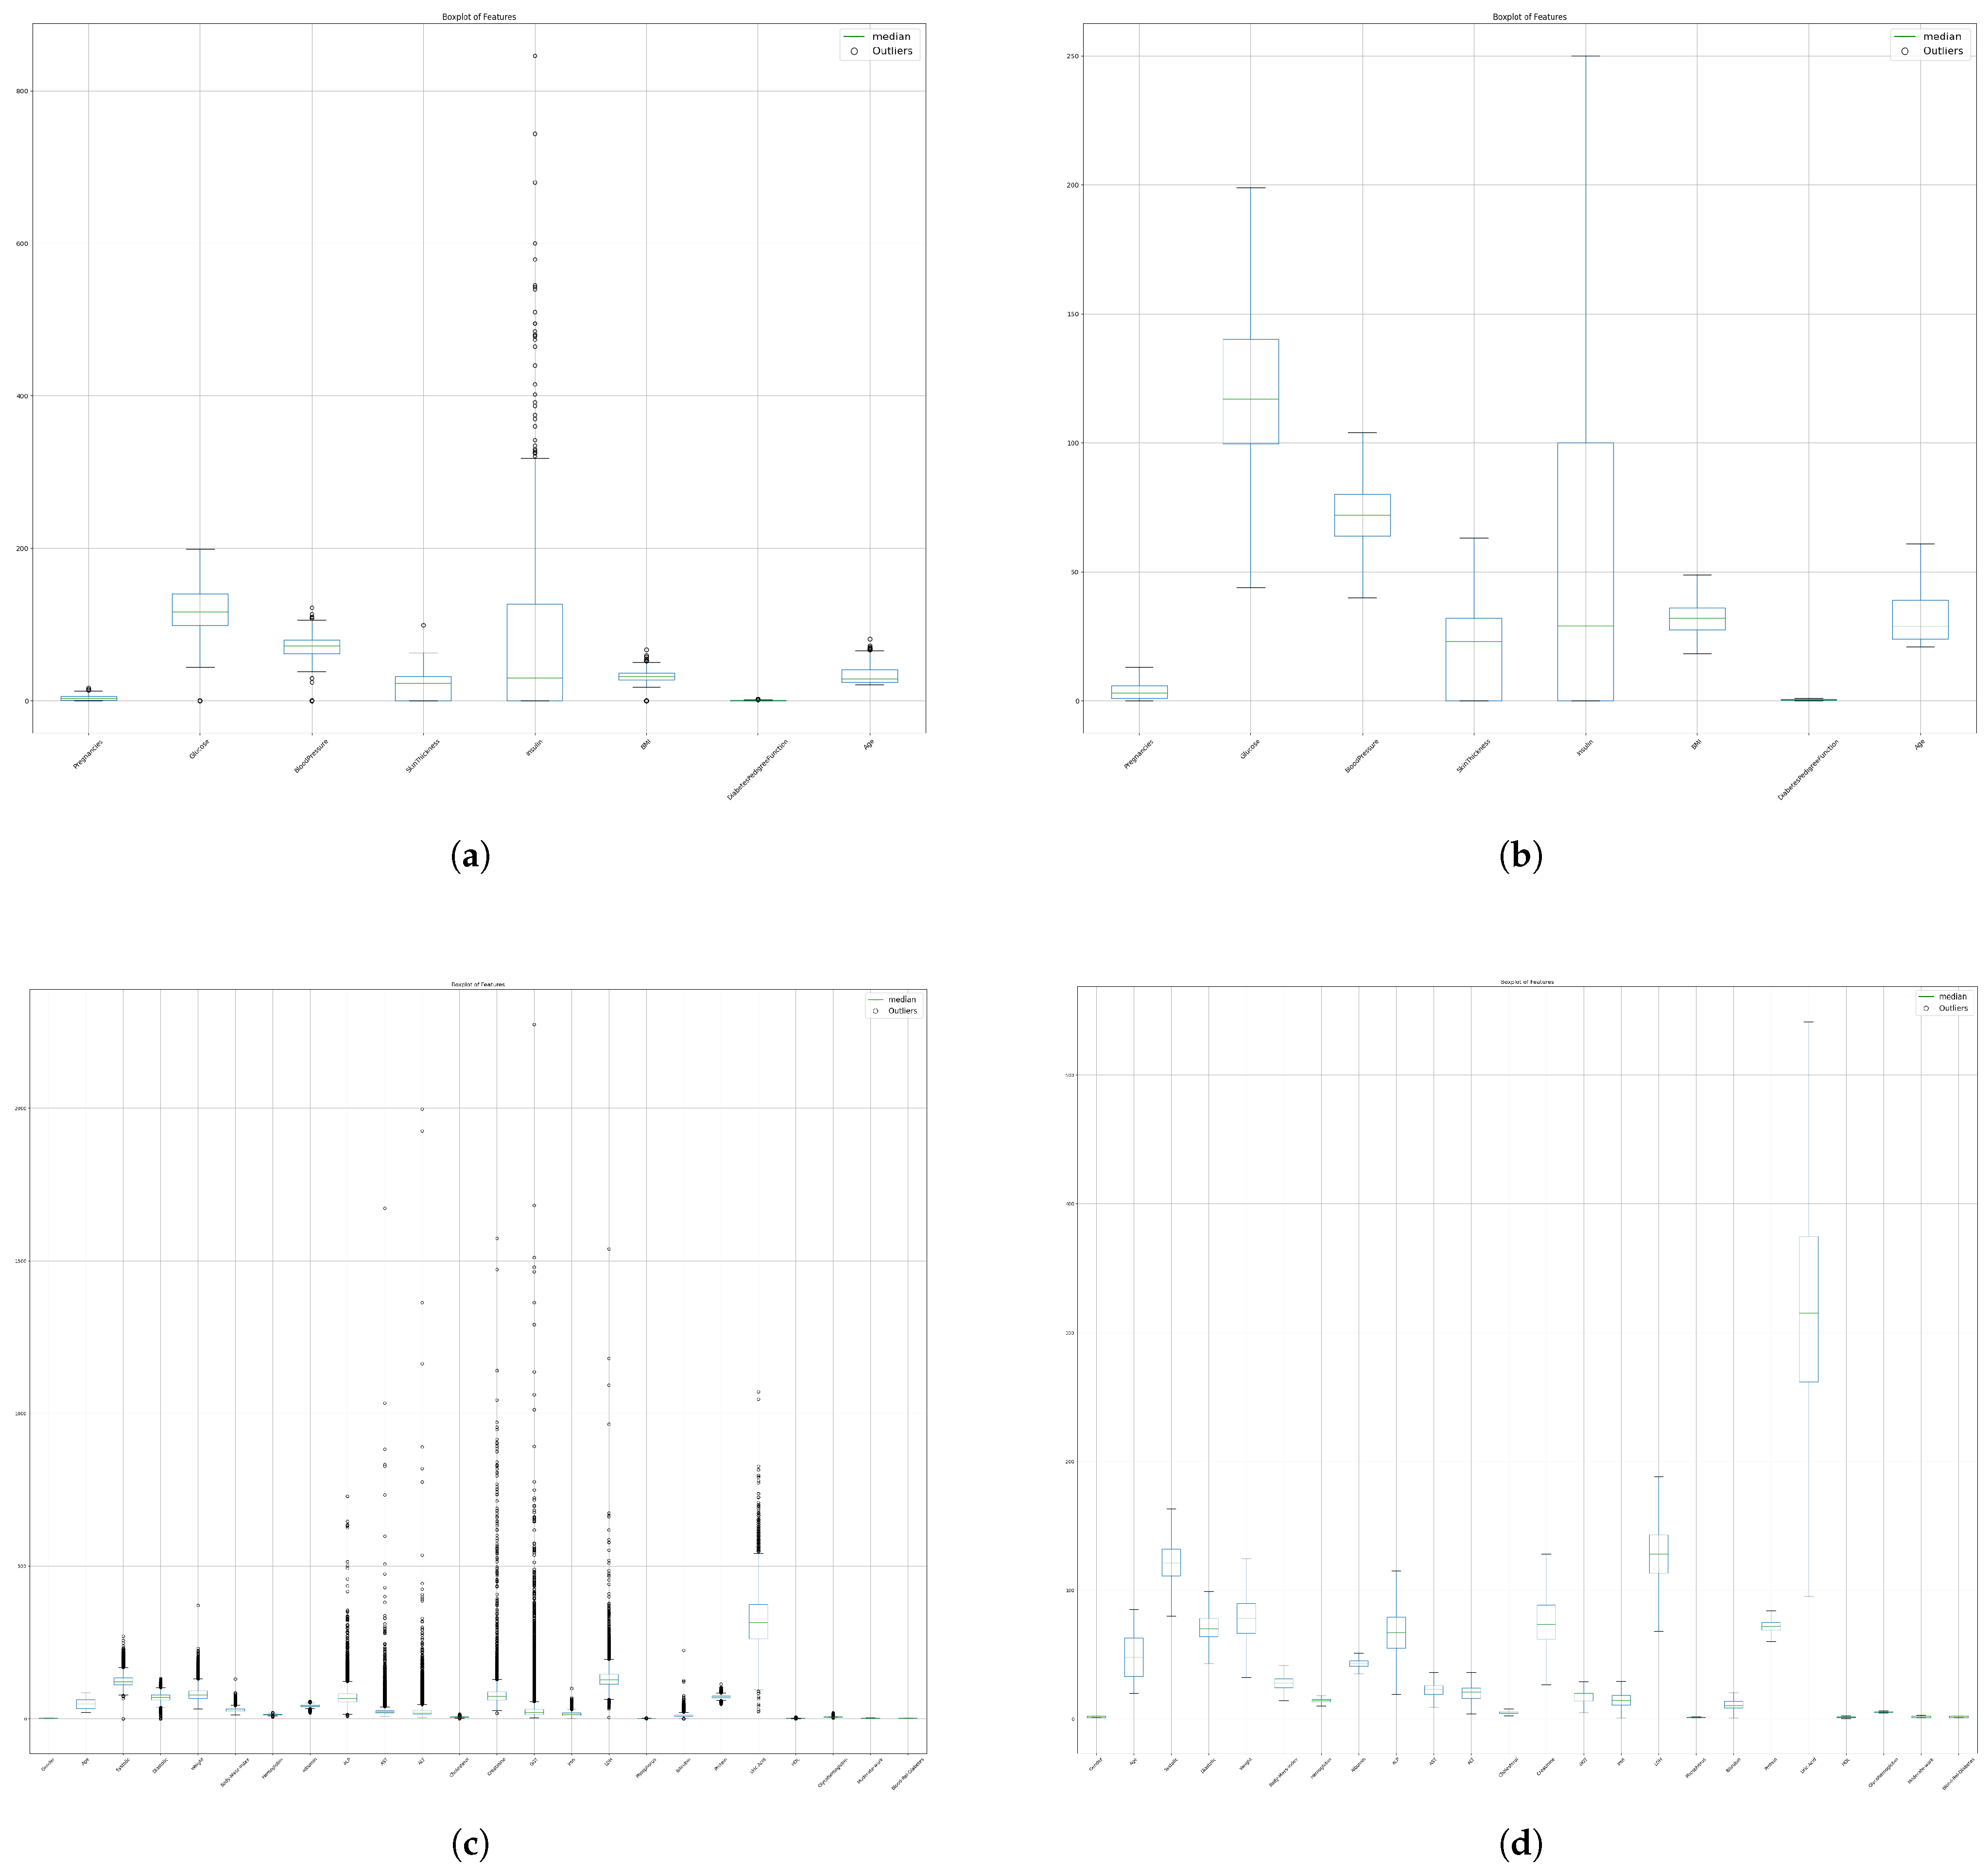
Figure 6.
Overall distribution diagram of attributes of PID dataset and NHANES dataset. Among them (a) is the overall distribution of features before data preprocessing in the PID dataset, and (b) is the overall distribution of features after data preprocessing in the PID dataset, (c) is the overall distribution of features before data preprocessing in the NHANES dataset, and (d) is the overall distribution of features after data preprocessing in the NHANES dataset.
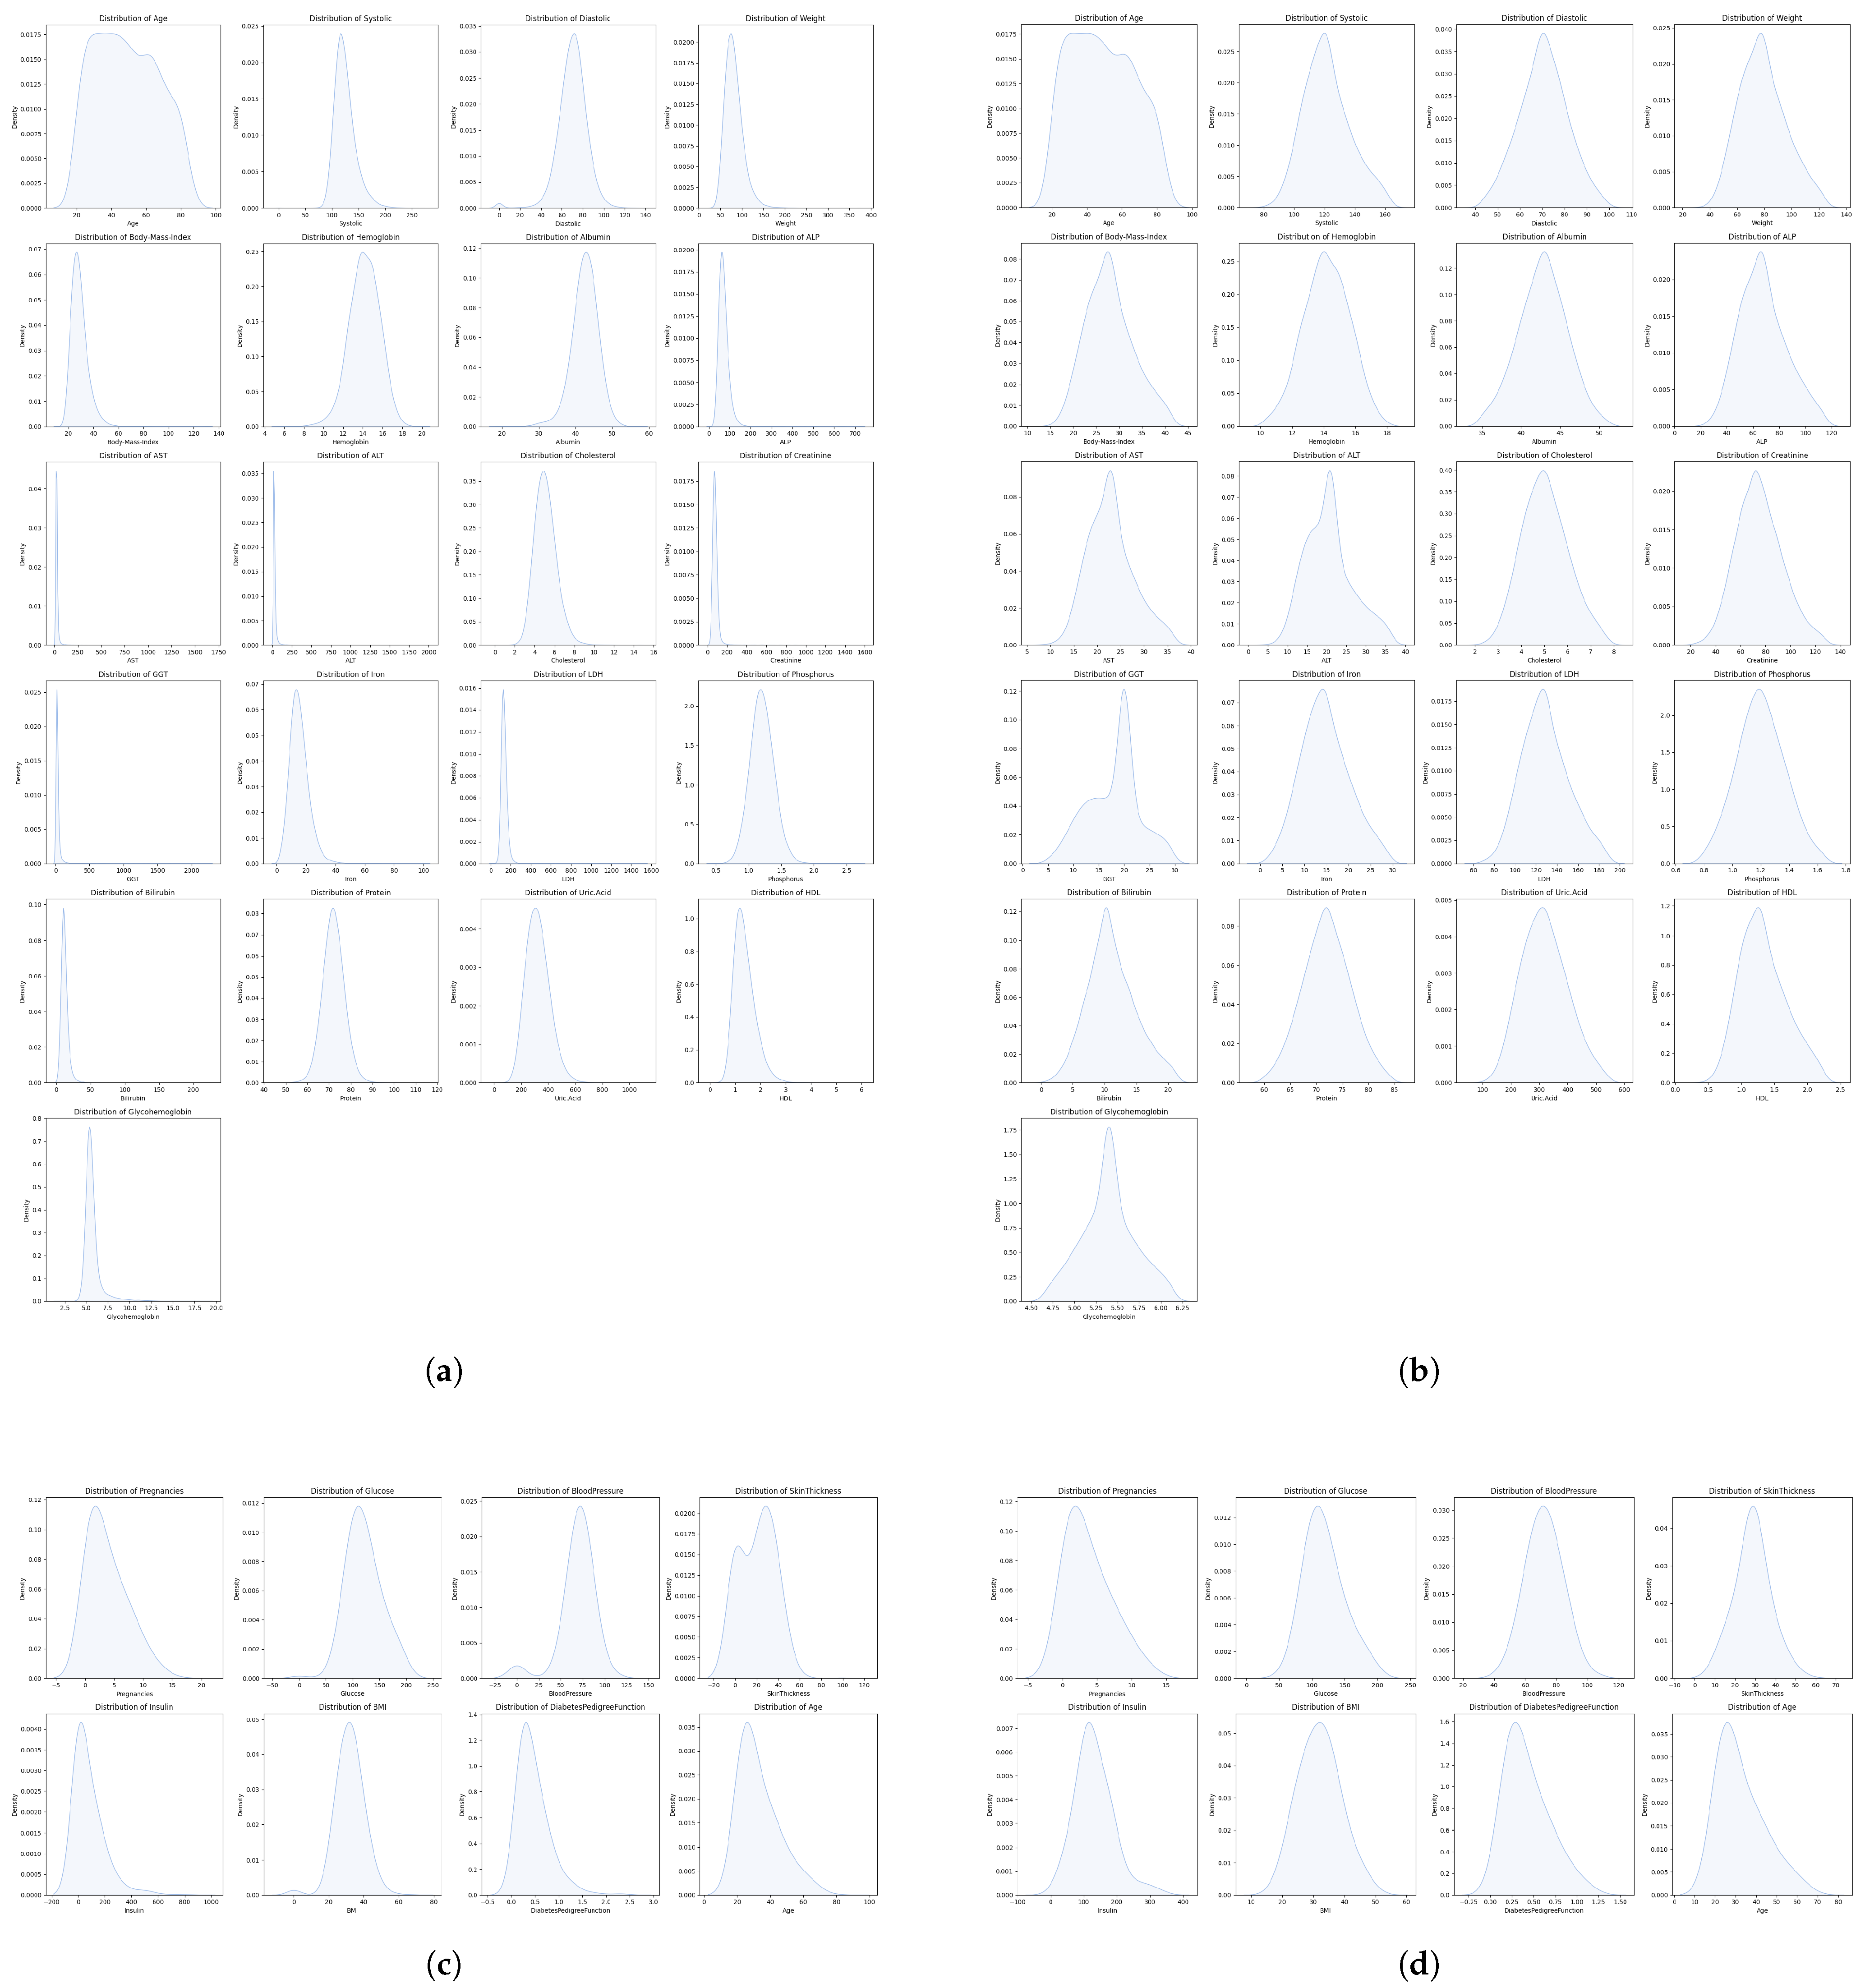
Figure 7.
Correlation matrix of PID dataset and NHANES dataset. Among them (a) is the correlation matrix before data preprocessing of the PID dataset, (b) is the correlation matrix after data preprocessing of the PID dataset, (c) is the correlation matrix before data preprocessing of the NHANES dataset, and (d) is the correlation matrix after data preprocessing of the NHANES dataset.

Figure 8.
The relationship diagram between accuracy and category weight, where (a) is the NHANES dataset and (b) is the PID dataset.
Figure 8.
The relationship diagram between accuracy and category weight, where (a) is the NHANES dataset and (b) is the PID dataset.
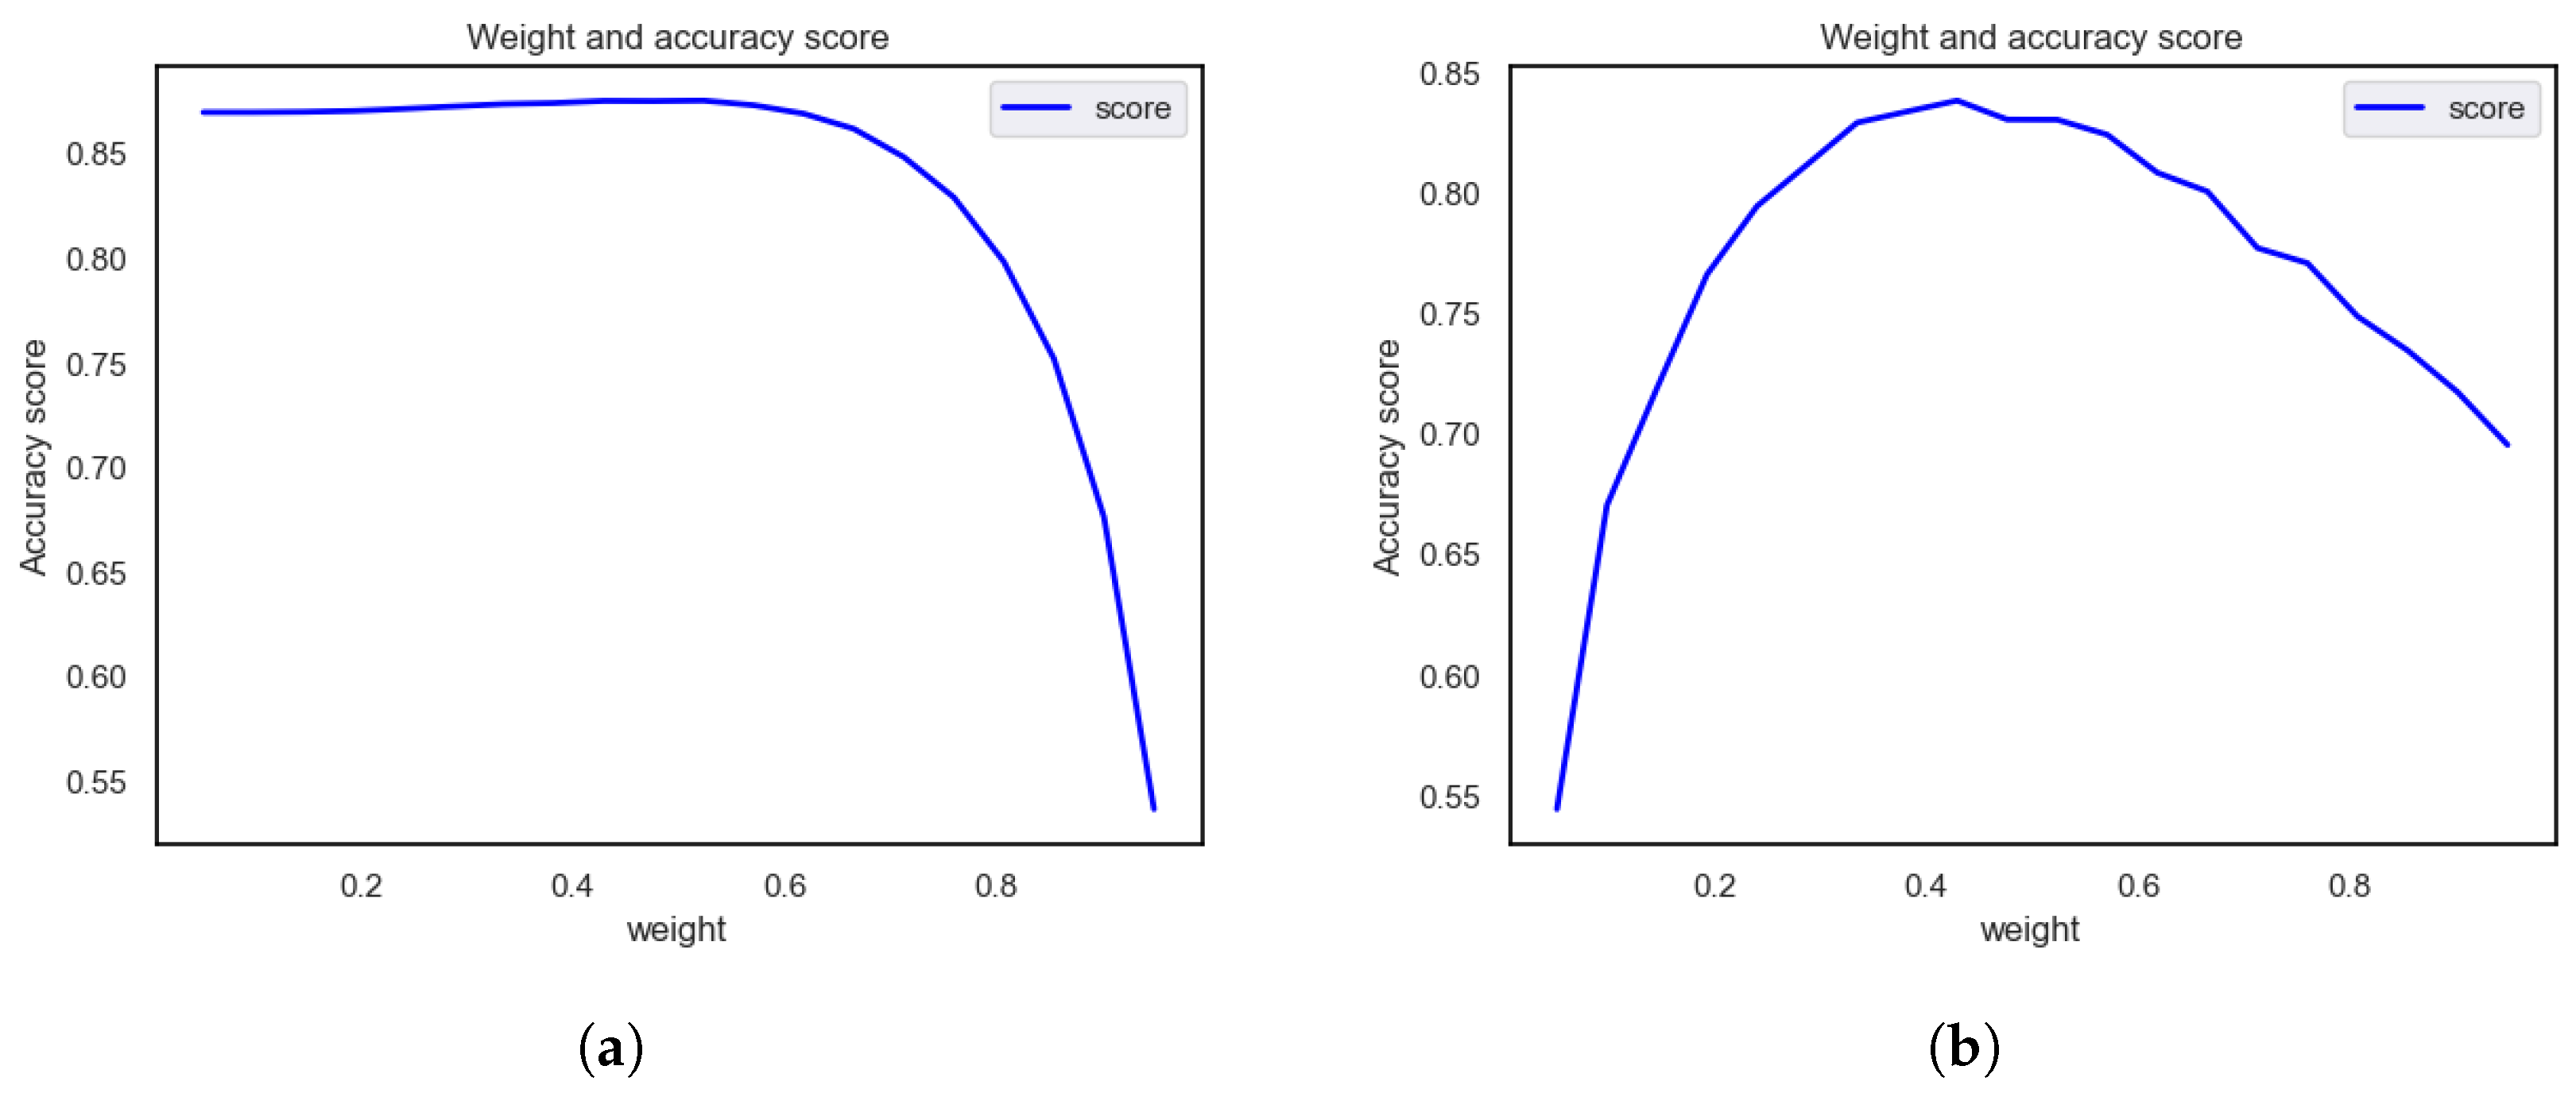
Figure 9.
Line chart of prediction accuracy for different cross-validation schemes in NHANES and PID datasets. Where (a) is the accuracy line of prediction using 3-fold, 5-fold and 10-fold cross-validation, respectively, on the NHANES dataset, (b) is the accuracy line for prediction using 3-fold, 5-fold and 10-fold cross-validation on the PID dataset, respectively.

Figure 10.
ROC curves for prediction in NHANES dataset and PID dataset, respectively. (a–c) show the ROC curves using 3-fold, 5-fold and 10-fold cross-validation on the NHANES dataset, respectively. (d–f) represent the ROC curves for prediction using 3-fold, 5-fold and 10-fold cross-validation on the PID dataset, respectively.

Table 1.
Literature summary.
| Authors | Year | Classification | Comments |
|---|---|---|---|
| Maniruzzaman et al. [22] | 2018 | SVM, NB, LDA, LR, DT, RF, AB, GPC, QDA | RF has the best performance, with an accuracy of 92.26%. |
| Maniruzzaman et al. [23] | 2020 | NB, DT, AB, RF | The RF model is the best, with an accuracy of 94.25%. |
| Naz et al. [24] | 2020 | ANN, NB, DT, DL | The DL method has the best performance, with an accuracy of 98.07% |
| Hasan et al. [25] | 2020 | SVM, LR, DT, RF, ANN, Ensembling | RF performance is the best, with an accuracy rate of 90%. |
| Wu et al. [7] | 2020 | CNN | The accuracy rate reached 89.0%. |
| Hasan et al. [26] | 2020 | KNN, DT, AB, RF, NB, XB, Ensembling | Ensembling has the best performance, with an AUC value of 95% |
| Santosh Kumar et al. [31] | 2020 | MLFNN | The accuracy of MLFNN is 84.17% |
| Mani Abedini et al. [32] | 2020 | Ensemble model (ANN + LR + DT) | The accuracy of Ensemble model is 83% |
| Sivaranjani et al. [27] | 2021 | SVM, RF | The RF model is the best, with an accuracy of 83%. |
| Roy et al. [33] | 2021 | RF, LGBM, LR, SVM | LGBM has the best performance, with an accuracy of 86% |
| Khanam et al. [28] | 2021 | DT, KNN, RF, NB, AB, LR, SVM, NN | NN has the best performance, with an accuracy of 88.6%. |
| Olisah et al. [29] | 2022 | RF, SVM, 2GDNN | The accuracy rates of the 2GDNN model are 97.34% and 97.24% respectively. |
| Ahmed et al. [34] | 2022 | SVM, ANN, FMDP | The prediction accuracy of FMDP is 94.87% |
| Abnoosian et al. [35] | 2023 | EMLM | The accuracy rate was 97%. |
| Rastogi et al. [30] | 2023 | RF, SVM, LR, NB | LR has the best performance, with an accuracy of 82.46%. |
Table 2.
Description of independent variables of NHANES dataset.
| No. | Variable | Describe |
|---|---|---|
| 01 | Age | Age |
| 02 | Blood-Rel-Diabetes | Is there a history of diabetes in the family? |
| 03 | Body-Mass-Index | Evaluate whether an individual’s weight is within a healthy range. |
| 04 | Systolic | Measures blood pressure when the heart contracts. |
| 05 | Weight | Reflects an individual’s weight status. |
| 06 | Albumin | a protein in the blood. |
| 07 | Glycohemoglobin | Monitor your average blood sugar levels over the past few months. |
| 08 | HDL | High density lipoprotein cholesterol. |
| 09 | Cholesterol | Fatty substances in the blood. |
| 10 | GGT | -glutamyl transferase, one of the indicators of liver function. |
| 11 | Hemoglobin | Reflects the oxygen carrying capacity of the blood. |
| 12 | Iron | Components of hemoglobin. |
| 13 | Moderate-work | Moderate intensity work. |
| 14 | ALP | Alkaline phosphatase. |
| 15 | Uric.Acid | Products of metabolism in the body. |
| 16 | Creatinine | An important indicator of kidney function. |
| 17 | Bilirubin | Indicators of liver function. |
| 18 | Diastolic | Blood pressure levels during. diastole |
| 19 | LDH | Lactate dehydrogenase, a marker of cell damage |
| 20 | ALT | Alanine aminotransferase, an indicator of liver health |
| 21 | AST | Aspartate aminotransferase |
| 22 | Gender | Gender |
| 23 | Bilirubin | Indicators of liver function. |
| 24 | Diastolic | Blood pressure levels during. Diastole. |
| 25 | Diabetes | Do you have diabetes? |
Table 3.
Description of independent variables of the PID dataset.
| No | Variable | Describe | Missing Values |
|---|---|---|---|
| 1 | Pregnancies | Number of pregnancies | 110 |
| 2 | Glucose | Blood glucose concentration 2 h after oral administration of glucose | 5 |
| 3 | Blood pressure | Diastolic blood pressure (mm Hg) | 35 |
| 4 | Skin thickness | Epidermal fold thickness (mm) | 227 |
| 5 | Insulin | 2-h insulin serum (mm u/mL) | 374 |
| 6 | Body mass index (BMI) | Body mass index (weight expressed in kg/height m2) | 11 |
| 7 | Diabetes pedigree function | Diabetes Spectrum Function | 0 |
| 8 | Age | Age | 0 |
Table 4.
CNN model structure.
| Layer Type | Configuration | Input Shape | Output Shape | Purpose |
|---|---|---|---|---|
| Input Layer | - | (None, X_scaled.shape[1], 1) | (None, X_scaled.shape[1], 1) | Receives the input feature matrix. |
| Conv1D | 32 filters, kernel size 3, activation ‘relu’ | (None, X_scaled.shape[1], 1) | (None, X_scaled.shape[1]-2, 32) | Applies convolution to extract initial features. |
| AveragePooling1D | Pool size 2 | (None, X_scaled.shape[1]-2, 32) | (None, (X_scaled.shape[1]-2)/2, 32) | Reduces feature dimensions and computational load. |
| Dropout | Rate 0.5 | (None, (X_scaled.shape[1]-2)/2, 32) | (None, (X_scaled.shape[1]-2)/2, 32) | Randomly drops units to prevent overfitting. |
| Conv1D | 64 filters, kernel size 3, activation ‘relu’ | (None, (X_scaled.shape[1]-2)/2, 32) | (None, (X_scaled.shape[1]-2)/2-2, 64) | Further extracts deeper features. |
| Dropout | Rate 0.5 | (None, (X_scaled.shape[1]-2)/2-2, 64) | (None, (X_scaled.shape[1]-2)/2-2, 64) | Another layer to prevent overfitting. |
| Flatten | - | (None, (X_scaled.shape[1]-2)/2-2, 64) | (None, ((X_scaled.shape[1]-2)/2-2)*64) | Flattens the data for dense layer processing. |
| Dense | 128 units, activation ‘relu’ | (None, ((X_scaled.shape[1]-2)/2-2)*64) | (None, 128) | A dense layer for learning complex patterns. |
| Dropout | Rate 0.5 | (None, 128) | (None, 128) | Drops units to mitigate overfitting. |
| Dense | Units = np.max(y) + 1, activation ‘softmax’ | (None, 128) | (None, np.max(y) + 1) | Output layer for classification. |
Table 5.
Feature importance analysis results of the NHANES dataset.
| No. | Feature | F-Score | p Value |
|---|---|---|---|
| 01 | Age | 2686.4097 | 0.0000 |
| 02 | Blood-Rel-Diabetes | 1536.7851 | 0.0000 |
| 03 | Body-Mass-Index | 1000.6701 | 0.0050 |
| 04 | Systolic | 766.3686 | 0.0299 |
| 05 | Weight | 526.9009 | 0.6242 |
| 06 | Albumin | 525.8110 | 0.1353 |
| 07 | Glycohemoglobin | 477.4174 | 0.1973 |
| 08 | HDL | 378.7503 | 0.0022 |
| 09 | Cholesterol | 334.9230 | 0.0000 |
| 10 | GGT | 305.4725 | 0.1156 |
| 11 | Hemoglobin | 270.4280 | 0.0004 |
| 12 | Iron | 211.2168 | 0.9396 |
| 13 | Moderate-work | 188.2664 | 0.1012 |
| 14 | ALP | 156.1723 | 0.3842 |
| 15 | Uric.Acid | 144.7228 | 0.3049 |
| 16 | Creatinine | 102.8804 | 0.3964 |
| 17 | Bilirubin | 80.4633 | 0.1825 |
| 18 | Diastolic | 63.3160 | 0.0000 |
| 19 | LDH | 49.8263 | 0.1427 |
| 20 | ALT | 27.6458 | 0.0309 |
| 21 | AST | 22.6823 | 0.0013 |
| 22 | Gender | 12.2195 | 0.0048 |
| 23 | Protein | 8.5813 | 0.0306 |
| 24 | Phosphorus | 0.0004 | 0.0092 |
Table 6.
Feature importance analysis results of the PID dataset.
| No. | Feature | F-Score | p Value |
|---|---|---|---|
| 1 | Insulin | 255.4176 | 0.3482 |
| 2 | Glucose | 119.7174 | 0.0003 |
| 3 | skin thickness | 79.3331 | 0.8449 |
| 4 | Age | 52.4475 | 0.0006 |
| 5 | BMI | 45.1721 | 0.0000 |
| 6 | Pregnancies | 36.1943 | 0.0713 |
| 7 | blood pressure | 20.5297 | 0.0223 |
| 8 | Diabetes pedigree function | 17.7658 | 0.0893 |
Table 7.
Optimal set weight parameters for the dataset.
| Data | 0 | 1 |
|---|---|---|
| PID | 0.5711 | 0.4289 |
| NHANES | 0.5237 | 0.4763 |
Table 8.
Model performance for prediction on NHANES dataset.
| Model | K = 3 | K = 5 | K = 10 | ||||||||||||
|---|---|---|---|---|---|---|---|---|---|---|---|---|---|---|---|
| Precision (%) | Recall (%) | F1-Score (%) | Accuracy (%) | AUC (%) | Precision (%) | Recall (%) | F1-Score (%) | Accuracy (%) | AUC (%) | Precision (%) | Recall (%) | F1-Score (%) | Accuracy (%) | AUC (%) | |
| SVM | 87.81 | 89.12 | 86.73 | 88.12 | 89.30 | 87.81 | 89.12 | 86.73 | 89.12 | 89.30 | 87.81 | 89.12 | 86.73 | 89.12 | 90.00 |
| LR | 84.75 | 87.49 | 85.45 | 87.49 | 82.69 | 84.78 | 87.50 | 83.46 | 87.50 | 82.72 | 84.75 | 87.49 | 83.46 | 87.49 | 82.76 |
| RF | 90.58 | 91.19 | 90.77 | 91.19 | 86.84 | 90.88 | 91.45 | 91.05 | 91.32 | 86.44 | 90.93 | 91.53 | 91.09 | 91.53 | 86.63 |
| DT | 88.30 | 88.02 | 88.15 | 88.02 | 74.51 | 88.39 | 88.10 | 88.23 | 88.10 | 74.82 | 88.42 | 88.03 | 88.21 | 88.03 | 74.87 |
| ANN | 86.53 | 86.84 | 86.68 | 86.84 | 83.11 | 86.04 | 86.85 | 86.39 | 86.85 | 82.60 | 86.34 | 86.76 | 86.54 | 86.76 | 81.86 |
| CNN | 92.74 | 93.14 | 92.78 | 93.14 | 91.83 | 92.69 | 93.10 | 92.59 | 93.10 | 92.05 | 92.77 | 93.18 | 92.74 | 93.18 | 92.29 |
| SECNN | 93.70 | 94.00 | 93.69 | 94.00 | 92.58 | 93.62 | 93.91 | 93.51 | 93.91 | 92.62 | 93.85 | 94.12 | 93.78 | 94.12 | 92.79 |
Table 9.
Model performance for prediction on the PID dataset.
| Model | K = 3 | K = 5 | K = 10 | ||||||||||||
|---|---|---|---|---|---|---|---|---|---|---|---|---|---|---|---|
| Precision (%) | Recall (%) | F1-Score (%) | Accuracy (%) | AUC (%) | Precision (%) | Recall (%) | F1-Score (%) | Accuracy (%) | AUC (%) | Precision (%) | Recall (%) | F1-Score (%) | Accuracy (%) | AUC (%) | |
| SVM | 85.93 | 85.85 | 85.89 | 85.85 | 88.14 | 75.54 | 86.91 | 80.83 | 86.91 | 88.32 | 87.61 | 87.42 | 86.88 | 87.42 | 88.95 |
| LR | 80.34 | 80.66 | 79.43 | 80.66 | 88.06 | 80.23 | 80.50 | 79.18 | 80.50 | 88.06 | 80.34 | 80.66 | 79.43 | 80.66 | 89.42 |
| RF | 84.63 | 84.91 | 84.67 | 84.91 | 89.97 | 86.79 | 86.79 | 86.79 | 86.79 | 89.05 | 87.50 | 87.58 | 87.53 | 87.58 | 90.41 |
| DT | 83.25 | 83.18 | 83.21 | 83.18 | 81.19 | 84.55 | 84.59 | 84.57 | 84.59 | 80.40 | 84.81 | 84.75 | 84.78 | 84.75 | 81.64 |
| ANN | 81.90 | 81.25 | 81.49 | 81.25 | 82.11 | 82.57 | 82.03 | 82.25 | 82.03 | 82.92 | 83.54 | 82.81 | 83.09 | 82.81 | 83.43 |
| CNN | 86.45 | 85.85 | 85.45 | 85.85 | 90.36 | 86.14 | 86.32 | 86.19 | 86.32 | 91.14 | 87.41 | 87.58 | 87.44 | 87.58 | 91.37 |
| SECNN | 87.39 | 87.42 | 87.40 | 87.42 | 90.88 | 88.60 | 88.68 | 88.63 | 88.68 | 91.60 | 89.36 | 89.47 | 89.38 | 89.47 | 91.70 |
Table 10.
Comparison of this study with historical literature on the NHANES and PID datasets.
| Dataset | Best Model | Accuracy (%) | Related Literature |
|---|---|---|---|
| RF | 90% | Hasan et al. [25] | |
| NHANES | SVM | 90.82% | Ridhi Deo et al. [52] |
| SECNN | 94.12% | this study | |
| RF | 83% | Sivaranjani S. [27] | |
| LR | 82.46% | Rastogi et al. [30] | |
| PID | NN | 88.6% | Khanam et al. [28] |
| MLFNN | 84.17% | Santosh Kumar et al. [31] | |
| SECNN | 89.47% | this study |
Disclaimer/Publisher’s Note: The statements, opinions and data contained in all publications are solely those of the individual author(s) and contributor(s) and not of MDPI and/or the editor(s). MDPI and/or the editor(s) disclaim responsibility for any injury to people or property resulting from any ideas, methods, instructions or products referred to in the content. |
© 2024 by the authors. Licensee MDPI, Basel, Switzerland. This article is an open access article distributed under the terms and conditions of the Creative Commons Attribution (CC BY) license (https://creativecommons.org/licenses/by/4.0/).
Share and Cite
MDPI and ACS Style
Zhao, J.; Gao, H.; Yang, C.; An, T.; Kuang, Z.; Shi, L. Attention-Oriented CNN Method for Type 2 Diabetes Prediction. Appl. Sci. 2024, 14, 3989. https://doi.org/10.3390/app14103989
AMA Style
Zhao J, Gao H, Yang C, An T, Kuang Z, Shi L. Attention-Oriented CNN Method for Type 2 Diabetes Prediction. Applied Sciences. 2024; 14(10):3989. https://doi.org/10.3390/app14103989
Chicago/Turabian StyleZhao, Jian, Hanlin Gao, Chen Yang, Tianbo An, Zhejun Kuang, and Lijuan Shi. 2024. "Attention-Oriented CNN Method for Type 2 Diabetes Prediction" Applied Sciences 14, no. 10: 3989. https://doi.org/10.3390/app14103989
Note that from the first issue of 2016, this journal uses article numbers instead of page numbers. See further details here.