
Influence of Uneven Subgrade Frost Heave on Deformation and Damage of CRTSIII Slab Track
by
 and
and
Hongge Wang
1,2,
Hong Xiao
1,2,*,
Xuhao Cui
3,
Shusheng Yang
4,
Mahantesh M. Nadakatti
5 and
Qiang Guo
6 1
Beijing Key Laboratory of Track Engineering, Beijing Jiaotong University, Beijing 100044, China
2
School of Civil Engineering, Beijing Jiaotong University, Beijing 100044, China
3
Faculty of Architecture, Civil and Transportation Engineering, Beijing University of Technology, Beijing 100124, China
4
Jiqing High Speed Railway Co., Ltd., Jinan 250000, China
5
Department of Mechanical Engineering, KLS Gogte Institute of Technology, Belagavi 591235, India
6
The Fifth Engineering Co., Ltd. of China Railway First Bureau Group, Baoji 721000, China
*
Author to whom correspondence should be addressed.
Appl. Sci. 2023, 13(9), 5345; https://doi.org/10.3390/app13095345
Submission received: 14 January 2023
/
Revised: 18 April 2023
/
Accepted: 19 April 2023
/
Published: 25 April 2023
(This article belongs to the Special Issue Design of Track System and Railway Vehicle Dynamics Analysis)
Abstract
:The problem of uneven frost heave deformation of high-speed railway subgrade in seasonal freezing areas seriously affects the service state and service life of slab track structures and threatens the safe operation of high-speed vehicles. Based on the damage plasticity theory of concrete, in this study, an analytical model is established for CRTSIII slab track with damage plasticity and reinforcement. The influences of various frost heaving parameters on track structure deformation, interlayer seam, as well as the stress and damage behaviors were analyzed in detail. The results show that, as compared with a linear elastic model, the damage plastic model better reflects the softening behavior and stress attenuation of track structure concrete after reaching its tensile strength. The deformation and the interlayer seam reach their maximum values when the frost heaving wave peak acts at the position that is one-sixth of the base length from the edge of the concrete base. When the frost heaving wave peak acts on grooves at the base center, initially, the track structure is seriously damaged. The interlayer seam and damage decrease with an increase in frost heaving wavelength and increase with an increase in frost heaving wave amplitude. The interlayer seam of the track structure is more sensitive to frost heave deformation having a wavelength of less than 10 m. The extent of damage to the concrete base gradually increases with a decrease in the wave/amplitude ratio. It undergoes three stages of damage evolution: (i) no damage, (ii) upper surface bending damage, (iii) reverse bending damage. In order to improve efficiency, it is recommended, during track maintenance, to focus on the position of the central groove of the base and the position that is one-sixth of the base length from the edge of the concrete base.
1. Introduction
In recent years, with the rapid development of high-speed railway, CRTSIII slab track, as shown in Figure 1, which was independently developed by China, has been widely used due to its dual advantages: (a) stable performance and (b) convenient construction [1]. However, a detailed survey found that under uneven subgrade frost heave action, high track structure stiffness resulted in the track being incongruous with foundation deformation [2]. This resulted in interlayer seam, finally leading to serious track irregularity and, in turn, threatening the safe operation of high-speed railway [3,4]. Consider the example of the Harbin–Dalian railway, the world’s first high-speed railway in Alpine areas. The total length of the railway is about 920 km, including 200 km in the seasonal frozen soil region. The annual average frost heave amplitude is about 5 mm, and the maximum frost heave amplitude is over 30 mm, which is far beyond the vertical displacement of the track structure limited by the design specifications of China’s high-speed railway. Therefore, in order to ensure the safety of vehicle operations, the government has been compelled to reduce train speed [5]. In addition, when the displacement load generated by subgrade frost heave deformation is transferred to the track structure, each component is subjected to additional stress which is already high. This can easily damage the track structure concrete material [6], affecting the service state and service life of the track structure.
In view of the frost heave problem in high-speed railway subgrade, many research studies have been carried out. Based on an independently developed set for a frost heaving monitoring system, Wang Chunlei et al. [7] carried out monitoring work of frost heaving on the Haqi railway subgrade and analyzed the cause of the frost heave. Yu Lei [8] analyzed the variations in characteristics of subgrade frost heave in a seasonal freezing region by monitoring frost heave deformation of the Harbin–Dalian railway subgrade. Zhao Guotang et al. [9] and Cheng, R. et al. [10] analyzed variations in track irregularity before and after the freezing and thawing of subgrade. Zhao Guotang et al. [11] established a coupling analytical model of slab track and subgrade frost heaving of a high-speed railway. The study analyzed the influence of the subgrade’s frost heaving wavelength and amplitude on the stress on various types of slab track structures. Xu Hao et al. [12] studied the influences of subgrade frost heaving parameters on the structural deformation and the interlayer seam of slab track. Zhang Yuzhi et al. [13] derived the 2D analytical equation of stress and deformation of frozen subgrade based on the thermo-elasticity theory, considering the effect of ice-water phase transformation. The researchers analyzed the influence of temperature load on the frost heave deformation of subgrade. On the basis of a single frost heave, Shen Guanghua [14] considered temperature and vehicle load for computations and analyzed the characteristics of track structure stress, interlayer seam, and rail irregularity under the combined action of complex loads. However, the influence of varying the longitudinal frost heaving position and the behavior of damaged track structure were not considered. The authors of [15,16,17] showcased the influence of the subgrade’s uneven frost heave deformation on the vibration response of a high-speed railway track coupling system. The studies analyzed the influence of frost heave deformation on vehicles’ operational safety. According to the static and dynamic indices of track structure and the dynamic response index of vehicles under frost heaving, a few scholars have proposed control limits of uneven frost heaving [18,19,20] and control measures for frost heave deformation [21,22,23]. However, in the studies carried out so far, track structures have often been regarded to be linear elastomers, which cannot simulate the damage and deterioration behavior of track structure under the condition of uneven subgrade frost heave. In addition, they cannot analyze the influence of track structure concrete damage on its further deformation. With due considerations to the durability requirement of track structure in long-term operations, it is necessary to carry out systematic research on the deformation and damage characteristics of slab track under frost heave deformation.
In recent years, with the development of the theory of damage mechanics and its gradual application in damage research of concrete, Lubliner, J. [24] proposed the concrete damaged plasticity (CDP) theory, which was improved by Lee, J. [25]. Ren, J. et al. [26] analyzed the influence of cement asphalt mortar debonding on the damage distribution and mechanical response of CRTSI prefabricated slab by using the CDP theory. Hl, A. et al. [27] predicted the damage behavior of high-strength compressive concrete under static and dynamic loads by using the CDP theory. Thus, the CDP theory is applicable for analyzing concrete material damage, which can provide support for the prediction of slab track deformation and damage in the present study.
In the present study, based on the FEM method and the concrete damage plasticity (CDP) theory, a static model of CRTSIII slab track with damage plasticity and reinforcement is established to analyze the influence of uneven frost heave on track structure deformation and damage. This study also highlights the advantages of a damage plasticity model compared with a linear elastic model. Based on the damage plastic model, the influences of various frost heaving parameters on the deformation, interlayer seam, as well as the stress and damage behaviors of track structure are analyzed, which could provide a theoretical reference for the maintenance of CRTSIII slab track in frozen soil areas.
2. Concrete Plastic Damage Model Based on Damage Mechanics
2.1. Theory of Concrete Plastic Damage
The linear elastic constitutive model of concrete can be expressed by using the generalized Hooke’s law:
Here, is the non-destructive elastic modulus.
When a concrete plastic damage constitutive model is adopted, the concrete uniaxial stress-strain curves can be converted into stress versus plastic-strain curves, and the concrete tensile and compressive stresses can be expressed as follows:
Here, the subscripts t and c refer to tension and compression, respectively; and are the tensile and compressive equivalent plastic strains, respectively; and are the tensile and compressive equivalent plastic strain rates, respectively; is the temperature; and , (i = 1, 2, …) are other predefined field variables.
The stiffness degradation of concrete materials can be described by the following two damage variables: tensile damage and compression damage. When the damage factor is 0, there is no damage. When the damage factor approaches 1, it indicates that macroscopic damage occurs. When the damage factor is 1, it means that concrete has completely lost its stiffness.
The elastic modulus of concrete material after damage is expressed by the non-destructive elastic modulus and the stiffness damage factor, whose expression is as follows:
In this case, the constitutive relationship of the concrete plastic damage model can be expressed as the following equations, and its stress-strain curves are shown in Figure 2 and Figure 3.
The inelastic strain is defined as the total strain minus the elastic strain corresponding to the undamaged material, then, the tensile inelastic strain and compressive inelastic strain are shown as follows:
By substituting Equations (9) and (10) into the constitutive relations (7) and (8) of the concrete plastic damage model, the tensile equivalent plastic strain and compressive equivalent plastic strain can be expressed as follows:
2.2. Concrete Damaged Plasticity Parameters
When defining a plastic damage model of concrete, the stress-strain curve of concrete can be defined according to the concrete constitutive relation given in the GB 50010-2010 Code for Design of Concrete Structures [28].
When the concrete is under uniaxial tensile:
When the concrete is under uniaxial compression:
Here, and are parameter values of the descending section of the stress-strain curve under tension and compression, respectively; and are the representative values of uniaxial tensile and compressive strengths of concrete, respectively; and are the peak strains of tensile strength and compressive strength, respectively; ,,, and are the intermediate parameters set to facilitate the analytical expression and have no physical meanings themselves.
The tensile and compressive inelastic strain can be expressed as:
Assuming that the proportion of tensile equivalent plastic strain in the tensile inelastic strain is , the expression of tensile stiffness damage factor can be obtained as follows:
Similarly, assuming that the proportion of compressive equivalent plastic strain in the compressive inelastic strain is , the expression of compressive stiffness damage factor can be obtained as follows:
Based on the stress-strain curve of concrete and the CDP model of ABAQUS, a nonlinear analysis of concrete structure can be conducted by considering four groups of data: tensile stress-inelastic strain (), compressive stress-inelastic strain (), tensile damage-inelastic strain () and compressive damage-inelastic strain ().
Four sets of data from various concrete grades are derived. Taking C60 as an example, its four curves are shown as follows in Figure 4.
3. Computational Model
3.1. CRTSIII Slab Track Numerical Model
From top to bottom, the CRTSIII slab track was composed of a rail, fasteners, a precast slab, self-compacting concrete (including limit lug boss), and a concrete base (including limit groove). The rail was CHN60, and the model adopted was a solid unit. The grid unit type was C3D8R. The fasteners were simulated as spring-damping elements with a spacing of 0.63 m. The static stiffness of a fastener was 35 kN/mm. In the damage plastic model, the precast slab, self-compacting concrete, and concrete base were simulated by solid element and the grid element type was C3D8R. The former adopted C60 concrete, while the latter two adopted C40 concrete. Since the reinforcement mesh affected the damage plastic behavior of the concrete, a two-node truss unit (T3D2) was used to simulate the reinforcement mesh in the three components. The co-node coupling treatment carried out with the concrete and the prestressed ribs in the precast slab were realized by cooling method.
In terms of model size, the longitudinal length of the CRTSIII slab track was 34 m. Considering the lateral symmetry of a subgrade structure, a 1/2 model was adopted for modeling and the symmetric boundary was set. The half width of the top surface of the subgrade was 6.8 m. According to the calculation method of equivalent bending stiffness in the literature [29], it can be seen that the bending stiffness of the subgrade surface was 12.69 Mpa and that of the whole track was 710.45 Mpa.
The precast slab was bound to the self-compacting concrete to simulate the strong constraint of the portal reinforcement between the two to form a composite slab. A rubber cushion layer was inserted between the four sides of the limit lug boss and the groove, and in addition to the four sides of the limit lug boss, a geotextile isolation layer was inserted between the self-compacting concrete and the concrete base. The penalty function was used to simulate it. Underneath the concrete base was a subgrade structure. A hard contact was used to simulate the contact relationship between them. Adhesion was not considered, only the supporting effect of the subgrade on the base was considered. The supporting stiffness of the subgrade surface to the track structure was 76 Mpa [30]. The subgrade was fixed at its base. Based on this, the CRTSIII slab track structure was established, as shown in Figure 5, and the simulation model parameters are shown in Table 1.
3.2. Description of Subgrade Frost Heave
There are many ways to express uneven subgrade frost heave deformation. The research of many scholars has shown that the harmonic function analysis method is very practical [31,32,33]. However, considering the restrictions on the use area of CRTSIII slab track, in order to get closer to the actual deformation in the frozen soil region, in this study, the selected input is the frost heave deformation formula obtained by fitting field measured data in the literature [2]. As per the experimental data from [2], the cosine curve can be used to simulate uneven subgrade frost heave. Therefore, the cosine function considered for simulating uneven subgrade frost heave, is shown in Figure 6.
The displacement load can be described as:
Here, is the frost heaving wave amplitude, is the frost heaving wavelength, and is the position coordinates of uneven frost heave.
3.3. Model Verification
For the model developed in the present study, selection of the analytical parameters for the concrete plastic damage model (CDP) is an important factor for determining the validity of analytical results. Accordingly, the correctness of the CDP model and parameter selection for the numerical model is verified in the present section. A specific study was conducted to simulate the mechanical behavior of the concrete specimen under uniaxial tensile and compression conditions to verify the correctness of the model. The model of a standard concrete specimen (0.15 m × 0.15 m × 0.15 m) was established to analyze its stress-strain curves under uniaxial tensile and compression loads. The analytical simulation results were compared with the theoretical computation results. This is an effective method to verify the CDP model [34]. As can be seen from Figure 7, there is no significant difference between the simulation and theoretical results. The results show that the model can accurately simulate the stress behavior and softening process of concrete after damage.
4. Results and Discussion
4.1. Superiority of the Damage Plasticity Model Compared with a Linear Elastic Model
The form of uneven subgrade frost heave was selected to be 20 mm/10 m (wave amplitude/wavelength) and the frost heaving wave peak acted in the middle of the 2# concrete base. In order to compare the difference between the damage plastic model and the linear elastic model, the analytical results of the two models were considered at the same time.
Figure 8 shows the vertical deformation of the track structure under frost heaving. Under the action of uneven frost heave, the deformation of the track structure shifted from the bottom to top. The vertical displacement from the subgrade surface to the rail gradually decreased. The vertical deformation of the track structure in the damage-plastic model was significantly larger than that in the linear elastic model. Compared with the linear elastic model, the vertical displacements of the rail, composite slab, and concrete base in the damage plastic model increased by 0.26, 0.67, and 0.93 mm, respectively. This is due to plastic damage to the concrete of the track in this form of frost heaving. The damage of the concrete base appeared when the frost heaving was 2.878 mm, and macroscopic cracks appeared when the frost heaving was 6.598 mm. For the slab, there was slight damage in the beginning due to the existence of prestressed steel bars, and macroscopic cracks were observed when the frost heaving was 8.379 mm, as shown in Figure 9. The damage of concrete material led to a significant increase in its strain, thus, increasing its vertical deformation. When the linear elastic model was used to analyze the concrete, the constitutive relation of the concrete obeyed the generalized Hooke’s law, i.e., the stress-strain relationship was linear during loading and unloading, and the concrete would not yield after reaching its tensile strength. However, it could not reflect the softening behavior of concrete material. It was also observed that it could not effectively simulate the plastic strain of the track structure, resulting in low vertical deformation.
Figure 10 shows the interlayer seam of the track structure under frost heaving. It was observed that when the frost heaving wave peak acted at the center of the concrete base, due to the unit slab, the seam between the composite slab and the concrete base appeared at the edge of the composite slab, while the seam between the concrete base and the subgrade surface appeared at one-quarter of the base length on both sides of the frost heaving wave peak. The interlayer seam between the base and subgrade surface was significantly higher than that between the self-compacting concrete and base. This was due to the fact that the vertical displacement of the base was greater than that of the composite slab. In addition, the interlayer seam of the track structure in the damage plastic model was smaller than that in the linear elastic model, in which the seam between the self-compacting concrete and base was reduced by 0.11 mm, and the seam between the base and subgrade surface was reduced by 1.84 mm. In the latter, the seam decreased significantly. This is because, as compared with the linear elastic model, the vertical deformation at the central position of the base in the damage plastic model increased significantly, which led to the downward offset of the base on both sides under the action of gravity, resulting in a significant decrease in the seam.
Figure 11 shows the longitudinal stress on the upper surface of the composite slab and concrete base under frost heaving. A positive value of longitudinal stress indicates a tension state, whereas a negative value indicates a compression state. Figure 11a shows that within the range of the frost heaving center, the upper surface of the slab was in a state of tension, while the upper surface of the self-compacting concrete was in a state of compression. Figure 11b shows that the longitudinal stress on the upper surface of the base is positive and it is in a state of tension. However, opposite stress states appeared at the far end of the frost heaving center. As compared with the linear elastic model, the tensile stress on the upper surface of the slab and the base in the damage plastic model decreased by 0.81 and 2.21 MPa, respectively, at the frost heaving wave peak position. This could be explained as follows: According to the analytical results of the linear elastic model, the maximum longitudinal tensile stress of the slab was 3.13 MPa and that of the base was 4.53 MPa. The standard values of axial tensile strength of the C60 concrete used for the slab and the C40 concrete used for the base are 2.85 MPa and 2.39 MPa, respectively. The longitudinal tensile stresses of the two had exceeded the tensile strength of the corresponding concrete, indicating that damage had occurred. The analytical results of the linear elastic model had a situation where the tensile stress was unusually higher than the yield surface of the concrete material. However, the tensile strength of concrete had been considered in the parameters of the damage plastic model, which could well describe the softening behavior of concrete after passing the yield point. This explains the tensile stress attenuation phenomenon appearing at the peak stress. As the composite slab as a whole was in flexural state, when tensile stress of the upper surface decreased, the neutral axis of the section moved, resulting in the self-compacting concrete longitudinal compressive stress increasing from 3.55 MPa to 4.26 MPa. However, it is still less than the standard value of the C40 concrete axial compressive strength of 27.00 MPa. No crushing damage was observed.
From the analysis of the influence of uneven frost heave on the deformation and damage of the track structure, it was found that the damage plastic model could make up for the shortcomings of the linear elastic model, which fully justifies the necessity and superiority of considering the plastic damage of concrete materials.
4.2. Influence of Frost Heaving Positions on Subgrade
Based on the symmetry of the CRTSIII slab track itself, seven frost heaving positions, i.e., from (a) to (g), were selected in the 2# concrete base area, as shown in Figure 12. By considering the classical cosine function of the 20 mm/10 m (wave amplitude/wavelength) subgrade frost heaving curve as an example, an analysis was performed to understand the influence of deformation and damage of slab track when the frost heaving wave peak acted at different positions.
Figure 13a,b respectively, show the self-compacting base interlayer seam and the base subgrade surface interlayer seam under the action of various frost heaving positions. Table 2 shows the peak value and position of the self-compacting base interlayer seam. It can be observed that the peak value of the self-compacting base seam predominantly occurs at the position of self-compacting concrete edge. When the frost heaving wave peak appeared at (e), due to the lack of longitudinal constraints at the right end of the base and the formation of a lever system in the middle of the self-compaction concrete, the seam in between the layers reached the maximum value at 7.94 mm. When the frost heaving wave peak appeared at (g), the deformation of the track structure at both ends was relatively well coordinated, as the lever fulcrum did not form at the expansion joint position. Hence, the seam within layers was the least, with a value of 1.01 mm. The interlayer seam between the base and subgrade surface appeared on both sides of the frost heaving wave peak. When the frost heaving wave peak position varied from (a) to (g), the peak values of the interlayer seam were 6.59, 4.78, 3.43, 3.99, 8.50, 4.00, and 2.71 mm, respectively, which were all higher than those of the interlayer seam between the self-compacting concrete and base. This is because the stiffness difference between the base and subgrade surface was greater than that between the self-compacting concrete and the base, which would cause greater deformation disharmony in the former. The maximum and minimum interlayer seam also occurred when the frost heaving wave peak positions were (e) and (g). Therefore, it is necessary to give more attention to the interlayer seam of the track structure when frost heaving wave peak acts on (e). Based on the above determination of the distribution characteristics of interlayer seams, the following preventive measures can be taken. Vertical reinforcing bars connected to the base can be arranged at both ends of the self-compacting concrete, which can effectively inhibit the seam between the self-compacting concrete and the base. To increase the biting force between the base and the subgrade surface, an anchor treatment can effectively inhibit the formation of an interlayer seam between the base and the subgrade surface.
Figure 14 shows the subgrade frost heaving values when the frost heaving wave peaks vary from (a) to (g) and damage along with macroscopic cracks appear on the base. It can be observed that when the frost heaving wave peak was close to the base center and its groove, i.e., when it acted on (b), damage and macroscopic cracks appeared on the base initially. When the frost heaving wavelength was 10 m and the frost heaving value reached 2.43 mm, damage started to appear. Macroscopic cracks appeared on the base when the frost heaving value reached 3.83 mm. It was also observed that, wave peaks at (a), (c), and (d) also easily lead to damage on the base.
Figure 15 shows the tensile damage to the slab and the base when the frost heaving peak acts at different positions. The damage of the base mostly occurs at the position of the base groove. A circle of U-shaped steel bar is added at the position of the base groove to increase the shear resistance, which can effectively control the generation of cracks at the groove. In order to better describe track structure damage under different working conditions, the concept of average damage factor was introduced, i.e., the ratio of the sum of damage factors of each element to the total number of elements. As the value of average damage factor is related to the grid unit, it could only be applied to the comparative damage analysis of the same component (same grid division) under varying working conditions. This is not a meaningful outcome.
It can be seen from Figure 16 that, when the frost heaving wave peak was close to the middle of the slab, namely, positions (a), (b), and (e), there was significant damage to the slab. Entire damage occurred near the middle of the slab. When the frost heaving wave peak appeared in the middle of the base and was close to the groove positions (b), (c), and (d), there was significant damage to the base, and the damage reached its maximum value at position (b). It can be inferred that track structure damage is a serious consideration when the frost heaving wave peak acts on (b).
4.3. Influence of the Subgrade Frost Heaving Geometric Parameters
Based on the above determination of the most unfavorable frost heaving position, we analyzed the deformation and interlayer seam of the track structure when the frost heaving wave peak acted on (e), and the stress and damage of the base when the frost heaving wave peak acted on (b), as shown in Figure 17.
4.3.1. Influence on Track Structure Deformation and Interlayer Seam
Table 3 shows the vertical displacements of the rail, slab, and base under different frost heaving wavelengths and wave amplitudes when the frost heaving wave peak acted on (e). The observations show that the displacement of the track structure shifted from bottom to top. The displacement from the base to the rail gradually reduced. The structural displacement of each layer increased with an increase in frost heaving wavelength and wave amplitude. The displacement was mainly dominated by frost heave wave amplitude.
Figure 18a,b, respectively, show the self-compacting base interlayer seam and the base subgrade surface interlayer seam when frost heaving wave peak acted on (e). It can be seen that the variation in the two interlayer seams was consistent, which decreased with an increase in frost heaving wavelength and increased with an increase in frost heaving wave amplitude. When the frost heaving wavelength was 5 or 10 m, an increase in frost heaving wave amplitude resulted in a significant increase in the interlayer seam. The maximum seam between the self-compacting concrete and the base was 21.84 mm, and the maximum seam between the base and subgrade surface was 25.43 mm. When the frost heaving wavelength exceeded 15 m, the peak values of the two were only 3.39 and 4.98 mm, respectively. It can be seen that the frost heaving wavelength had a greater influence on the interlayer seam, and the interlayer seam was more sensitive to the frost heaving with a wavelength less than 10 m. This is because the critical wavelength of the track structure was calculated as 10.99 m, according to the literature [35]. When the frost heaving wavelength was less than the critical wavelength, the interlayer seam changed obviously; when the frost heaving wavelength was larger than the critical wavelength, the frost heaving wavelength had little effect on the seam between layers. In addition, it can be seen from the difference between the two seams, as shown in Figure 19, that when the wavelength was small, the stiffness difference between the base and the subgrade surface was amplified, resulting in the seam between the base and the subgrade surface which was higher than that between the self-compacting concrete and the base. When the wavelength was high, the deformation between the base and the subgrade surface was relatively uniform, while the composite slab was a unit slab and there was no constraint at both ends. This resulted in a relatively larger interlayer seam between the self-compacting concrete and the base.
4.3.2. Influence on the Track Structure Stress and Damage
According to the above analysis, under the identical frost heaving condition, the degree of damage degree to the concrete base of the track structure was higher than that in other parts. Therefore, this section mainly analyzes the stress and damage to the base.
Figure 20 shows the variations in the longitudinal tensile stress peak of the concrete base with the frost heaving geometric parameters when the frost heaving wave peak acted on (b). When the frost heaving wave amplitude was 15 mm or less, the relationship between the maximum tensile stress and the frost heaving amplitude was basically linear, and the damage to the base had not occurred or was less. When the frost heave wave amplitude exceeded 15 mm and the frost heave wavelength was 5 or 10 m, the tensile stress peak reached the concrete tensile strength standard value of 2.39 MPa. The base was significantly damaged, and it entered the softening stage. The tensile stress began to decrease. When the frost heaving wave amplitude exceeded 25 mm, the tensile stress began to decrease when the frost heaving wavelength was 15 or 20 m. When the frost heaving wave amplitude approached 30 mm and the frost heaving wavelength was 25 and 30 m, the tensile stress began to decrease.
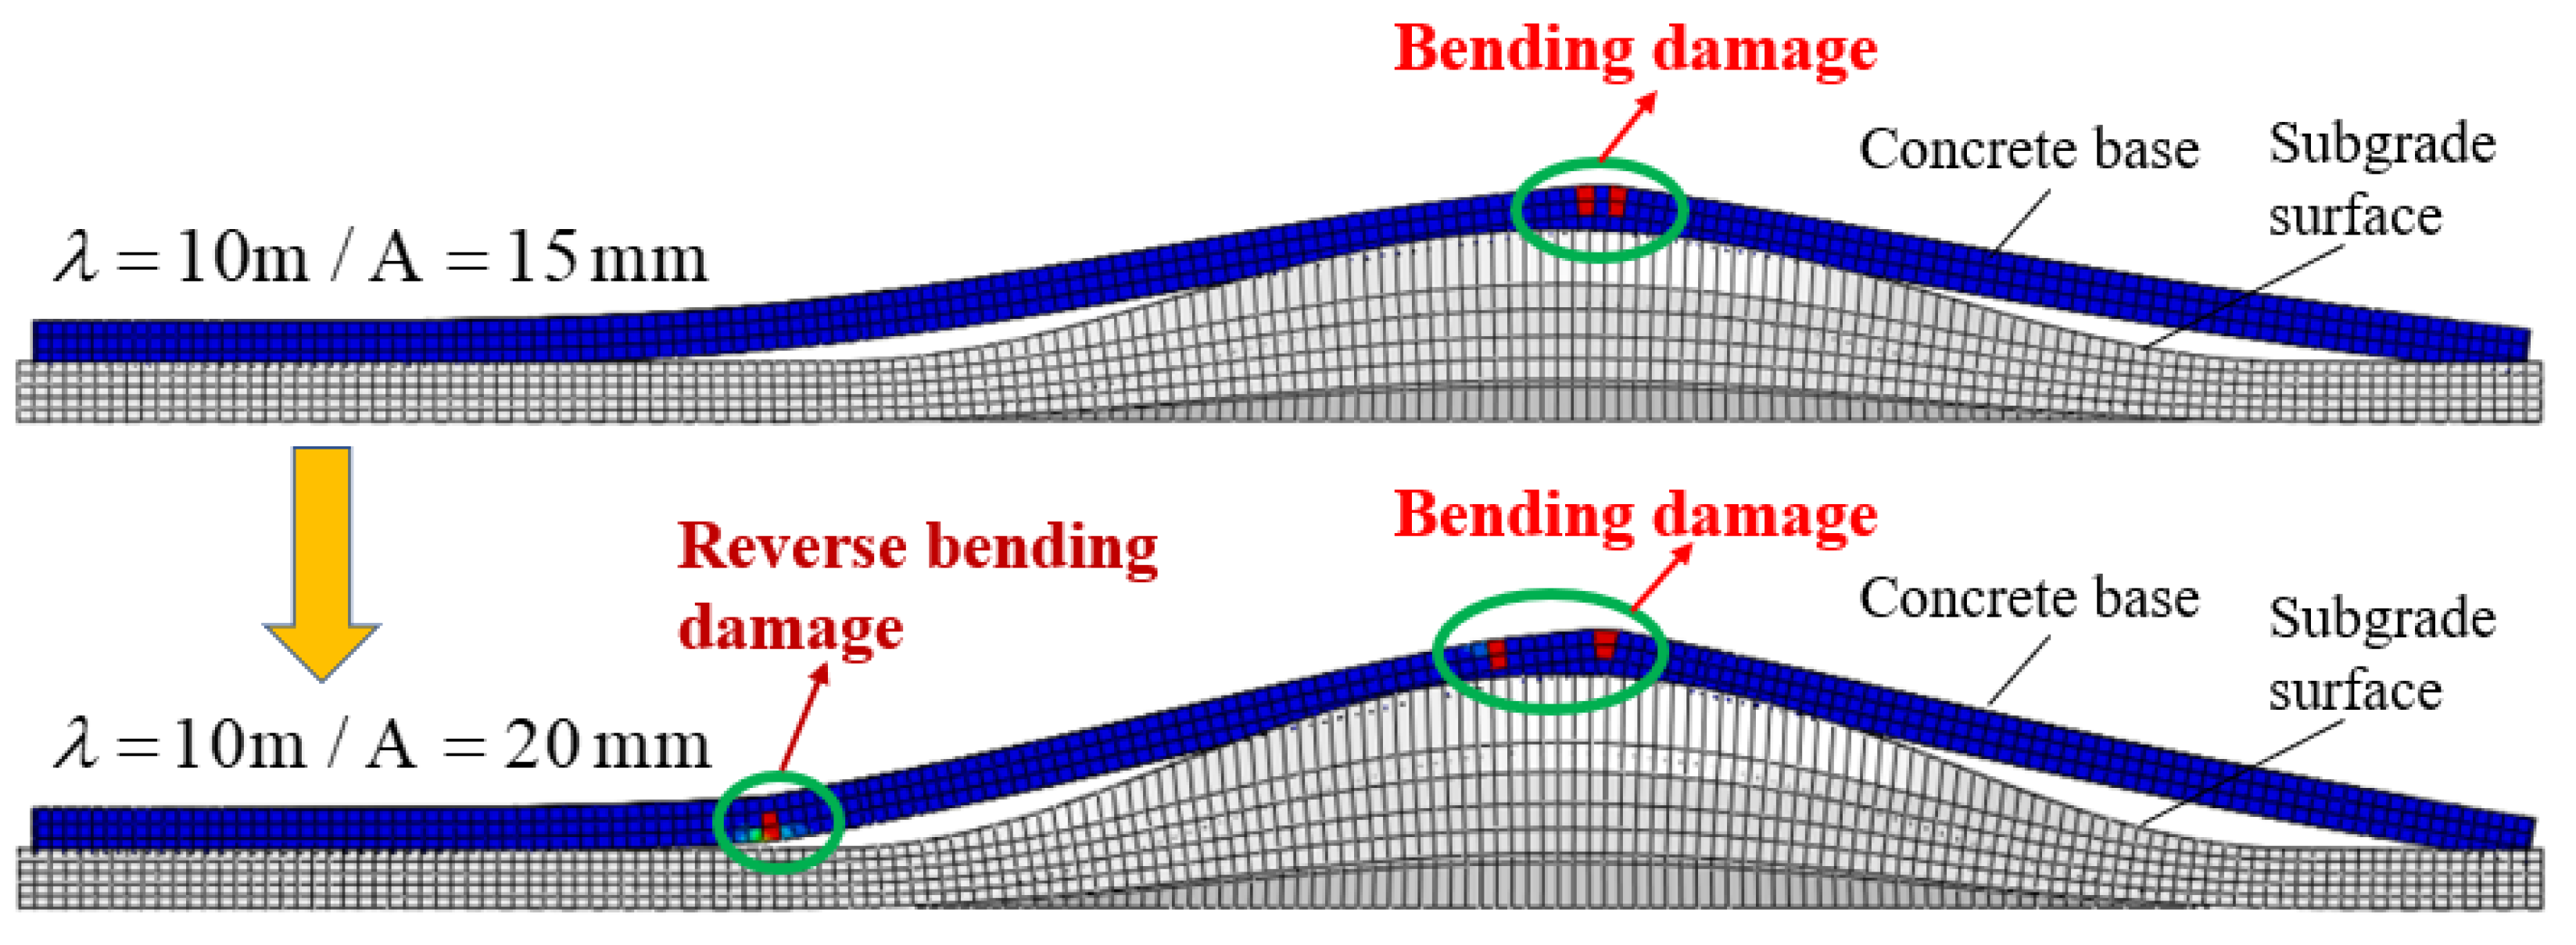
Figure 21 shows the variations in the average damage factor for the base, when the frost heaving wave peak acted on (b). The average damage factor of the base decreased with an increase in frost heaving wavelength and increased with an increase in frost heaving wave amplitude. In order to facilitate the analysis, the concept of the wave/amplitude ratio was put forward, whose value was equal to the ratio of wavelength to wave amplitude. As can be seen from Figure 22, when the wave/amplitude ratio was high (green bottom condition), there was no damage to the concrete base. When the wave/amplitude ratio decreased (white bottom condition), the upper surface of the base began to show bending damage. When the wave/amplitude ratio was further reduced (yellow bottom condition), there was significant bend observed in the base, resulting in the reverse bending phenomenon at the frost heave edge, resulting in new and significant reverse bending damage, as shown in Figure 23. During routine maintenance, the frost heaving geometric parameters should be limited to the green area as far as possible to reduce damage to the base and to prolong the service life of the track structure.
5. Conclusions
Aiming at the problem of uneven high-speed railway subgrade frost heave, based on the concrete damage plasticity theory, an analytical model of CRTSIII slab track-subgrade coupling calculation model was established to study the influence of uneven subgrade frost heave on the deformation and damage of slab track. Conclusions from this analysis are summarized below:
- (1)
- Based on the concrete damage plasticity theory, the damage plasticity parameters of concrete in a track structure are deduced and the correctness of the parameters is verified. The damage plastic model can reflect the softening behavior and stress attenuation phenomenon of the concrete in the track structure after reaching tensile strength. The analytical results are consistent with the on-site condition, which fully demonstrates the necessity and superiority of considering plastic damage on concrete materials.
- (2)
- The peak value of the seam between the self-compacting concrete and the base normally occurs at the self-compacting concrete edge. When the frost heaving wave peak appears at the position that is one-sixth of the base length from the edge of the concrete base (e), due to the lack of longitudinal constraints at the base edge and the formation of a lever system in the middle of the self-compacting concrete, the seam between layers reaches its maximum value at 7.94 mm. The maximum and minimum interlayer seams between the base and the subgrade surface occur when the frost heaving positions are at one-sixth of the base length from the edge of the concrete base (e) and the expansion joint of base (g), respectively.
- (3)
- When the frost heaving wave peak is on grooves in the middle of the base (b), initially, damage and macroscopic cracks of concrete base appear. When the frost heaving wavelength is 10 m, the frost heaving values corresponding to initial damage and macroscopic cracks are 2.43 and 3.83 mm, respectively. When the frost heaving position is near the slab center, the damage to the slab is significant. It occurs near the center of the slab.
- (4)
- The deformation of the track structure increases with an increase in frost heaving wavelength and frost heaving wave amplitude. It is mainly dominated by the frost heaving wave amplitude. The seam between layers decreases with an increase in frost heaving wavelength and increases with an increase in frost heaving wave amplitude. The frost heaving wavelength has a greater influence on the interlayer seam, and the interlayer seam is more sensitive to the frost heaving in the 10 m range wavelength.
- (5)
- When the frost heaving wave amplitude is 15 mm or less, the normal relationship between the maximum tensile stress of the base and the frost heaving amplitude is linear. At this moment, the base has not been damaged or the damage is limited. When the frost heaving wave amplitude reaches 15 mm, 25 mm, and 30 mm, the peak tensile stress of the base reaches the maximum tensile strength, and the stress attenuation phenomenon occurs. The corresponding minimum allowable frost heaving wavelengths are 10 m, 20 m, and 30 m, respectively.
- (6)
- The average damage factor for the base decreases with an increase in frost heaving wavelength and increases with an increase in frost heaving wave amplitude. With a decrease in the wave/amplitude ratio of frost heaving, an increase in damage to the base is observed. Here, it undergoes changes in three stages, namely: (i) no damage, (ii) bending damage on the upper surface, and (iii) reverse bending damage.
Author Contributions
Conceptualization, H.W. and H.X.; Data curation, H.W.; Formal analysis, H.W. and H.X.; Funding acquisition, H.X.; Investigation, Q.G.; Methodology, H.W. and H.X.; Project administration, S.Y. and Q.G.; Resources, S.Y. and Q.G.; Software, H.W. and X.C.; Supervision, H.X.; Visualization, M.M.N.; Writing—original draft, H.W.; Writing—review and editing, H.X. and X.C. All authors have read and agreed to the published version of the manuscript.
Funding
This research was funded by the Science and Technology Project of the Shandong Railway Investment Holding Group Co., Ltd. (grant number TTKJ2021-07) and the National Natural Science Foundation of China (grant number 51978045).
Institutional Review Board Statement
Not applicable.
Informed Consent Statement
Not applicable.
Data Availability Statement
Data are contained within the article.
Conflicts of Interest
The authors declare no conflict of interest.
References
- Wang, J.J.; Wang, M.; Liu, W.B.; Zhao, Y. Technology of CRTSIII Ballastless Track System. Chin. Railw. 2017, 58, 11–15. [Google Scholar]
- Zhao, G. Study on Management Standard of Frost Heaving of Ballastless Track Subgrade on High-speed Railway in Severe Cold Regions. J. China Railw. 2016, 38, 1–8. [Google Scholar]
- Sheng, D.; Zhao, G.; Zhang, S.; Niu, F. Possible frost heave mechanisms in an unsaturated high-speed railway formation. In Proceedings of the 6th International Conference on Unsaturated Soils, UNSAT 2014, Sydney, Australia, 2–5 July 2014. [Google Scholar]
- Yang, G.T.; Yan, H.Y.; Cai, D.G.; Zhao, G.T.; Yao, J.P.; Chen, F. Experimental study on frost heave of high-speed railway subgrade in the seasonally frozen region. Jpn. Geotech. Soc. Spec. Publ. 2016, 2, 1699–1702. [Google Scholar] [CrossRef]
- Zhang, S.; Sheng, D.; Zhao, G.; Niu, F.; He, Z. Analysis of frost heave mechanisms in a high-speed railway embankment. Can. Geotech. J. 2016, 53, 520–529. [Google Scholar] [CrossRef]
- Xiaopei, C.; Bicheng, L.; Wenhao, C.; Yanke, L. Research on Deformation and Damage of CRTSⅢ Slab Track in Severe Cold Regions; Huazhong University of Science and Technology: Wuhan, China, 2019; Volume 47. [Google Scholar]
- Wang, C.; Zhang, R.; Zhao, X.; Zhou, Y. Frost heaving monitoring system and frost heaving rules for the high-speed railway embankment in the seasonally frozen soil regions. J. Glaciol. Geocryol. 2014, 36, 962–968. [Google Scholar]
- Yu, L. Observation and Analysis on Frost Heaving Deformation at Subgrade of Haerbin-Dalian PDL. Subgrade Eng. 2013, 3, 54 58+63. [Google Scholar]
- Zhao, G.T.; Liu, X.B.; Gao, L.; Cai, X. Characteristic Analysis of Track Irregularity in Subgrade Frost Heave Area of Harbin-Dalian High-speed Railway. J. China Railw. Soc. 2016, 38, 105–109. [Google Scholar]
- Cheng, R.; Yan, B.; Xie, H. Track Irregularity and Mechanical Characteristics Analysis of CRTS I Ballastless Track Under Subgrade Frost Heaving. In Proceedings of the IABSE Conference: Risk Intelligence of Infrastructures, Seoul, Republic of Korea, 9–10 November 2020. [Google Scholar]
- Zhao, G.; Zhao, L.; Zhang, L. Mechanical Characteristics of Ballastless Track under Subgrade Frost Heaving in High-speed Railway. J. Railw. Eng. Soc. 2017, 34, 53–61. [Google Scholar]
- Hao, X.; Wenfeng, C.; Ping, W. Research on the Influence of Subgrade Frost Heave on CRTS III Slab Ballastless Track. J. Railw. Eng. Soc. 2019, 36, 27 32+40. [Google Scholar]
- Zhang, Y.Z.; Du, Y.L.; Sun, B.C.; Zhang, S.P.; Han, J. Roadbed deformation of high-speed railway due to freezing-thawing process in seasonally frozen regions. Chin. J. Rock Mech. Eng. 2014, 33, 2546–2553. [Google Scholar]
- Guanghua, S. Sunny-shady Slope Effect on Stress and Deformation of Ballastless Track in Transition Section. Chin. Railw. 2022, 3, 109–117. [Google Scholar]
- Jianmin, G.; Yi, G.; Yu, G. Dynamic Influence of Uneven Frost Heaving Deformation of High-speed Railway Subgrade on Wheel-rail System. J. China Railw. Soc. 2019, 41, 94–102. [Google Scholar]
- Cai, X.; Liang, Y.; Xin, T.; Ma, C.; Wang, H. Assessing the effects of subgrade frost heave on vehicle dynamic behaviors on high-speed railway. Cold Reg. Sci. Technol. 2018, 158, 95–105. [Google Scholar] [CrossRef]
- Gao, L.; Zhao, W.; Hou, B.; Zhong, Y. Analysis of Influencing Mechanism of Subgrade Frost Heave on Vehicle-Track Dynamic System. Appl. Sci. 2020, 10, 8097. [Google Scholar] [CrossRef]
- Pu, J.; Jieling, X.; Liyuan, Z.; Sixin, Y.; Hao, L. Study on nonlinear damage mechanism of CRTS III slab track in seasonal frozen region. J. Railw. Sci. Eng. 2021, 18, 1686–1695. [Google Scholar]
- Cai, X.; Zhang, Q.; Wang, Q.; Cui, X.; Dong, B. Effects of the subgrade differential arch on damage characteristics of CRTS III slab track and vehicle dynamic response. Constr. Build. Mater. 2022, 327, 126982. [Google Scholar] [CrossRef]
- Cai, X.; Zhang, Q.; Zhang, Y.; Wang, Q.; Luo, B.; Yang, G.; Lau, A. Deformation Law and Control Limit of CRTSIII Slab Track under Subgrade Frost Heave. Appl. Sci. 2021, 11, 3520. [Google Scholar] [CrossRef]
- Dongbin, Y.; Haibao, H.; Zhenyong, L. Solutions to Frost Heave of Railway Subgrade in Seasonal Frozen Soil Region. J. Technol. 2021, 21, 239–242. [Google Scholar]
- Weiping, L. Treatment Technology of Subgrade Frost Heaving for High Speed Railway in Severe Cold Area. Railw. Eng. 2016, 4, 92–97. [Google Scholar]
- Guotao, Y. Study on Subgrade Frost Heave Mechanism and Line Regularity Control Technology of High-Speed Railway in High-Cold Regions; Beijing Jiaotong University: Beijing, China, 2020. [Google Scholar]
- Lubliner, J.; Oliver, J.; Oller, S.; Oñate, E. A plastic-damage model for concrete. Int. J. Solids Struct. 1989, 25, 299–326. [Google Scholar] [CrossRef]
- Lee, J.; Fenves, G.L. Plastic-damage model for cyclic loading of concrete structures. J. Eng. Mech. 1998, 124, 892–900. [Google Scholar] [CrossRef]
- Ren, J.; Wang, J.; Li, X.; Wei, K.; Li, H.; Deng, S. Influence of cement asphalt mortar debonding on the damage distribution and mechanical responses of CRTS I prefabricated slab. Constr. Build. Mater. 2020, 230, 116995.1–116995.12. [Google Scholar] [CrossRef]
- Hl, A.; Sk, B.; Mawc, D.; Cuong-Le, T. A concrete damaged plasticity model for predicting the effects of compressive high-strength concrete under static and dynamic loading. J. Build. Eng. 2021, 44, 103239. [Google Scholar]
- GB 50010—2010; Housing and Urban-Rural Development of the People’s Republic of China. Code for Design of Concrete Structures. China Architecture & Building Press: Beijing, China, 2015.
- Guo, Y. Effects of Differential Subgrade Settlement and Its Evolution in High-Speed Railways on Mechanical Performance of Vehicle-Track Coupled System; Southwest Jiaotong University: Chengdu, China, 2018. [Google Scholar]
- Gao, L.; Zhao, L.; Qu, C.; Cai, X. Analysis on design scheme of CRTSIII slab track structure on roadbed. J. Tongji Univ. Nat. Sci. 2013, 41, 848–855. [Google Scholar]
- Hunt, H. Modelling of Rail Roughness for the Evaluation of Vibration-Isolation Measures. In Proceedings of the Twelfth International Congress on Sound and Vibration, Lisbon, Portugal, 11–14 July 2005. [Google Scholar]
- Hunt, H. Types of Rail Roughness and the Selection of Vibration Isolation Measures. In Proceedings of the 9th International Workshop on Railway Noise and Vibration, Munich, Germany, 4–8 September 2007; pp. 341–347. [Google Scholar]
- Auersch, L. Excitation of ground vibration due to the passage of trains over a track with trackbed irregularities and a varying support stiffness. Veh. Syst. Dyn. 2015, 53, 1–29. [Google Scholar] [CrossRef]
- Cui, X.; Ling, X. Effects of differential subgrade settlement on damage distribution and mechanical properties of CRTS II slab track. Constr. Build. Mater. 2021, 271, 121821. [Google Scholar] [CrossRef]
- Auersch, L.; Song, J. Dynamic damage quantification of slab tracks—Finite element models on Winkler soil and finite-element boundary-element models on continuous soil. CivilEng 2022, 3, 979–997. [Google Scholar] [CrossRef]
Figure 1.
CRTSIII slab track structure.
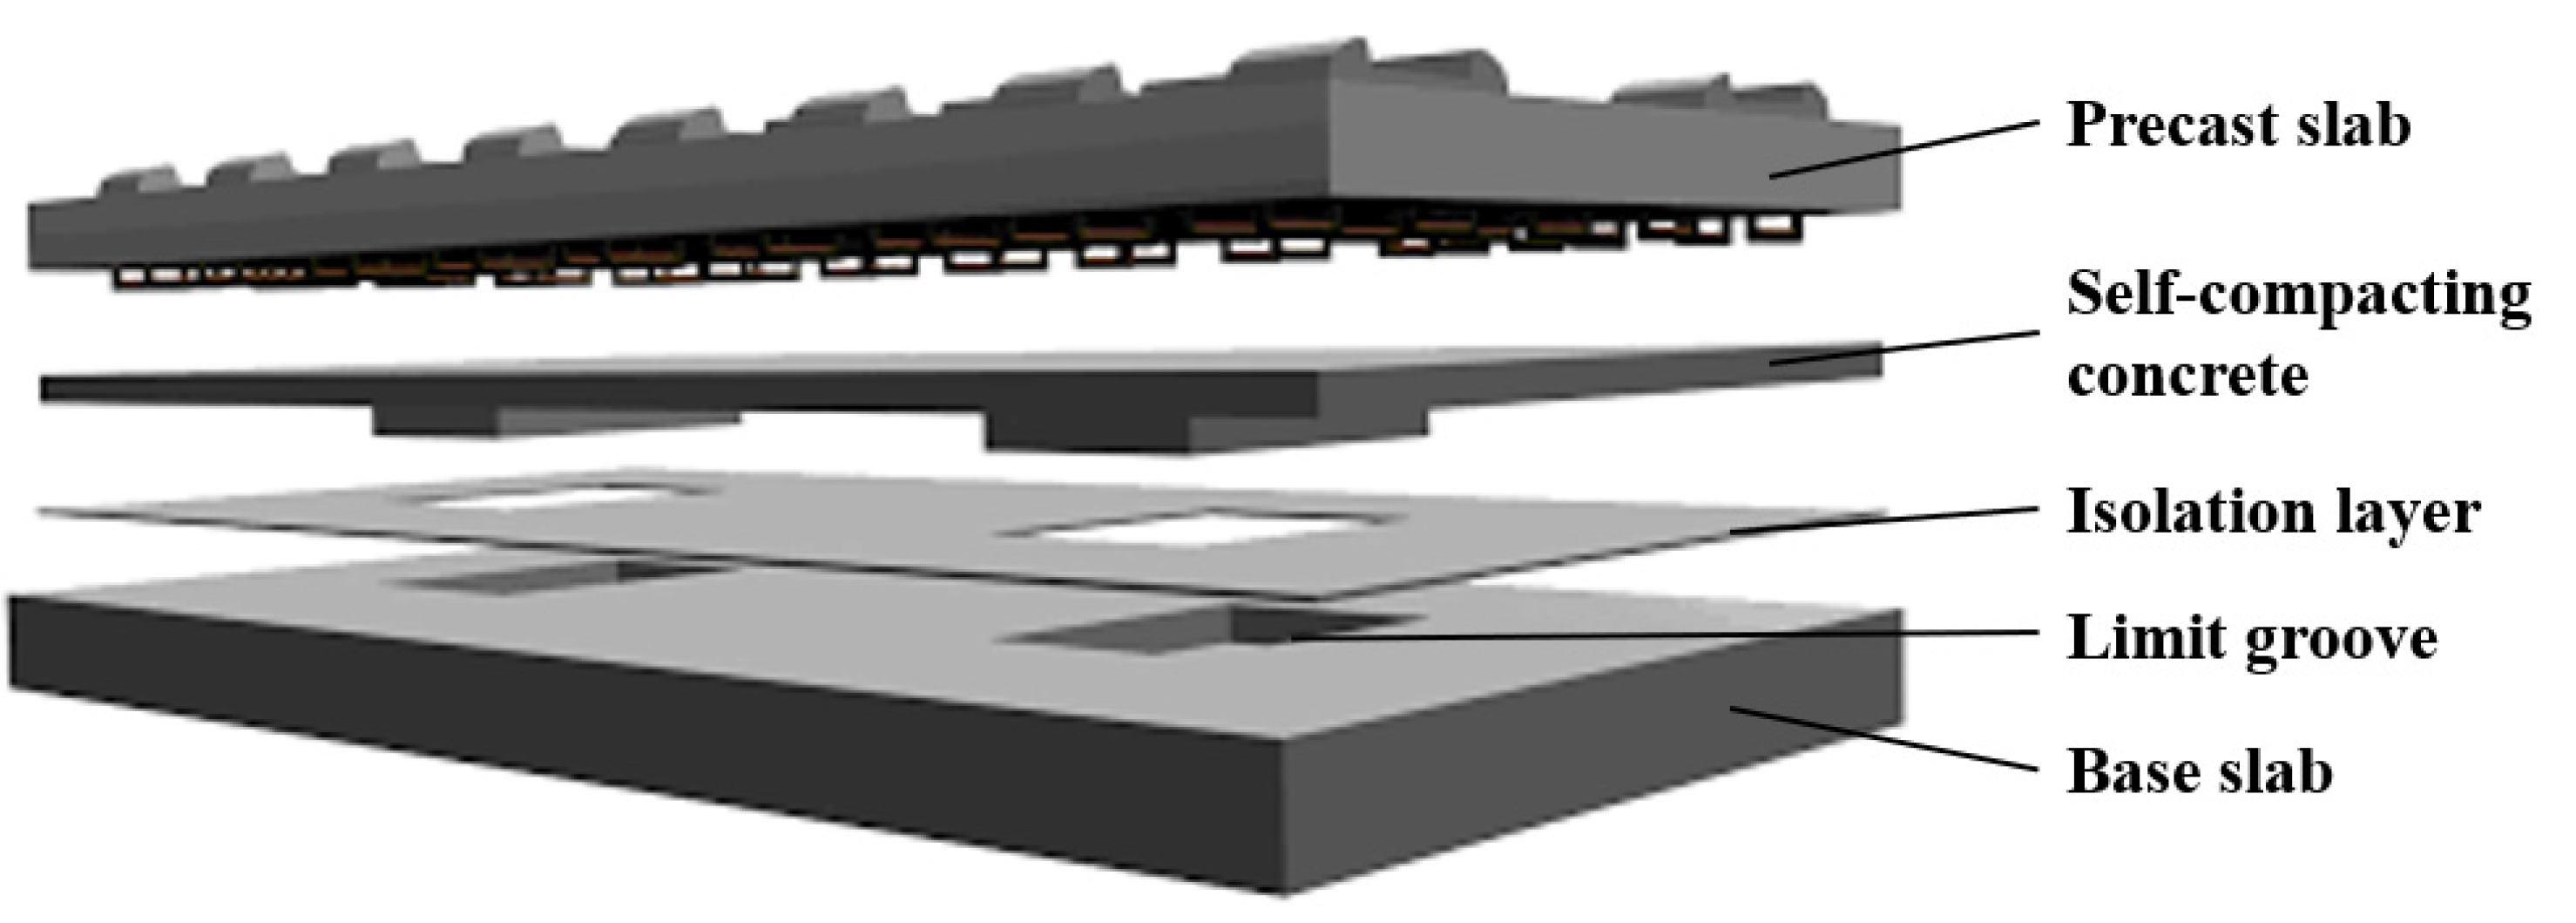
Figure 2.
Uniaxial tensile stress-strain curve.
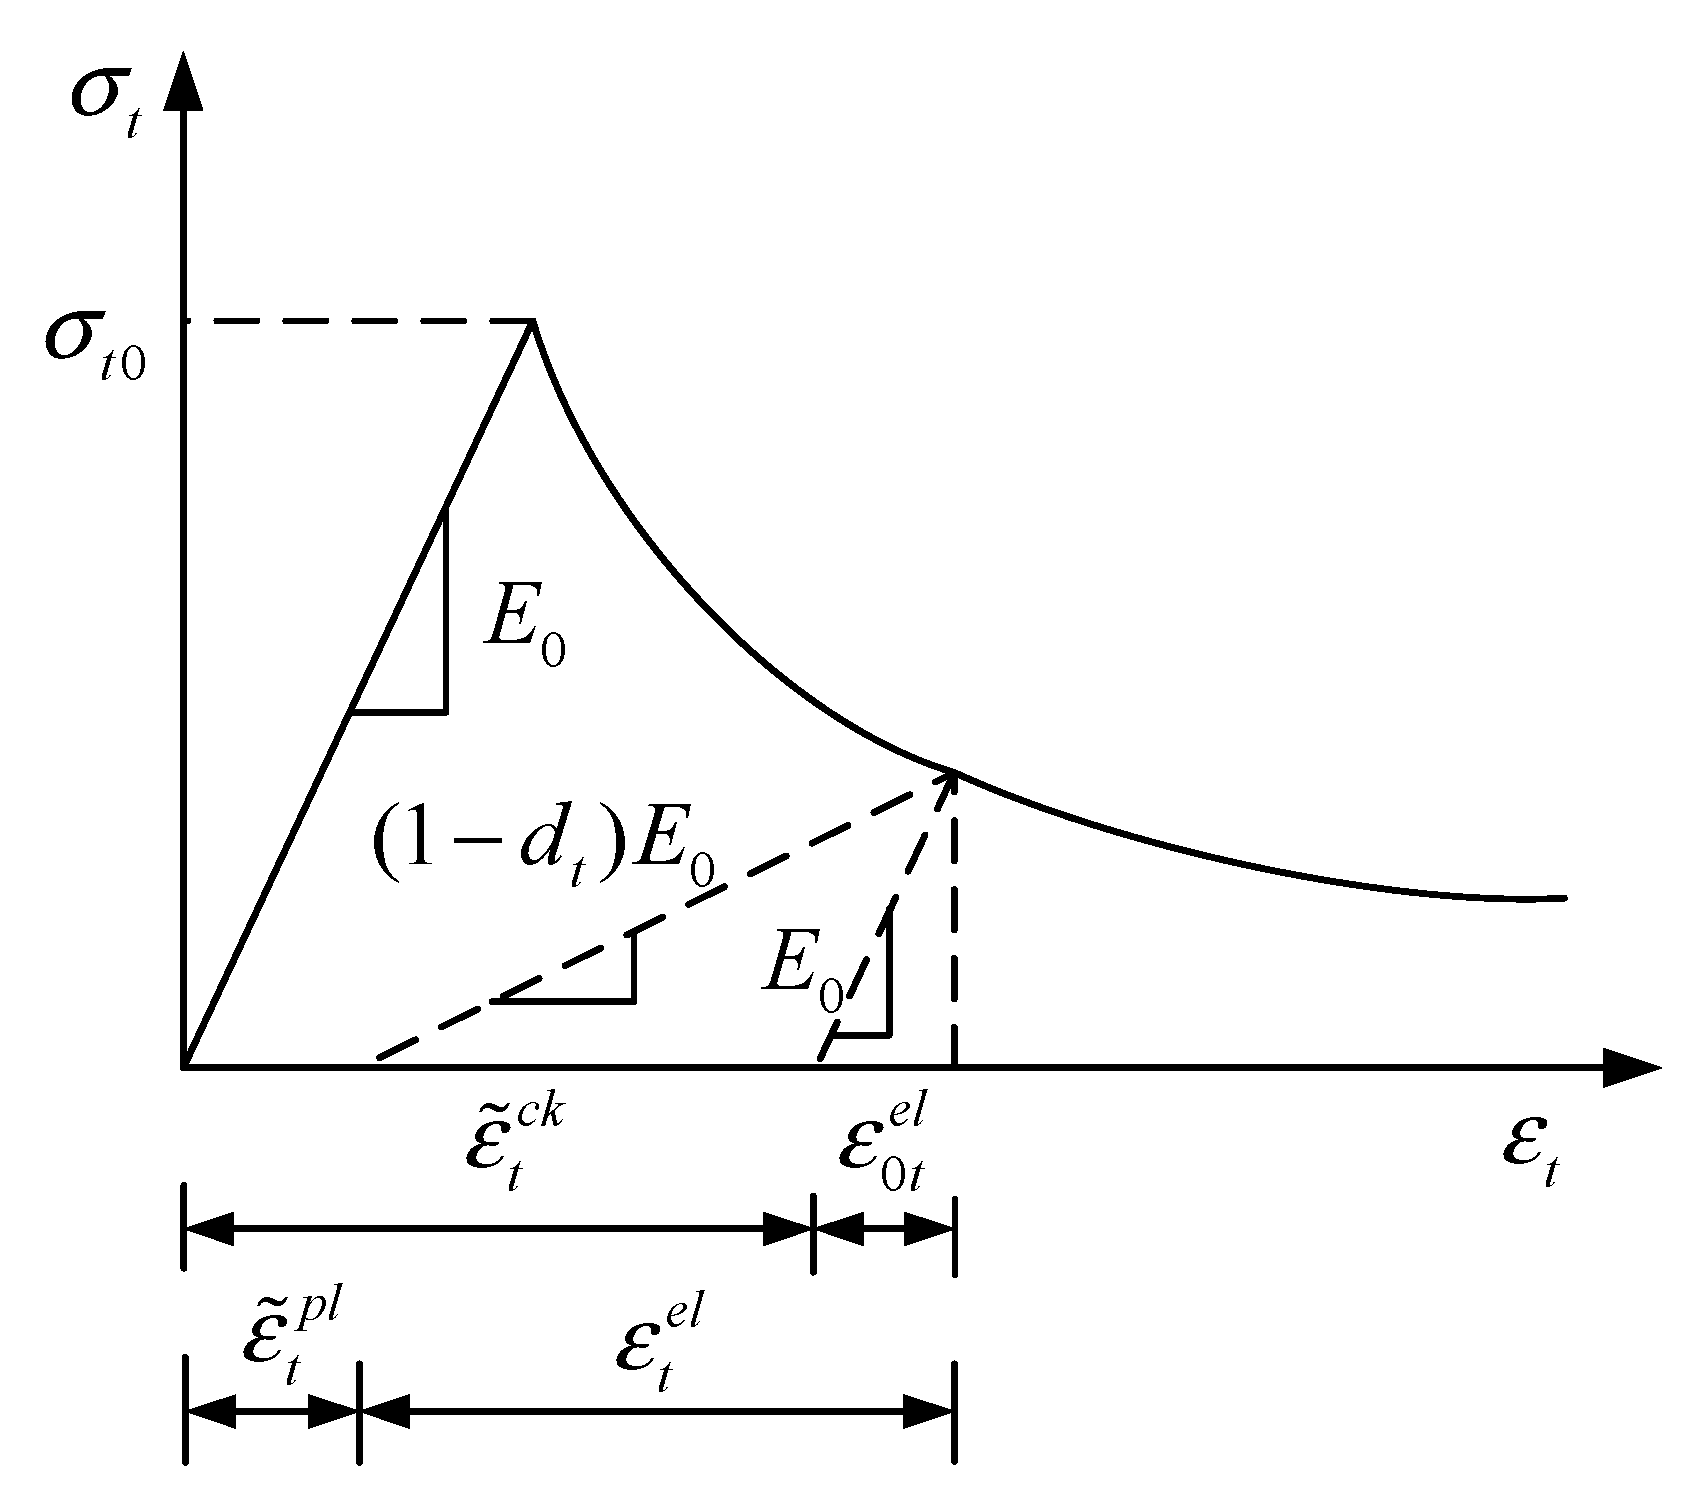
Figure 3.
Uniaxial compressive stress-strain curve.

Figure 4.
Stress/damage factor-inelastic strain relationship: (a) C60 uniaxial tensile; (b) C60 uniaxial compression.
Figure 4.
Stress/damage factor-inelastic strain relationship: (a) C60 uniaxial tensile; (b) C60 uniaxial compression.

Figure 5.
CRTSIII slab track structure with damage plasticity and reinforcement.
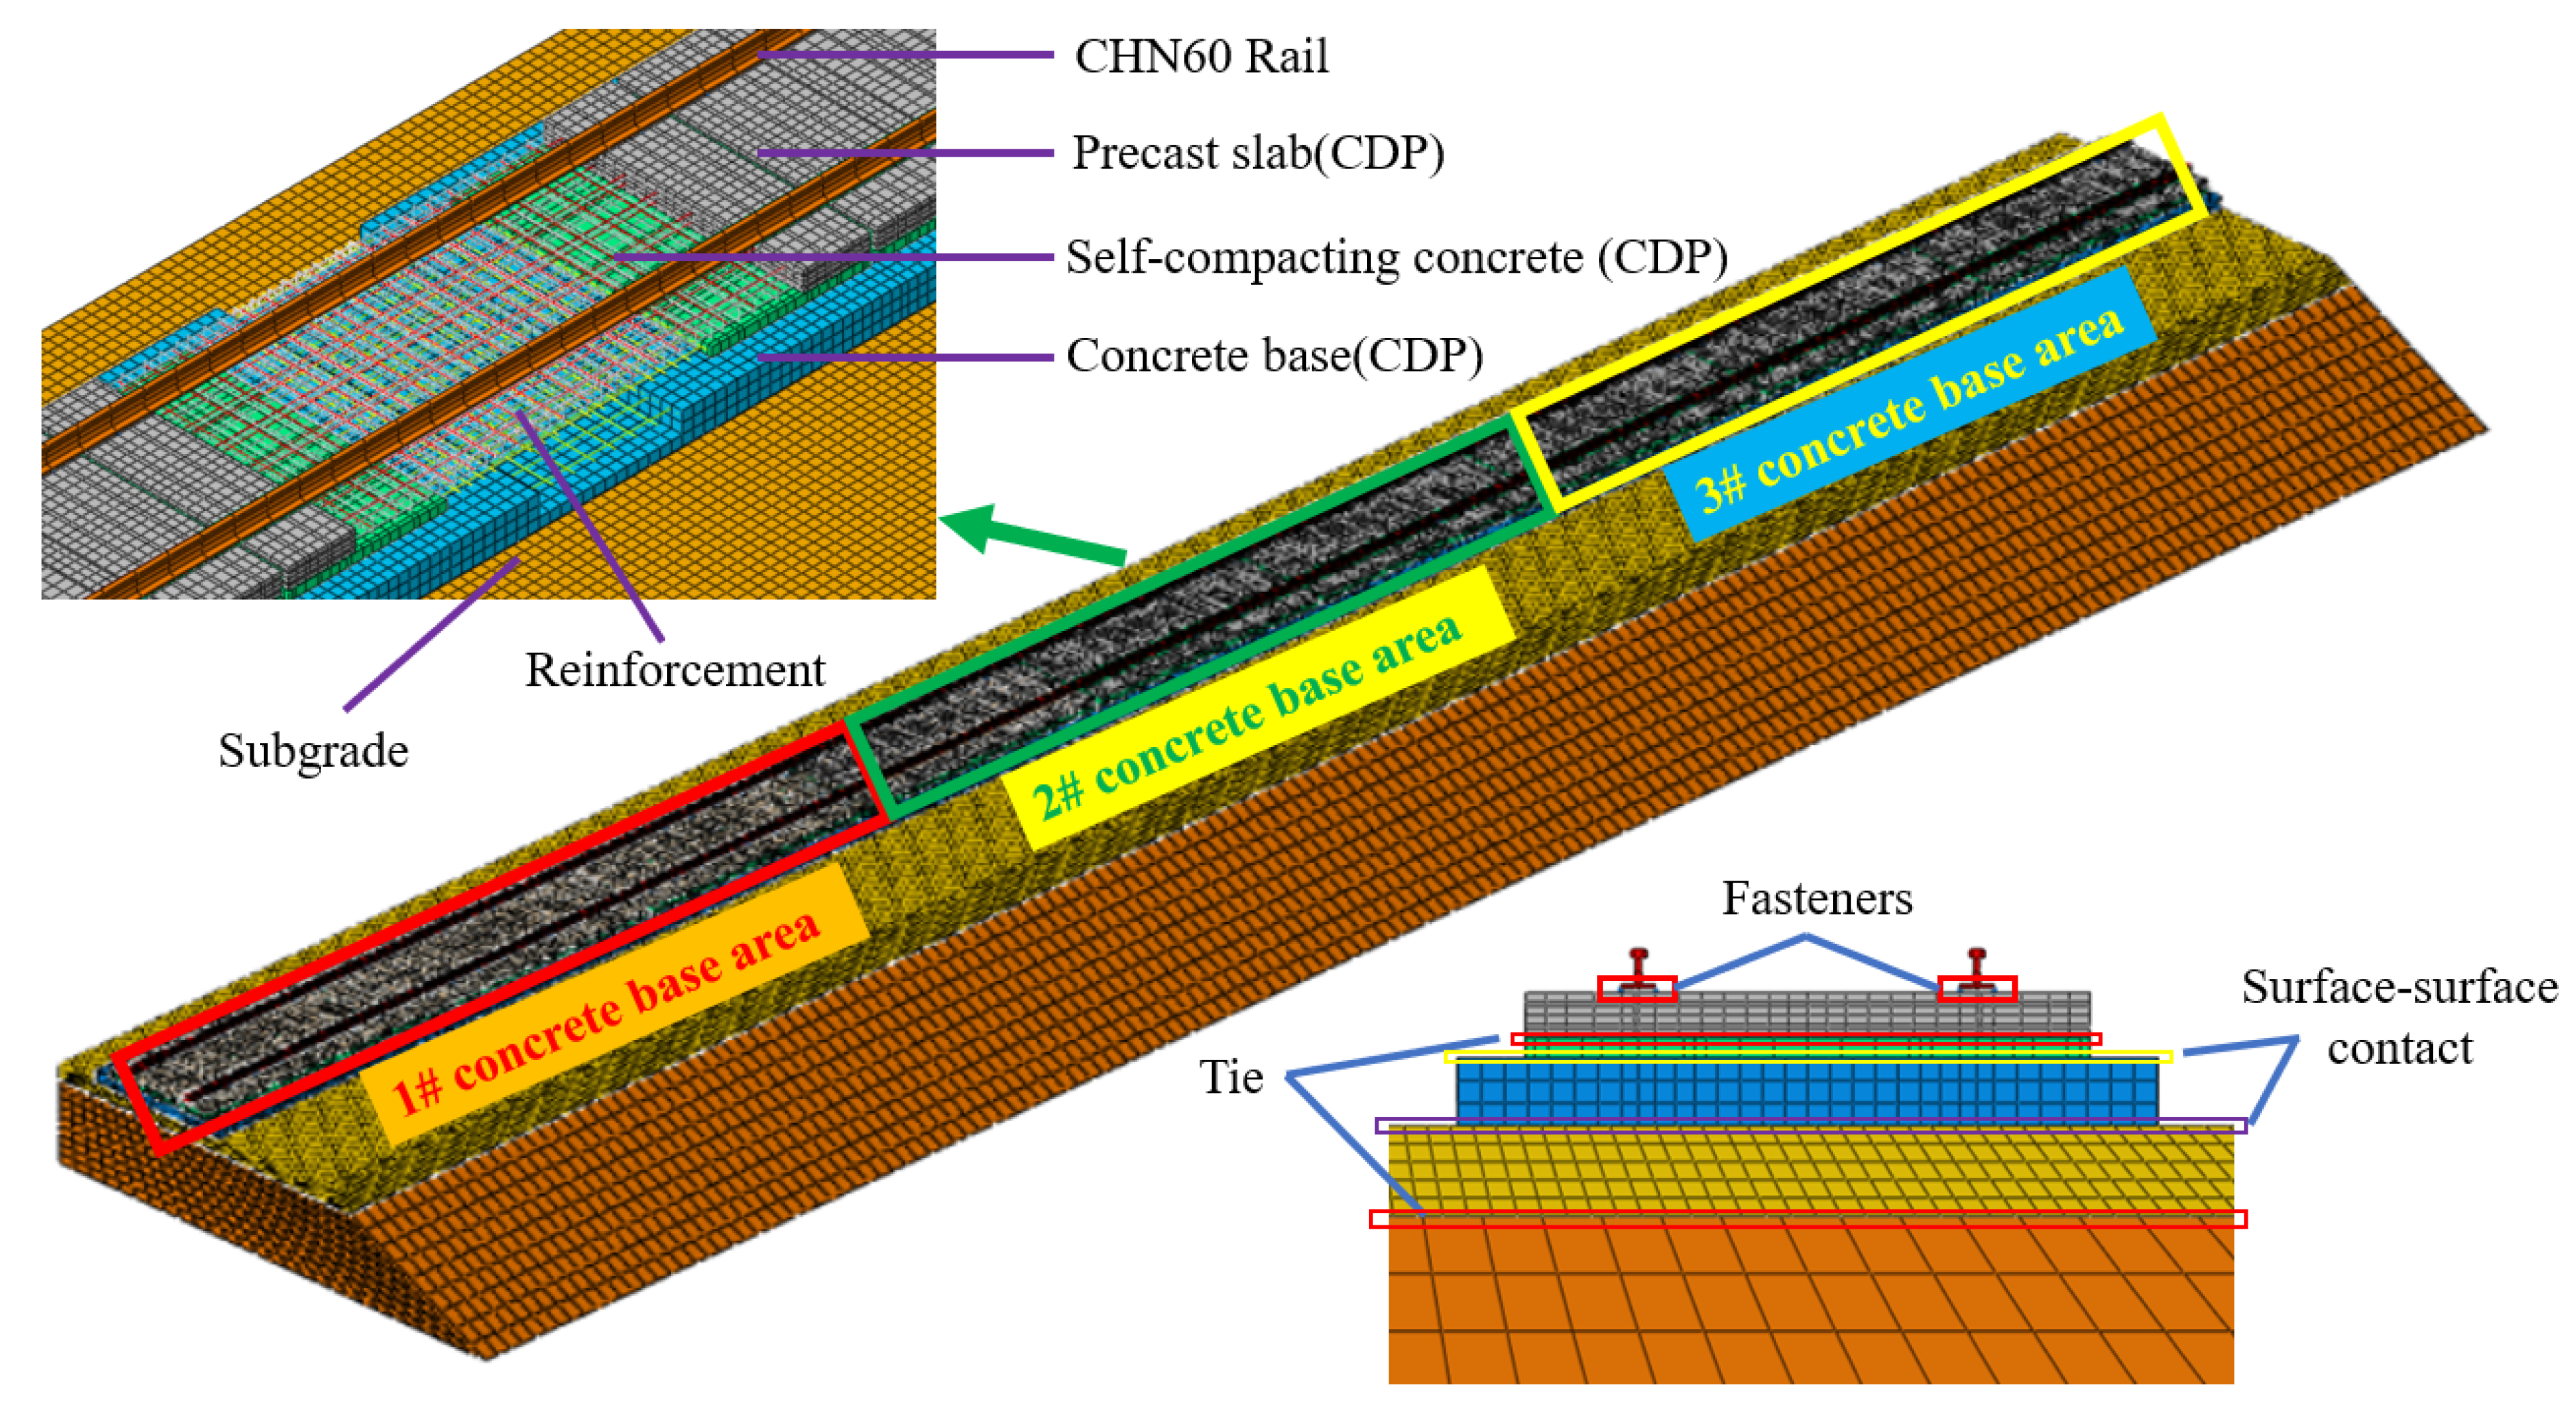
Figure 6.
Cosine function for simulating frost heave waveform.

Figure 7.
Comparison between simulation results and theoretical computational results: (a) C60 uniaxial tensile; (b) C60 uniaxial compression; (c) C40 uniaxial tensile; (d) C40 uniaxial compression.
Figure 7.
Comparison between simulation results and theoretical computational results: (a) C60 uniaxial tensile; (b) C60 uniaxial compression; (c) C40 uniaxial tensile; (d) C40 uniaxial compression.
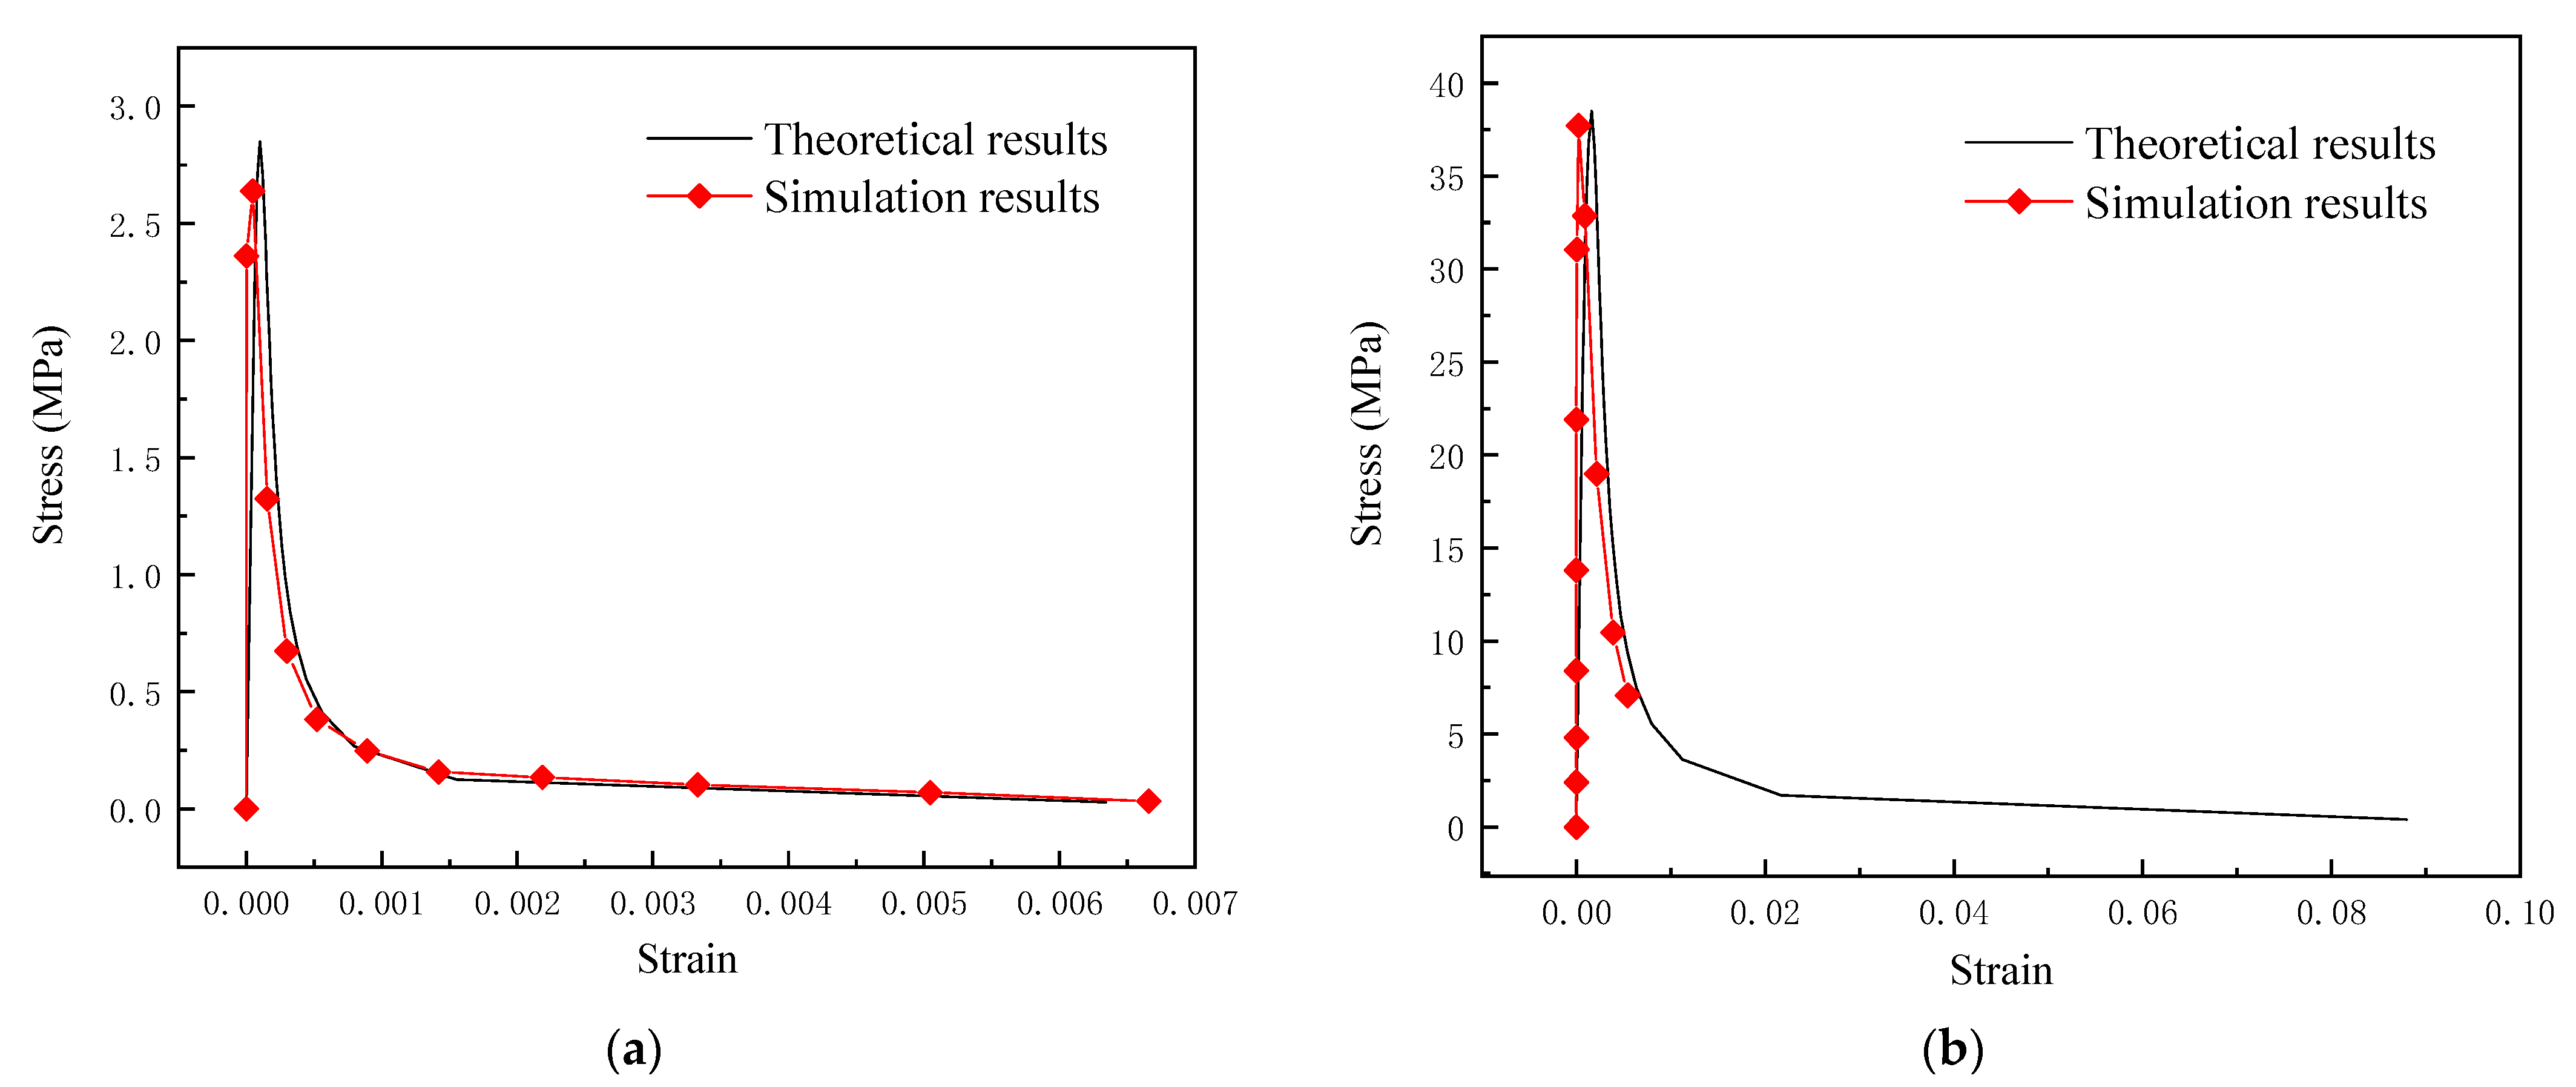

Figure 8.
Vertical displacement of track structure: (a) Linear elastic model; (b) damaged plasticity model.
Figure 8.
Vertical displacement of track structure: (a) Linear elastic model; (b) damaged plasticity model.

Figure 9.
Damage cloud of track structure.

Figure 10.
Interlayer seam.
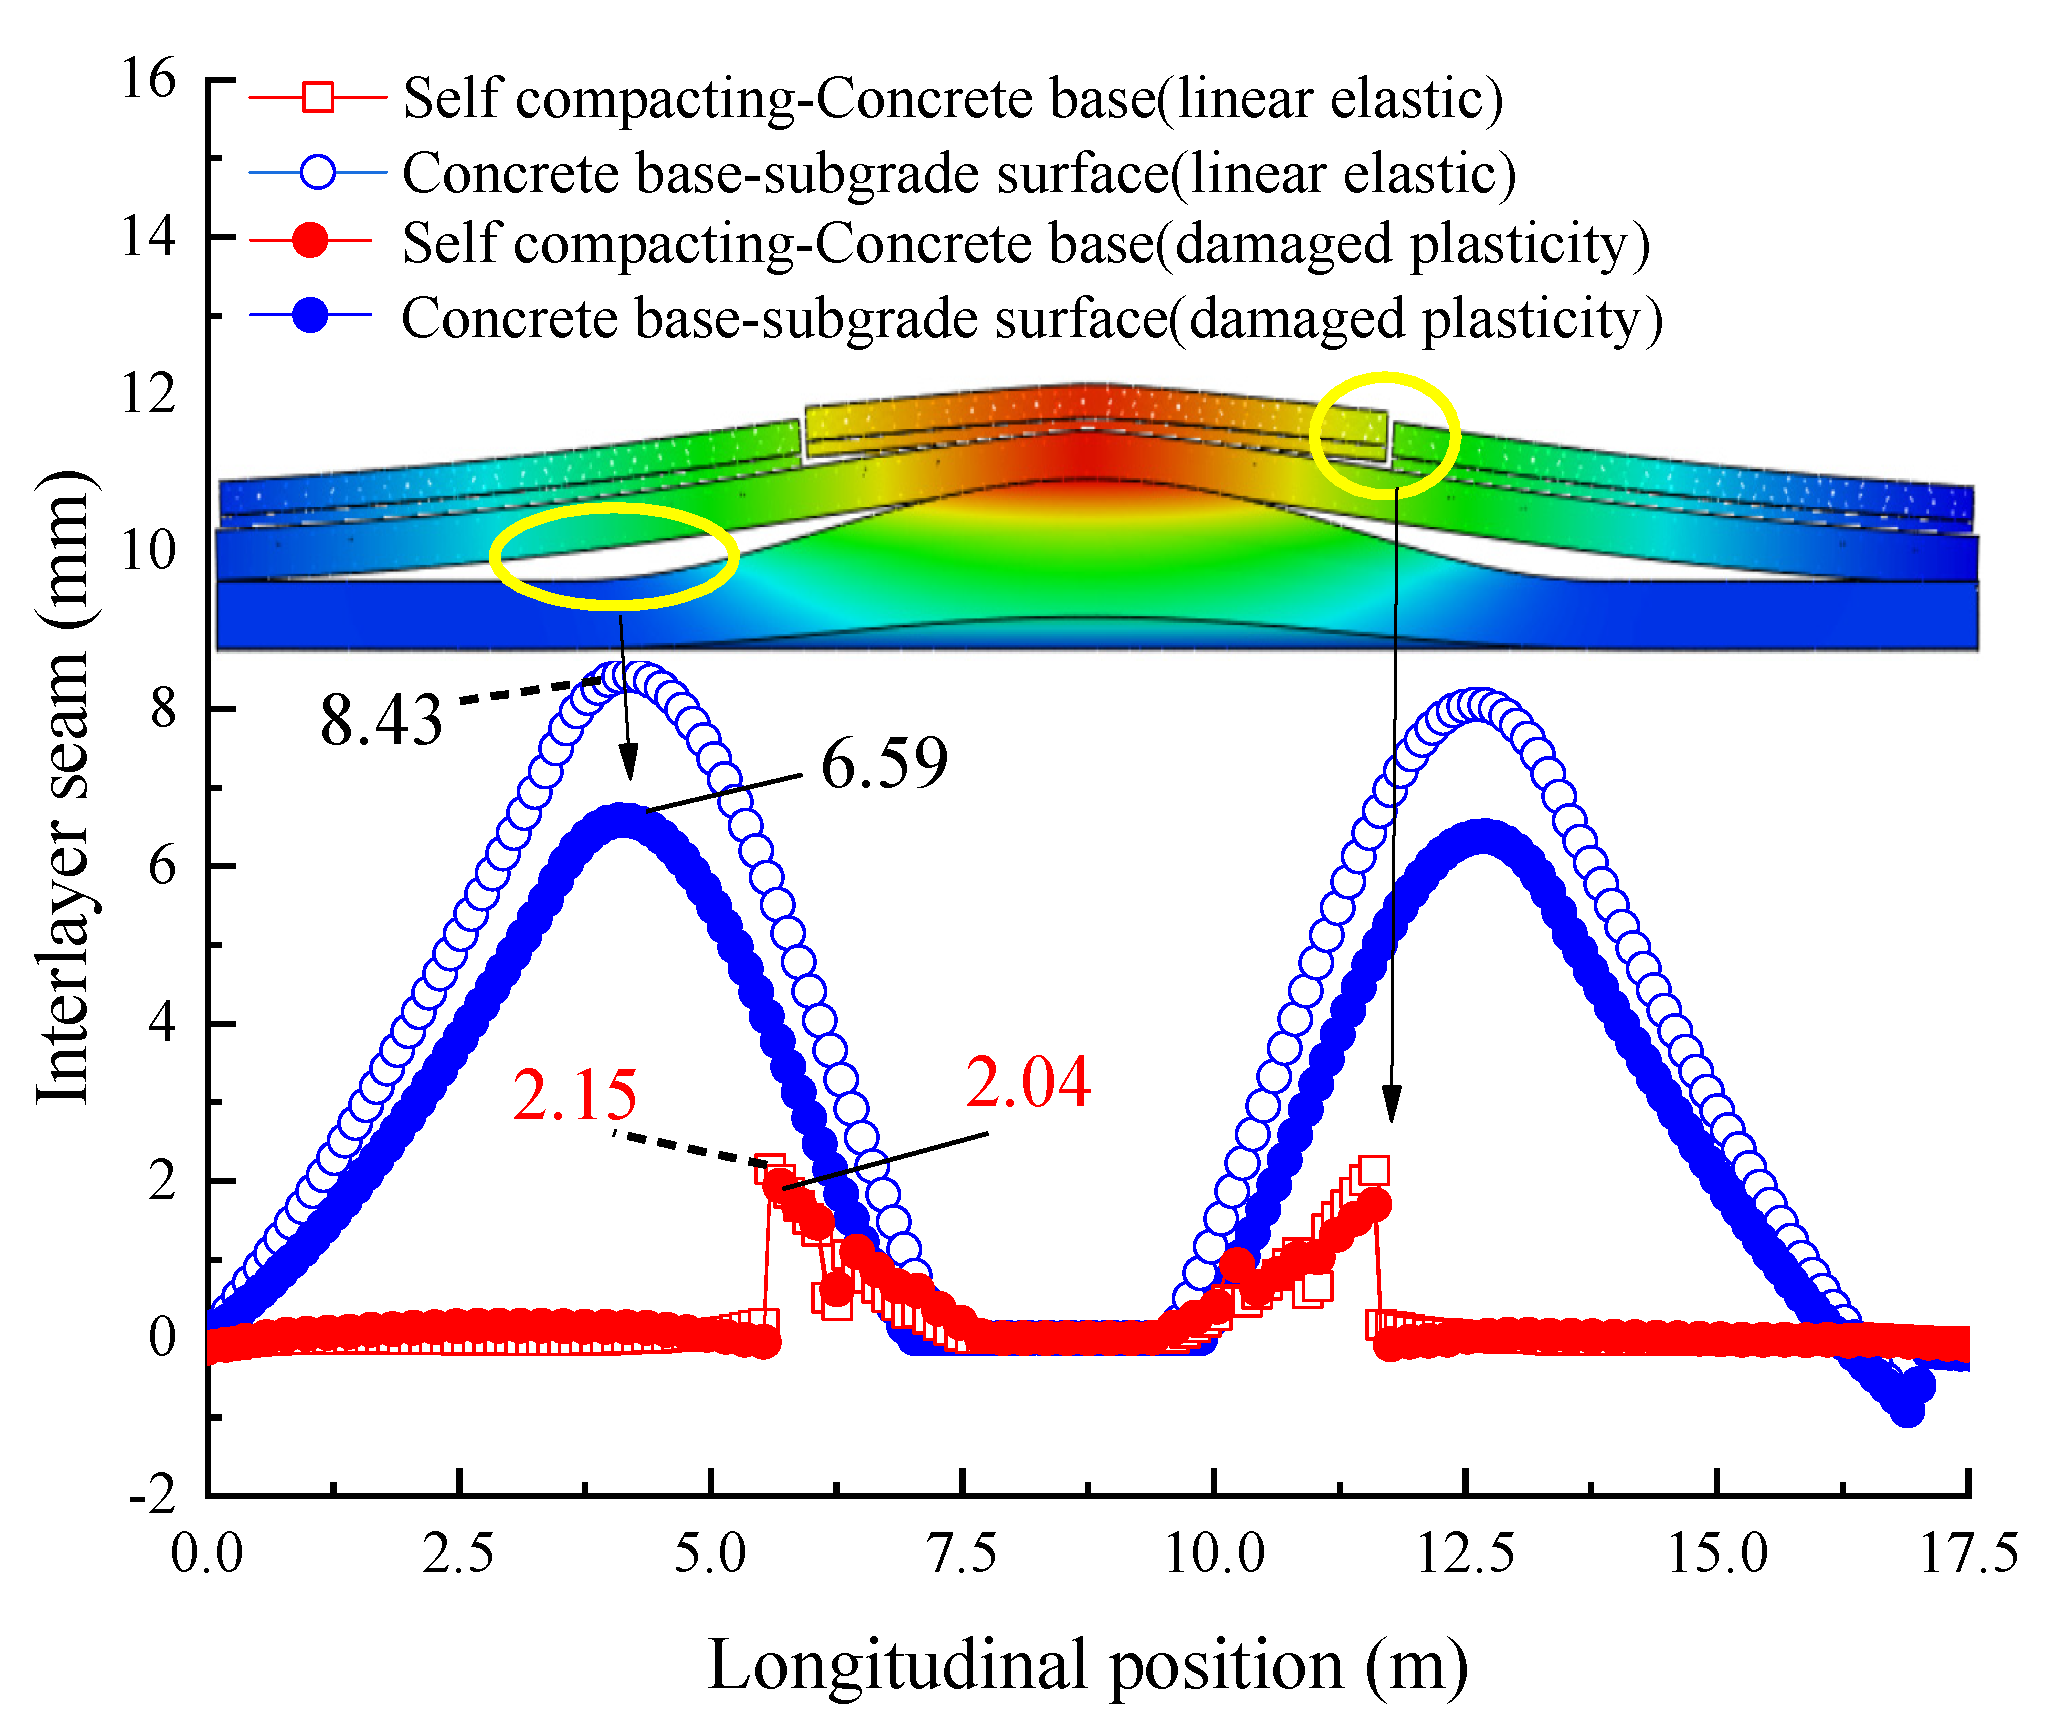
Figure 11.
Longitudinal stress of the track structure: (a) Longitudinal stress of the composite slab; (b) longitudinal stress of the concrete base.
Figure 11.
Longitudinal stress of the track structure: (a) Longitudinal stress of the composite slab; (b) longitudinal stress of the concrete base.

Figure 12.
Schematic diagram of the frost heaving positions.
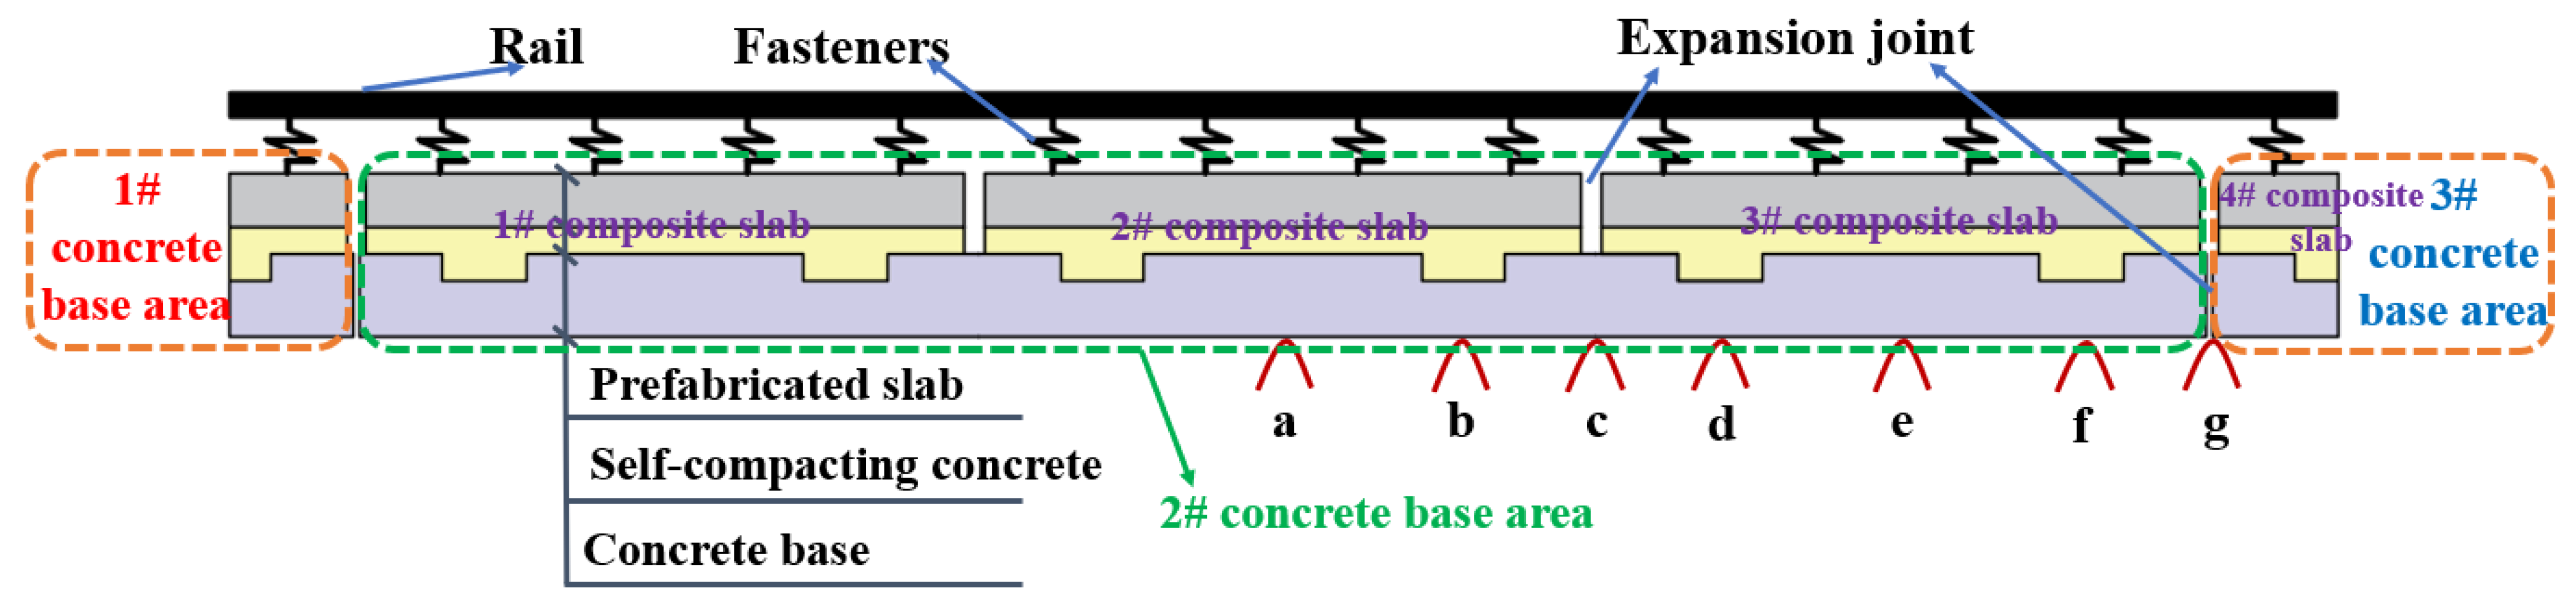
Figure 13.
Interlayer seam: (a) Self-compacting base interlayer seam; (b) base subgrade surface interlayer seam.
Figure 13.
Interlayer seam: (a) Self-compacting base interlayer seam; (b) base subgrade surface interlayer seam.
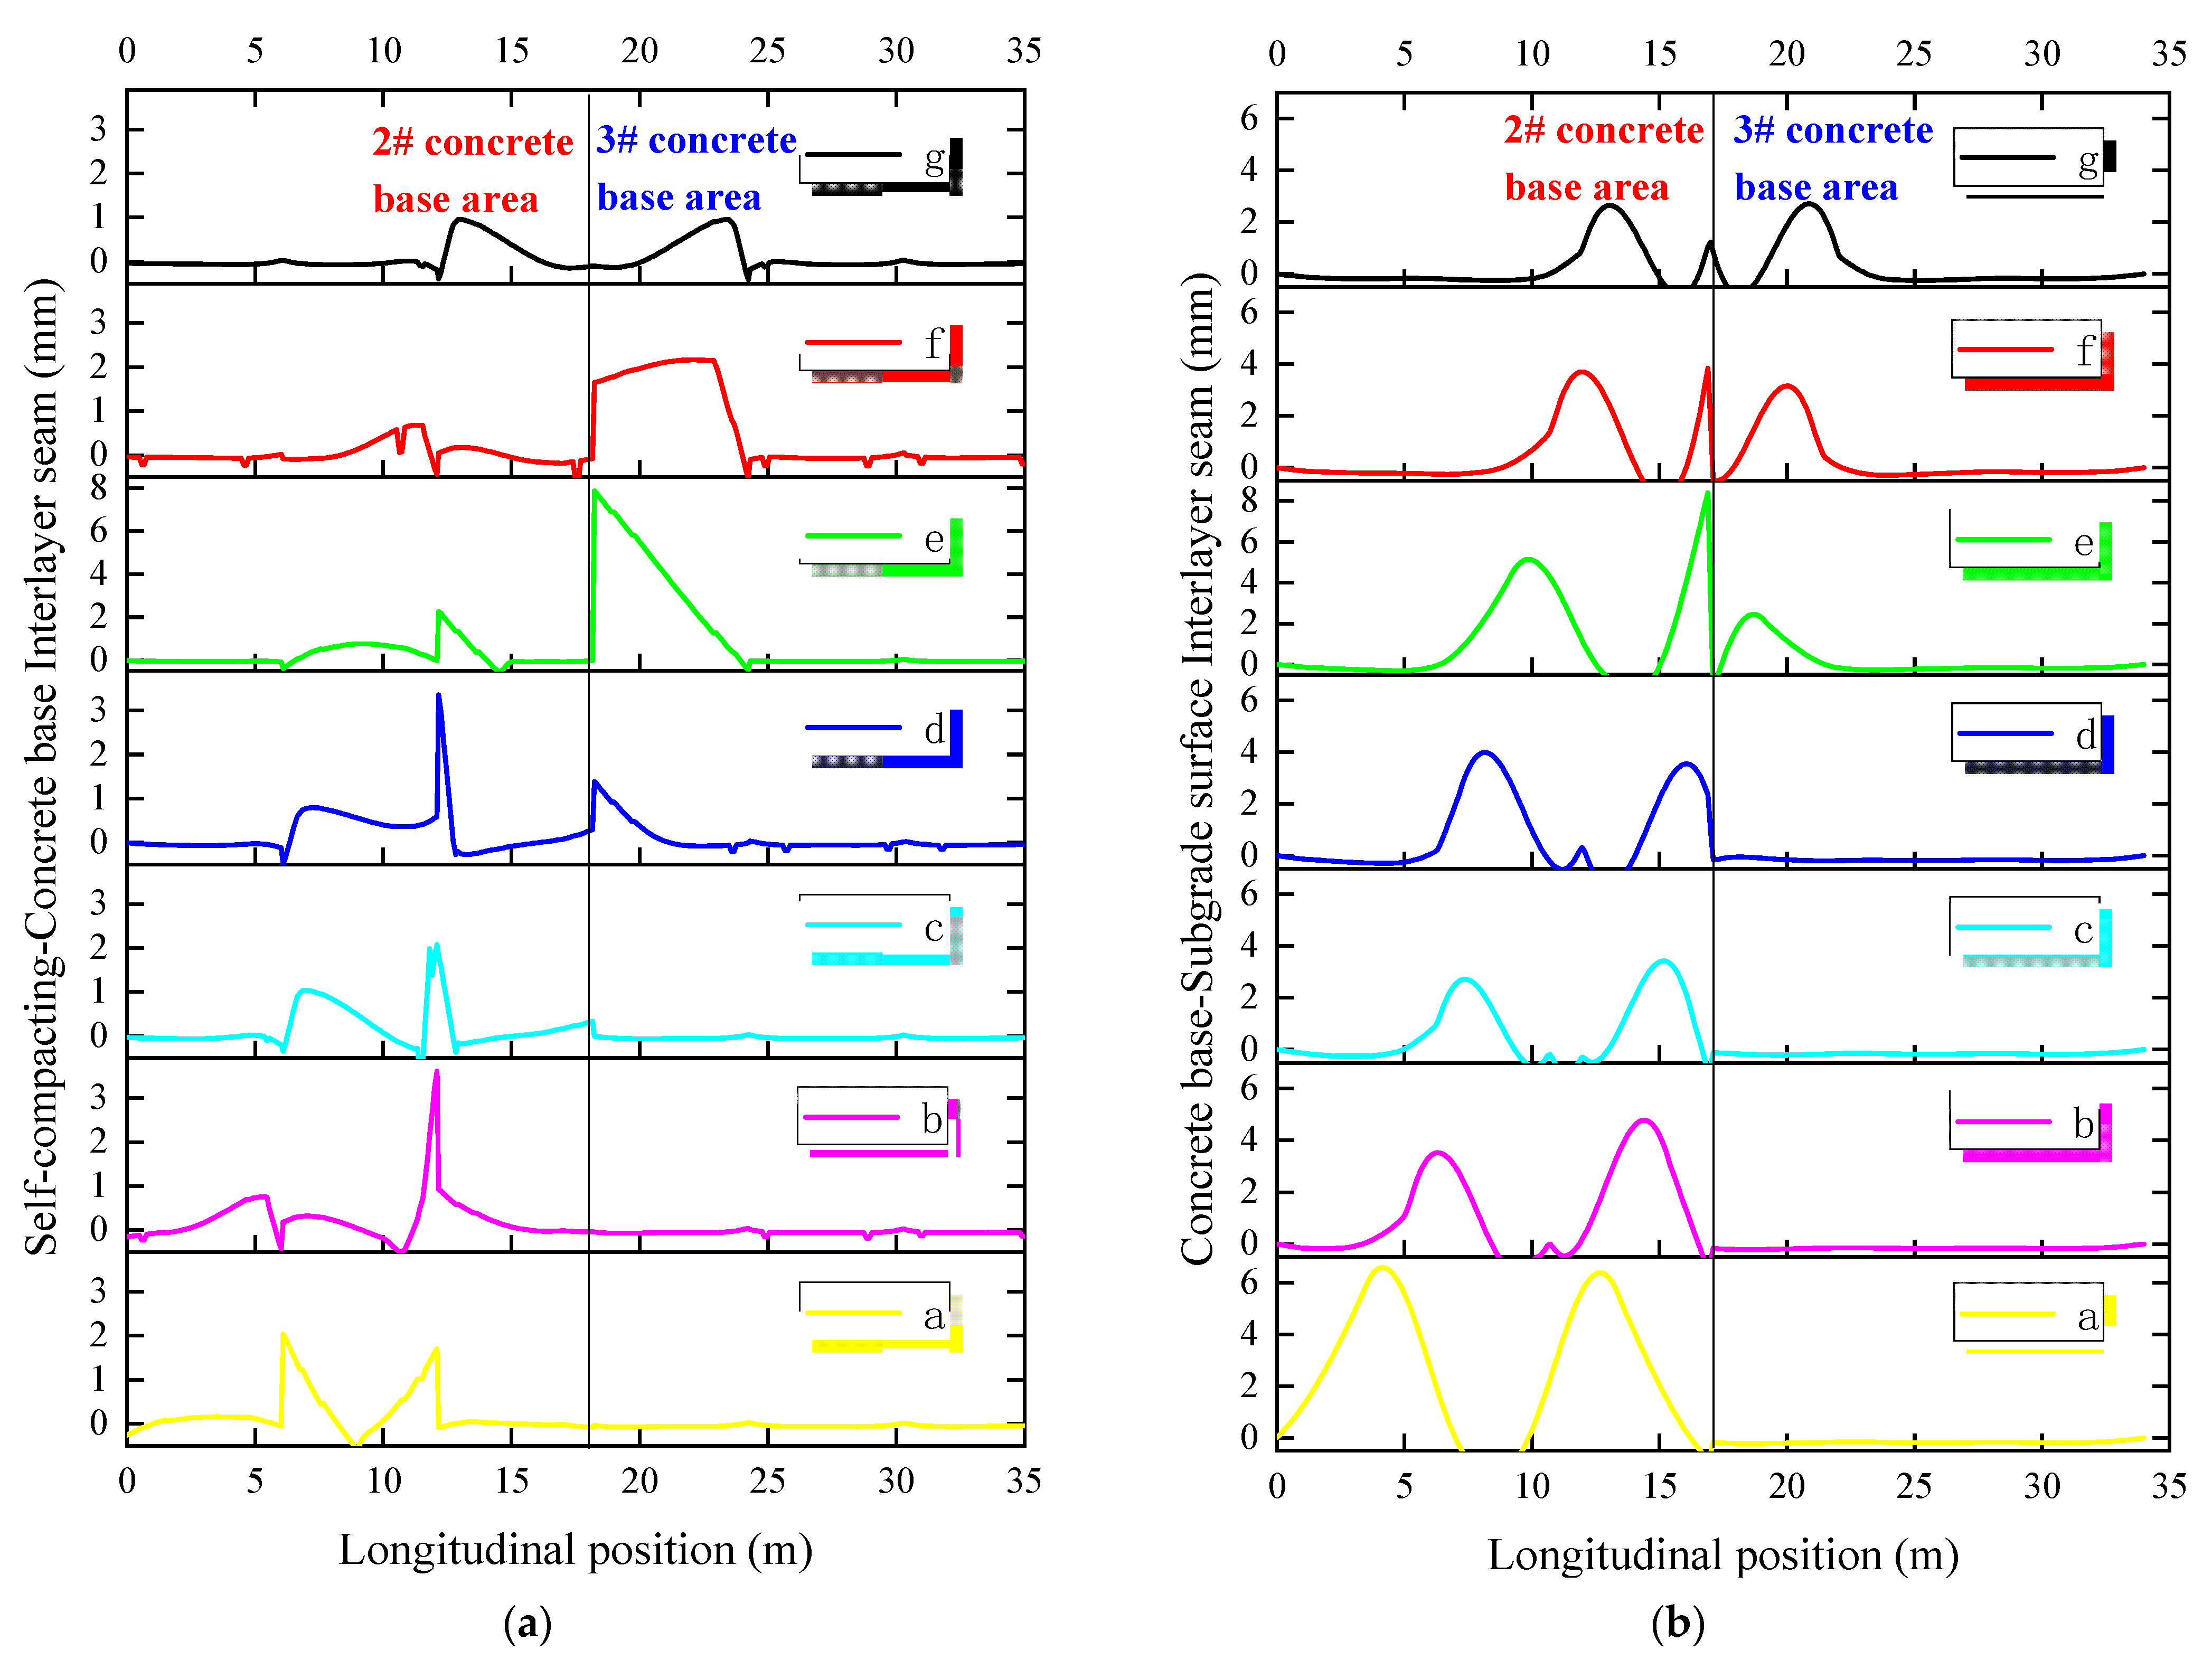
Figure 14.
Subgrade frost heaving values with damage and macroscopic cracks on the base.
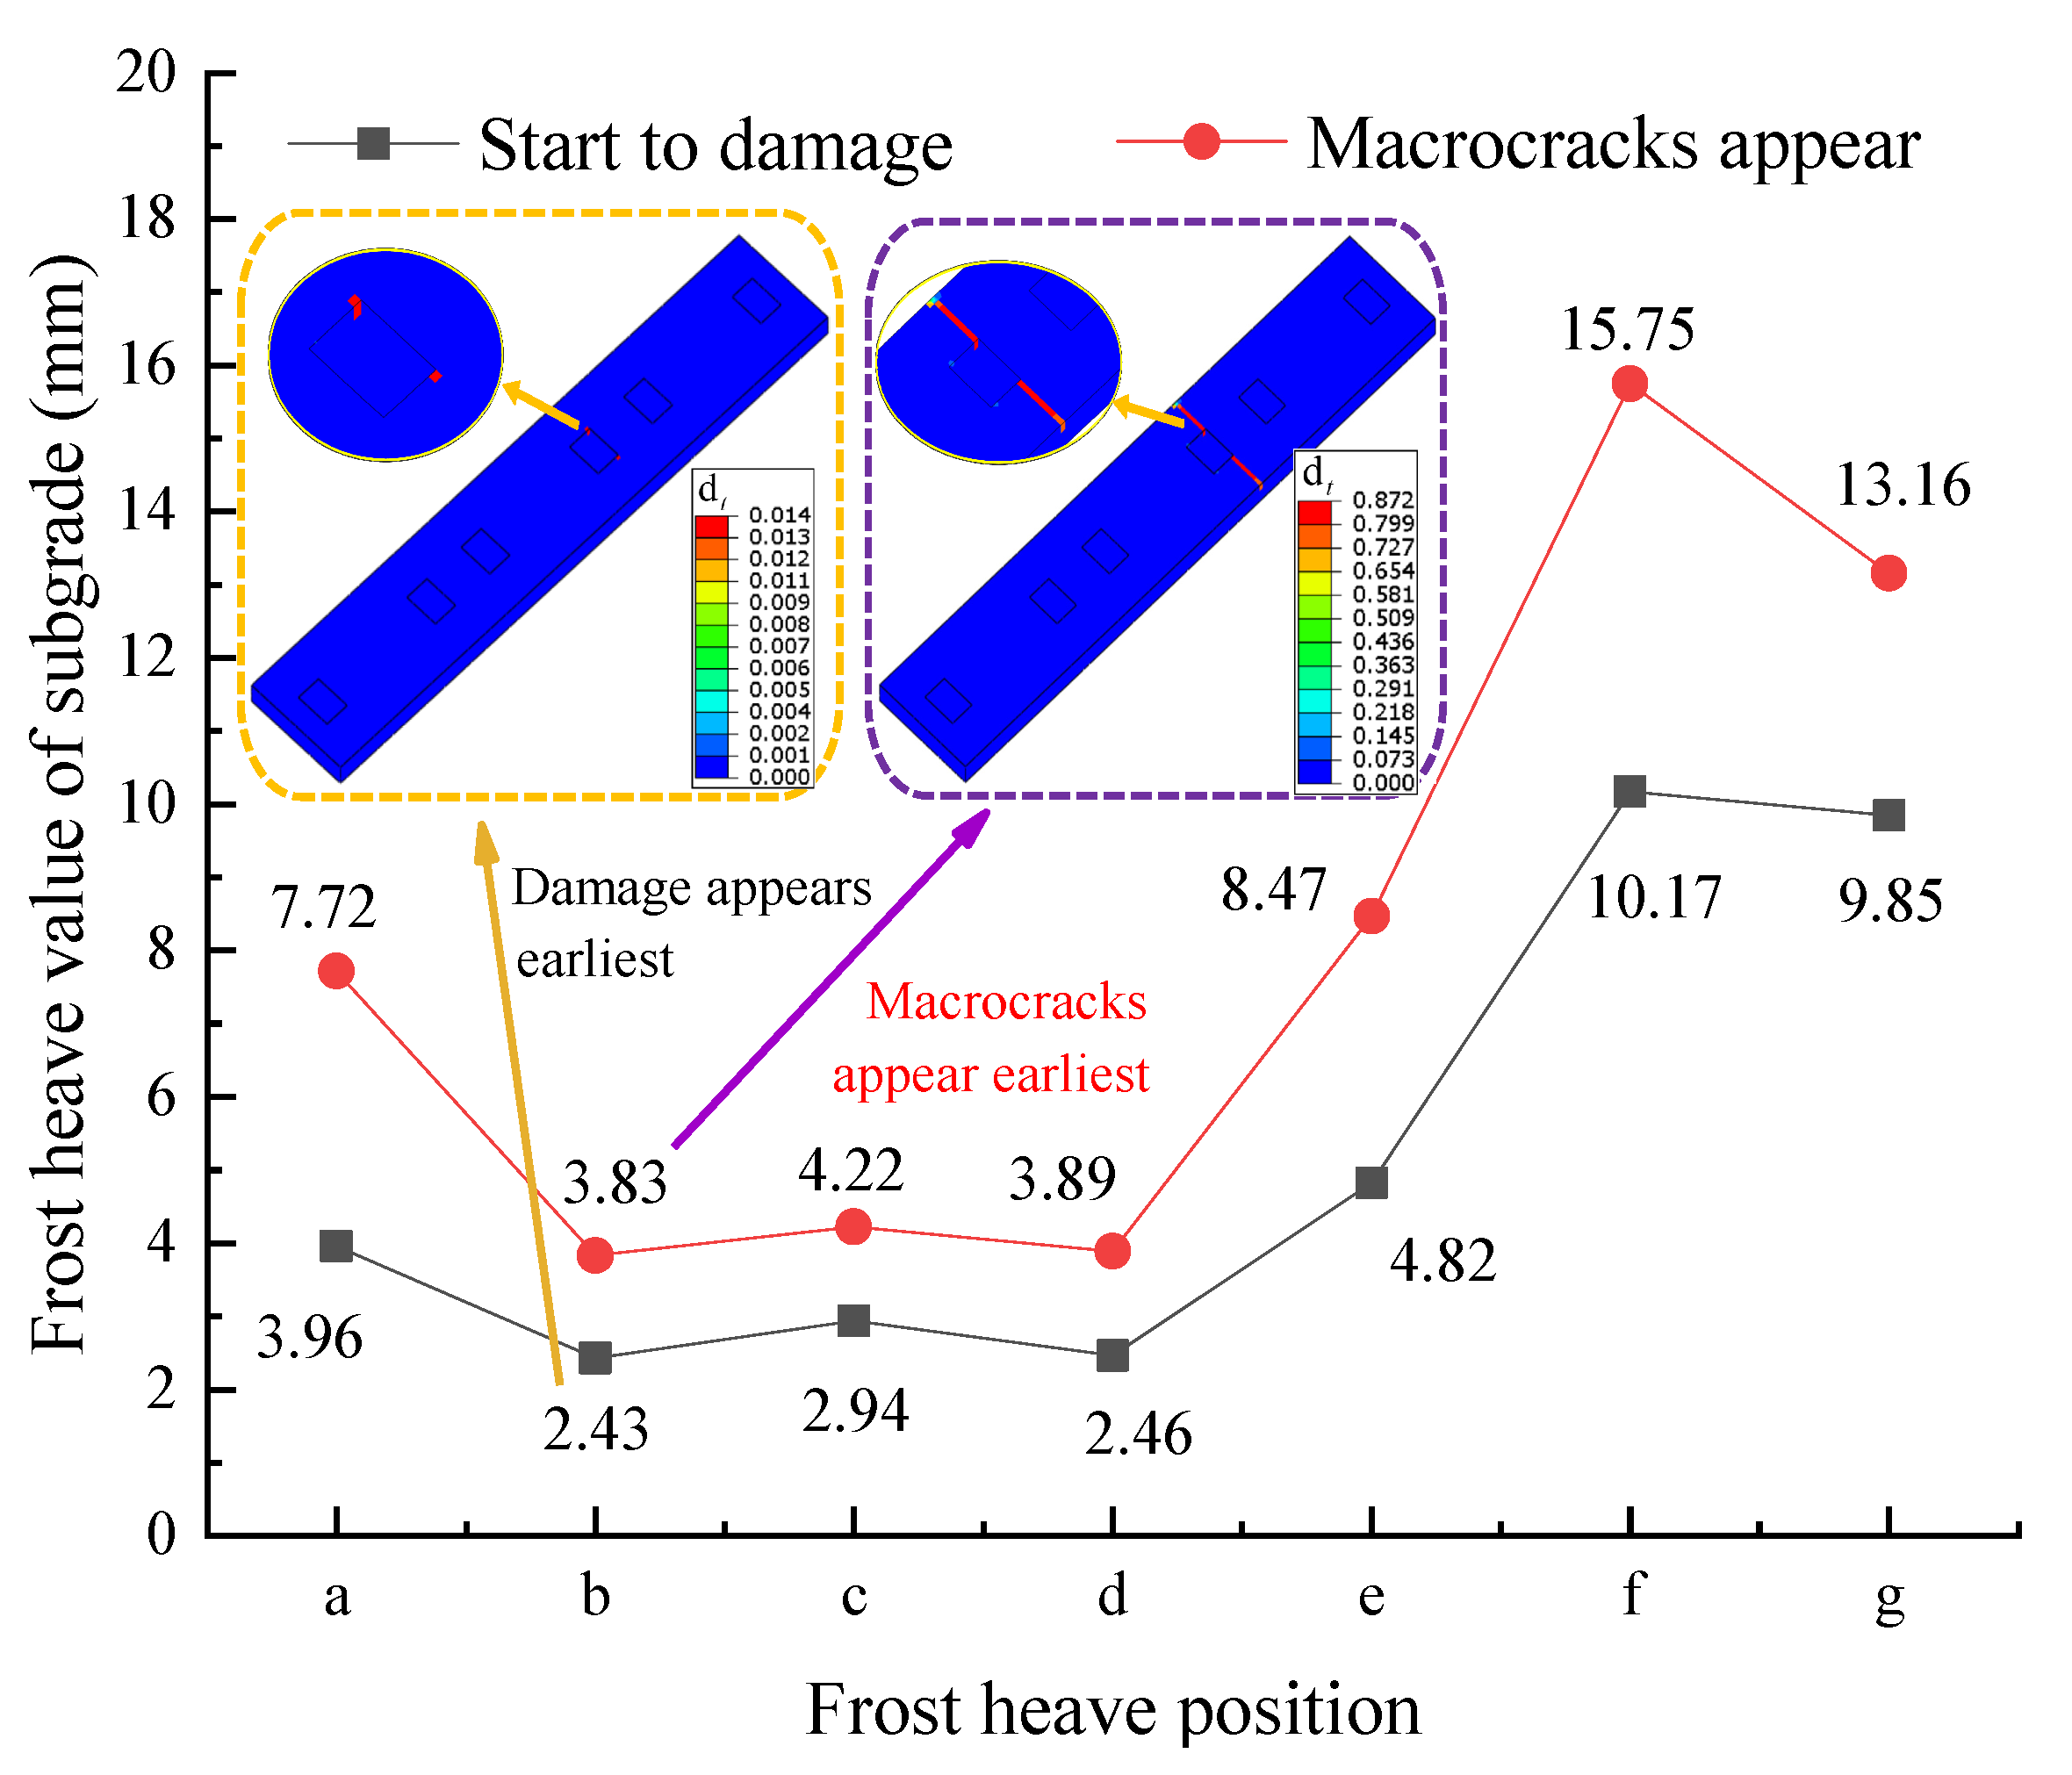
Figure 15.
Damage diagram of the track structure: (a) Slab damage; (b) concrete base damage.

Figure 16.
Average damage factor of the track structure at different frost heaving positions.
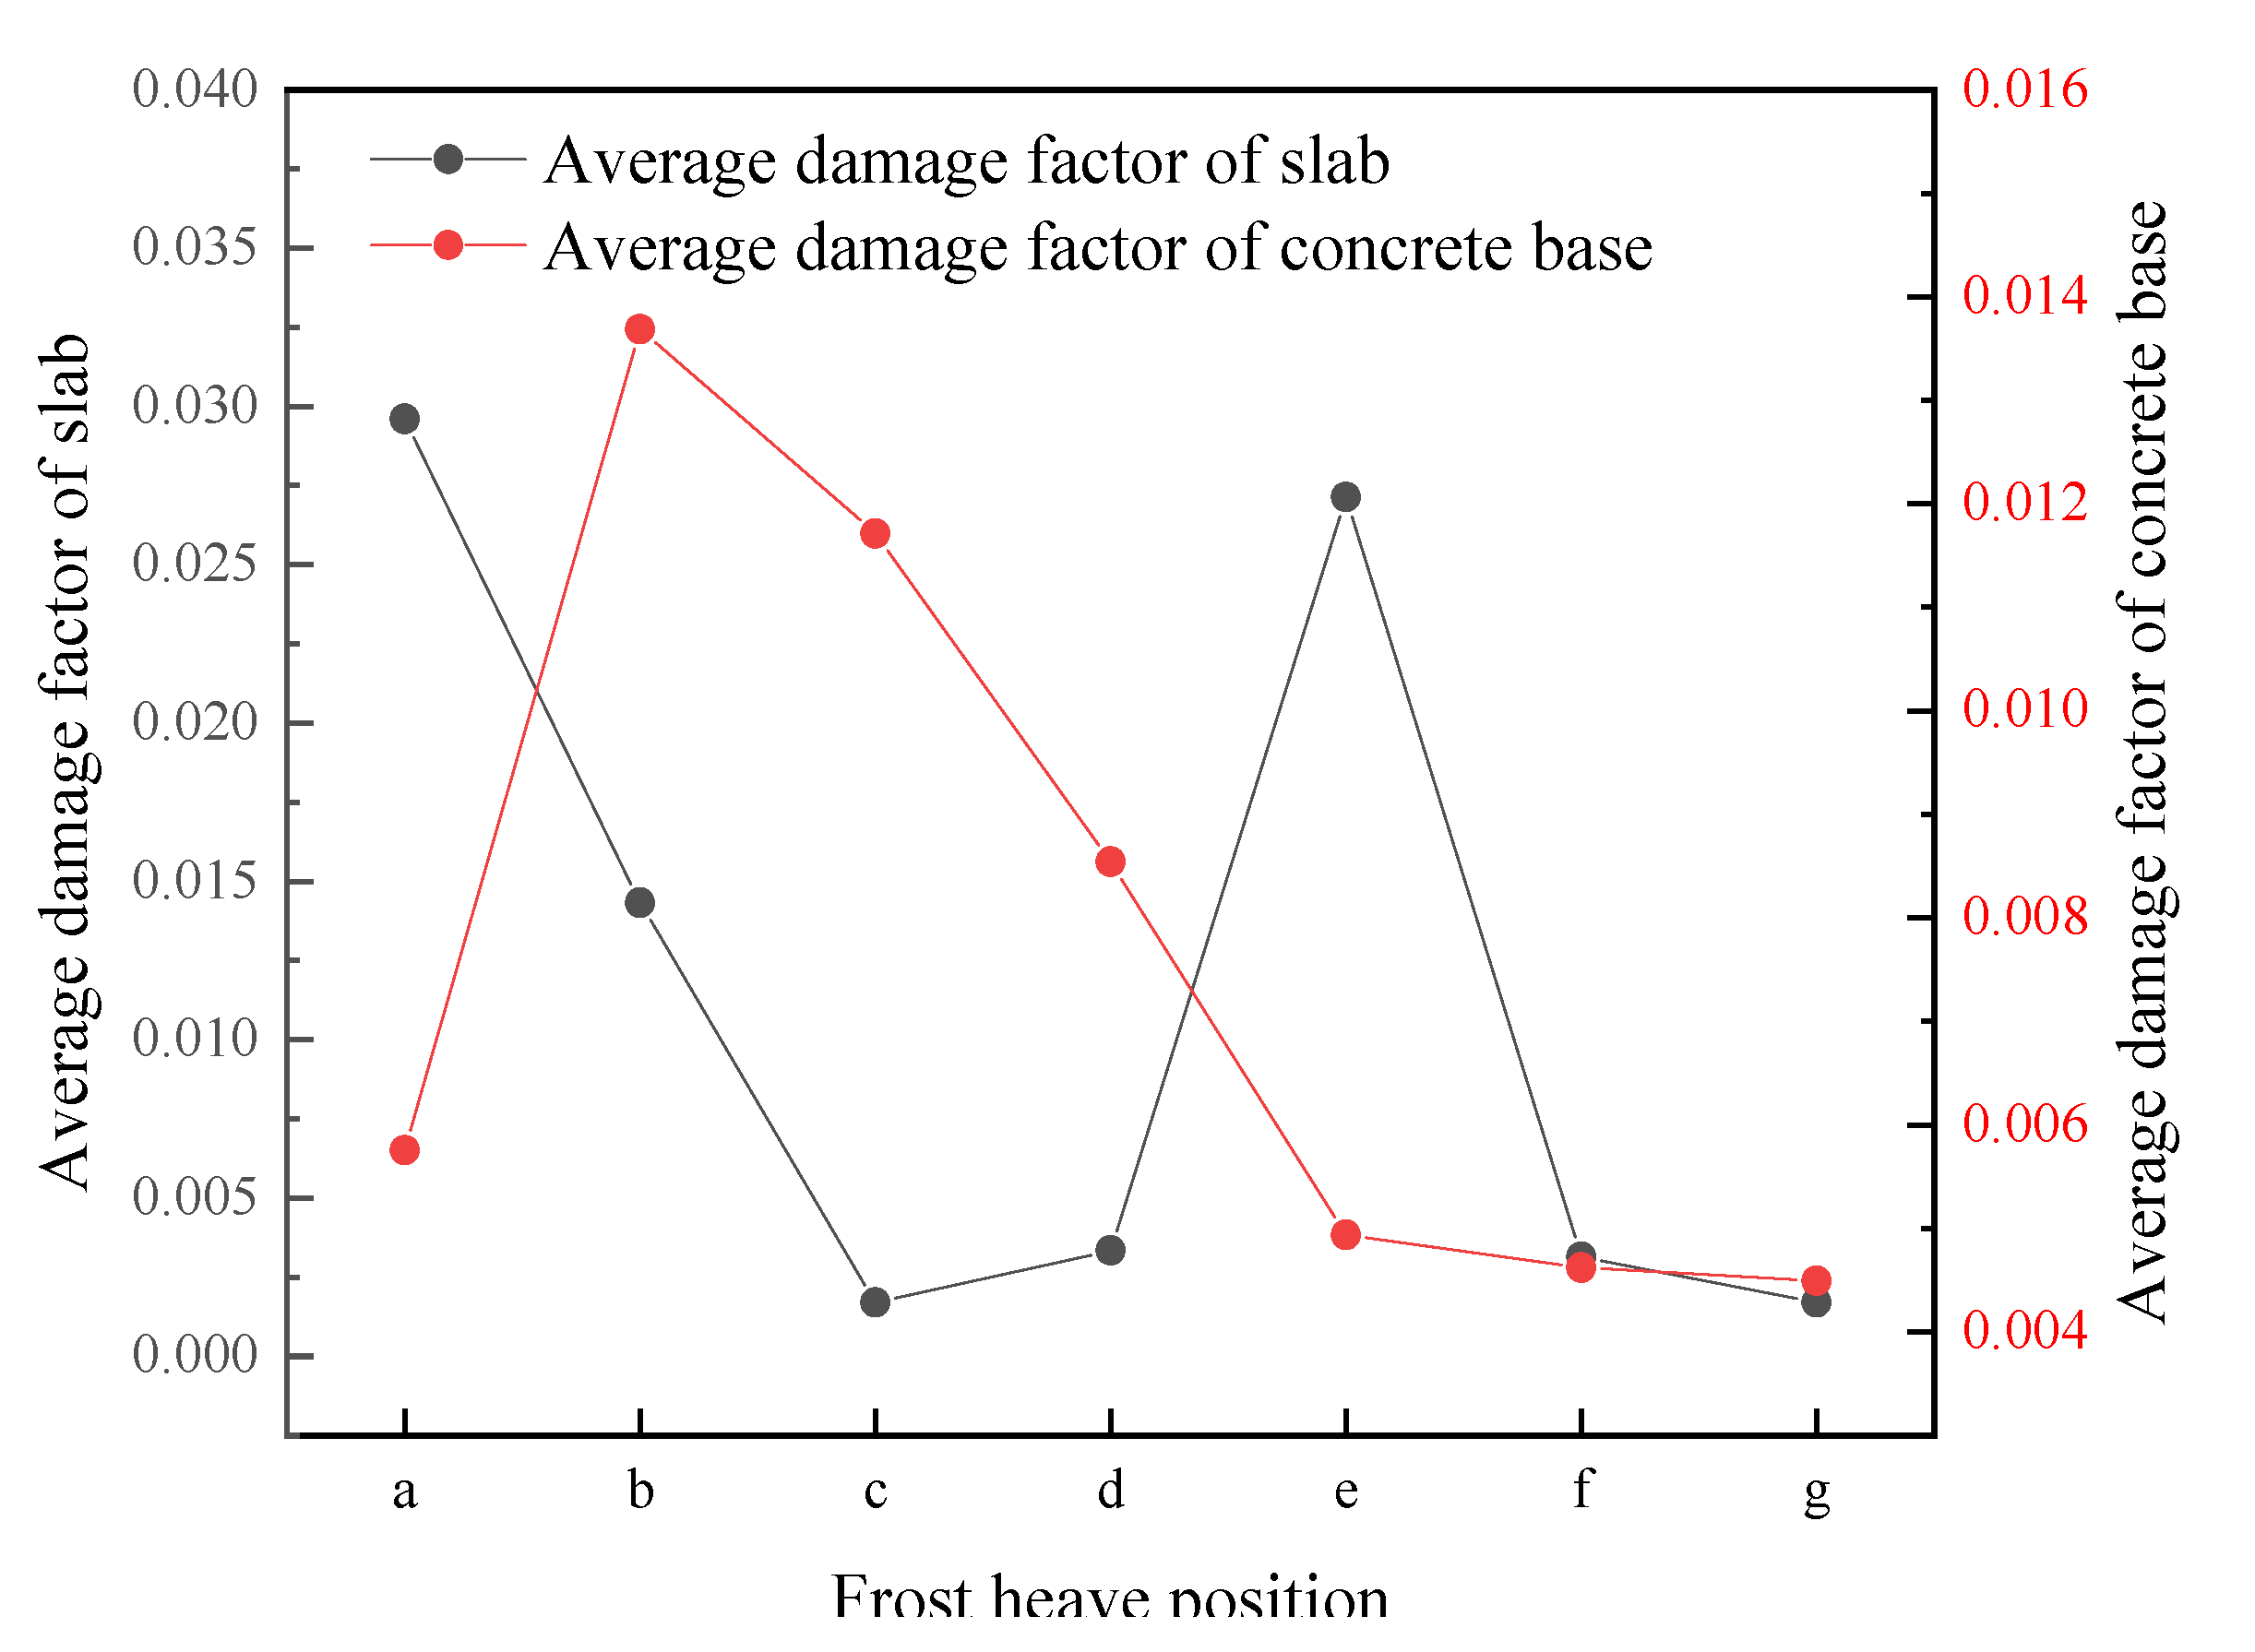
Figure 17.
Frost heaving condition.
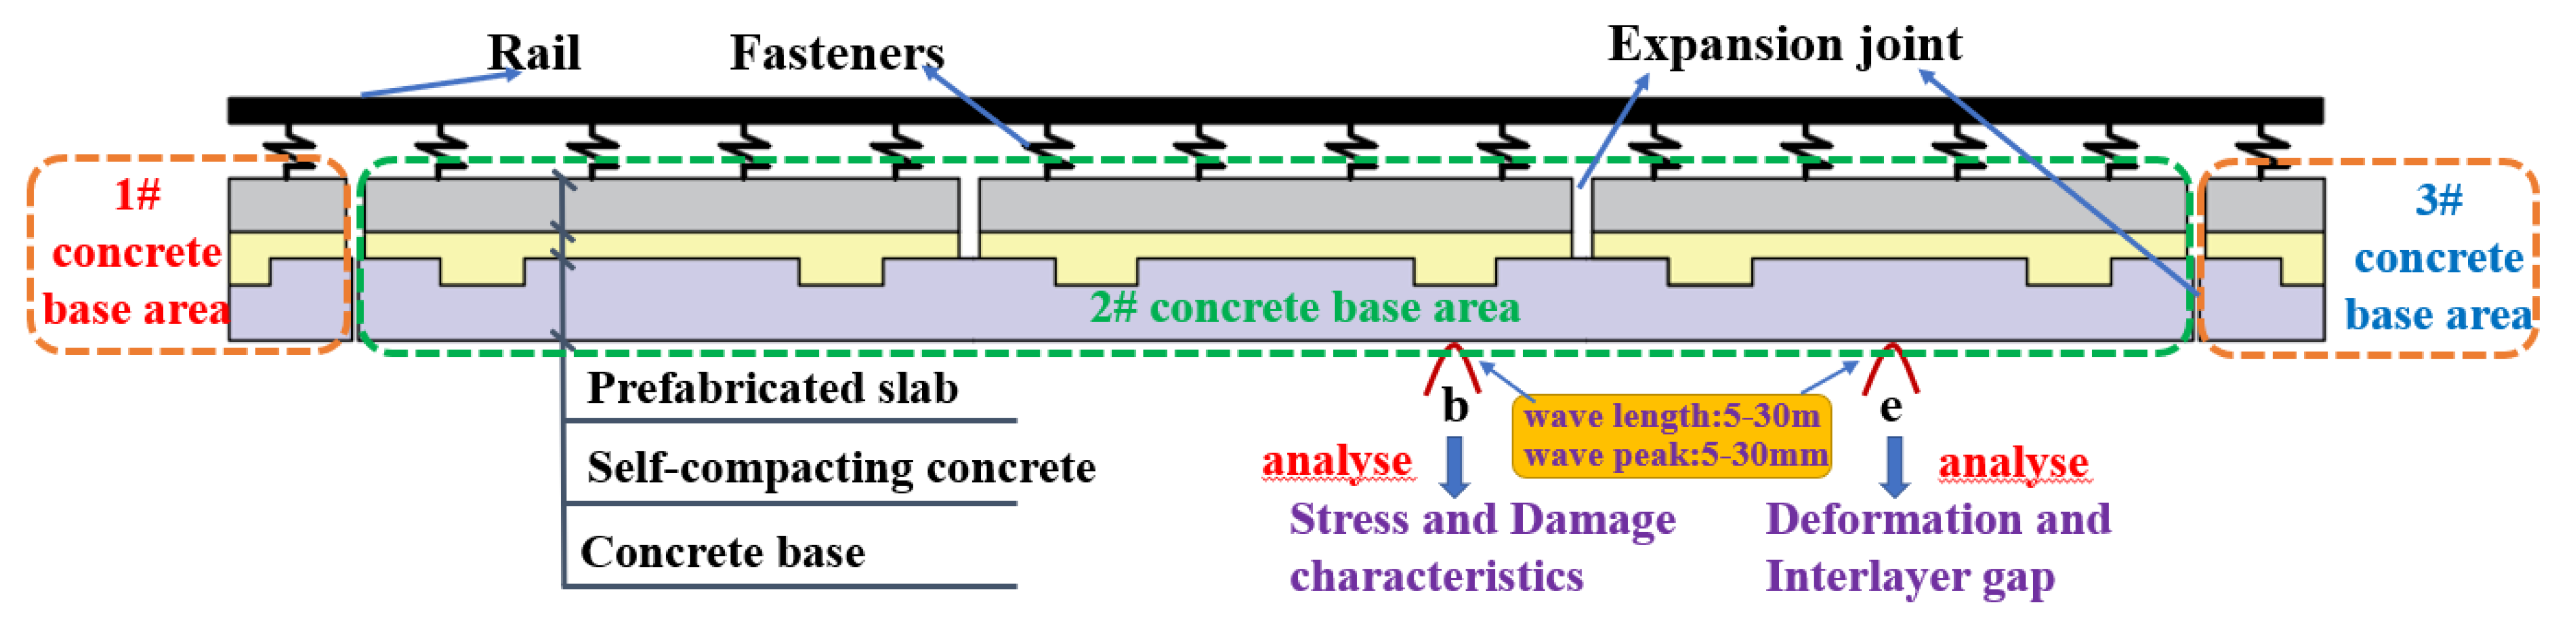
Figure 18.
Interlayer seam: (a) Self-compacting base interlayer seam; (b) base subgrade surface interlayer seam.
Figure 18.
Interlayer seam: (a) Self-compacting base interlayer seam; (b) base subgrade surface interlayer seam.
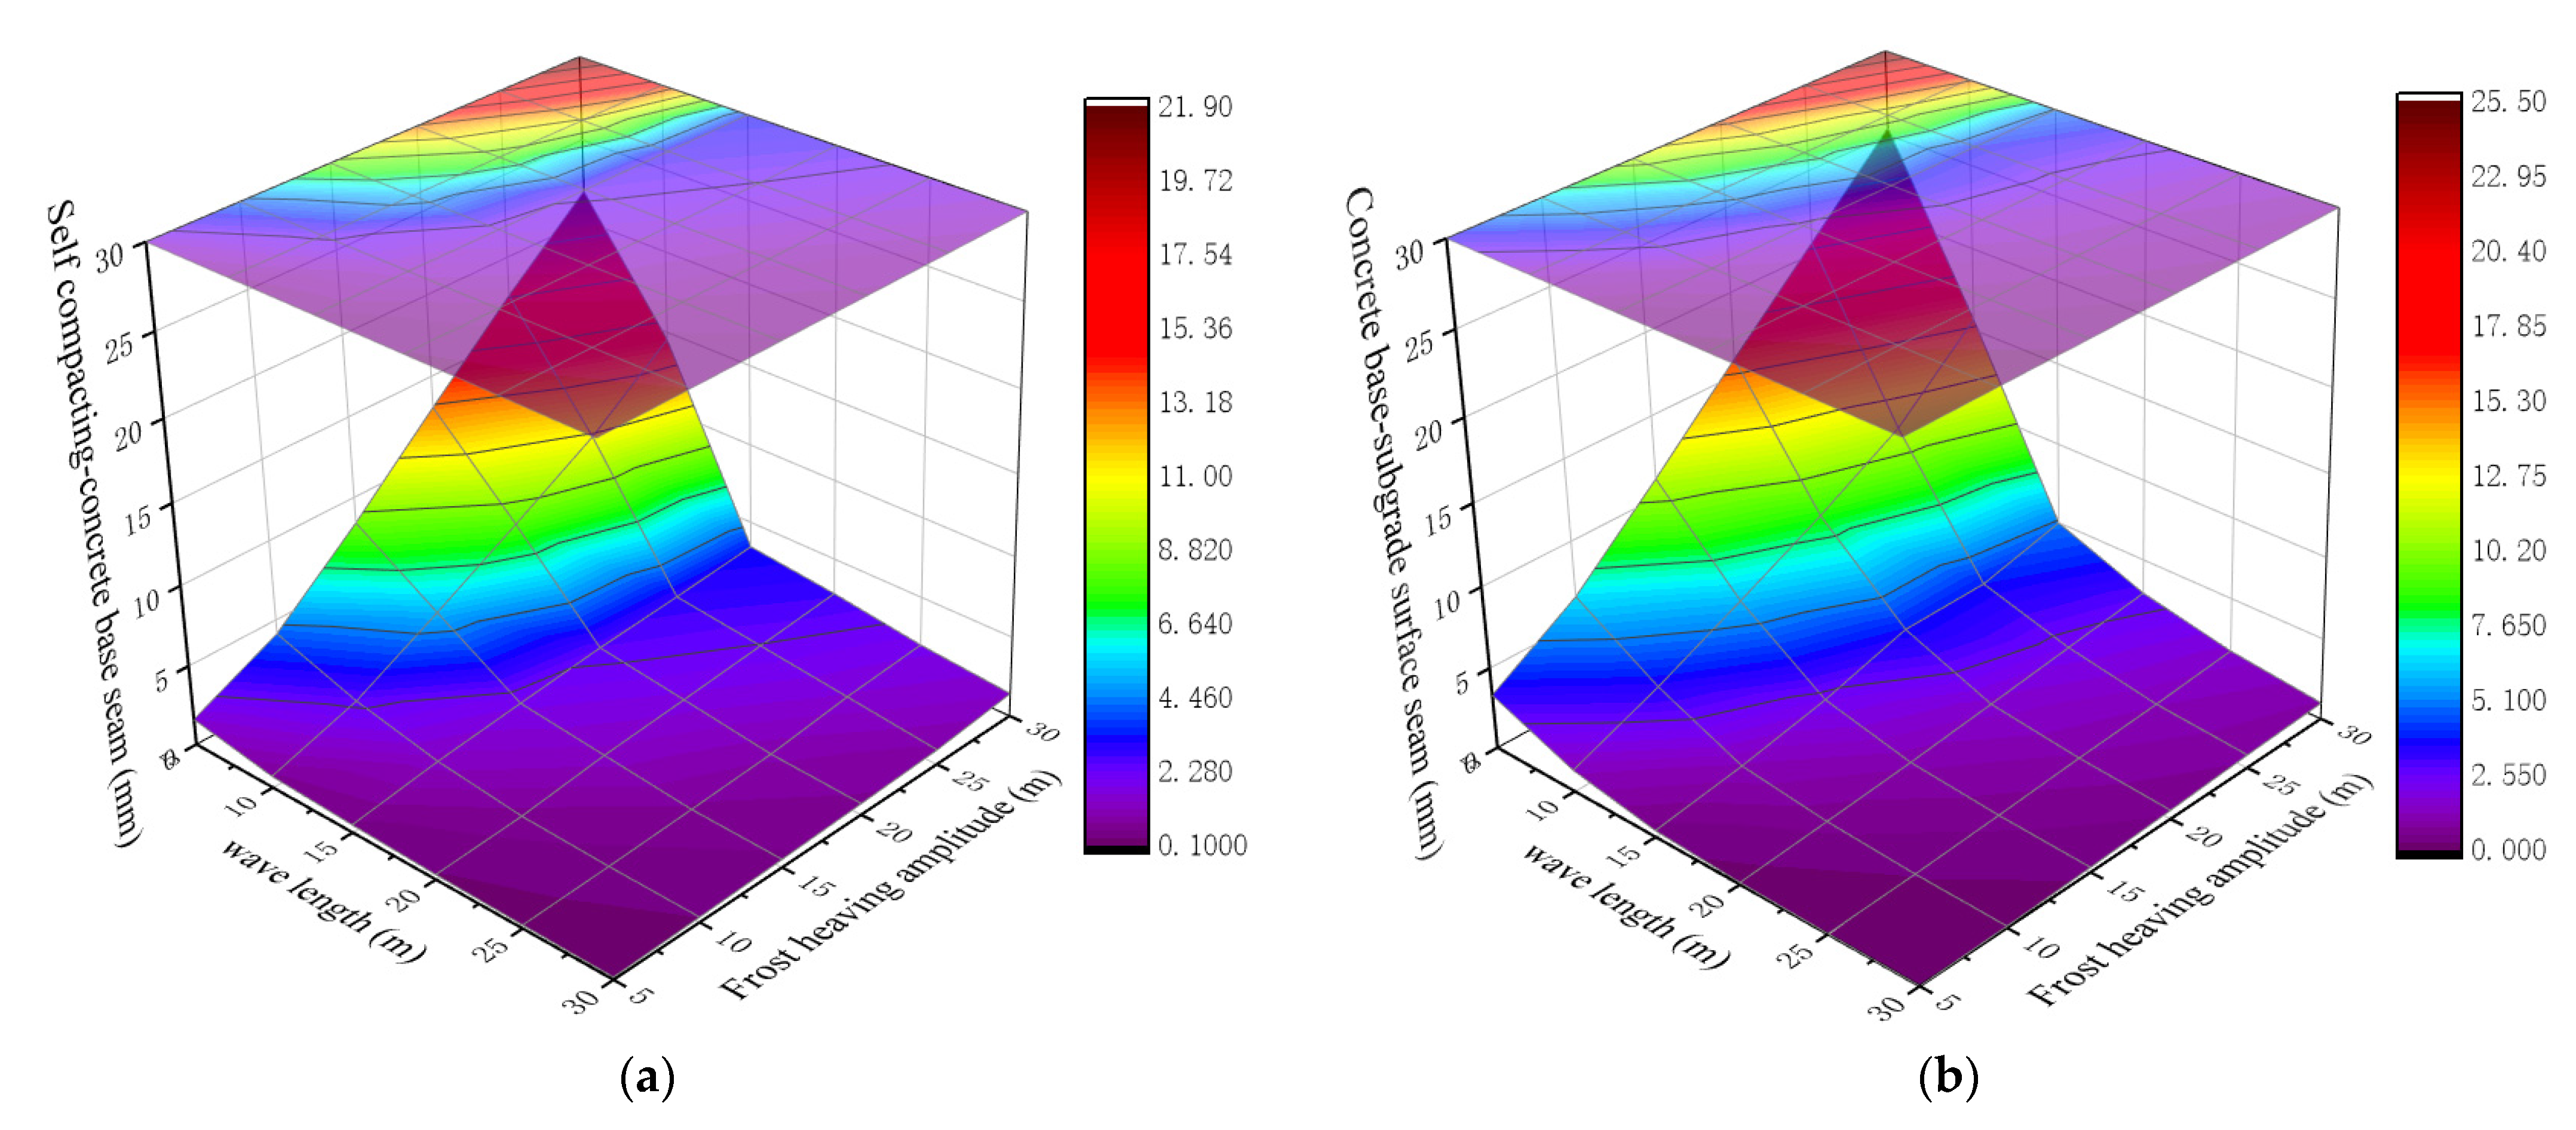
Figure 19.
Difference between the two seams.
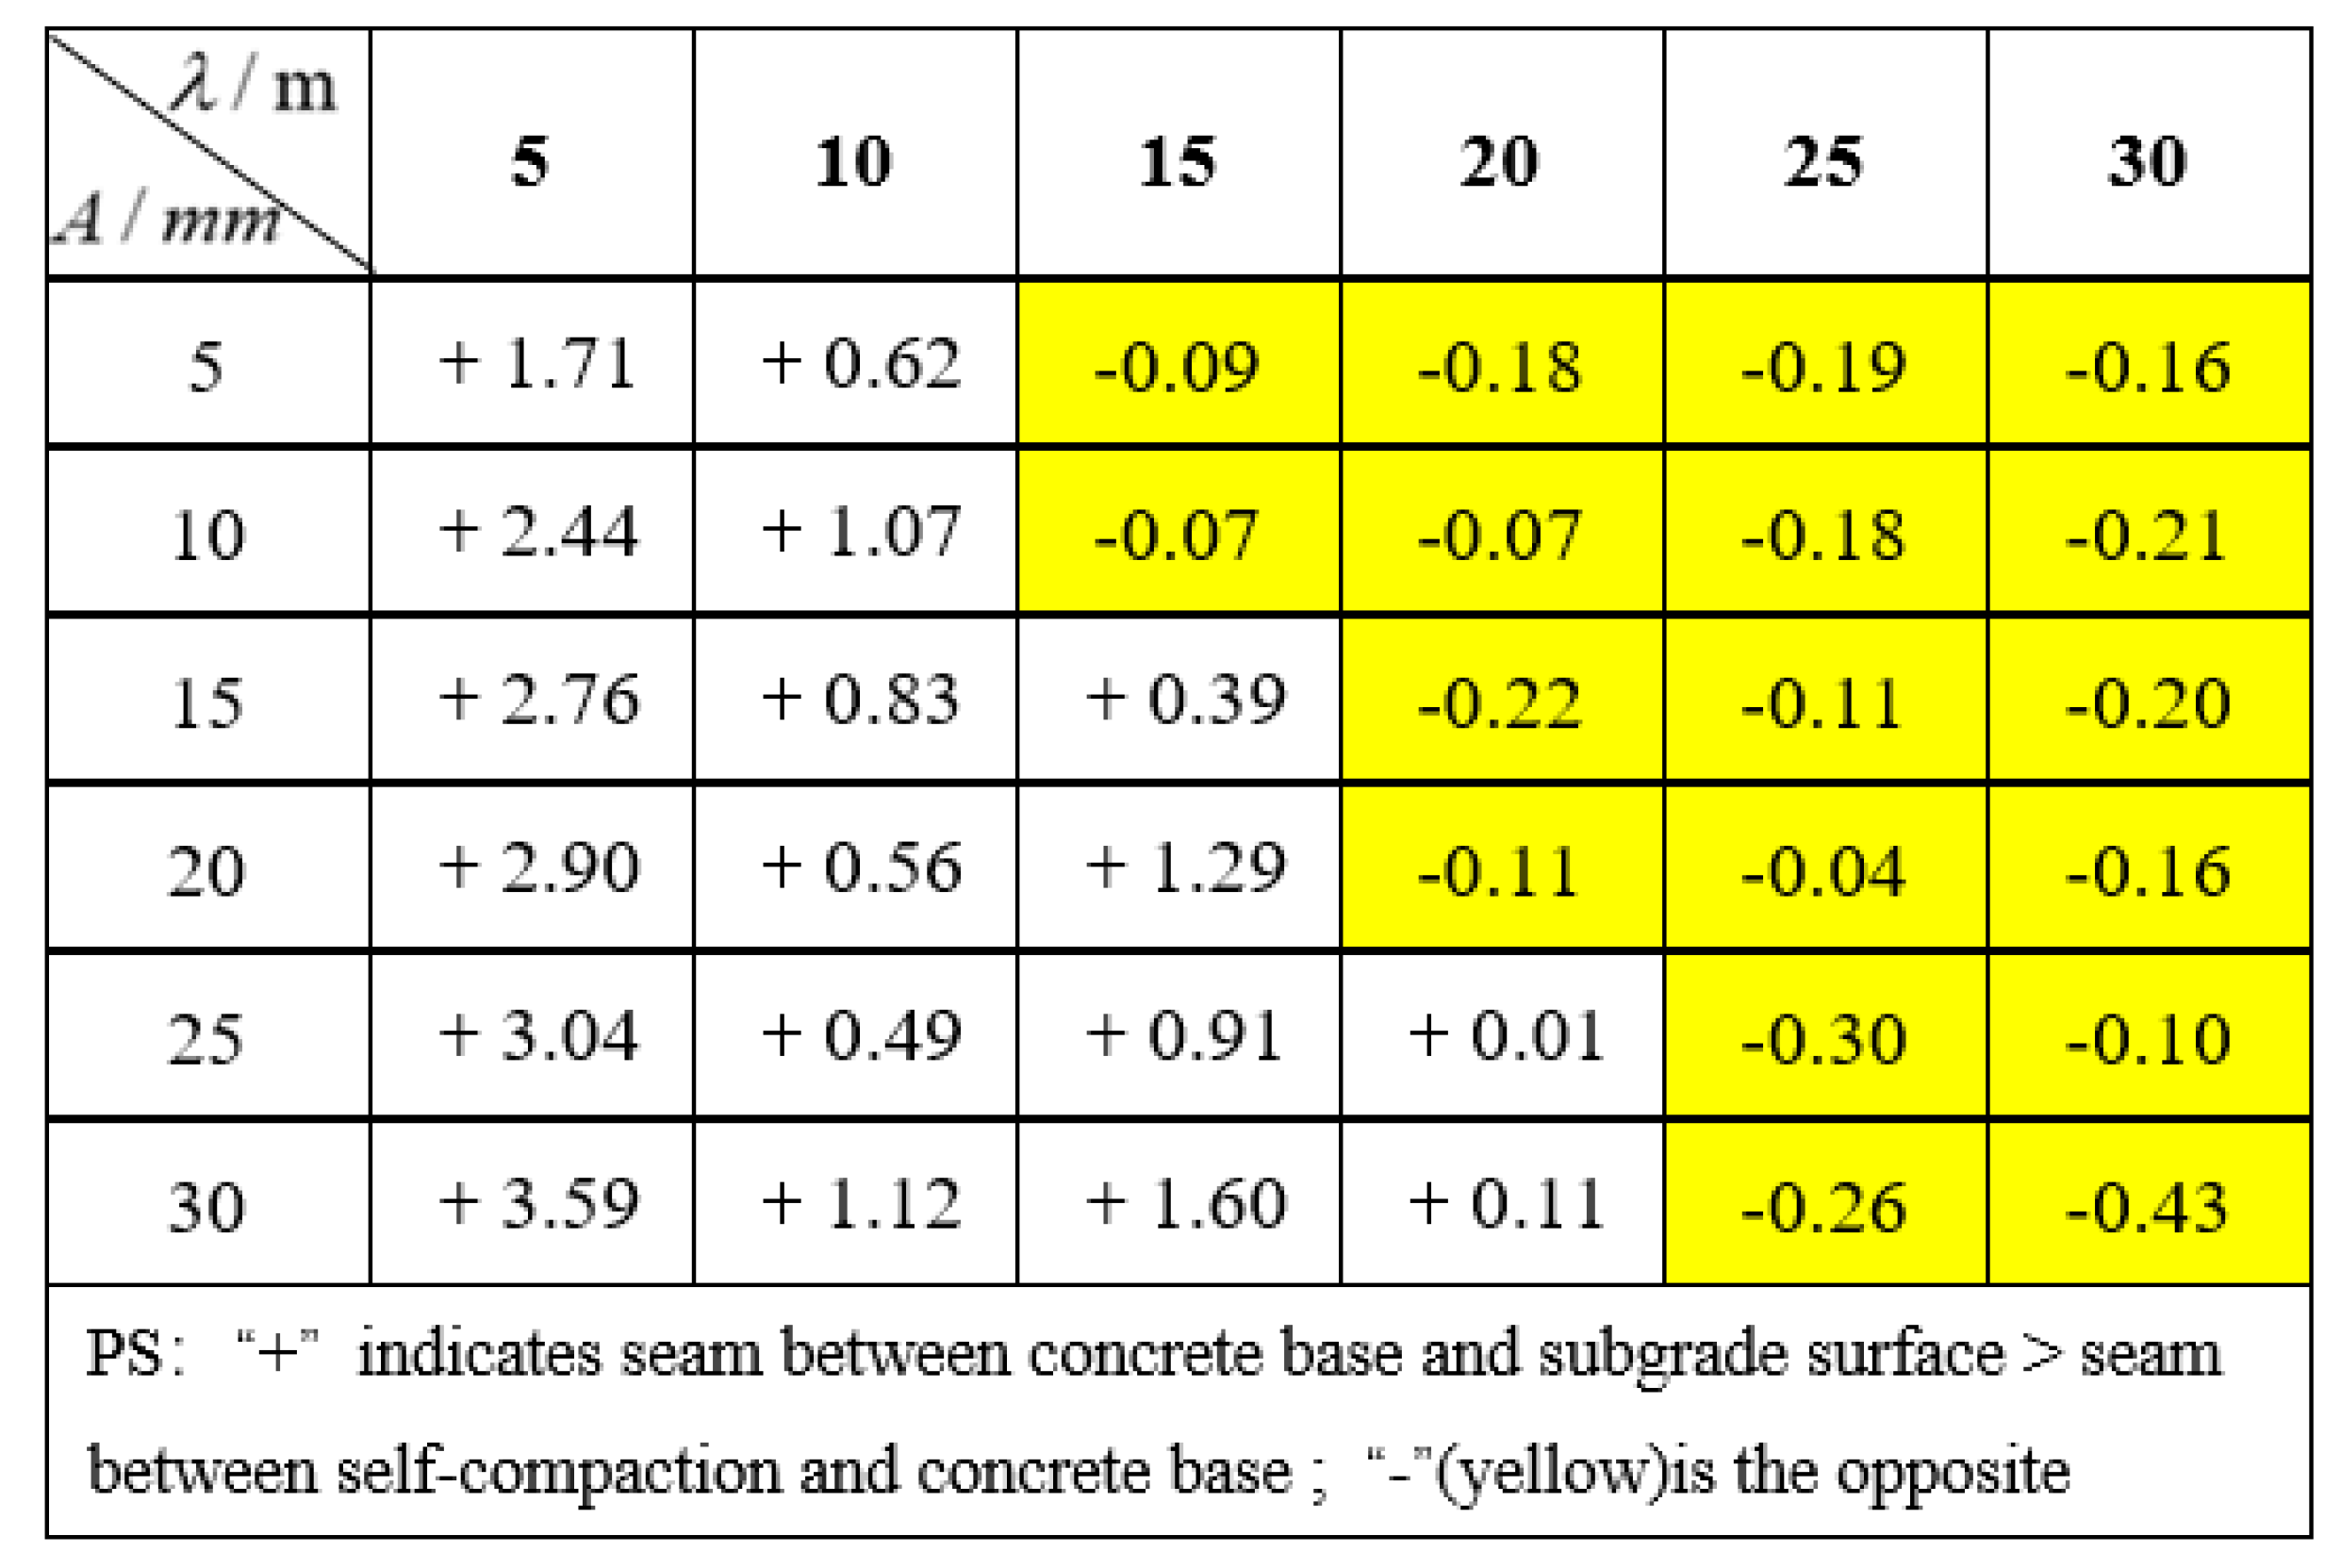
Figure 20.
Longitudinal tensile stress peak for concrete base.
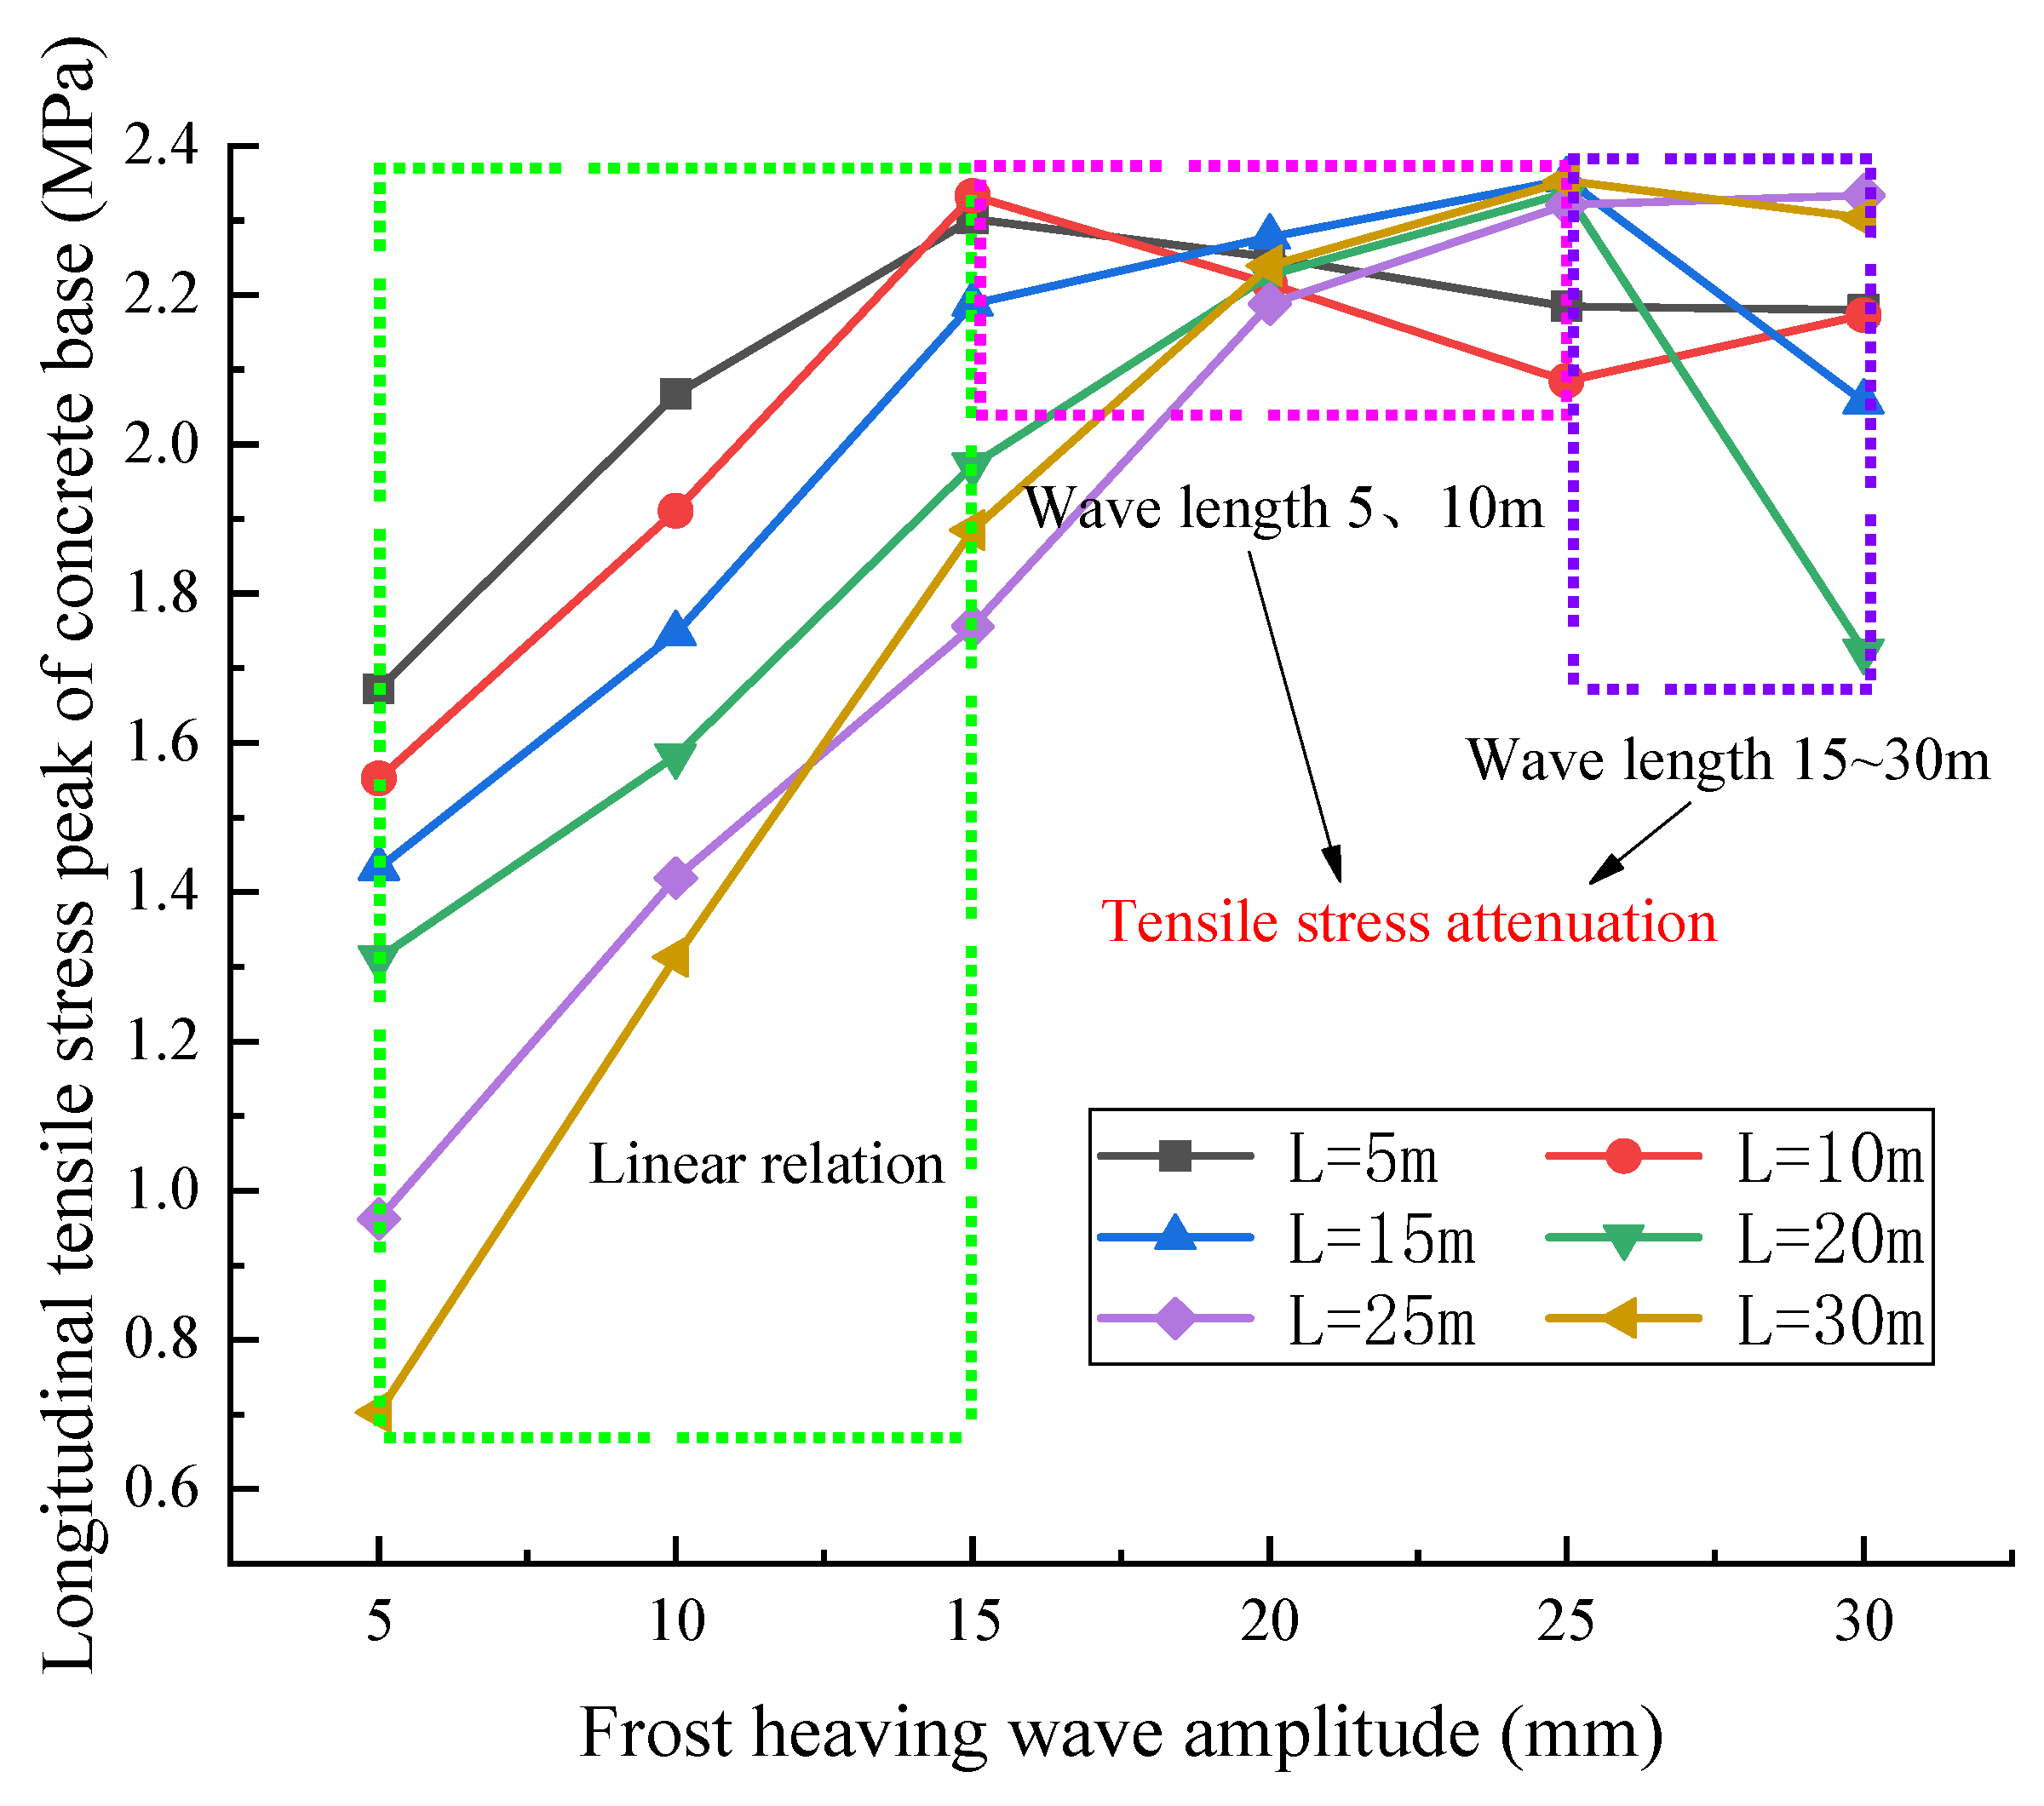
Figure 21.
Average damage factor for the concrete base.
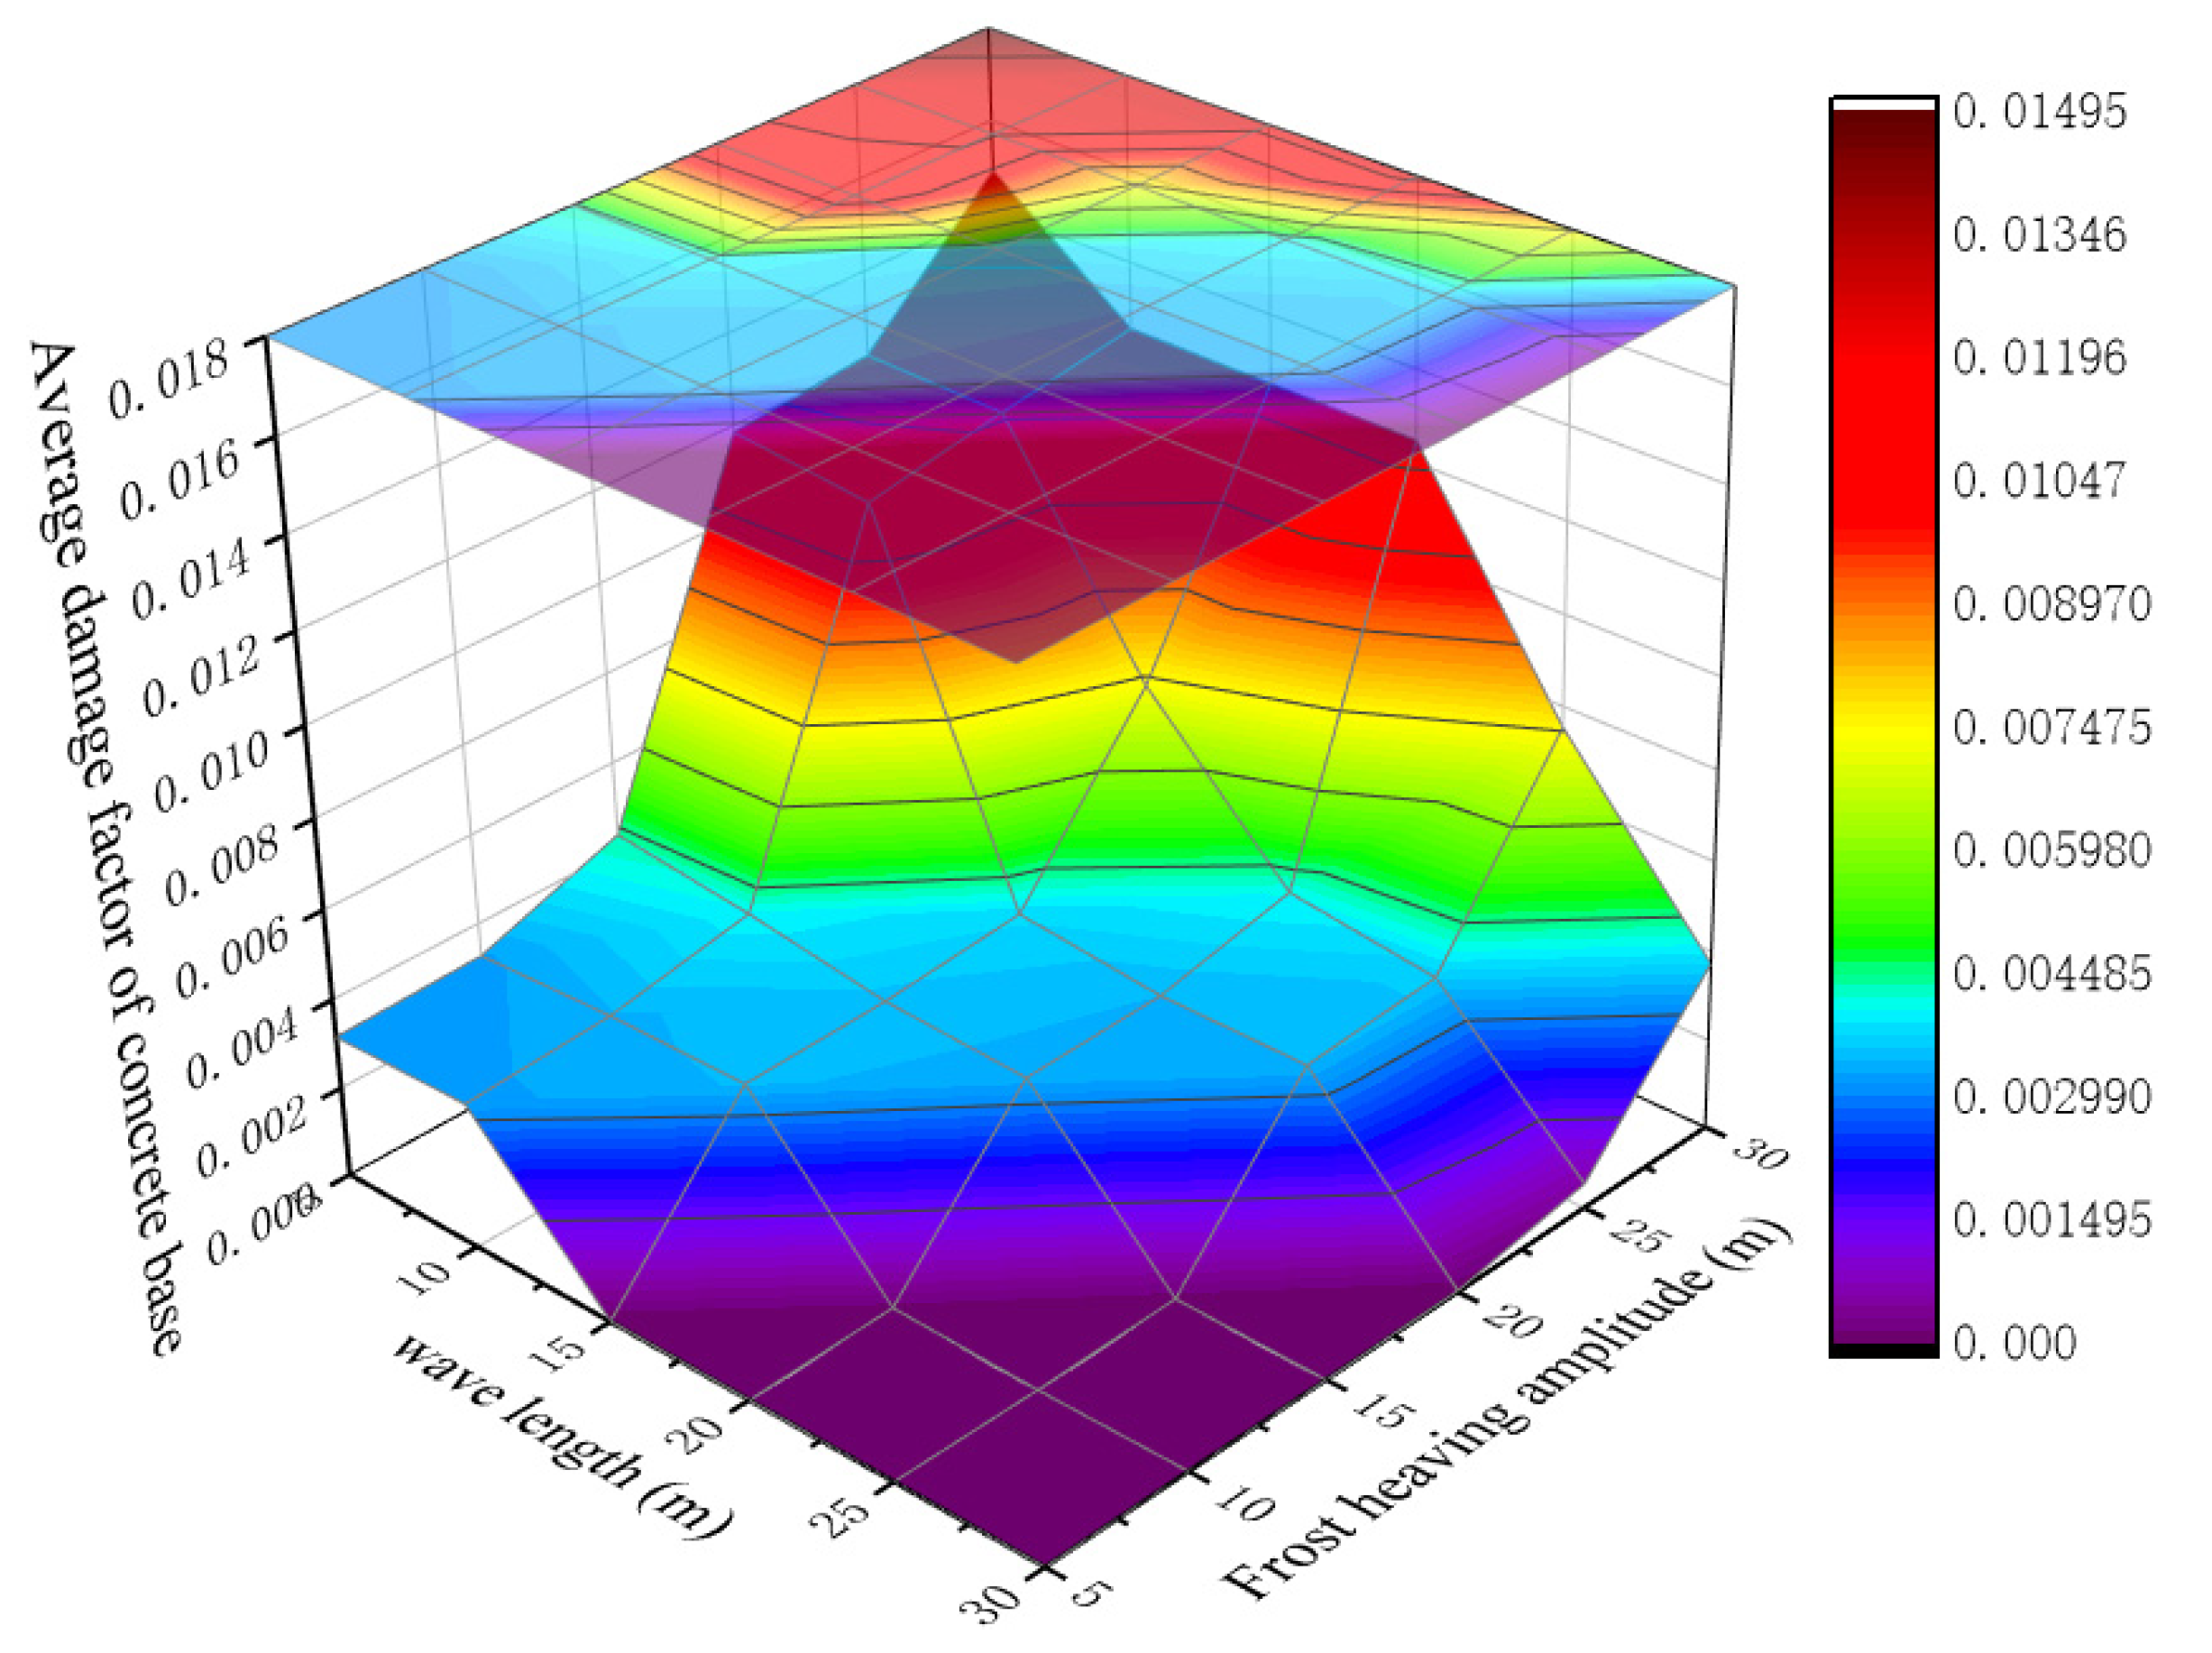
Figure 22.
Partition diagram of average damage factor of concrete base.

Figure 23.
Schematic diagram of reverse bending damage after an increase in the frost heaving wave amplitude.
Figure 23.
Schematic diagram of reverse bending damage after an increase in the frost heaving wave amplitude.

Table 1.
Simulation model parameters.
| Components | Size/m | Density (kg/m3) | Elastic Modulus (MPa) | Poisson’s Ratio | |
|---|---|---|---|---|---|
| CRTSIII slab track structure | Rail | —— | 7830 | 205,900 | 0.3 |
| Precast slab | 5.6 × 2.5 × 0.2 | 2440 | 36,000 | 0.2 | |
| Self-compacting concrete (lug boss limit) | 5.6 × 2.5 × 0.09 (0.7 × 1.0 × 0.1) | 2400 | 32,500 | 0.2 | |
| Concrete base (groove limit) | 16.99 × 3.1 × 0.3 (0.7 × 1.0 × 0.1) | 2400 | 32,500 | 0.2 | |
| Subgrade surface | 0.4 (thickness) | 2100 | 350 | 0.25 | |
| Subgrade underlying | 2.3 (thickness) | 2000 | 260 | 0.25 |
Table 2.
Peak value and position of the self-compacting base interlayer seam.
| Frost Heave Position | a | b | c | d | e | f | g |
|---|---|---|---|---|---|---|---|
| Peak position of interlayer seam | On the two edges of 2# slab | On the right edge of 2# slab | On the right edge of 2# slab and left edge of 3# slab | On the left edge of 3# slab | On the left edge of 4# slab | 2/3 length position of 4# slab | On the left edge of 3# slab; On the right edge of 4# slab |
| Peak value of interlayer seam (mm) | 2.08 | 3.67 | 2.08 | 3.36 | 7.94 | 2.26 | 1.01 |
Table 3.
Vertical displacement of the track structure.
| Vertical Displacement of Rail (mm) | |||||||
|---|---|---|---|---|---|---|---|
| λ/m | 5 | 10 | 15 | 20 | 25 | 30 | |
| A/mm | |||||||
| 5 | 3.72 | 4.22 | 4.51 | 4.62 | 4.67 | 4.70 | |
| 10 | 8.11 | 8.93 | 9.31 | 9.50 | 9.59 | 9.64 | |
| 15 | 12.77 | 13.76 | 14.12 | 14.40 | 14.52 | 14.59 | |
| 20 | 17.57 | 18.61 | 19.04 | 19.31 | 19.46 | 19.54 | |
| 25 | 22.36 | 23.48 | 24.04 | 24.22 | 24.41 | 24.50 | |
| 30 | 27.26 | 27.56 | 28.94 | 29.15 | 29.36 | 29.48 | |
| Vertical Displacement of Composite slab (mm) | |||||||
| λ/m | 5 | 10 | 15 | 20 | 25 | 30 | |
| A/mm | |||||||
| 5 | 3.77 | 4.29 | 4.57 | 4.68 | 4.72 | 4.75 | |
| 10 | 8.36 | 9.02 | 9.36 | 9.57 | 9.65 | 9.70 | |
| 15 | 13.03 | 13.95 | 14.19 | 14.46 | 14.59 | 14.65 | |
| 20 | 17.78 | 18.87 | 19.07 | 19.37 | 19.53 | 19.60 | |
| 25 | 22.55 | 23.72 | 24.28 | 24.29 | 24.46 | 24.56 | |
| 30 | 27.46 | 28.51 | 29.22 | 29.21 | 29.41 | 29.53 | |
| Vertical Displacement of Concrete Base (mm) | |||||||
| λ/m | 5 | 10 | 15 | 20 | 25 | 30 | |
| A/mm | |||||||
| 5 | 3.93 | 4.45 | 4.68 | 4.75 | 4.78 | 4.80 | |
| 10 | 8.67 | 9.26 | 9.49 | 9.69 | 9.74 | 9.77 | |
| 15 | 13.39 | 14.10 | 14.35 | 14.57 | 14.71 | 14.75 | |
| 20 | 18.17 | 18.98 | 19.24 | 19.49 | 19.66 | 19.72 | |
| 25 | 22.98 | 23.83 | 24.50 | 24.42 | 24.58 | 24.70 | |
| 30 | 27.87 | 28.67 | 29.48 | 29.35 | 29.53 | 29.63 | |
Disclaimer/Publisher’s Note: The statements, opinions and data contained in all publications are solely those of the individual author(s) and contributor(s) and not of MDPI and/or the editor(s). MDPI and/or the editor(s) disclaim responsibility for any injury to people or property resulting from any ideas, methods, instructions or products referred to in the content. |
© 2023 by the authors. Licensee MDPI, Basel, Switzerland. This article is an open access article distributed under the terms and conditions of the Creative Commons Attribution (CC BY) license (https://creativecommons.org/licenses/by/4.0/).
Share and Cite
MDPI and ACS Style
Wang, H.; Xiao, H.; Cui, X.; Yang, S.; Nadakatti, M.M.; Guo, Q. Influence of Uneven Subgrade Frost Heave on Deformation and Damage of CRTSIII Slab Track. Appl. Sci. 2023, 13, 5345. https://doi.org/10.3390/app13095345
AMA Style
Wang H, Xiao H, Cui X, Yang S, Nadakatti MM, Guo Q. Influence of Uneven Subgrade Frost Heave on Deformation and Damage of CRTSIII Slab Track. Applied Sciences. 2023; 13(9):5345. https://doi.org/10.3390/app13095345
Chicago/Turabian StyleWang, Hongge, Hong Xiao, Xuhao Cui, Shusheng Yang, Mahantesh M. Nadakatti, and Qiang Guo. 2023. "Influence of Uneven Subgrade Frost Heave on Deformation and Damage of CRTSIII Slab Track" Applied Sciences 13, no. 9: 5345. https://doi.org/10.3390/app13095345
Note that from the first issue of 2016, this journal uses article numbers instead of page numbers. See further details here.