

Characterisation of Physiological Responses to Odours in Autism Spectrum Disorders: A Preliminary Study

 , , , ,
  and
and
Abstract
:1. Introduction
2. Dataset
2.1. Sample Characterisation
2.2. Odour Stimuli
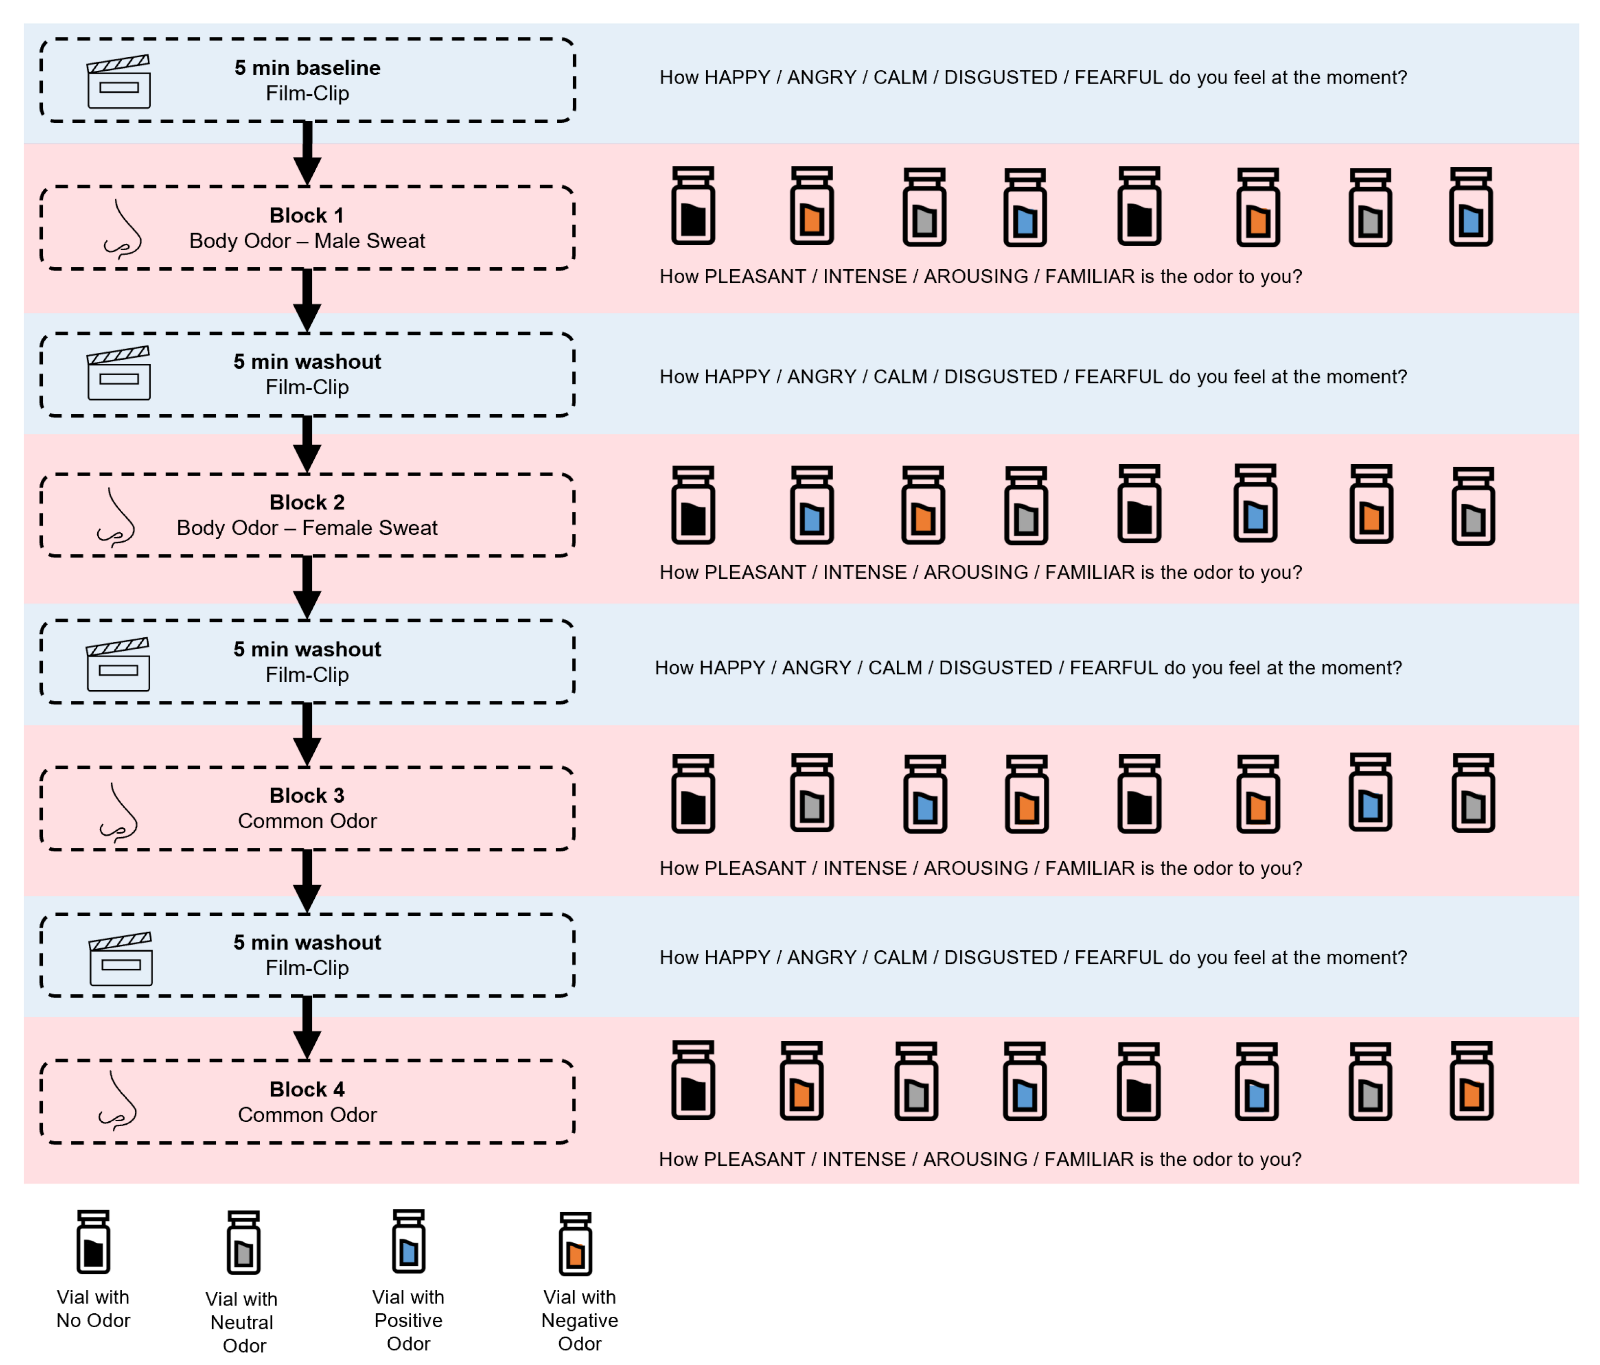
2.3. Procedures
2.4. Signal Recording
3. Methodology
3.1. Pre-Processing
3.2. Processing
3.2.1. Feature Extraction and Normalisation
3.2.2. Triggers Application
3.2.3. Sliding Windows
3.2.4. Data Analysis
3.2.5. Physiological Based ASD Prediction
- Precision = is the proportion of instances predicted as Positive (ASD) that were correct; the optimal value for precision is 1 [54].
- Recall = is the proportion of instances labelled as Positive (ASD) that were correctly predicted; the optimal value for the recall is 1 [54].
- Negative Predictive Value = is the proportion of instances predicted as Negative (TD) that were correct; the optimal negative predictive value is 1 [54].
- Specificity = is the proportion of instances labelled as Negative (TD) that were correctly predicted; the optimal value for specificity is 1 [54].
- Accuracy = is the ratio of the number of correctly classified samples to the total number of samples, and its optimal value is 1 [55].
- F1-score = is defined as the harmonic mean of precision and recall. F1-score has a range of [0, 1], with TP = 0 (i.e., when all of the positive samples are incorrectly categorised) as its lowest and FN = FP = 0 (perfect classification) as its maximum. F1 differs from accuracy in two key ways: it is independent of TN, and it is not symmetric for class switching [55].
4. Results
Physiological-Based ASD Prediction
5. Discussion
6. Conclusions and Future Work
Author Contributions
Funding
Institutional Review Board Statement
Informed Consent Statement
Data Availability Statement
Acknowledgments
Conflicts of Interest
References
- American Psychiatric Association. Diagnostic and Statistical Manual of Mental Disorders, 5th ed.; American Psychiatric Association: Washington, DC, USA, 2013. [Google Scholar]
- Robertson, C.E.; Baron-Cohen, S. Sensory perception in autism. Nat. Rev. Neurosci. 2017, 18, 671–684. [Google Scholar]
- Lydon, S.; Healy, O.; Reed, P.; Mulhern, T.; Hughes, B.M.; Goodwin, M.S. A systematic review of physiological reactivity to stimuli in autism. Dev. Neurorehabilit. 2016, 19, 335–355. [Google Scholar]
- Robertson, A.E.; Simmons, D.R. The sensory experiences of adults with autism spectrum disorder: A qualitative analysis. Perception 2015, 44, 569–586. [Google Scholar] [CrossRef] [PubMed]
- Thye, M.D.; Bednarz, H.M.; Herringshaw, A.J.; Sartin, E.B.; Kana, R.K. The impact of atypical sensory processing on social impairments in autism spectrum disorder. Dev. Cogn. Neurosci. 2018, 29, 151–167. [Google Scholar] [CrossRef]
- Watson, L.R.; Patten, E.; Baranek, G.T.; Poe, M.; Boyd, B.A.; Freuler, A.; Lorenzi, J. Differential Associations between Sensory Response Patterns and Language, Social, and Communication Measures in Children with Autism or Other Developmental Disabilities. J. Speech Lang. Hear. Res. 2011, 54, 1562–1576. [Google Scholar] [CrossRef] [PubMed]
- Estes, A.; Zwaigenbaum, L.; Gu, H.; St. John, T.; Paterson, S.; Elison, J.T.; Hazlett, H.; Botteron, K.; Dager, S.R.; Schultz, R.T.; et al. Behavioral, cognitive, and adaptive development in infants with autism spectrum disorder in the first 2 years of life. J. Neurodev. Disord. 2015, 7, 1–10. [Google Scholar]
- Alcañiz Raya, M.; Marín-Morales, J.; Minissi, M.E.; Teruel Garcia, G.; Abad, L.; Chicchi Giglioli, I.A. Machine Learning and Virtual Reality on Body Movements’ Behaviors to Classify Children with Autism Spectrum Disorder. J. Clin. Med. 2020, 9, 1260. [Google Scholar]
- Barros, F.; Soares, S.C. Giving meaning to the social world in autism spectrum disorders: Olfaction as a missing piece of the puzzle? Neurosci. Biobehav. Rev. 2020, 116, 239–250. [Google Scholar] [CrossRef]
- Stevenson, R.J. An initial evaluation of the functions of human olfaction. Chem. Senses 2010, 35, 3–20. [Google Scholar]
- Soudry, Y.; Lemogne, C.; Malinvaud, D.; Consoli, S.M.; Bonfils, P. Olfactory system and emotion: Common substrates. Eur. Ann. Otorhinolaryngol. Head Neck Dis. 2011, 128, 18–23. [Google Scholar] [CrossRef]
- Loos, H.M.; Schreiner, L.; Karacan, B. A systematic review of physiological responses to odours with a focus on current methods used in event-related study designs. Int. J. Psychophysiol. 2020, 158, 143–157. [Google Scholar] [CrossRef] [PubMed]
- He, W.; Boesveldt, S.; De Graaf, C.; De Wijk, R.A. Dynamics of autonomic nervous system responses and facial expressions to odors. Front. Psychol. 2014, 5, 110. [Google Scholar]
- Delplanque, S.; Grandjean, D.; Chrea, C.; Coppin, G.; Aymard, L.; Cayeux, I.; Margot, C.; Velazco, M.I.; Sander, D.; Scherer, K.R. Sequential unfolding of novelty and pleasantness appraisals of odors: Evidence from facial electromyography and autonomic reactions. Emotion 2009, 9, 316. [Google Scholar] [PubMed]
- Bensafi, M.; Rouby, C.; Farget, V.; Bertrand, B.; Vigouroux, M.; Holley, A. Psychophysiological correlates of affects in human olfaction. Neurophysiol. Clin. Neurophysiol. 2002, 32, 326–332. [Google Scholar] [CrossRef]
- de Groot, J.H.; Smeets, M.A.; Kaldewaij, A.; Duijndam, M.J.; Semin, G.R. Chemosignals communicate human emotions. Psychol. Sci. 2012, 23, 1417–1424. [Google Scholar] [CrossRef] [PubMed]
- de Groot, J.H.; Smeets, M.A.; Rowson, M.J.; Bulsing, P.J.; Blonk, C.G.; Wilkinson, J.E.; Semin, G.R. A sniff of happiness. Psychol. Sci. 2015, 26, 684–700. [Google Scholar]
- Ferreira, J.; Parma, V.; Alho, L.; Silva, C.F.; Soares, S.C. Emotional body odors as context: Effects on cardiac and subjective responses. Chem. Senses 2018, 43, 347–355. [Google Scholar] [CrossRef] [Green Version]
- Larsson, M.; Tirado, C.; Wiens, S. A meta-analysis of odor thresholds and odor identification in autism spectrum disorders. Front. Psychol. 2017, 8, 679. [Google Scholar]
- Tonacci, A.; Billeci, L.; Tartarisco, G.; Ruta, L.; Muratori, F.; Pioggia, G.; Gangemi, S. Olfaction in autism spectrum disorders: A systematic review. Child Neuropsychol. 2017, 23, 1–25. [Google Scholar]
- Galle, S.A.; Courchesne, V.; Mottron, L.; Frasnelli, J. Olfaction in the autism spectrum. Perception 2013, 42, 341–355. [Google Scholar]
- Tavassoli, T.; Baron-Cohen, S. Olfactory detection thresholds and adaptation in adults with autism spectrum condition. J. Autism Dev. Disord. 2012, 42, 905–909. [Google Scholar] [PubMed]
- Koehler, L.; Fournel, A.; Albertowski, K.; Roessner, V.; Gerber, J.; Hummel, C.; Hummel, T.; Bensafi, M. Impaired odor perception in autism spectrum disorder is associated with decreased activity in olfactory cortex. Chem. Senses 2018, 43, 627–634. [Google Scholar]
- Ashwin, C.; Chapman, E.; Howells, J.; Rhydderch, D.; Walker, I.; Baron-Cohen, S. Enhanced olfactory sensitivity in autism spectrum conditions. Mol. Autism 2014, 5, 1–9. [Google Scholar] [CrossRef] [PubMed]
- Sweigert, J.R.; St. John, T.; Begay, K.K.; Davis, G.E.; Munson, J.; Shankland, E.; Estes, A.; Dager, S.R.; Kleinhans, N.M. Characterizing olfactory function in children with autism spectrum disorder and children with sensory processing dysfunction. Brain Sci. 2020, 10, 362. [Google Scholar] [CrossRef] [PubMed]
- Endevelt-Shapira, Y.; Perl, O.; Ravia, A.; Amir, D.; Eisen, A.; Bezalel, V.; Rozenkrantz, L.; Mishor, E.; Pinchover, L.; Soroka, T.; et al. Altered responses to social chemosignals in autism spectrum disorder. Nat. Neurosci. 2018, 21, 111–119. [Google Scholar]
- Legiša, J.; Messinger, D.S.; Kermol, E.; Marlier, L. Emotional responses to odors in children with high-functioning autism: Autonomic arousal, facial behavior and self-report. J. Autism Dev. Disord. 2013, 43, 869–879. [Google Scholar] [CrossRef]
- Rozenkrantz, L.; Zachor, D.; Heller, I.; Plotkin, A.; Weissbrod, A.; Snitz, K.; Secundo, L.; Sobel, N. A mechanistic link between olfaction and autism spectrum disorder. Curr. Biol. 2015, 25, 1904–1910. [Google Scholar] [CrossRef]
- Small, D.M.; Pelphrey, K.A. Autism spectrum disorder: Sniffing out a new biomarker. Curr. Biol. 2015, 25, R674–R676. [Google Scholar] [CrossRef]
- Grave, J.; Noll, J.; Barros, F.; Kogler, L.; Freiherr, J.; Wildgruber, D.; Soares, S.; Derntl, B. Subjective responses to emotional body odors and common odors in autism-spectrum disorders. Eur. Psychiatry 2021, 64, S613. [Google Scholar]
- Kwon, O.; Jeong, J.; Kim, H.B. ECG Sampling Frequency for HRV Analysis. Healthc. Inform. Res. 2018, 24, 198–206. [Google Scholar] [CrossRef]
- Agrafioti, F.; Hatzinakos, D.; Anderson, A.K. ECG pattern analysis for emotion detection. IEEE Trans. Affect. Comput. 2011, 3, 102–115. [Google Scholar]
- Dimberg, U.; Thunberg, M.; Elmehed, K. Unconscious facial reactions to emotional facial expressions. Psychol. Sci. 2000, 11, 86–89. [Google Scholar]
- Pereira, L.; Brás, S.; Sebastião, R. Characterization of Emotions Through Facial Electromyogram Signals. In Proceedings of the Iberian Conference on Pattern Recognition and Image Analysis, Aveiro, Portugal, 4–6 May 2022; Lecture Notes in Computer Science. Springer International Publishing: Cham, Switzerland, 2022; pp. 230–241. [Google Scholar]
- Dimberg, U. Facial Electromyography and Emotional Reactions. Psychophysiology 1990, 27, 481–494. [Google Scholar] [CrossRef] [PubMed]
- Oldfield, R.C. The assessment and analysis of handedness: The Edinburgh inventory. Neuropsychologia 1971, 9, 97–113. [Google Scholar] [CrossRef] [PubMed]
- Rühl, D.; Bölte, S.; Feineis-Matthews, S.; Poustka, F. ADOS: Diagnostische Beobachtungsskala für autistische Störungen; Manual; Hans Huber: Bern, Switzerland, 2004. [Google Scholar]
- Wittchen, H.U.; Wunderlich, U.; Gruschwitz, S.; Zaudig, M. Structural Clinical Interview for DSM-IV (SKID-I and SKID-II); Hogrefe: Göttingen, Germany, 1997. [Google Scholar]
- Hummel, T.; Sekinger, B.; Wolf, S.R.; Pauli, E.; Kobal, G. ‘Sniffin’sticks’: Olfactory performance assessed by the combined testing of odor identification, odor discrimination and olfactory threshold. Chem. Senses 1997, 22, 39–52. [Google Scholar] [CrossRef] [PubMed]
- Oleszkiewicz, A.; Schriever, V.; Croy, I.; Hähner, A.; Hummel, T. Updated Sniffin’Sticks normative data based on an extended sample of 9139 subjects. Eur. Arch. Oto-Rhino 2019, 276, 719–728. [Google Scholar] [CrossRef]
- Barros, F.; Figueiredo, C.; Brás, S.; Carvalho, J.M.; Soares, S.C. Multidimensional assessment of anxiety through the State-Trait Inventory for Cognitive and Somatic Anxiety (STICSA): From dimensionality to response prediction across emotional contexts. PLoS ONE 2022, 17, e0262960. [Google Scholar]
- Gouveia, C.; Tomé, A.; Barros, F.; Soares, S.C.; Vieira, J.; Pinho, P. Study on the usage feasibility of continuous-wave radar for emotion recognition. Biomed. Signal Process. Control. 2020, 58, 101835. [Google Scholar]
- Pinto, G.; Carvalho, J.M.; Barros, F.; Soares, S.C.; Pinho, A.J.; Brás, S. Multimodal emotion evaluation: A physiological model for cost-effective emotion classification. Sensors 2020, 20, 3510. [Google Scholar] [CrossRef]
- Bestgen, A.K.; Schulze, .K.L. Odor Emotional Quality Predicts Odor Identification. Chem. Senses 2015, 40, 517–523. [Google Scholar]
- Licon, C.C.; Manesse, C.; Dantec, M.; Fournel, A.; Bensafi, M. Pleasantness and trigeminal sensations as salient dimensions in organizing the semantic and physiological spaces of odors. Sci. Rep. 2018, 8, 1–12. [Google Scholar] [CrossRef] [PubMed]
- Dougherty, D.P.; Wright, G.A.; Yew, A.C. Computational model of the cAMP-mediated sensory response and calcium-dependent adaptation in vertebrate olfactory receptor neurons. Proc. Natl. Acad. Sci. USA 2005, 102, 10415–10420. [Google Scholar] [PubMed]
- Fridlund, A.J.; Cacioppo, J.T. Guidelines for human electromyographic research. Psychophysiology 1986, 23, 567–589. [Google Scholar] [CrossRef] [PubMed]
- Makowski, D.; Pham, T.; Lau, Z.J.; Brammer, J.C.; Lespinasse, F.; Pham, H.; Schölzel, C.; Chen, S.H.A. NeuroKit2: A Python toolbox for neurophysiological signal processing. Behav. Res. Methods 2021, 53, 1689–1696. [Google Scholar] [CrossRef] [PubMed]
- Van Rossum, G.; Drake, F.L. Python 3 Reference Manual; CreateSpace: Scotts Valley, CA, USA, 2009. [Google Scholar]
- Dehghani, A.; Sarbishei, O.; Glatard, T.; Shihab, E. A Quantitative Comparison of Overlapping and Non-Overlapping Sliding Windows for Human Activity Recognition Using Inertial Sensors. Sensors 2019, 19, 5026. [Google Scholar] [PubMed]
- Batista, G.E.A.P.A.; Silva, D.F. How k-Nearest Neighbor Parameters Affect its Performance. In Proceedings of the 38º JAIIO - Argentine Symposium on Artificial Intelligence (ASAI 2009), Mar del Plata, Argentina, 24–25 August 2009; pp. 1–12. [Google Scholar]
- Refaeilzadeh, P.; Tang, L.; Liu, H. Cross-Validation. In Encyclopedia of Database Systems; Springer: Boston, MA, USA, 2009. [Google Scholar]
- Taheri, M.; Lim, N.; Lederer, J. Balancing Statistical and Computational Precision and Applications to Penalized Linear Regression with Group Sparsity. arXiv 2016, arXiv:1609.07195. [Google Scholar]
- Khan, S.A.; Ali Rana, Z. Evaluating Performance of Software Defect Prediction Models Using Area under Precision-Recall Curve (AUC-PR). In Proceedings of the 2019 2nd International Conference on Advancements in Computational Sciences (ICACS), Lahore, Pakistan, 18–20 February 2019; pp. 1–6. [Google Scholar]
- Chicco, D.; Jurman, G. The advantages of the Matthews correlation coefficient (MCC) over F1 score and accuracy in binary classification evaluation. BMC Genom. 2020, 21, 1–13. [Google Scholar]
- Mottron, L.; Bzdok, D. Autism spectrum heterogeneity: Fact or artifact? Mol. Psychiatry 2020, 25, 3178–3185. [Google Scholar] [CrossRef]
- Lai, M.C.; Lombardo, S.; Baron-Cohen, S. Autism. Lancet 2014, 383, 9920. [Google Scholar] [CrossRef]
- Sorokowski, P.; Karwowski, M.; Misiak, M.; Marczak, M.K.; Dziekan, M.; Hummel, T.; Sorokowska, A. Sex differences in human olfaction: A meta-analysis. Front. Psychol. 2019, 10, 242. [Google Scholar] [CrossRef] [Green Version]
- de Groot, J.H.; Semin, G.R.; Smeets, M.A. Chemical communication of fear: A case of male–female asymmetry. J. Exp. Psychol. Gen. 2014, 143, 1515. [Google Scholar] [PubMed]
- Barros, F.; Figueiredo, C.; Costa, A.; Soares, S.C. Sensory processing in the Autism Spectrum: The role of attention to detail and somatic trait anxiety in the olfactory perception of the general population. J. Autism Dev. Disord. 2021, 51, 2338–2353. [Google Scholar] [PubMed]
- Chiarotti, F.; Venerosi, A. Epidemiology of autism spectrum disorders: A review of worldwide prevalence estimates since 2014. Brain Sci. 2020, 10, 274. [Google Scholar] [PubMed]


| ASD | TD | p-Value 1 | ||
|---|---|---|---|---|
| n = 11 | n = 48 | |||
| Age, Mdn (IQR) | 36.0 (17.5) | 24.50 (9.5) | 0.002 ** | |
| Sex, n (%) | Women | 2 (18.2) | 24 (50.0) | 0.091 |
| Men | 9 (81.8) | 24 (50.0) | ||
| Nationality, n (%) | German | 10 (90.9) | 45 (93.8) | 0.168 |
| Swiss | 0 (0.0) | 2 (4.2) | ||
| Hungarian | 1 (9.1) | 0 (0.0) | ||
| Bulgarian | 0 (0.0) | 1 (2.1) | ||
| Working status, n (%) | Full-time worker | 5 (45.4) | 6 (12.5) | 0.001 *** |
| Part-time worker | 2 (18.2) | 3 (6.3) | ||
| Pensioner | 2 (18.2) | 0 (0.0) | ||
| Stick leave | 1 (9.1) | 0 (0.0) | ||
| Student | 1 (9.1) | 37 (77.1) | ||
| Working student | 0 (0.0) | 1 (2.1) | ||
| Unemployed | 0 (0.0) | 1 (2.1) | ||
| Smoking habits, n (%) | Non-smoker | 8 (72.7) | 36 (75.0) | 0.114 |
| 1–5 cigarettes/week | 0 (0.0) | 8 (16.7) | ||
| 5–10 cigarettes/week | 0 (0.0) | 0 (0.0) | ||
| 10–15 cigarettes/week | 0 (0.0) | 1 (2.1) | ||
| Daily | 3 (27.3) | 3 (6.3) | ||
| Hormonal contraceptive, n (%) | Yes | 0 (0.0) | 10 (41.7) | 0.395 |
| No | 2 (100.0) | 12 (50.0) | ||
| Menopause | 0 (0.0) | 2 (8.3) | ||
| EHI, Mdn (IQR) | 100 (0) | 100 (0) | 0.894 | |
| Sniffin’ Sticks, Mdn (IQR) | Threshold | 5.2 (2.4) | 7.6 (2.2) | 0.008 ** |
| Discrimination | 11.0 (1.5) | 13.0 (2.0) | 0.040 * | |
| Identification | 13.0 (1.0) | 14.0 (2.0) | 0.176 | |
| Total | 27.7 (2.7) | 33.2 (3.6) | 0.002 ** |
| Feature | Meaning |
|---|---|
| ECG_Clean | Cleaned signal after filtering. |
| ECG_Rate | Heart rate values interpolated between the R-peaks. |
| ECG_P_Interval | Distance between subsequent peaks in seconds (for P, Q, R, S, and T peaks, respectively). |
| ECG_Q_Interval | |
| ECG_R_Interval | |
| ECG_S_Interval | |
| ECG_T_Interval | |
| ECG_P_Peaks | Peaks amplitude (for P, Q, R, S, and T peaks, respectively). |
| ECG_Q_Peaks | |
| ECG_R_Peaks | |
| ECG_S_Peaks | |
| ECG_T_Peaks | |
| ECG_P_Slope | Slope between subsequent peaks (for P, Q, R, S, and T peaks, respectively). |
| ECG_Q_Slope | |
| ECG_R_Slope | |
| ECG_S_Slope | |
| ECG_T_Slope | |
| EMG_front_Clean | Cleaned EMG signals after filtering. |
| EMG_zygo_Clean | |
| EMG_corr_Clean | |
| EMG_front_Amplitude | Amplitude EMG signals (activation level). |
| EMG_zygo_Amplitude | |
| EMG_corr_Amplitude | |
| EMG_front_IntervalActivation | Distance between a corresponding onset and offset in seconds, for each of the EMG signals. |
| EMG_zygo_IntervalActivation | |
| EMG_corr_IntervalActivation | |
| EMG_front_AmpOnset | Onset amplitude, for each of the EMG signals. |
| EMG_zygo_AmpOnset | |
| EMG_corr_AmpOnset | |
| EMG_front_AmpOffset | Offset amplitude, for each of the EMG signals. |
| EMG_zygo_AmpOffset | |
| EMG_corr_AmpOffset |
| Features |
|---|
| ECG_Clean |
| ECG_P_Peaks |
| ECG_P_Slope |
| ECG_S_Slope |
| ECG_T_Peaks |
| ECG_T_Slope |
| EMG_corr_OnOff |
| EMG_corr_Amplitude |
| EMG_front_Amplitude |
| EMG_corr_Clean |
Disclaimer/Publisher’s Note: The statements, opinions and data contained in all publications are solely those of the individual author(s) and contributor(s) and not of MDPI and/or the editor(s). MDPI and/or the editor(s) disclaim responsibility for any injury to people or property resulting from any ideas, methods, instructions or products referred to in the content. |
© 2023 by the authors. Licensee MDPI, Basel, Switzerland. This article is an open access article distributed under the terms and conditions of the Creative Commons Attribution (CC BY) license (https://creativecommons.org/licenses/by/4.0/).
Share and Cite
Pereira, L.; Grave, J.; Noll, J.; Derntl, B.; Soares, S.C.; Brás, S.; Sebastião, R. Characterisation of Physiological Responses to Odours in Autism Spectrum Disorders: A Preliminary Study. Appl. Sci. 2023, 13, 1970. https://doi.org/10.3390/app13031970
Pereira L, Grave J, Noll J, Derntl B, Soares SC, Brás S, Sebastião R. Characterisation of Physiological Responses to Odours in Autism Spectrum Disorders: A Preliminary Study. Applied Sciences. 2023; 13(3):1970. https://doi.org/10.3390/app13031970
Chicago/Turabian StylePereira, Lara, Joana Grave, Janina Noll, Birgit Derntl, Sandra C. Soares, Susana Brás, and Raquel Sebastião. 2023. "Characterisation of Physiological Responses to Odours in Autism Spectrum Disorders: A Preliminary Study" Applied Sciences 13, no. 3: 1970. https://doi.org/10.3390/app13031970