Article

A Comparative Assessment of High-Throughput Quantitative Polymerase Chain Reaction versus Shotgun Metagenomic Sequencing in Sediment Resistome Profiling

1
Environment and Life Science Research Centre, Kuwait Institute for Scientific Research, Jamal Abdul Nasser Street, Safat 13109, Kuwait
2
Environment Public Authority, Fourth Ring Road, Shuwaikh Industrial 70050, Kuwait
*
Authors to whom correspondence should be addressed.
Appl. Sci. 2023, 13(20), 11229; https://doi.org/10.3390/app132011229
Submission received: 11 September 2023 / Revised: 4 October 2023 / Accepted: 10 October 2023 / Published: 12 October 2023
(This article belongs to the Special Issue Emerging Contaminants in Environment)

Abstract

:
Prolonged and excessive use of antibiotics has resulted in the development of antimicrobial resistance (AMR), which is considered an emerging global challenge that warrants a deeper understanding of the antibiotic-resistant gene elements (ARGEs/resistomes) involved in its rapid dissemination. Currently, advanced molecular methods such as high-throughput quantitative polymerase chain reaction (HT-qPCR) and shotgun metagenomic sequencing (SMS) are commonly applied for the surveillance and monitoring of AMR in the environment. Although both methods are considered complementary to each other, there are some appreciable differences that we wish to highlight in this communication. We compared both these approaches to map the ARGEs in the coastal sediments of Kuwait. The study area represents an excellent model as it receives recurrent emergency waste and other anthropogenic contaminants. The HT-qPCR identified about 100 ARGs, 5 integrons, and 18 MGEs (total—122). These ARGs coded for resistance against the drug classes of beta-lactams > aminoglycoside > tetracycline, macrolide lincosamide streptogramin B (MLSB) > phenicol > trimethoprim, quinolone, and sulfonamide. The SMS picked a greater number of ARGs (402), plasmid sequences (1567), and integrons (168). Based on the evidence, we feel the SMS is a better method to undertake ARG assessment to fulfil the WHO mandate of “One Health Approach.” This manuscript is a useful resource for environmental scientists involved in AMR monitoring.

1. Introduction

Antibiotics are pharmaceuticals that find daily usage in the healthcare and agriculture sectors to fight against bacterial infections. The prolonged use of certain drugs has resulted in the evolution of antibiotic resistance within the organisms and is expressed as antibiotic resistance genes (ARGs) [1]. The thresholds are alarming, with approximately 4.95 million fatalities in 2019 [2] that is expected to reach 10 million by 2050 [3]. A pressing concern among the World Health Organization (WHO) and the Centre for Disease Control and Prevention (CDC) is to design applicable surveillance strategies [4] to understand its spread and mitigation across the environment. The WHO, jointly with the International Monetary Fund (IMF) and the World Bank (WB), has proposed the “One Health and Global Health” approach with the primary objective of monitoring the environmental health of humans and animals [5,6]. Resistome profiling is thus a holistic advancement, surveying the origin and richness of antibiotic resistance genes (ARGs) as well as the underlying factors, i.e., mobile genetic elements (MGEs) promoting its dissemination and evolution [6].
Antibiotics are commonly used to treat human and animal infections. Among these beta-lactams are the last choice drugs and are used to treat urinary, respiratory, and blood infections [7]. The bactericidal properties of its several subcategories including penicillin, cephalosporins, carbapenems, amoxicillin, cefazolin, and meropenem are now being compromised due to the development of ARGs [8]. Some other bactericidal antibiotics aminoglycosides, fluoroquinolones, and glycopeptides need to be investigated for respective ARGs. Numerous antibiotics possess bacteriostatic properties such as glycylcycline, tetracyclines, lincosamide, macrolides, oxazolidines, and sulfonamides [8]. There is a dire need to check for the ARGs against these antibiotic classes and the risk they pose to human, animal, and environmental subjects.
Historically, antibiotic resistance monitoring has been practiced for the examination of targeted pathogens and the genes they carry mostly in clinics [9,10,11,12,13], agriculture [14,15,16], and water-treatment facilities [17,18,19]. The ARGs bearing ARBs from these situations are channelized into the nearby geographic locations that often become the point source of transmissible outbreaks [20,21,22]. Environmental reconnaissance has thereafter gained importance in the last few decades [23,24,25]. Over the years, it has been realized that the diversity and complexity of an environmental habitat is unmatched and therefore following the traditional practices might limit our understanding of the ecological resistome. A universal approach is desirable to concurrently identify both the infectious and non-infectious carriers present within a system. Several molecular assays were developed and a high-throughput quantitative polymerase chain reaction (HT-qPCR) has been emphasized as one of the most efficient genome-centric approaches to map the entire resistome of a territory [26,27,28].
The popularity of HT-qPCR is due to its ability to capture environmental concentrations of ARGs in real time. The multiplex primers add more benefit by mapping hundreds of genes, mobile genetic elements (plasmids and class 1, 2, and 3 integrons), 16S rRNA genes (bacterial copies), and the WHO-recommended taxonomic groups simultaneously in a single run [26,29]. Although widely used, the HT-qPCR is limited in picking low abundance genes (>10 copies) and unknown genes. The environmental samples are very challenging and getting reasonable quantifiable material from these settings is difficult. This is recently being compensated for with the use of next-generation sequencing.
The shotgun metagenomic (SMS) method is nowadays considered a gold standard in terms of mapping the entire resistome [30,31,32,33,34,35,36,37,38,39,40]. Not only does it provide information on all the genes present within the milieu but it also captures cryptic genes. Once the sequence data are available, taxonomic, functional, and resistome profiling can be conducted simultaneously. Higher sequencing coverage allows the filtering of low-abundance genes. Researchers have started applying SMS [37,38,41], but it is relatively expensive and requires high bioinformatics skills to derive meaningful conclusions. However, owing to its popularity, regular technical upgrades are being conducted, and several new platforms are being made available. The cost is also getting reduced with time.
To compare the efficacy of the two methods, in the present investigation, we employed the high throughput quantitative PCR (HT-qPCR) method to identify selected antibiotic-resistant genes and the associated mobile genetic elements from marine sediments receiving effluent discharges along the urban coast of Kuwait. We also compared the output of the HT-qPCR with the results of the shotgun metagenomic sequencing (SMS).

2. Materials and Methods

2.1. Study Area and Sample Collection

The coast of Kuwait is well developed, with numerous emergency outfalls and stormwater outlets connecting to the sea. The presence of pharmaceuticals in seawater, especially antibiotics, poses a significant threat to marine biota near these outfalls [42]. Antibiotics such as sulfamethoxazole, ciprofloxacin, clarithromycin, cefalexin, erythromycin, azithromycin, tetracycline, ofloxacin, trimethoprim, dimetridazole, metronidazole, metronidazole-OH, and ronidazole were found in the influent and effluent wastewaters of Kabd and Um Al Hayman [42]. Our recent investigation showed that the pharmaceuticals are not restricted to the wastewater stream but are present in seawater samples collected across the Kuwait coastal area [43]. We, therefore, used the marine surface sediments of Kuwait as a model system in the present investigation. Briefly, grab samples (covering 10–15 cm sediment profile) were added to 50 mL sterile tubes (Corning®, Corning, AZ, USA). Samples were shifted to Kuwait Institute for Scientific Research (KISR) laboratories in ice and aliquoted to store at −20 °C until DNA extraction. Detailed sample collection and site specifications are described elsewhere [44].

2.2. DNA Isolation

DNA was isolated from the sediment samples employing the Qiagen power soil kit (Qiagen, Germantown, MD, USA). A total of a 0.250 mg sample was weighed and placed in a 1.5 mL sterile Eppendorf tube. The sediment was resuspended in 60 μL of solution C1 and was transferred to the power bead tube secured to a horizontal vortex adapter and vortexed at maximum speed for 10 min. The lysate was pelleted via centrifugation at 10,000× g for 30 s. The supernatant was transferred to a clean 2 mL collection tube, followed by the addition of solution C2, incubation at 2–8 °C for 5 min, and centrifugation at 10,000× g for 1 min. The supernatant was treated with solution C3 (200 μL) to remove inhibitory substances. The dissolved DNA was bound to the MB spin columns by the addition of solution C4 (1200 μL). The C5 solution was used twice to wash the DNA and final elution was performed in solution C6 (10 μL). Multiple aliquots (n = 5) from the same site were used for DNA extraction and pooled to reach the desired concentrations. The quantity of isolated was estimated using a Qubit fluorometer (Thermo Fisher Scientific, Carlsbad, CA, USA) employing the HS dsDNA Qubit assay kit (Invitrogen, Carlsbad, CA, USA). The intactness of bands was viewed on a 0.8% agarose gel run at 100 V/cm for 45 min (Bio-Rad, Hamburg, Germany).

2.3. SmartChipTM HT-qPCR Analysis

DNA isolated from the above step was freeze-dried and transported to Resistomap Oy (Helsinki, Finland) for the HT-qPCR analysis. The DNA samples were resuspended in nuclease-free water, and 2 ng/µL was added to the PCR reaction mix containing 1× SmartChip TM green gene expression master mix, 300 nM of primers, and nuclease-free water. The primers (n = 296) comprised 268 oligos for ARGs, 8 for integrons, and 20 for other genes [27]. The ARG oligos were chosen to cover the ARGs against the drug classes of beta-lactams, aminoglycosides, tetracyclines, fluoroquinolones, MLSB, tetracycline, vancomycin, phenicol, trimethoprim, and sulfonamides. A total reaction volume of 100 nL (n = 3 replicates) was loaded on a SmartChipTM (n = 5184 wells) employing an automated SmartChipTM multisample nanodispenser (TakaraBio, San Jose, CA, USA). PCR was conducted on a SmartChipTM Real-Time PCR System (TakaraBio, San Jose, CA, USA) through a PCR program including initial enzyme activation at 95 °C for 10 min followed by 40 cycles of denaturation at 95 °C for 30 s and annealing at 60 °C for 30 s. A melt curve analysis was performed using the SmartChipTM qPCR software to exclude false positive data (amplicons with unspecific melting curves or multiple peaks). The cycle threshold (CT) was set at 27. The average CT (triplicates) was used for estimating the relative abundance with reference to the 16S rRNA gene employing the universal 2−ΔCT method (ΔCT = CT detected gene—CT 16S rRNA gene) [45]. The 16S rRNA gene also served as a positive control. A negative control was run separately with sterile nuclease-free water to check for cross-contamination.

2.4. Shotgun Metagenomic Sequencing

The same set of samples were subjected to whole genome metagenomic sequencing at Novogene Ltd. Taipei City, Taiwan. The steps of analysis for this method have been described by Habibi et al. [44]. Shortly, 1 µg of DNA was sonicated, end-repaired, A-tailed, indexed, and sequenced on an Illumina NovaSeq 6000 platform following the 2 × 150 bp paired-end chemistry. The raw sequences were processed through standard bioinformatics pipelines for quality check, N-removal, and adapter trimming. High-quality sequences were assembled into ≥500 bp scaftigs through MEGAHIT v 1.04. The scaftigs were aligned in MetaGeneMark v 2.10 for gene prediction. Genes were referenced in the Comprehensive Antibiotic Research Database (CARD) (BLASTP e value ≤ 1 × 10) to filter antibiotic resistance genes (ARGs). Plasmids, integrons, and insertion sequences were picked through alignment with integral, isfinder, and plasmid databases v 2018 (−e 1 × 10⁻¹⁰, BLASTN), respectively [46].

2.5. Statistical Analysis

Data visualization and statistical analysis were performed by uploading the gene profiles on the ResistoXplorer web tool [47]. Microsoft Excel v2013, Numbers 12.1 (Macintosh HD, Apple Inc., Cupertino, CA, USA) and box plot maker (Statistics Kingdom) [48] were used for drawing bar charts, donut plots, and box plots, respectively.

3. Results

3.1. HT-qPCR Analysis

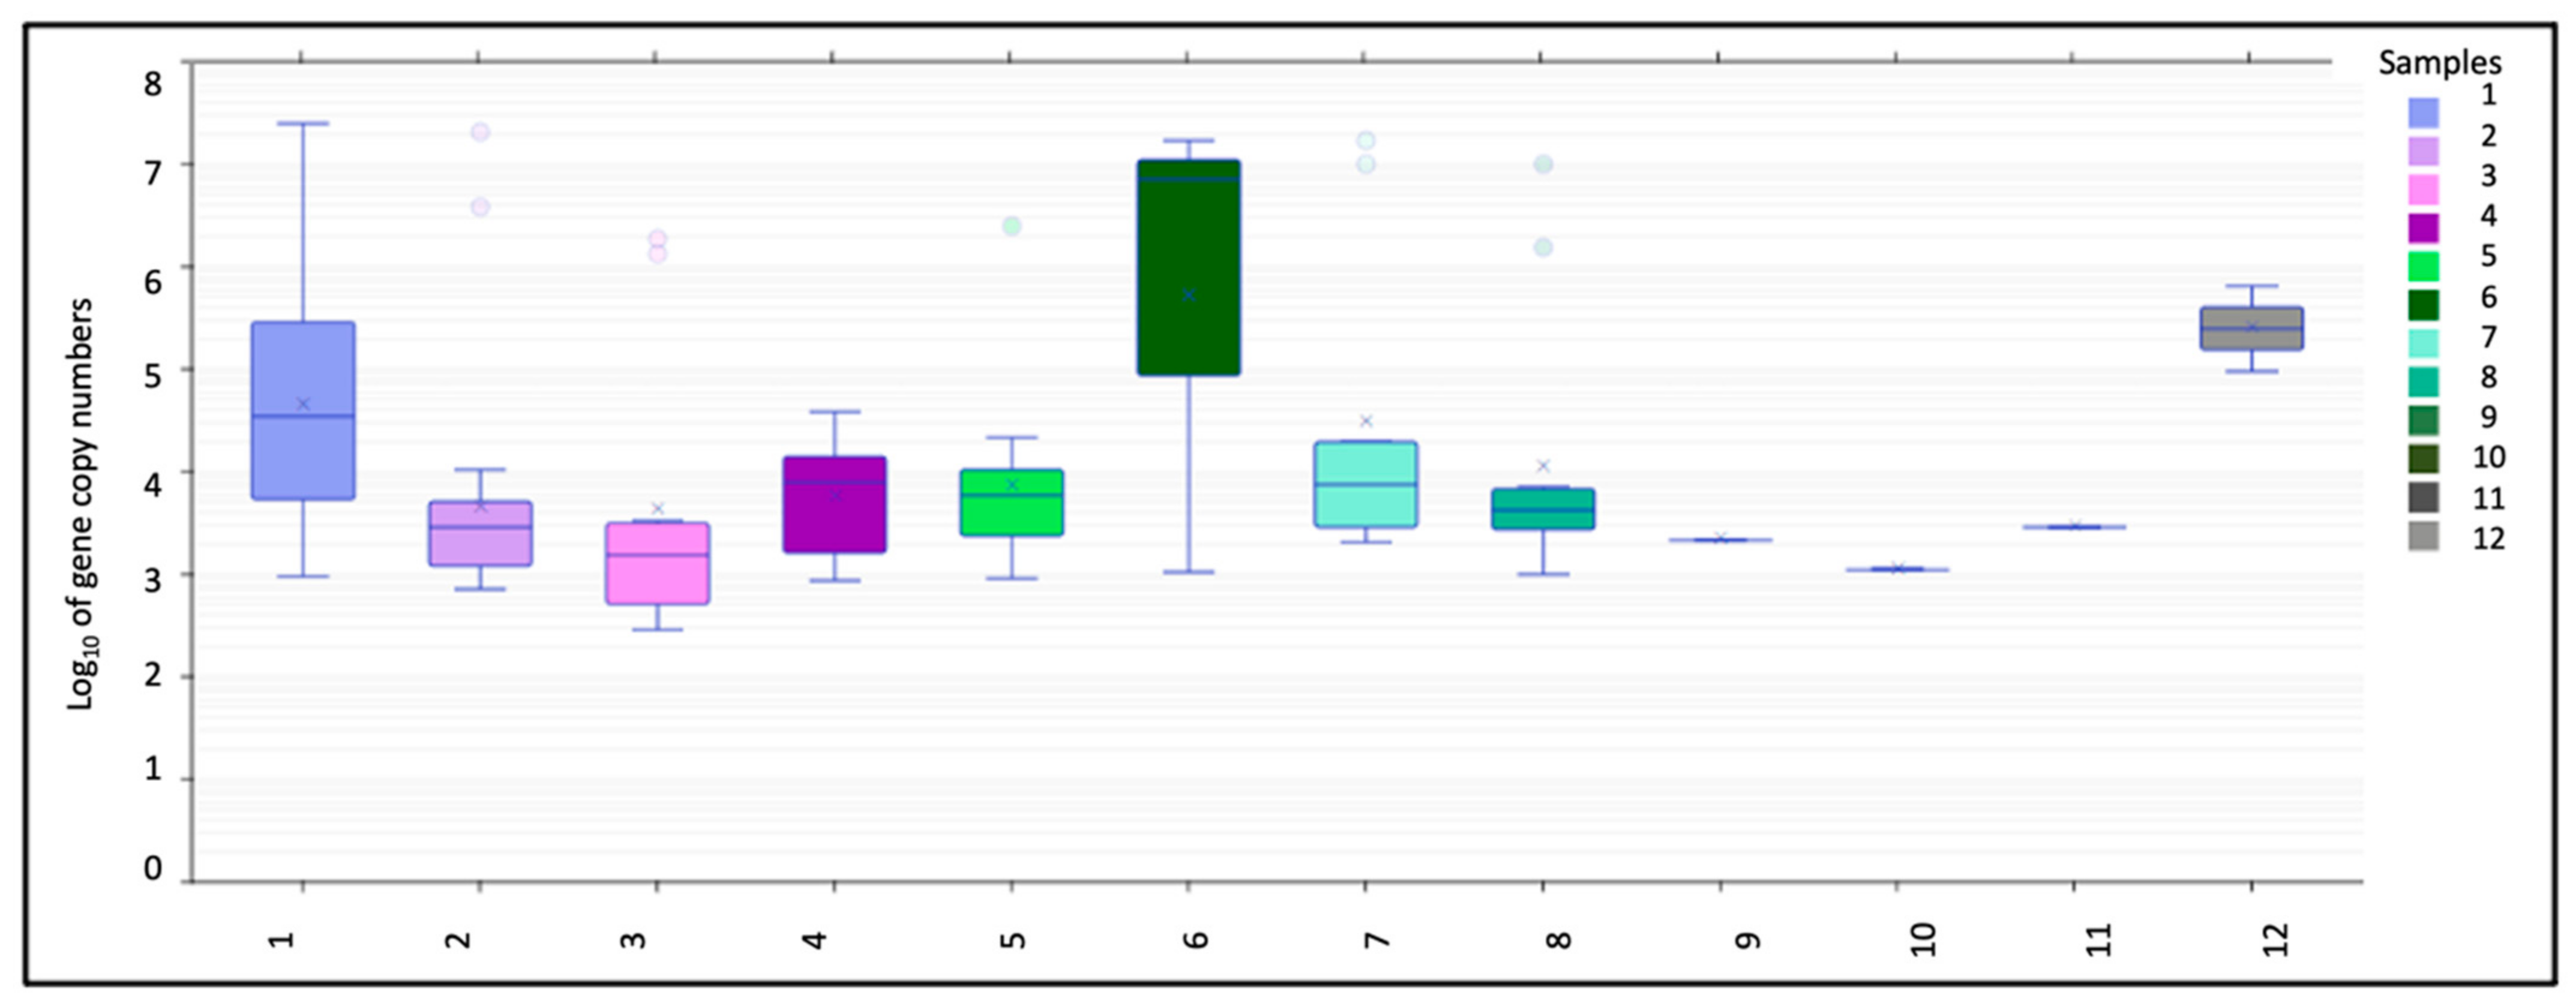
3.1.1. Bacterial Gene Copies

The 16S rRNA primers in the HT-qPCR panel yielded positive profiles for each sample, indicating the presence of bacterial DNA at each sampling site. The 16S rRNA gene copies exhibited spatial variations (Figure 1). The maximum number of gene counts were present at S6 (mean = 7log), followed by S12 and S1 (mean = 5log). The gene copies were below 4log at S2, S3, S4, S5, S7, and S8. The bacterial cell counts at S9, S10, and S12 were very low.

3.1.2. Antibiotic Resistance Genes and Drug Classes

A total of 122 antibiotic-resistant gene elements (100 ARGs, 5 integrons, and 18 MGEs) were present in the 12 sediment samples collected from Kuwait’s shoreline. The genes originated from seven major drug classes such as aminoglycoside, beta-lactam, phenicol, sulfonamide, tetracycline, trimethoprim, macrolide lincosamide streptogramin B (MLSB), quinolone, and others. The most abundant were beta-lactams (23%) with 25 gene IDs namely blaTEM_1, bla1, blaCARB, blaGES, cfxA, blaOXA58_2, blaROB, blaVEB, cphA_1, blaMIR, cphA_2, blaCMY_2, blaSHV11, blaOXA10_1, blaCMY_1, blaMOX/blaCMY, blaBEL-nonmobile, ampC_4, blaCMY2, ampC_1, ampC_6, blaSHV_2, blaACT_2, blaPER_1, and blaACT. This drug class was followed by aminoglycoside (21%), with 16 gene IDs such as aac6-aph2, aadA6, aadB, aadA2_3, aadA_1, strB, aadA16, aadA1_2, aadA2_1, aac(6′)-lb_1, aadA5_2, aadA10, aac(6′)-II, aacC2, aadA7, and aphA3_1. Tetracycline (tetPA, tetA_2, tetX, tetW, tetM, tetQ, tetG, tetO_2, tet32, tet39, tet44, tetL_2, and tetE) and MLSB (InuF, mefA_1, mefA, ermB_2, ereA, InuC, ermB_3, mefB, ermF, erm42, mphA, IsaC, and msrE) were next in order with 13 genes (12%) each. A total of eight genes (7%) were detected in the drug class of phenicol (cmlA_2, catQ, cmlA_4, catB3, catB8, catB2, mdtL, and floR_1). Six genes (5%) were confirmed in trimethoprim (dfrA1_1, dfrA15, dfrB, dfra17, dfrA27, and dfrA12) and quinolone (qnrS2, qnrVC1_VC3_VC6, qnrS_1, qnrB_2, qnrB, and qnrD) each. In sulfonamide 5 genes (3%), sul1_1, sul1_2, sul2_1, sul2_2, and sul4 were recorded. About eight genes (7%) merA, qacE∆1_3 qacE∆1_1, arr2, crAss64, crAss56, sat4, and mcr1 were classified as others. Mobile genetic elements (tnpA_1, tnpA_6, tnpA_2, ISPps, ISI247_2, tnpA_3, IncP_oriT, tnpA_5, ISI247_1, tnpA_4, IS613, IncN_rep, Tp614, ISAba3, IncQ_oriT, orf37-IS26, and Tn5) and integrons (intl_3, intI1_2, intI1_1, intl3, and intI3_2) were also found along with the ARGs resistant to above drug classes. All the ARGs are listed in Table 1. The relative abundance of each gene ID is given in Table S1.

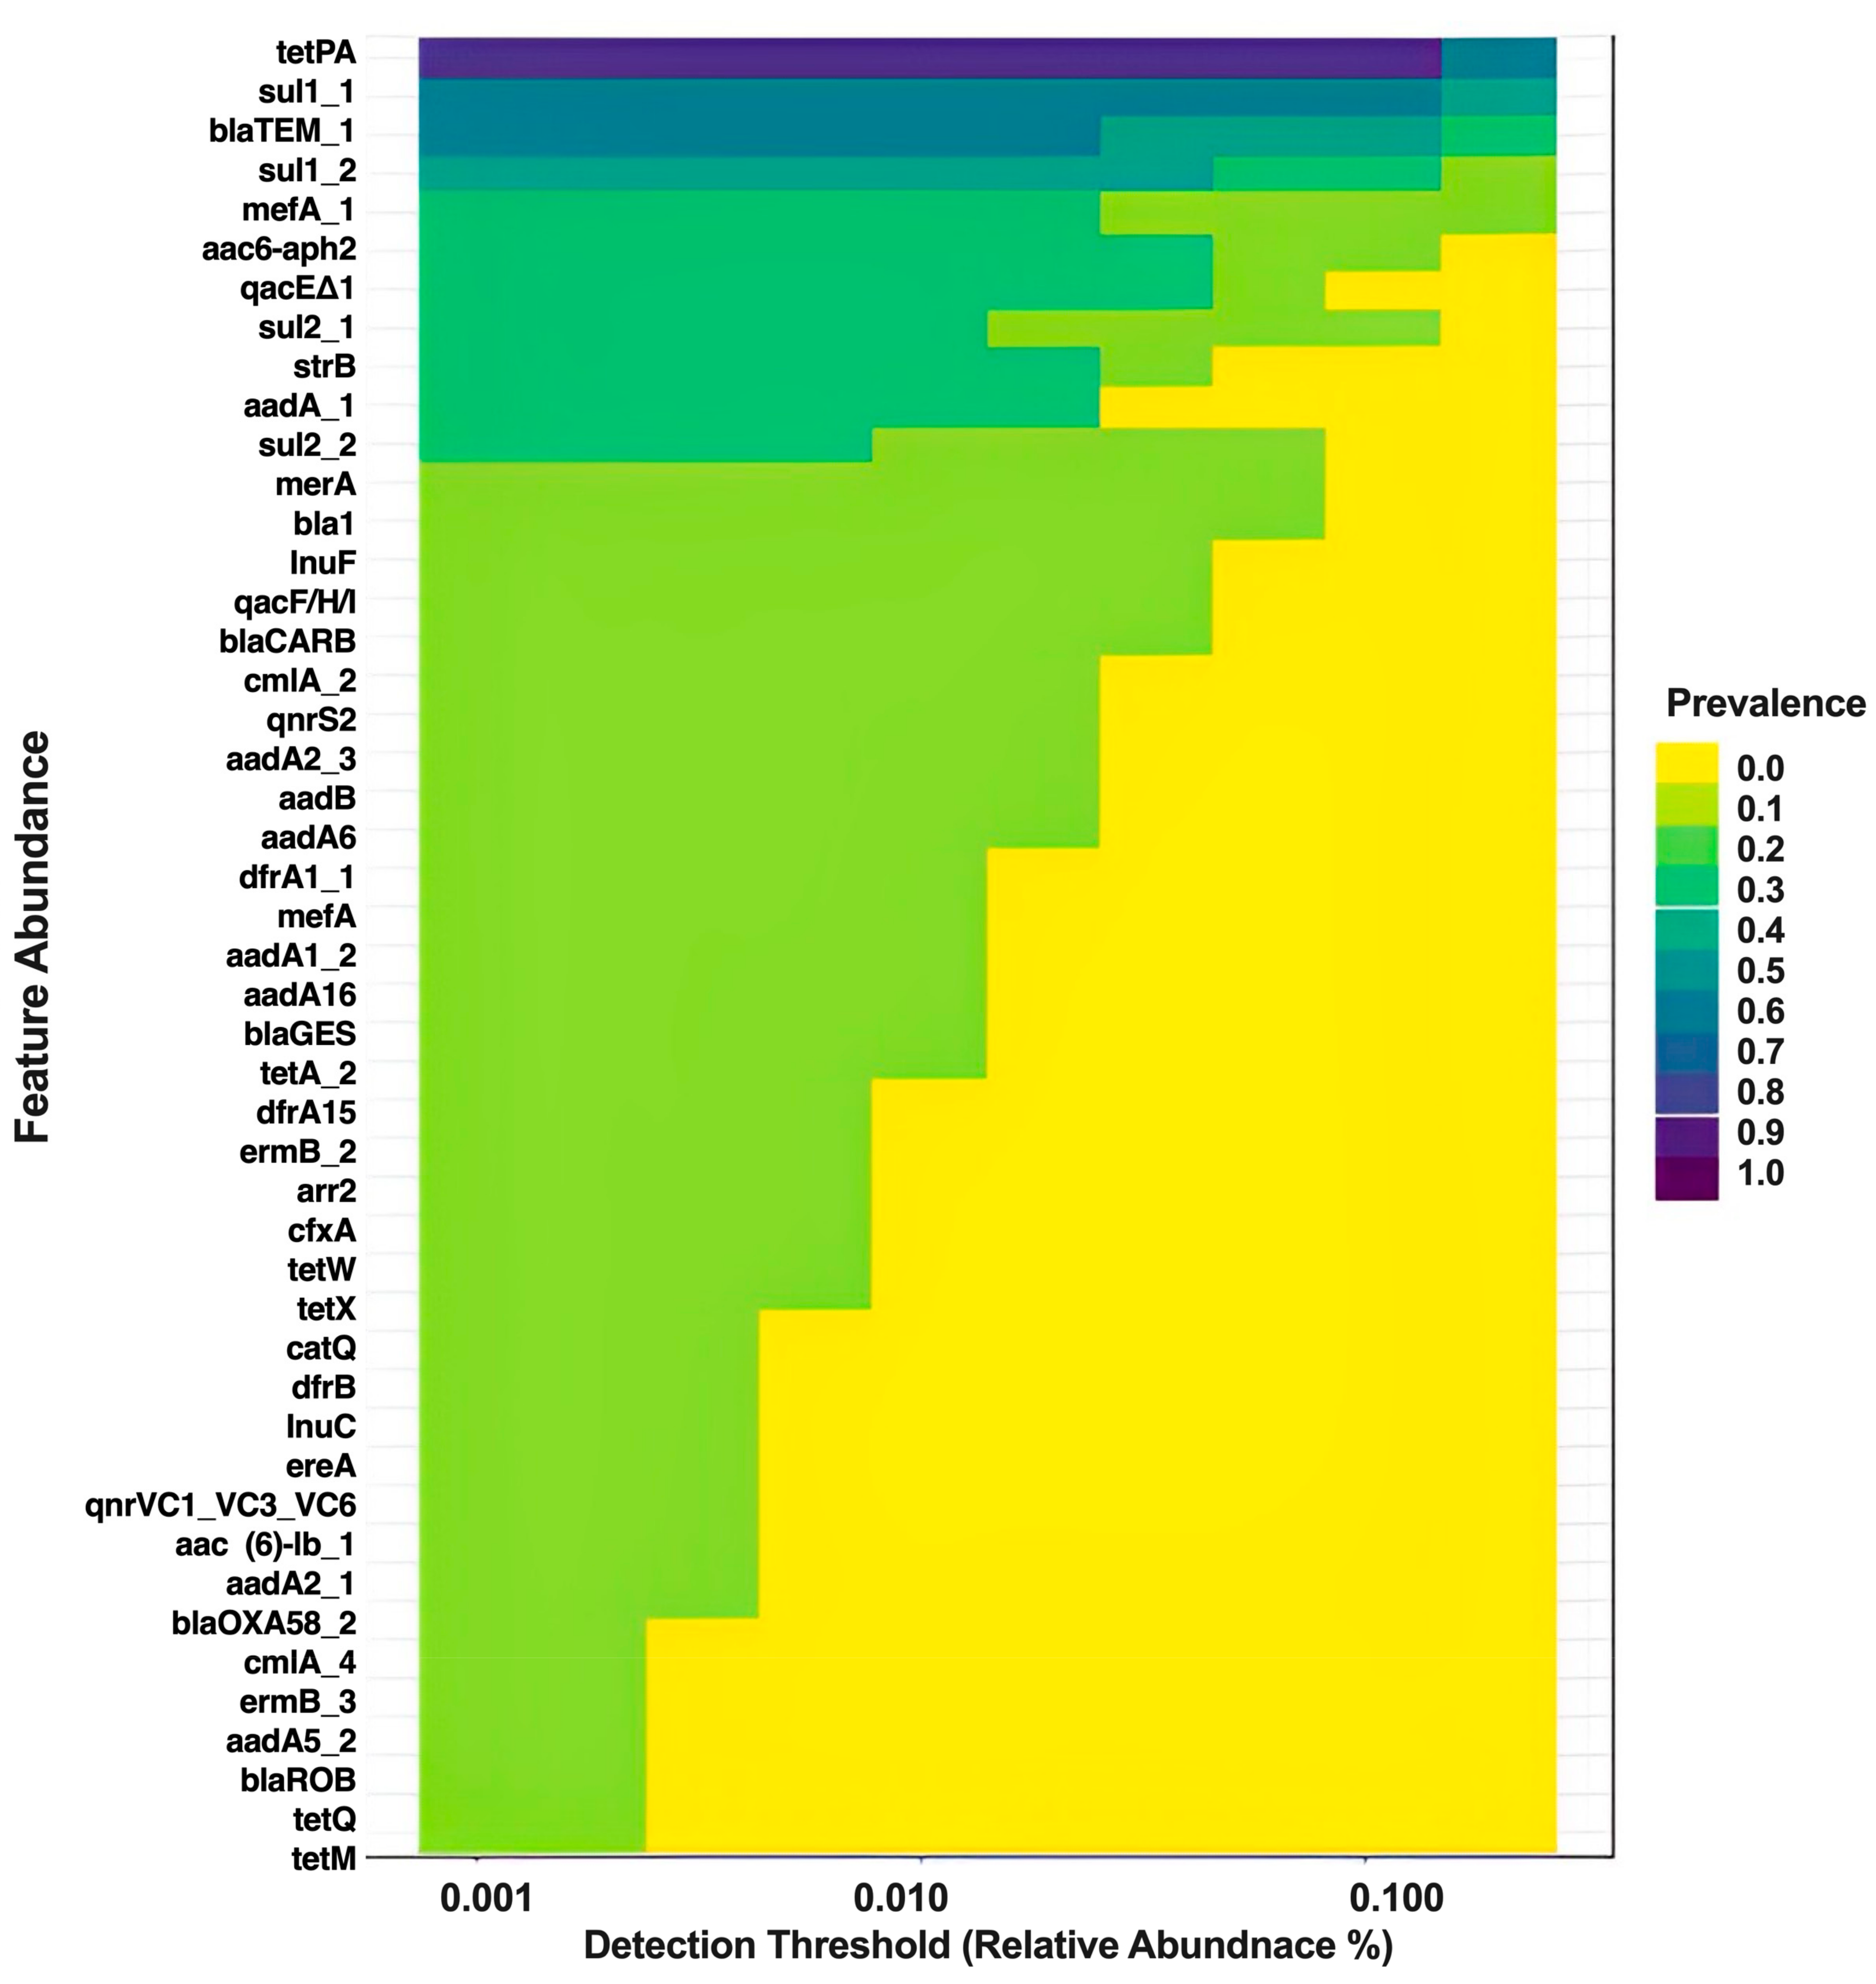
3.1.3. Core Resistome

The core resistome analysis on the HT-qPCR dataset revealed 47 genes to be prevalent in at least 10% of the samples (Figure 2). The gene with the highest prevalence was tetPA, followed by sul1_1, blaTEM_1, sul1_2, and so on.

3.1.4. Taxonomic Profiles

The HT-qPCR panel possessed the markers for two bacterial families viz. Bacteroidetes and Firmicutes, as well as six pathogenic bacterial genera such as Acinetobacter baumanii, Campylobacter, Enterococci, Klebsiella pneumonia, Pseudomonas aeruginosa, and Staphylococcus. Amplification products were obtained only for the two bacterial families. The relative abundance (RA%) is shown in Table 2. The RA % for Bacterioidetes ranged between 0.13 and 1.27, whereas for Firmicutes it was between 0.11 and 0.55. None of the bacterial genera were positive at any of the sites. The 16S rRNA gene showed an RA% of 1.00 in all the samples, suggesting the presence of other bacterial families/genera at these locations.

3.2. Comparative Analysis of HT-qPCR with Shotgun Metagenomic Sequencing

Both the HT-qPCR and SMS methods identified ARGs, MGEs, and integrons in the collected specimens. The number, types, and class of genes discovered with SMS were much higher than HT-qPCR [28]. Detailed descriptions of the number of genes and drug classes identified using the two methods are provided in the following text. The pros and cons of both methods have been discussed as well.

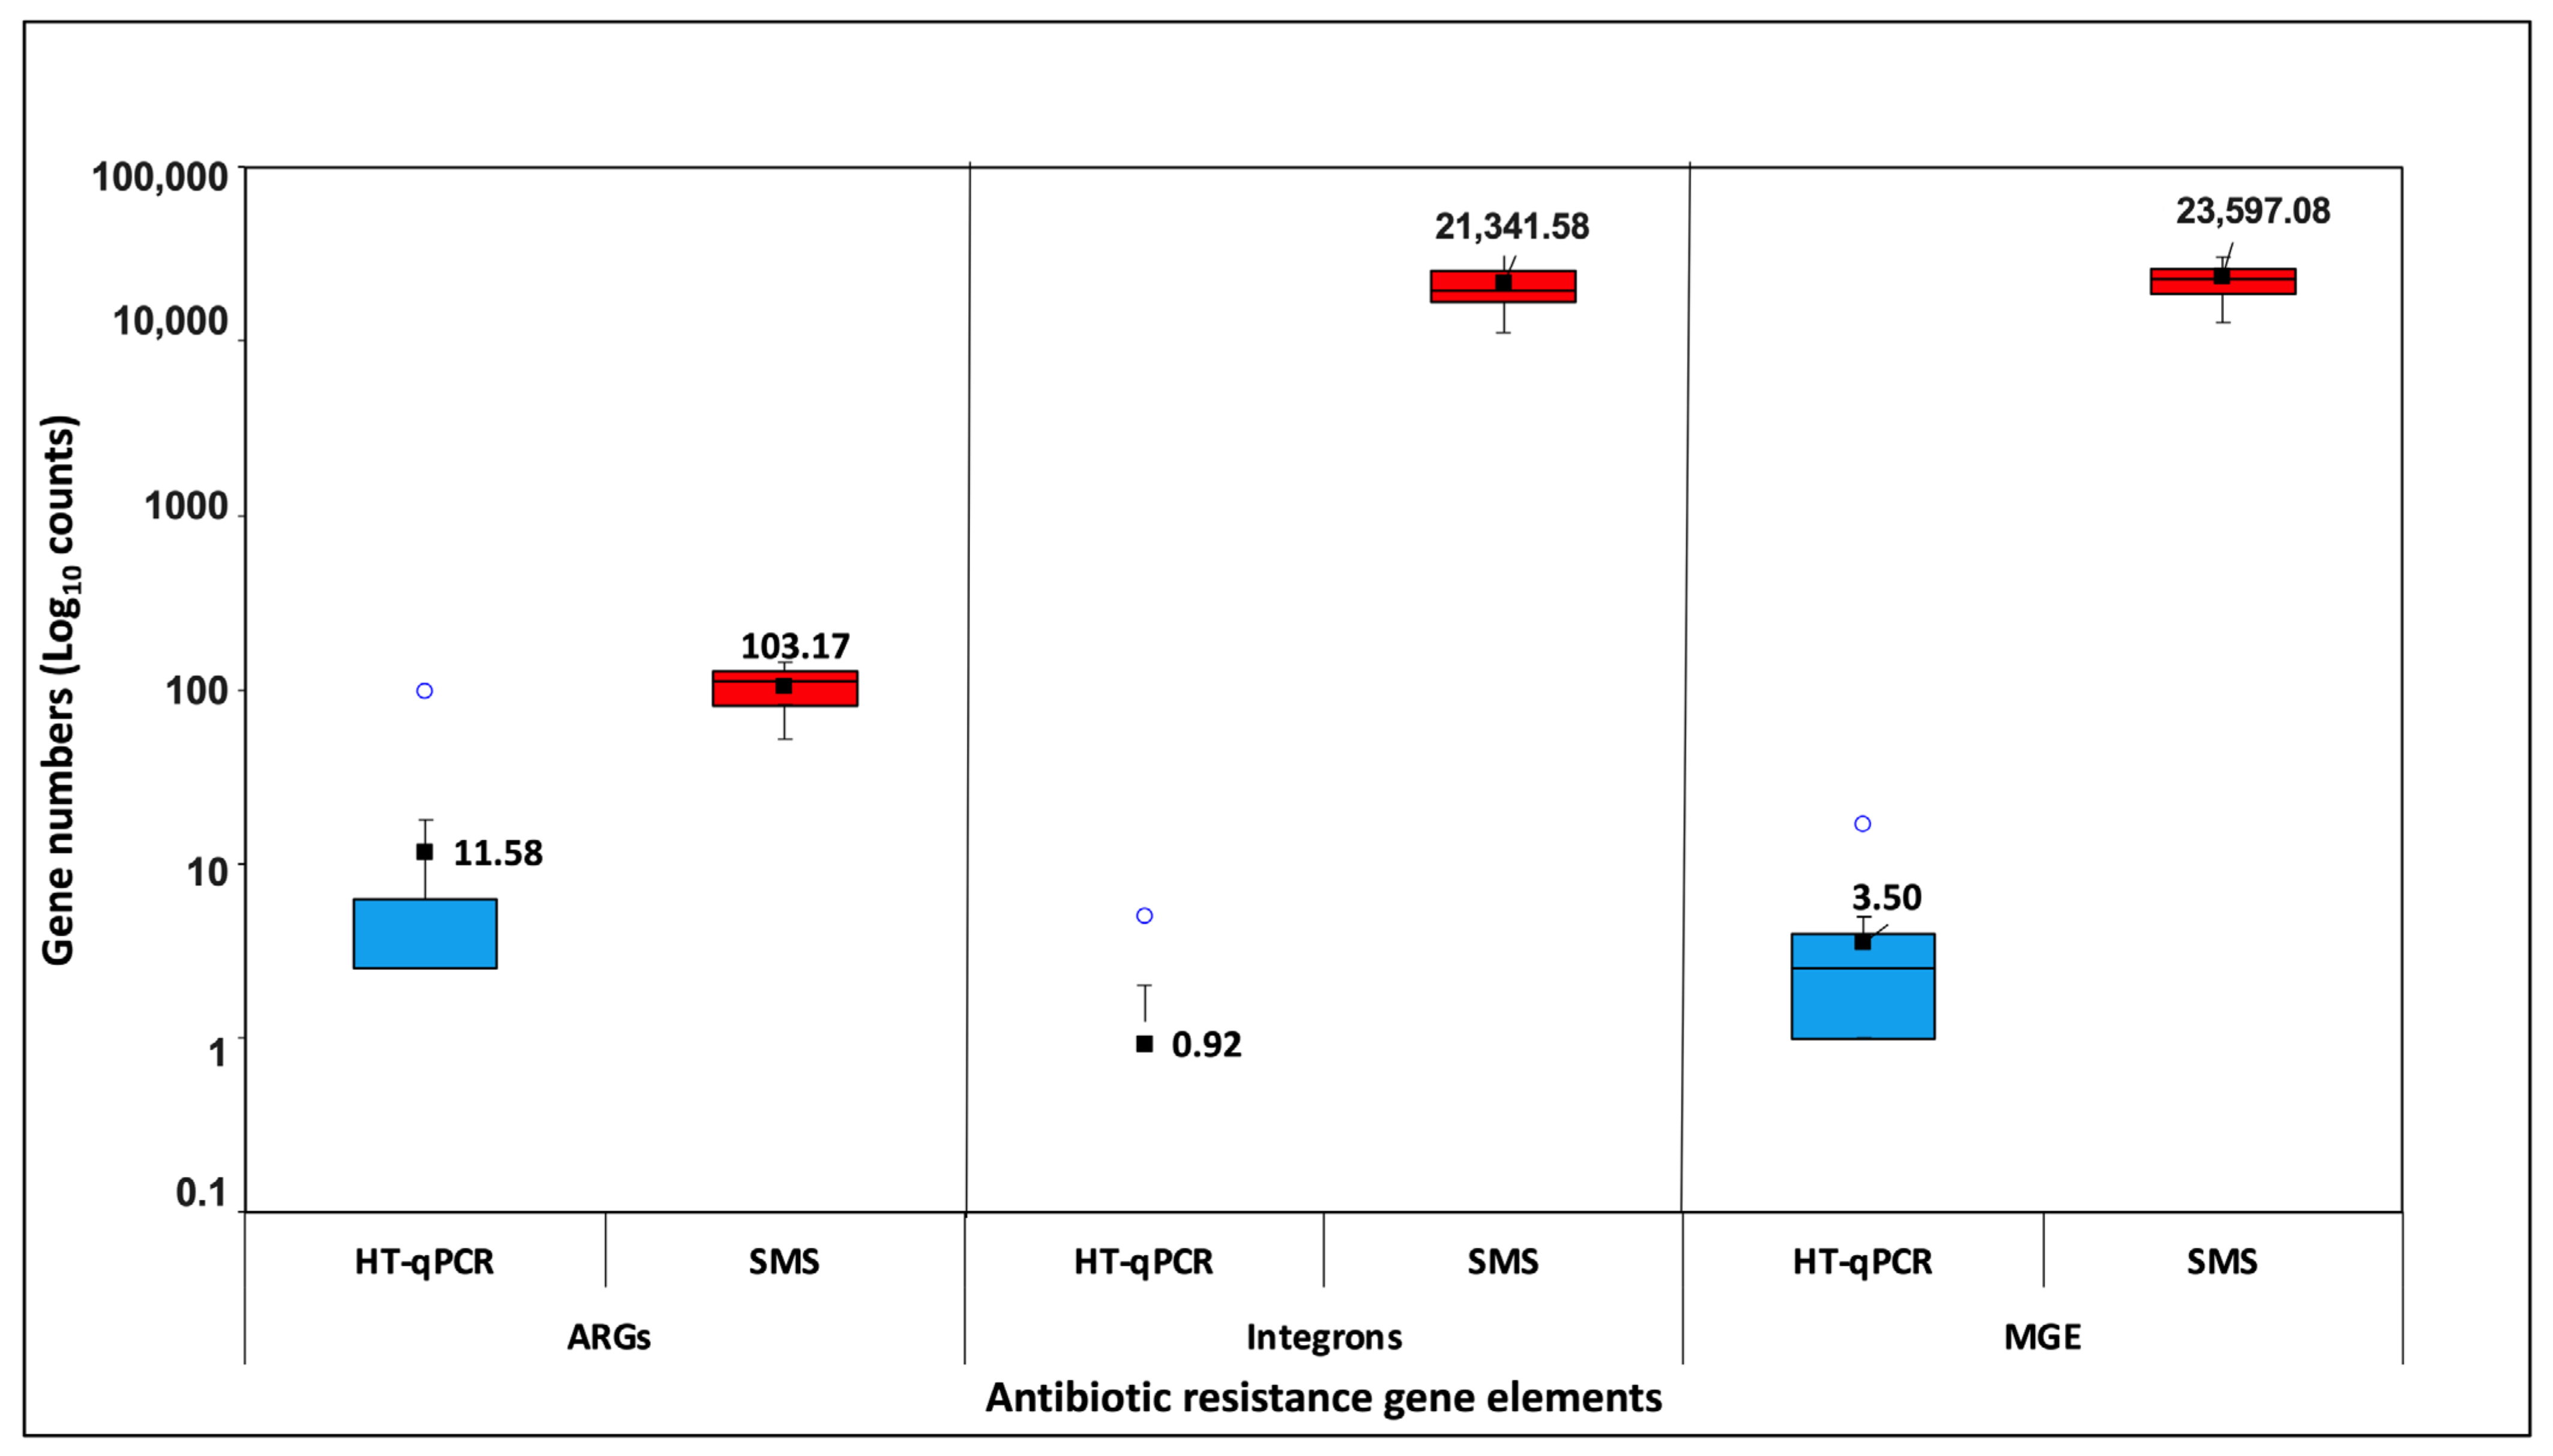
3.2.1. Gene Numbers/Richness

While the HT-qPCR method picked 100 ARGs, the SMS method captured gene sequences of 402 ARGs to be distributed among 12 sediment samples (Table S2). A total of 5 integrons (classes I, II, and III) were captured using the HT-qPCR method, whereas the SMS filtered 168 class 1 integron (intl1) sequences from the integral database. About 18 MGEs were identified with the HT-qPCR assay. These included transposons, plasmids, and insertion sequences. In the SMS approach, the sequences aligned against the plasmid finder returned 1567 matches. The log counts of each gene category are presented in Figure 3. The average number of ARGs using the HT-qPCR method per site was 11.58 as compared to 103.17 using SMS. The mean number of integrons was 0.92 and 21,341.58 using HT-qPCR and SMS methods, respectively. On average, 3.50 MGEs were recorded with HT-qPCR per site, whereas 23,597.08 were captured with SMS.

3.2.2. Core Resistomes

Contrary to the HT-qPCR resistome, the SMS profile was much more comprehensive, with >300 genes present in 10% of samples. The most dominant gene was patA, followed by mexN, adeF, AcrF, TaeA, etc. (Figure 4).

3.2.3. Drug Classes

The gene classes recorded with the SMS method were more in numbers (28) and diversity. In agreement with the HT-qPCR method, beta-lactams (cephalosporins. Cephamycin, carbapenem, penam, penem, and monobactam) dominated the gene classes (37%). This was followed by macrolides (19%) and tetracycline (7%). The remaining gene classes were fluoroquinolone (6%), lincosamide (4%), phenicol (4%), streptogramin (4%), peptide (3%), glycopeptide (3%), aminocoumarin (3%), diaminopyrimidine (trimethoprim) (2%), rifamycin (2%), glycylcycline (1%), acridine dye (1%), triclosan (1%), pleuromutilin (1%), sulfonamides (1%), and fosfomycin (1%) (Figure 5a). In addition to these, low-abundance genes (<1.0%) such as Nucleoside, Oxazolidinone, Fusidic acid, Mupirocin, Elfamycin, Nitroimidazole, Antibacterial free fatty acids, and Nitrofuran were also picked with the SMS method (Figure 5b).
The HT-qPCR is limited in capturing the low copy numbers of genes (<10). This is most likely the reason for null amplification at sites 6, 9, 10, 11, and 12 (Figure 5c). With the SMS method, genes belonging to these drug classes were observed at all the sites (Figure 5d), suggesting the ability of SMS to capture even the low-abundance gene, where less than ten copies of genes were present. As evident from Figure 5d, many genes exhibited resistance against multiple drugs. This was missed with the HT-qPCR assay.

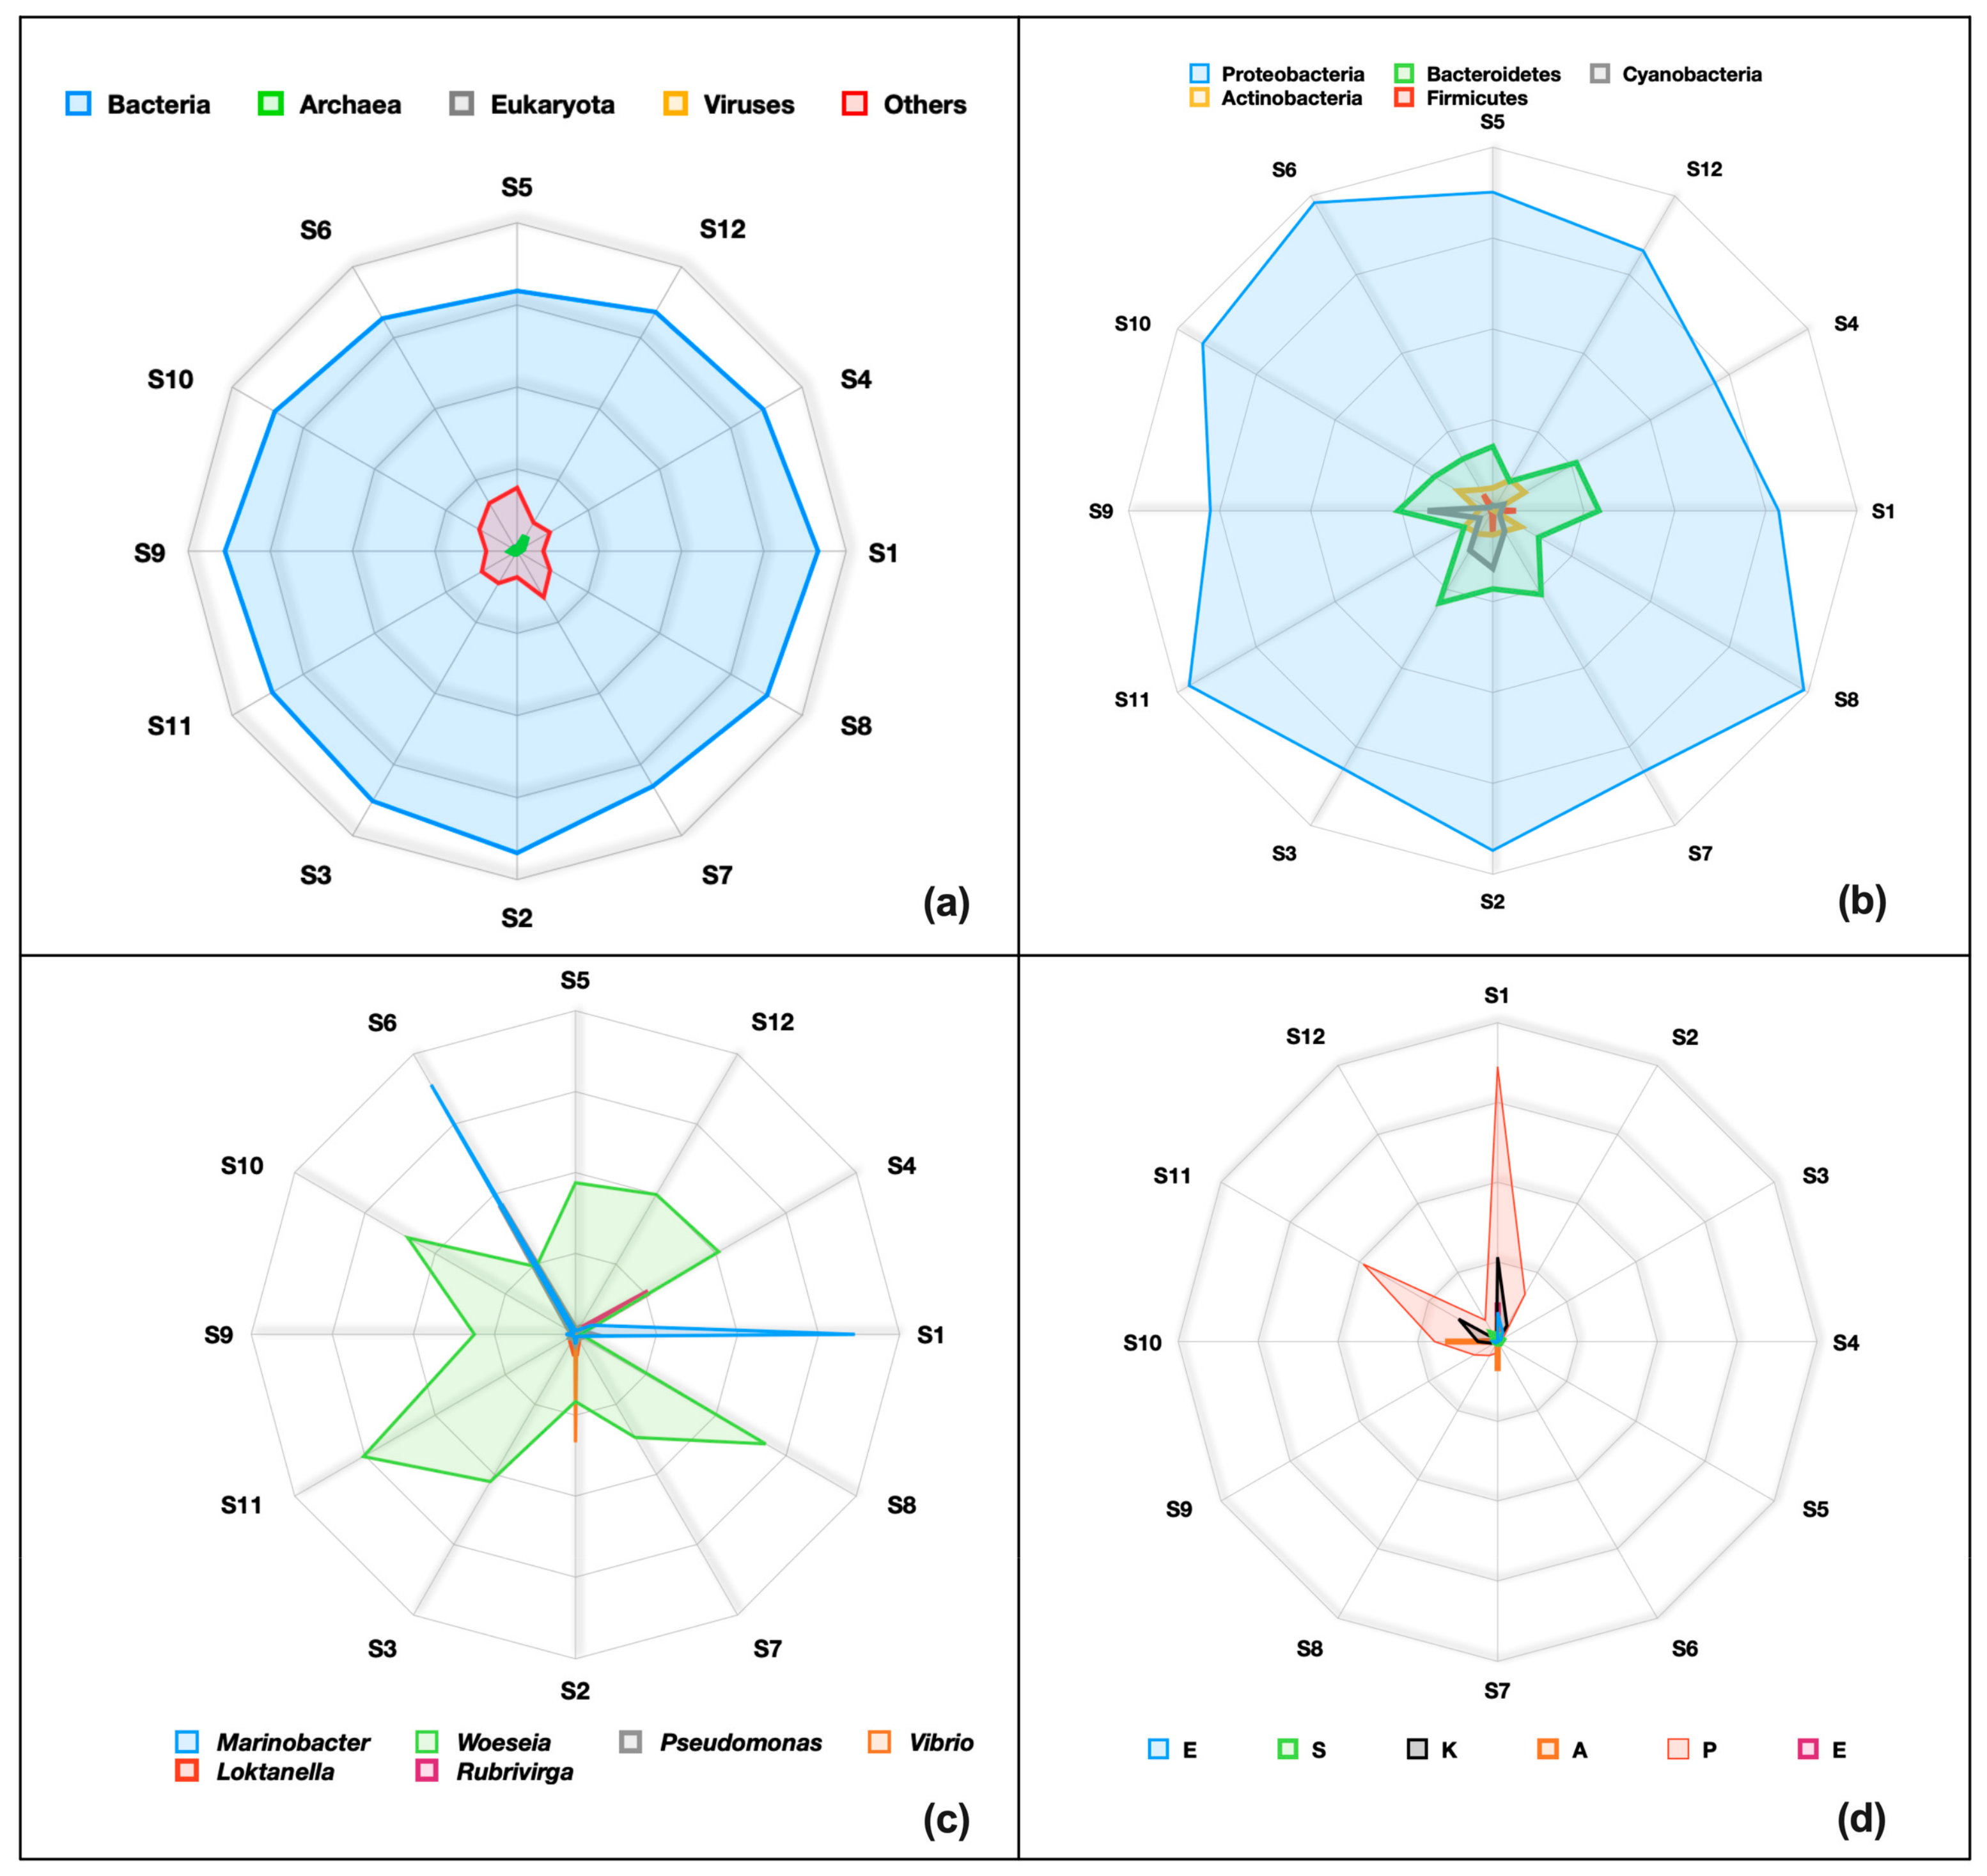
3.2.4. Taxonomic Profiling via Shotgun Metagenomic Sequencing

Unlike the HT-qPCR assay, the taxonomic binning of the predicted ORFs in the SMS method captured the presence of all the microbial domains (~87%). Some other communities (12%), most likely the higher organisms, were also found in the present samples. Among the microbial population, overwhelming abundances of bacteria (86%) were recorded whereas only 1% were Archaea (Figure 6a) and <0.001% were viruses as well as Eukaryota. The number of sequences affiliated with each bacterial phyla in the sediment samples exhibited a dominance of Proteobacteria (Min 42% at S4 and Max 59% at S8) followed by Bacteroidetes (Min 6% at S12 and Max 18% at S3), Cyanobacteria (Min 1% at S5, S12, S1, S6, S10, and S8 and Max 10% at S2), Actinobacteria (Min 0.3 at S1 and Max 6.5% at S10), and Firmicutes (0.0–4%) (Figure 6b). The selective primers set in the HT-qPCR only amplified Bacteroidetes and Firmicutes DNA. The dominant genera were Woeseia (Min 0.2% at S1 and Max 10.6% at S11), Marinobacter (Min 0.1% at S5, S8, S7, S3, S11, and S10 and Max 12% at S1 and S6), Pseudomonas (Min 0.1% at S5, S7, and S11 and Max. −6.5% at S6), Vibrio (Max 4.7% at S2), Loktanella (Max. 3.8% at S6), and Rubrivirga (Max. 3.6% at S4), (Figure 6c). Among the prevalent genera, species of Vibrio and Pseudomonas are pathogenic. In addition to these ESKAPE (E-Enterobacter sps.; S-Staphylococcus aureus; K-Klebsiella pneumonia; A-Acinetobacter baumanii; P-Pseudomonas aeruginosa; and E-Enterococcus faecium) pathogens were found in very low abundances (Figure 6d). None of these pathogenic forms or ESKAPE genera were amplified with the HT-qPCR primers. ESKAPE are the WHO-listed priority genera that call for immediate attention while monitoring AMR.

4. Discussion

Molecular methods successfully captured the antibiotic resistance gene elements (ARGEs) in the present study. Owing to the diverse nature of marine ecosystems, the SMS method was more comprehensive and informative compared to HT-qPCR. Our results completely agreed with the resistome profiles of a freshwater reservoir in Xiamen, China [28], mapped through similar approaches.

4.1. Target Genes and Primers in HT-qPCR

The primer sets in HT-qPCR targeted ARGs from 11 major classes including aminoglycosides, amphenicol, beta-lactams, sulphonamides, trimethoprim, multidrug resistance (MDR), florfenicol, MLSB, tetracycline, quinolone, and vancomycin. Of these genes, eight families were detected in at least one location. The main reason behind the fewer ARGEs captured with HT-qPCR is the limited number of primers available for target genes. The primers are designed based on the genes accessible in the common databases of CARD [49], ResFinder [50], Argannot [51], Megares [52], Plasmidfinder [53], Integral [54], and Isfinder [55]. Although novel genes are being added to these databases at a rapid pace strengthening the feasibility of additional primers, however, the time taken for validation of primers should be appropriated. The SMS method, on the other hand, does not depend on any primers, rather the complete sequences of the environmental DNA at a reasonably high depth are practically viable for richer ARGE descriptions. The same justification applies for the taxonomic profiling.

4.2. PCR Biases and Artefacts

PCR biases are common in qPCR assays [56]. It is important to give a thought to the denaturation and annealing regimes for multiple primers in the same assay. In the present study, we simultaneously amplified 296 genes, and it is quite possible that the conditions optimum for a group of primers might not be amiable for others. The SMS method on the other hand did not involve any PCR step except for the adapter and index ligation procedures. These steps involve very few cycles and hence the chances of amplification biases are rare. Similarly, higher CT values may not be representative of environmental concentration as amplification bias exists [57].

4.3. Low Abundance

Environmental samples are challenging regarding the biological yield [57,58,59,60]. Among the aquatic environments, marine sediments are vulnerable as co-precipitation of inhibitory substances makes DNA recovery difficult [57,58]. In the present samples, very low DNA yields were obtained (30–998 ngs) [46]. Although multiple isolation was conducted and a pool of DNA samples was used, genes with a low abundance of less than 10 copies were still missed in the HT-qPCR assay [61]. The sequencing by synthesis chemistry in the SMS application and paired-end sequencing at 2 × 150 bp generated 6 GB of data per sample. This sequencing depth was satisfactory for capturing genes with RA% as low as 0.001%. However, increasing the sequencing coverage by up to 12 GB of data per sample would be more reliable in predicting the rare genes [62]. The low abundance of pathogenic microbes in marine environments corroborates the few microbial genes captured using the HT-qPCR assays as compared to the significantly diverse microbial community composition with the SMS method [44].

4.4. Costing and Skills

Although the SMS method is considered cost-intensive, in the present study, surprisingly, the per-sample cost of HT-qPCR was USD 875, whereas the sequencing price was USD 320. An in-house qPCR assay for mapping ARGs from aerosols was also conducted at a comparable price [63]. In yet another study, the SMS was conducted for USD 200 for 10 Gb of data [28]. It is also important to note that the sequencing prices include the bioinformatics analysis. Prices vary depending on the service providers, the platform used, and even the country where these facilities are available. Shipment costs of kits and consumables are also region- and country-bound. The SMS prices are based on sequence providers located in India, China, and Korea, whereas the HT-qPCR costs were obtained from some European countries. A higher skill level was still required for data interpretation and secondary analysis of SMS results. Online freely available visualization software such as MicrobiomeAnalyst [47,64,65] and ResistoXplorer [47] are quite user-friendly and easy to use. The total time taken to analyze HT-qPCR was superior as the results were obtained on the same day; however, the sequencing data were generated in about four weeks’ time.

5. Conclusions

We noticed differences in the types and concentrations reported with the HT-qPCR and SMS methods. Considering the reduced cost and ease of availability of analytical software, the SMS approach is a more comprehensive tool for environmental monitoring and surveys if the data processing time is not a constraint. However, if the data are required quickly, HT-qPCR certainly has an edge over SMS.

Supplementary Materials

The following supporting information can be downloaded at https://www.mdpi.com/article/10.3390/app132011229/s1, Table S1: Abundances of gene ids revealed by HT-qPCR assay; Table S2: Abundances of gene ids revealed by SMS approach.

Author Contributions

Conceptualization, N.H. and S.U.; Formal analysis, M.B., H.A.A.-S., M.K. and F.Z.; Funding acquisition, N.H. and S.U.; Investigation, S.U., M.K. and N.A.; Methodology, W.A.-Z., N.A., A.S. and F.Z.; Project administration, M.B. and H.A.A.-S.; Resources, S.U., W.A.-Z. and M.B.; Software, N.H. and A.S.; Validation, H.A.A.-S. and A.S.; Visualization, N.H.; Writing—original draft, N.H.; Writing—review and editing, N.H. and S.U. All authors have read and agreed to the published version of the manuscript.

Funding

This study was supported by the Kuwait Institute for Scientific Research grant no. EM123C.

Institutional Review Board Statement

Not applicable.

Informed Consent Statement

Not applicable.

Data Availability Statement

All the data of the HT-qPCR are presented within the manuscript or the Supplementary Files. The sequences have been deposited to the National Centre for Biotechnology Information (NCBI) and can be accessed under accession number PRJNA819259.

Acknowledgments

The authors are thankful to the Kuwait Institute for Scientific Research for supporting this study.

Conflicts of Interest

The authors declare no conflict of interest.

References

  1. Kim, D.-W.; Cha, C.-J. Antibiotic resistome from the One-Health perspective: Understanding and controlling antimicrobial resistance transmission. Exp. Mol. Med. 2021, 53, 301–309. [Google Scholar] [CrossRef] [PubMed]
  2. Thompson, T.; The staggering death toll of drug-resistant bacteria. Nature 2022. Available online: https://www.nature.com/articles/d41586-022-00228-x (accessed on 9 October 2023).
  3. World Health Organization. Antimicrobial Resistance: Global Report on Surveillance; World Health Organization: Geneva, Switzerland, 2014. [Google Scholar]
  4. Asokan, G.V.; Vanitha, A. WHO global priority pathogens list on antibiotic resistance: An urgent need for action to in tegrate One Health data. Perspect. Public Health 2018, 138, 87–88. [Google Scholar]
  5. Berendonk, T.U.; Manaia, C.M.; Merlin, C.; Fatta-Kassinos, D.; Cytryn, E.; Walsh, F.; Bürgmann, H.; Sørum, H.; Norström, M.; Pons, M.-N. Tackling antibiotic resistance: The environmental framework. Nat. Rev. Microbiol. 2015, 13, 310–317. [Google Scholar] [CrossRef] [PubMed]
  6. Hernando-Amado, S.; Coque, T.M.; Baquero, F.; Martínez, J.L. Defining and combating antibiotic resistance from One Health and Global Health perspectives. Nat. Microbiol. 2019, 4, 1432–1442. [Google Scholar] [CrossRef] [PubMed]
  7. Tooke, C.L.; Hinchliffe, P.; Bragginton, E.C.; Colenso, C.K.; Hirvonen, V.H.; Takebayashi, Y.; Spencer, J. β-Lactamases and β-Lactamase Inhibitors in the 21st Century. J. Mol. Biol. 2019, 431, 3472–3500. [Google Scholar] [CrossRef] [PubMed]
  8. Patel, P.; Wermuth, H.R.; Calhoun, C.; Hall, G.A. Antibiotics. In Continuing Education Activity; StatPearls Publishing: Treasure Island, FL, USA, 2023. [Google Scholar]
  9. Pournajaf, A.; Ardebili, A.; Goudarzi, L.; Khodabandeh, M.; Narimani, T.; Abbaszadeh, H. PCR-based identification of methicillin–resistant Staphylococcus aureus strains and their antibiotic resistance profiles. Asian Pac. J. Trop. Biomed. 2014, 4, S293–S297. [Google Scholar] [CrossRef]
  10. Roe, C.C.; Vazquez, A.J.; Esposito, E.P.; Zarrilli, R.; Sahl, J.W. Diversity, virulence, and antimicrobial resistance in isolates from the newly emerging Klebsiella pneumoniae ST101 lineage. Front. Microbiol. 2019, 10, 542. [Google Scholar] [CrossRef]
  11. Hu, Y.; Zhu, K.; Jin, D.; Shen, W.; Liu, C.; Zhou, H.; Zhang, R. Evaluation of IR Biotyper for carbapenem-resistant Pseudomonas aeruginosa typing and its application potential for the investigation of nosocomial infection. Front. Microbiol. 2023, 14, 1068872. [Google Scholar] [CrossRef]
  12. Benveniste, R.; Davies, J. Aminoglycoside antibiotic-inactivating enzymes in actinomycetes similar to those present in clinical isolates of antibiotic-resistant bacteria. Proc. Natl. Acad. Sci. USA 1973, 70, 2276–2280. [Google Scholar] [CrossRef]
  13. Ocheretina, O.; Escuyer, V.E.; Mabou, M.-M.; Royal-Mardi, G.; Collins, S.; Vilbrun, S.C.; Pape, J.W.; Fitzgerald, D.W. Correlation between genotypic and phenotypic testing for resistance to rifampin in Mycobacterium tuberculosis clinical isolates in Haiti: Investigation of cases with discrepant susceptibility results. PLoS ONE 2014, 9, e90569. [Google Scholar] [CrossRef]
  14. Ryu, S.-H.; Park, S.-G.; Choi, S.-M.; Hwang, Y.-O.; Ham, H.-J.; Kim, S.-U.; Lee, Y.-K.; Kim, M.-S.; Park, G.-Y.; Kim, K.-S. Antimicrobial resistance and resistance genes in Escherichia coli strains isolated from commercial fish and seafood. Int. J. Food Microbiol. 2012, 152, 14–18. [Google Scholar] [CrossRef] [PubMed]
  15. Burakoff, A.; Brown, K.; Knutsen, J.; Hopewell, C.; Rowe, S.; Bennett, C.; Cronquist, A. Outbreak of fluoroquinolone-resistant Campylobacter jejuni infections associated with raw milk consumption from a herdshare dairy—Colorado, 2016. Morb. Mortal. Wkly. Rep. 2018, 67, 146. [Google Scholar] [CrossRef] [PubMed]
  16. Gambino, D.; Sciortino, S.; Migliore, S.; Galuppo, L.; Puleio, R.; Dara, S.; Vicari, D.; Seminara, S.; Gargano, V. Preliminary Results on the Prevalence of Salmonella spp. in Marine Animals Stranded in Sicilian Coasts: Antibiotic Susceptibility Profile and ARGs Detection in the Isolated Strains. Pathogens 2021, 10, 930. [Google Scholar] [CrossRef]
  17. Al-Sarawi, H.A.; Najem, A.B.; Lyons, B.P.; Uddin, S.; Al-Sarawi, M.A. Antimicrobial Resistance in Escherichia coli Isolated from Marine Sediment Samples from Kuwait Bay. Sustainability 2022, 14, 11325. [Google Scholar] [CrossRef]
  18. Koczura, R.; Mokracka, J.; Jabłońska, L.; Gozdecka, E.; Kubek, M.; Kaznowski, A. Antimicrobial resistance of integron-harboring Escherichia coli isolates from clinical samples, wastewater treatment plant and river water. Sci. Total Environ. 2012, 414, 680–685. [Google Scholar] [CrossRef]
  19. Kotlarska, E.; Łuczkiewicz, A.; Pisowacka, M.; Burzyński, A. Antibiotic resistance and prevalence of class 1 and 2 integrons in Escherichia coli isolated from two wastewater treatment plants, and their receiving waters (Gulf of Gdansk, Baltic Sea, Poland). Environ. Sci. Pollut. Res. 2015, 22, 2018–2030. [Google Scholar] [CrossRef]
  20. Perry, J.A.; Wright, G.D. The antibiotic resistance “mobilome”: Searching for the link between environment and clinic. Front. Microbiol. 2013, 4, 138. [Google Scholar] [CrossRef]
  21. Perry, J.A.; Wright, G.D. Forces shaping the antibiotic resistome. BioEssays 2014, 36, 1179–1184. [Google Scholar] [CrossRef]
  22. Wu, J.; Wang, J.; Li, Z.; Guo, S.; Li, K.; Xu, P.; Ok, Y.S.; Jones, D.L.; Zou, J. Antibiotics and antibiotic resistance genes in agricultural soils: A systematic analysis. Crit. Rev. Environ. Sci. Technol. 2023, 53, 847–864. [Google Scholar] [CrossRef]
  23. Qiao, M.; Ying, G.-G.; Singer, A.C.; Zhu, Y.-G. Review of antibiotic resistance in China and its environment. Environ. Int. 2018, 110, 160–172. [Google Scholar] [CrossRef]
  24. Mootapally, C.; Nathani, N.M.; Poriya, P.; Beleem, I.; Dabhi, J.C.; Gadhvi, I.R.; Joshi, C.G. Antibiotic Resistome Biomarkers associated to the pelagic Sediments of the Gulfs of Kathiawar peninsula and Arabian Sea. Sci. Rep. 2019, 9, 17281. [Google Scholar] [CrossRef] [PubMed]
  25. Nathani, N.M.; Mootapally, C.; Dave, B.P. Antibiotic resistance genes allied to the pelagic sediment microbiome in the Gulf of Khambhat and Arabian Sea. Sci. Total Environ. 2019, 653, 446–454. [Google Scholar] [CrossRef] [PubMed]
  26. Waseem, H.; ur Rehman, H.S.; Ali, J.; Iqbal, M.J.; Ali, M.I. Global trends in ARGs measured by HT-qPCR platforms. In Antibiotics and Antimicrobial Resistance Genes in the Environment; Elsevier: Amsterdam, The Netherlands, 2020; pp. 206–222. [Google Scholar]
  27. Lai, F.Y.; Muziasari, W.; Virta, M.; Wiberg, K.; Ahrens, L. Profiles of environmental antibiotic resistomes in the urban aquatic recipients of Sweden using high-throughput quantitative PCR analysis. Environ. Pollut. 2021, 287, 117651. [Google Scholar] [CrossRef] [PubMed]
  28. Liu, X.; Xiao, P.; Guo, Y.; Liu, L.; Yang, J. The impacts of different high-throughput profiling approaches on the understanding of bacterial antibiotic resistance genes in a freshwater reservoir. Sci. Total Environ. 2019, 693, 133585. [Google Scholar] [CrossRef]
  29. Waseem, H.; Jameel, S.; Ali, J.; Saleem Ur Rehman, H.; Tauseef, I.; Farooq, U.; Jamal, A.; Ali, M.I. Contributions and challenges of high throughput qPCR for determining antimicrobial resistance in the environment: A critical review. Molecules 2019, 24, 163. [Google Scholar] [CrossRef]
  30. Wu, D.; Jin, L.; Xie, J.; Liu, H.; Zhao, J.; Ye, D.; Li, X.-d. Inhalable antibiotic resistomes emitted from hospitals: Metagenomic insights into bacterial hosts, clinical relevance, and environmental risks. Microbiome 2022, 10, 19. [Google Scholar] [CrossRef]
  31. Li, X.; Wu, Z.; Dang, C.; Zhang, M.; Zhao, B.; Cheng, Z.; Chen, L.; Zhong, Z.; Ye, Y.; Xia, Y. A metagenomic-based method to study hospital air dust resistome. Chem. Eng. J. 2021, 406, 126854. [Google Scholar] [CrossRef]
  32. Kamathewatta, K.I.; Bushell, R.N.; Young, N.D.; Stevenson, M.A.; Billman-Jacobe, H.; Browning, G.F.; Marenda, M.S. Exploration of antibiotic resistance risks in a veterinary teaching hospital with Oxford Nanopore long read sequencing. PLoS ONE 2019, 14, e0217600. [Google Scholar] [CrossRef]
  33. Chng, K.R.; Li, C.; Bertrand, D.; Ng, A.H.Q.; Kwah, J.S.; Low, H.M.; Tong, C.; Natrajan, M.; Zhang, M.H.; Xu, L.; et al. Cartography of opportunistic pathogens and antibiotic resistance genes in a tertiary hospital environment. Nat. Med. 2020, 26, 941–951. [Google Scholar] [CrossRef]
  34. Cui, H.; Zhang, C.; Zhao, K.; Liu, J.; Pu, J.; Kong, Y.; Dong, S.; Chen, L.; Zhao, Y.; Chen, Y. Effects of different laying periods on airborne bacterial diversity and antibiotic resistance genes in layer hen houses. Int. J. Hyg. Environ. Health 2023, 251, 114173. [Google Scholar] [CrossRef]
  35. Li, L.; Wang, Q.; Bi, W.; Hou, J.; Xue, Y.; Mao, D.; Das, R.; Luo, Y.; Li, X. Municipal solid waste treatment system increases ambient airborne bacteria and antibiotic resistance genes. Environ. Sci. Technol. 2020, 54, 3900–3908. [Google Scholar] [CrossRef] [PubMed]
  36. Yang, T.; Jiang, L.; Bi, X.; Cheng, L.; Zheng, X.; Wang, X.; Zhou, X. Submicron aerosols share potential pathogens and antibiotic resistomes with wastewater or sludge. Sci. Total Environ. 2022, 821, 153521. [Google Scholar] [CrossRef] [PubMed]
  37. Xie, J.; Jin, L.; Wu, D.; Pruden, A.; Li, X. Inhalable antibiotic resistome from wastewater treatment plants to urban areas: Bacterial hosts, dissemination risks, and source contributions. Environ. Sci. Technol. 2022, 56, 7040–7051. [Google Scholar] [CrossRef] [PubMed]
  38. He, P.; Wu, Y.; Huang, W.; Wu, X.; Lv, J.; Liu, P.; Bu, L.; Bai, Z.; Chen, S.; Feng, W. Characteristics of and variation in airborne ARGs among urban hospitals and adjacent urban and suburban communities: A metagenomic approach. Environ. Int. 2020, 139, 105625. [Google Scholar] [CrossRef]
  39. Zhao, Y.; Wang, Q.; Chen, Z.; Mao, D.; Luo, Y. Significant higher airborne antibiotic resistance genes and the associated inhalation risk in the indoor than the outdoor. Environ. Pollut. 2021, 268, 115620. [Google Scholar] [CrossRef] [PubMed]
  40. Lü, F.; Wang, W.; Hu, T.; Duan, H.; Shao, L.; Zhang, H.; He, P. Release of airborne antibiotic resistance genes from municipal solid waste transfer stations. Sustain. Environ. Res. 2022, 32, 28. [Google Scholar] [CrossRef]
  41. Yang, F.; Gao, Y.; Zhao, H.; Li, J.; Cheng, X.; Meng, L.; Dong, P.; Yang, H.; Chen, S.; Zhu, J. Revealing the distribution characteristics of antibiotic resistance genes and bacterial communities in animal-aerosol-human in a chicken farm: From One-Health perspective. Ecotoxicol. Environ. Saf. 2021, 224, 112687. [Google Scholar] [CrossRef]
  42. Gevao, B.; Uddin, S.; Krishnan, D.; Rajagopalan, S.; Habibi, N. Antibiotics in Wastewater: Baseline of the Influent and Effluent Streams in Kuwait. Toxics 2022, 10, 174. [Google Scholar] [CrossRef]
  43. Gevao, B.; Uddin, S.; Dupont, S. Baseline concentrations of pharmaceuticals in Kuwait’s coastal marine environment. Mar. Pollut. Bull. 2021, 173, 113040. [Google Scholar] [CrossRef]
  44. Habibi, N.; Uddin, S.; Lyons, B.; Al-Sarawi, H.A.; Behbehani, M.; Shajan, A.; Razzack, N.A.; Zakir, F.; Alam, F. Antibiotic Resistance Genes Associated with Marine Surface Sediments: A Baseline from the Shores of Kuwait. Sustainability 2022, 14, 8029. [Google Scholar] [CrossRef]
  45. Muziasari, W.I.; Pitkänen, L.K.; Sørum, H.; Stedtfeld, R.D.; Tiedje, J.M.; Virta, M. Corrigendum: The resistome of farmed fish feces contributes to the enrichment of antibiotic resistance genes in sediments below Baltic Sea fish farms. Front. Microbiol. 2017, 8, 1491. [Google Scholar] [CrossRef] [PubMed]
  46. Habibi, N.; Uddin, S.; Al-Sarawi, H.; Aldhameer, A.; Shajan, A.; Zakir, F.; Abdul Razzack, N.; Alam, F. Metagenomes from Coastal Sediments of Kuwait: Insights into the Microbiome, Metabolic Functions and Resistome. Microorganisms 2023, 11, 531. [Google Scholar] [CrossRef] [PubMed]
  47. Dhariwal, A.; Junges, R.; Chen, T.; Petersen, F.C. ResistoXplorer: A web-based tool for visual, statistical and exploratory data analysis of resistome data. NAR Genom. Bioinform. 2021, 3, lqab018. [Google Scholar] [CrossRef] [PubMed]
  48. Anonymous. Statistics Kingdom. 2017. Available online: https://www.statskingdom.com (accessed on 17 January 2023).
  49. McArthur, A.G.; Waglechner, N.; Nizam, F.; Yan, A.; Azad, M.A.; Baylay, A.J.; Bhullar, K.; Canova, M.J.; De Pascale, G.; Ejim, L. The comprehensive antibiotic resistance database. Antimicrob. Agents Chemother. 2013, 57, 3348–3357. [Google Scholar] [CrossRef] [PubMed]
  50. Bortolaia, V.; Kaas, R.S.; Ruppe, E.; Roberts, M.C.; Schwarz, S.; Cattoir, V.; Philippon, A.; Allesoe, R.L.; Rebelo, A.R.; Florensa, A.F. ResFinder 4.0 for predictions of phenotypes from genotypes. J. Antimicrob. Chemother. 2020, 75, 3491–3500. [Google Scholar] [CrossRef]
  51. Gupta, S.K.; Padmanabhan, B.R.; Diene, S.M.; Lopez-Rojas, R.; Kempf, M.; Landraud, L.; Rolain, J.-M. ARG-ANNOT, a new bioinformatic tool to discover antibiotic resistance genes in bacterial genomes. Antimicrob. Agents Chemother. 2014, 58, 212–220. [Google Scholar] [CrossRef]
  52. Doster, E.; Lakin, S.M.; Dean, C.J.; Wolfe, C.; Young, J.G.; Boucher, C.; Belk, K.E.; Noyes, N.R.; Morley, P.S. MEGARes 2.0: A database for classification of antimicrobial drug, biocide and metal resistance determinants in metagenomic sequence data. Nucleic Acids Res. 2020, 48, D561–D569. [Google Scholar] [CrossRef]
  53. Carattoli, A.; Hasman, H. PlasmidFinder and in silico pMLST: Identification and typing of plasmid replicons in whole-genome sequencing (WGS). In Horizontal Gene Transfer; Methods and Protocols; Springer: Berlin/Heidelberg, Germany, 2020; pp. 285–294. [Google Scholar]
  54. Moura, A.; Soares, M.; Pereira, C.; Leitão, N.; Henriques, I.; Correia, A. INTEGRALL: A database and search engine for integrons, integrases and gene cassettes. Bioinformatics 2009, 25, 1096–1098. [Google Scholar] [CrossRef]
  55. Siguier, P.; Pérochon, J.; Lestrade, L.; Mahillon, J.; Chandler, M. ISfinder: The reference centre for bacterial insertion sequences. Nucleic Acids Res. 2006, 34 (Suppl. S1), D32–D36. [Google Scholar] [CrossRef]
  56. Acinas, S.G.; Sarma-Rupavtarm, R.; Klepac-Ceraj, V.; Polz, M.F. PCR-induced sequence artifacts and bias: Insights from comparison of two 16S rRNA clone libraries constructed from the same sample. Appl. Environ. Microbiol. 2005, 71, 8966–8969. [Google Scholar] [CrossRef]
  57. Frostegård, Å.; Courtois, S.; Ramisse, V.; Clerc, S.; Bernillon, D.; Le Gall, F.; Jeannin, P.; Nesme, X.; Simonet, P. Quantification of bias related to the extraction of DNA directly from soils. Appl. Environ. Microbiol. 1999, 65, 5409–5420. [Google Scholar] [CrossRef] [PubMed]
  58. Steffan, R.J.; Goksøyr, J.; Bej, A.; Atlas, R. Recovery of DNA from soils and sediments. Appl. Environ. Microbiol. 1988, 54, 2908–2915. [Google Scholar] [CrossRef] [PubMed]
  59. Luna, G.M.; Dell’Anno, A.; Danovaro, R. DNA extraction procedure: A critical issue for bacterial diversity assessment in marine sediments. Environ. Microbiol. 2006, 8, 308–320. [Google Scholar] [CrossRef] [PubMed]
  60. Habibi, N.; Behbehani, M.; Uddin, S.; Al-Salameen, F.; Shajan, A.; Zakir, F. A safe and effective sample collection method for assessment of SARS-CoV-2 in aerosol samples. In Environmental Resilience and Transformation in Times of COVID-19; Elsevier: Amsterdam, The Netherlands, 2021; pp. 173–178. [Google Scholar]
  61. García-Arroyo, L.; Prim, N.; Martí, N.; Roig, M.C.; Navarro, F.; Rabella, N. Benefits and drawbacks of molecular techniques for diagnosis of viral respiratory infections. Experience with two multiplex PCR assays. J. Med. Virol. 2016, 88, 45–50. [Google Scholar] [CrossRef]
  62. Sims, D.; Sudbery, I.; Ilott, N.E.; Heger, A.; Ponting, C.P. Sequencing depth and coverage: Key considerations in genomic analyses. Nat. Rev. Genet. 2014, 15, 121–132. [Google Scholar] [CrossRef] [PubMed]
  63. Habibi, N.; Uddin, S.; Behbehani, M.; Kishk, M.; Abdul Razzack, N.; Zakir, F.; Shajan, A. Antibiotic Resistance Genes in Aerosols: Baseline from Kuwait. Int. J. Mol. Sci. 2023, 24, 6756. [Google Scholar] [CrossRef]
  64. Dhariwal, A.; Chong, J.; Habib, S.; King, I.L.; Agellon, L.B.; Xia, J. MicrobiomeAnalyst: A web-based tool for comprehensive statistical, visual and meta-analysis of microbiome data. Nucleic Acids Res. 2017, 45, W180–W188. [Google Scholar] [CrossRef]
  65. Chong, J.; Liu, P.; Zhou, G.; Xia, J. Using MicrobiomeAnalyst for comprehensive statistical, functional, and meta-analysis of microbiome data. Nat. Protoc. 2020, 15, 799–821. [Google Scholar] [CrossRef]
Figure 1. 16S rRNA gene copies found in the marine sediments of Kuwait as revealed using the HT-qPCR assay.
Applsci 13 11229 g001
Figure 2. Core resistome identified using HT-qPCR method.
Applsci 13 11229 g002
Figure 3. Box plot showing the distribution of resistomes in marine surface sediments. The blue boxes represent the HT-qPCR method, and the red boxes represent the SMS approach. The black square shows the average values of each gene type. The whiskers represent the standard deviation, whereas the blue balls are the outliers.
Applsci 13 11229 g003
Figure 4. Core resistome identified with the SMS method.
Applsci 13 11229 g004
Figure 5. Drug classes identified with high-throughput molecular methods (a) HT-qPCR and (b) SMS. (c) Relative abundances of drug classes identified with HT-qPCR. (d) Relative abundances of drug classes identified with SMS.
Applsci 13 11229 g005
Figure 6. (a) Major domains, (b) phylum, (c) genera, and (d) ESKAPE pathogens found in marine sediments collected from Kuwait.
Applsci 13 11229 g006
Table 1. Antibiotic-resistant gene elements detected using HT-qPCR in marine sediments collected from Kuwait.
SulphonamidesTetracyclineBeta-LactamOtherAminoglycosideQuinoloneMLSBTrimethoprimPhenicolIntegronsMGEs
sul1_1tetPAblaTEM_1merAaac6-aph2qnrS2lnuFdfrA1_1cmlA_2Intl_3tnpA_1
sul1_2tetA_2bla1qacE∆1_3aadA6qnrVC1_VC3_VC6mefA_1dfrA15catQintlI_2tnpA_6
sul2_1tetXblaCARBqacE∆1_1aadBqnrS_1mefAdfrBcmlA_4intlI_1tnpA_2
sul2_2tetWblaGESarr2aadA2_3qnrB_2ermB_2dfra17catB3intl3ISPps
sul4tetMcfxAcrAss64aadA_1qnrBereAdfrA27catB8Intl3_2ISI247_2
tetQblaOXA58_2crAss56strBqnrDlnuCdfrA12catB2 tnpA_3
tetGblaROBsat4aadA16 ermB_3 mdtL IncP_oriT
tetO_2blaVEBmcr1aadA1_2 mefB floR_1 tnpA_5
tet32cphA_1 aadA2_1 ermF ISI247_1
tet39blaMIR aac(6’)-Ib_1 erm42 tnpA_4
tet44cphA_2 aadA5_2 mphA IS613
tetL_2blaCMY_2 aadA10 lsaC IncN_rep
tetEblaSHV11 aac(6’)-II msrE Tp614
blaOXA10_1 aacC2 ISAba3
blaCMY_1 aadA7 IncQ_oriT
blaMOX/blaCMY aphA3_1 Orf37-
blaBEL-nonmobile IS26
ampC_4 Tn5
blaCMY2
ampC_1
ampC_6
blaSHV_2
blaACT_2
blaPER_1
blaACT
MLSB—macrolide, lincosamide, and streptogramin B; MGEs—mobile genetic elements.
Table 2. Taxonomic profiles of bacterial domains observed through HT-qPCR.
GeneSite 1Site 2Site 3Site 4Site 5Site 6Site 7Site 8Site 9Site 10Site 11Site 12
Bacteroidetes0.230.440.190.37-1.270.130.84---1.99
Firmicutes0.140.080.270.110.140.550.230.13---0.29
Acinetobacter baumannii------------
Campylobacter------------
Enterococci------------
Klebsiella. pneumoniae------------
Psuedomonas aeruginosa------------
Staphylococci------------
16S rRNA1.001.001.001.001.001.001.001.001.001.001.001.00
Disclaimer/Publisher’s Note: The statements, opinions and data contained in all publications are solely those of the individual author(s) and contributor(s) and not of MDPI and/or the editor(s). MDPI and/or the editor(s) disclaim responsibility for any injury to people or property resulting from any ideas, methods, instructions or products referred to in the content.

