Article

Evaluation of Noise Levels in a University Dental Clinic

by
Maria Antoniadou
1,2,*,
Panagiota Tziovara
1 and
Sophia Konstantopoulou
3
1
Department of Dentistry, School of Health Sciences, National and Kapodistrian University of Athens, 115 27 Athens, Greece
2
CSAP, Executive Mastering Program in Systemic Management, University of Piraeus, 185 34 Piraeus, Greece
3
Determination of Hazardous Agents Department, Hellenic Institute for Occupational Health and Safety (ELINYAE), 104 45 Athens, Greece
*
Author to whom correspondence should be addressed.
Appl. Sci. 2023, 13(19), 10869; https://doi.org/10.3390/app131910869
Submission received: 25 August 2023 / Revised: 21 September 2023 / Accepted: 28 September 2023 / Published: 30 September 2023

Abstract

:
Noise levels in a dental office can be produced by different specialty instruments. Exposure to high levels of noise (unwanted sounds) may cause auditory and non-auditory health problems in dentists. The aim of this study was to (a) measure the noise levels within different clinics and laboratories of the Department of Dentistry, School of Health Sciences of the National and Kapodistrian University of Athens, (b) promote information sharing on this serious health issue among stakeholders, and (c) collect data to organize preventive measures for students and personnel (faculty members, collaborators, administrative, and technical staff). Since the study did not apply to acoustics and acoustic measurements, a digital sound level meter and noise-integrating dosimeters with an analogue electronic transducer were used to collect data from certain postgraduate (PG) and undergraduate (UG) clinics and laboratories (LAB) during peak working periods and with a duration of 1 h per clinic/lab. Both personal (dosimeters) and static (area monitoring) noise exposure assessments were evaluated, resulting in various teaching-related activities in dental clinics. At all locations, the maximum exposure limit value of 87 dB(A) was not exceeded. However, chairside personal measurements during ultrasonic work revealed that the lower exposure action value of 80 dB(A) was exceeded. PG clinics were noisier than UG. LAB training settings, even with the new equipment, were close to the upper exposure limit due to the simultaneous use of airotors. In this context, targeted research and investigations into measures are proposed to safeguard the health and safety of students during their duties at the dental school.

1. Introduction

Sound is a multidimensional concept that is characterized by measurable and audible changes in air pressure, perceived in both positive and negative ways. It can either be understood as noise (e.g., a nuisance) or present itself as noise, particularly when it transforms into it. People tend to habituate to noise exposure in different ways [1]. Among the different types of noise exposure, occupational noise is the one that has been investigated the most [2], followed by entertainment noise (e.g., music festivals, concerts, and bars) and headphone use with PMPs (personal music players) [3], and environmental noise (e.g., noise from road, rail, and air traffic, and industrial construction) [4]. If exposure to noise is chronic and exceeds certain levels, it can lead to negative health consequences, such as auditory and non-auditory health problems [5].
Auditory problems due to noise include various levels of hearing loss. Noise-induced hearing loss can be caused by an intense impulse sound occurring once (such as a gunfire or explosion) [6], or by steady long-term exposure to noise levels higher than LA 75–85 dB—e.g., in industrial settings, including healthcare [7] and dental units [8]. World Health Organization (WHO) reports that 10% of the world’s population is exposed to sound pressure levels that could potentially cause noise-induced hearing loss [9]. Hearing loss is the 13th most important contributor (2–6% of the total number) to the global years lived with disability [1,10,11]. In about half of these people, auditory damage can be attributed to exposure to intense noise [12,13]. Accidents and falls are consequently associated with undiagnosed hearing loss, especially in the elderly, with increased mortality [14]. Changes in sound perception that cannot be attributed to an external source, such as in hearing ringing, called tinnitus, often follow acute and chronic noise exposure and persist for extended periods [15]. Tinnitus affects the quality of life through sleep disturbances, depression, and inability to sustain attention [15]. The characteristic pathological feature of noise-induced hearing loss is the loss of auditory sensory cells in the cochlea [1]. Because these hair cells cannot regenerate in mammals, no remission can occur [16]. So, the prevention of noise-induced hearing loss is the only option to preserve hearing and avoid social discomfort [17].
Additionally, noise exposure has been linked to non-auditory health effects, including annoyance [18] and sleep disturbance, with consequent daytime sleepiness [19], which further leads to patient fear [20] and stress-related outcomes in healthcare settings [21], increases the occurrence of hypertension and cardiovascular diseases [22,23], elevates cholesterol [24] and impairs cognitive performance [25]. It also leads to extreme stress responses [26], communication and concentration difficulties, mental fatigue, and a decline in efficiency/effectiveness [27]. Finally, noise annoyance in the workplace might be accompanied by negative responses, such as anger, displeasure, exhaustion, and burnout [28,29].
Healthcare units are considered noise-sensitive facilities [5]. Since the 1960s, hospital noise levels have increased by about LAeq 10 dB [30]. Noise levels in hospitals are now typically more than LAeq 15–20 dB higher than those recommended by WHO [31], leading to noise-induced stress linked to burnout, diminished well-being, and reduced work performance for employees [32,33]. Annoyance, irritation, fatigue, and tension headaches are also assigned to noisy healthcare workplace environments [34]. Noise also affects speech intelligibility and could, therefore, lead to misunderstandings that result in clinical errors [5,32].
Among healthcare professionals, dentists are exposed to sounds from a variety of sources within the office, mainly from equipment and tools in use. Additionally, there are verbal interactions with assistants and patients that may be at a louder level than ordinary conversation. Further, there may be music playing in the practice. Exogenous sources include noise from the external environment (e.g., vehicle traffic from outside and work in construction areas). It is also widely accepted that noise during clinical dental practice creates negative emotions in the clinicians and dental staff, such as nervousness, loss of concentration, and restlessness, but at the same time exacerbates anxiety in phobic patients [5]. Previous studies have shown that the noise levels produced in a dental office in dB(A) are less than 80dB(A), which is within the permissible limits set by the WHO. WHO recommends that noise exposure levels should not exceed 70 dB over a 24 h period and 85 dB over a 1 h period to avoid hearing impairment [35]. However, there are variations in the measurements in different dental environments, resulting in different factors that determine the noise levels that can be recorded. These variations can be attributed to the different methods used. For example, in a study conducted by Songkla University [36], the personal noise dose in the hearing zone was estimated using a decibel meter attached to participants, instead of the noise level in the working areas. The second method involved recording the noise in each minute by obtaining a mean period, in contrast to the method described in the study by da Cunha et al. [37], where only the peak of noise every 5 min was recorded. In a study by Kadanakuppe et al. [38], conducted at the Oxford Hospital and Oxford School of Dentistry, Bangalore, Karntaka, the level of noise of the cutting devices was measured using a microphone placed near the operator’s ear, close to the main noise source. The minimal intensity and the maximal intensity of noise were assessed for 30 s using the dental devices triggered only during the cutting moments when the intensity of noise ranged from 64 to 97 dB. In some studies, the environment was also assessed [36], reporting that the level of noise was slightly higher than that recorded in the hearing zone. The common part of all relevant studies is that the level of noise that really damaged the hearing of students could be a little lower than that registered in the dental clinic, but at times very high in frequencies temporarily surpassing the control limits [36,37,38]. Other relevant studies report on the differences in equipment used for the measurements of noise levels [39,40,41,42]. So far, there has not been enough evidence of the differences in noise levels between different university clinics or laboratories due to years of use of dental equipment, settings, and tasks performed. Further, no noise spectra during dental clinical work have been reported so far.
Thus, the purpose of this research is to (a) measure noise levels within different clinics and laboratories of the Department of Dentistry of the National and Kapodistrian University of Athens, which contain dental equipment of different ages of use; (b) present spectrum analysis of noise variations during workflow in clinics and laboratories; (c) promote possible necessity of information sharing regarding this serious health issue among stakeholders; and (d) collect data to enhance preventive measures for students and personnel (faculty members, collaborators, administrative, and technical staff).

2. Background

Due to the auditory and non-auditory consequences of noise exposure and the sensitivity in terms of continuous noise levels in dental settings, noise reduction has recently become a topic of research. Legislation suggests monitoring, which includes noise assessments, regular audiometric testing, and protective equipment for doctors and dentists [43,44]. However, the available evidence for the associations between occupational noise exposure and hearing loss is complex as there is a lack of appropriate non-exposed control samples and longitudinal studies. It is further suggested that there should be better quality prevention programs in susceptible professional environments, higher quality research in these environments, and massive implementation of the relevant legislation [45]. It is also reported that, in most working environments, efforts to control the problem focus on hearing protection rather than on noise control using improved equipment design and different programming of functions of this equipment or better noise-proof construction materials. Thus, various regulatory agencies have made recommendations on noise exposure limits, notably on exposure to noise in the workplace. The choice of an exposure limit usually depends on setting a maximum acceptable hearing loss for a lifetime and determining the percentage of the population exposed to noise for which the maximum acceptable hearing loss is tolerated [46,47].
According to the Directive 2003/10/EC of the European Parliament [48] and the consequent Greek Presidential Decree No. 149/2006 [49], which were followed to take measurements in this study, the exposure limit values and exposure action values for daily noise exposure levels and peak sound pressure values are established as shown in Table 1 (abbreviations are discussed in the relevant section at the end of the paper).
Additionally, in the US, three organizations have issued recommendations on exposure limits to dangerous noise levels, including the Occupational Safety and Health Administration (OSHA) [50], the National Institute for Occupational Safety and Health (NIOSH) [51], and the Environmental Protection Agency (EPA) [52]. The exposure limits issued by each of these organizations consider three parameters related to exposure: level (“how loud”), frequency (“how often”), and duration (“how long”). Typically, the OSHA and NIOSH recommendations are applied in a professional environment based on what happens on an 8 h workday during a 40-year working life. OSHA’s permissible exposure limit is 90 dB(A) with an exchange ratio of 5 dB (e.g., 90 dB(A) for 8 h, 95 dB(A) for 4 h, etc.). Meeting OSHA limits could lead to hearing problems in 25% of the working population over a 40-year working period [50]. The recommended exposure limit (REL) of NIOSH is more conservative at 85 dB(A) with an exchange ratio of 3 dB (e.g., 85 dB(A) for 8 h, 88 dB(A) for 4 h, etc.). NIOSH estimates that meeting these limits could lead to hearing problems in 8% of the working population [51]. Finally, the EPA sets a recommended exposure limit of 70 dB(A) for the whole year (not limited to working hours). Adherence to the EPA limit is intended to protect the entire population [52] and is considered a safe level of protection against hearing loss [53,54].
Noise levels are calculated in dBs. A dB(decibel) is the ratio between two noise quantities that have been reported on a logarithmic scale. Although dB is commonly used when referring to measuring sound, humans do not hear all frequencies equally. For this reason, sound levels at the low-frequency end of the spectrum are reduced as the human ear is less sensitive at low audio frequencies than at high audio frequencies. On the decibel scale, audible sounds range from 0 dB, which is the threshold of hearing, to over 130 dB, which is the threshold of pain. Although doubling the sound pressure corresponds to an increase of 6 dB, it takes about a 10 dB increase for the sound to subjectively appear twice as loud. The smallest change that humans can hear is about 3 dB. The sound pressure level (SPL) can be described subjectively based on the decibel (dB) scale. A range of 0 to 40 dB is considered quiet to very quiet, whereas 60 to 80 dB is generally described as noisy. A sound pressure level of 100 dB is perceived as very noisy, whereas anything greater than 120 dB is intolerable. Further, A, C, and Z are frequency weightings used in noise level meters to adjust the measured sound pressure level (SPL) to better match the human perception of sound. The A-weighting curve shows how the human ear reacts to different sound pressure levels, and it is often used to measure noise in the environment and in industry. The A-weighting curve attenuates low- and high-frequency sound pressure levels, giving more weight to frequencies between 500 Hz and 10 kHz, where human hearing is most sensitive. dB(A) is then a weighted scale for judging the loudness that corresponds to the hearing threshold of the human ear [47,55]. Noise levels given in dBA or dB(A), as they are sometimes written (A-weighted sound levels) instead of dB, are usually found in the relevant literature and are also used in the present study. The main effect of this adjustment is that low and very high frequencies are given less weight compared to the standard decibel scale. Compared to dB, A-weighted measurements underestimate the perceived loudness, annoyance factor, and stress-inducing capability of noises with low-frequency components, especially at moderate and high volumes of noise [48,49,50]. The C-weighting curve measures the overall sound pressure level across all frequencies without attenuation. It is used for measuring sound in high-level noise environments, such as rock concerts or airport runways. The Z-weighting curve is also known as “linear” or “flat” weighting and does not apply any frequency weighting to the SPL measurement. It measures the sound pressure level across all frequencies and is used for scientific measurements or calibrating instruments [51,52,53].

3. Materials and Methods

The Research Ethics Committee of the Department of Dentistry, School of Health Sciences of the National and Kapodistrian University of Athens, has approved the study protocol (no 569/02.02.202). All human subjects involved in the study were informed, and they signed a consent form for their participation in the study before measurements.

3.1. Mapping of Settings for Sound Measurements

Noise level measurements were performed in four clinics at the Department of Dentistry: two undergraduate clinics (UG1 and UG2) (where students of the 10th semester received their clinical training) and two postgraduate clinics (PG1 for postgraduate prosthodontic students and PG2 for operative dentistry, endodontics, and periodontics specialists). wo different laboratories were further included, covering the preclinical exercise of students during the 6th (old lab used for 30 years, LAB1) and 4th semester of studies (renovated lab used for 1 year, LAB2). Table 2 shows the details of the dental settings used in the study. Time periods were defined according to the workflow of the clinic or laboratory at full capacity of students and personnel.
In Figure 1, the mapping of the clinics is provided to better show the positions of static and personal measurements in the area.
In all settings, a full-coverage service of the dental units was performed before the measurements. All the equipment in the measurement settings were under good working conditions. The cutting burs and diamond points used in the handpieces were those used by the operators during normal clinical practice, and handpieces were maintained according to evidence-based protocols [56]. The pressure for compressed air within the clinics was set at the maximum permissible values as designated by the manufacturers while being compatible with the values prescribed for the respective handpieces.

3.2. Sample of the Study

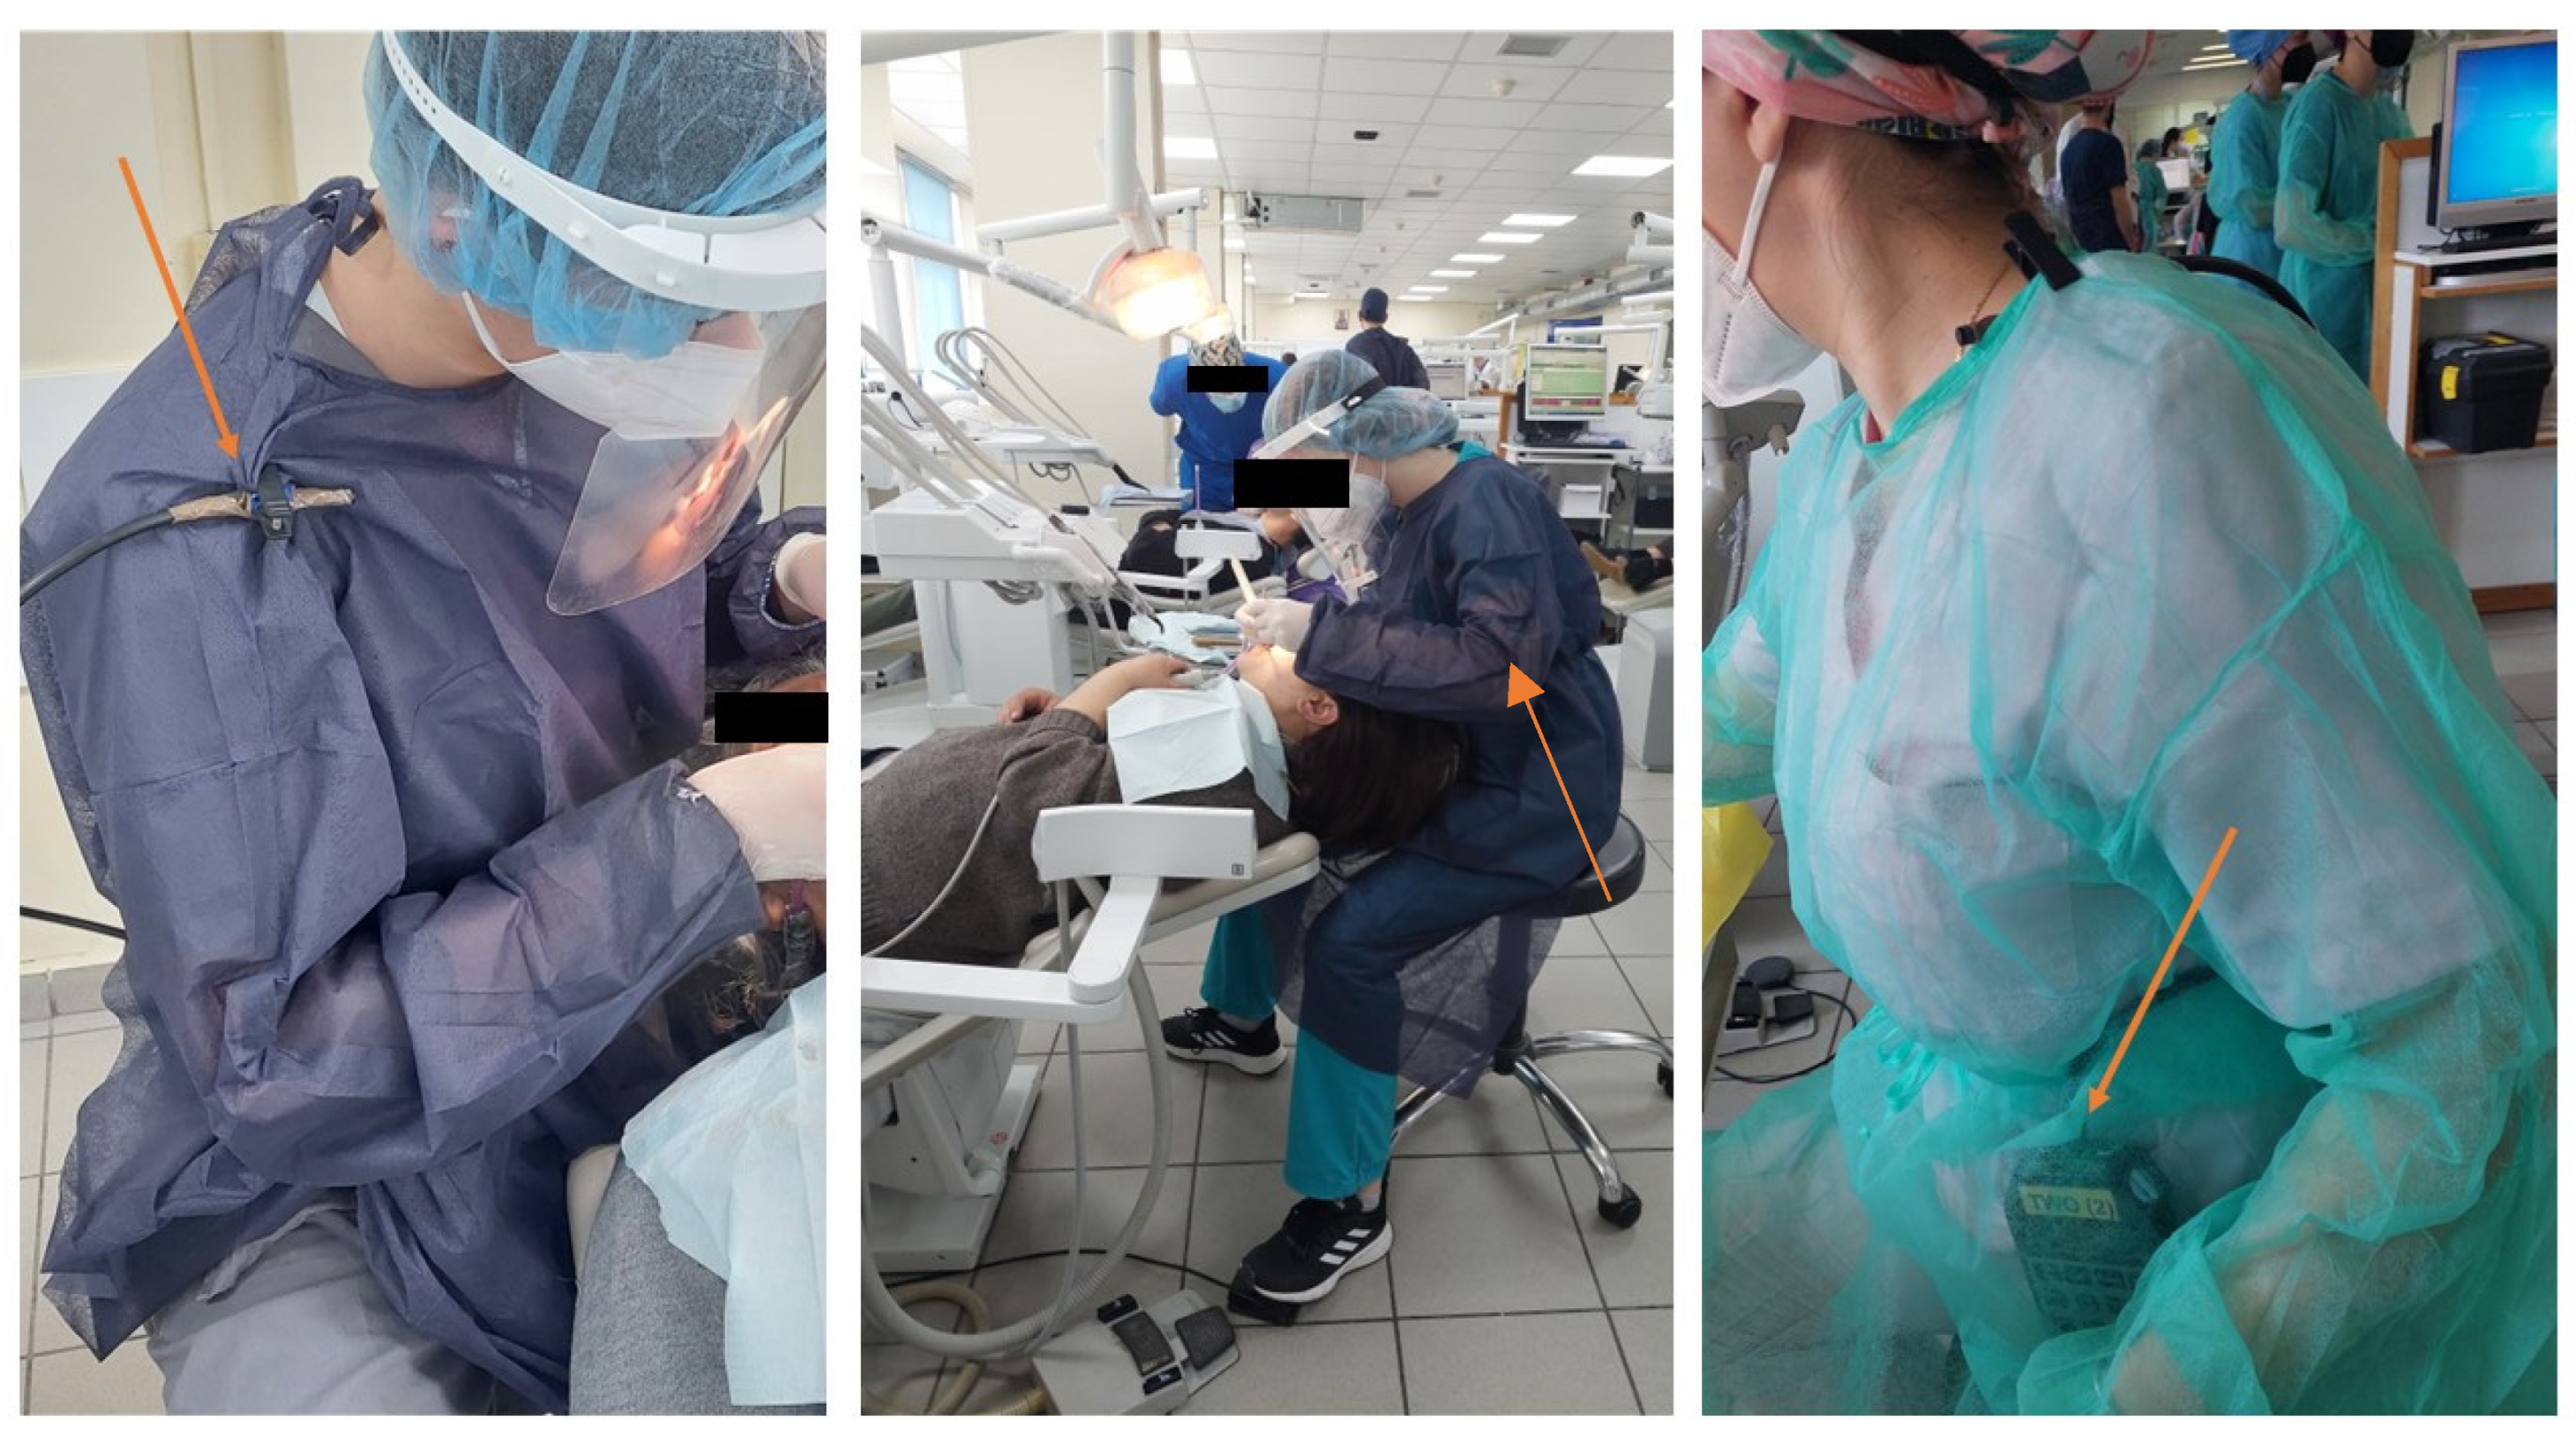
Postgraduate and undergraduate students of the Department of Dentistry were randomly chosen from the clinics and labs (see below for more information), and agreed to wear personal integrating dosimeters without disturbing their clinical or laboratory work (Figure 2).

3.3. Measurement Methodology

The measurements were made during one working day and between times 10.00 and 15.00 when the peak of educational/clinical activity in these areas was estimated. Care was taken to cover all activities in a representative work cycle, as well as to achieve an equilibrium in the mapping of noise levels from old equipment (more than 15 or 25 years of service) and new equipment (1 year of service). Different durations of measurements were assigned due to practical reasons within the clinics and laboratories. When static noise measurement (area monitoring) took place, the person in a standing position held a hand-held sound pressure level meter at the level of the students sitting and performing clinical work. The instrument was calibrated externally prior to each measurement.

3.4. Equipment and Validation for Measurements

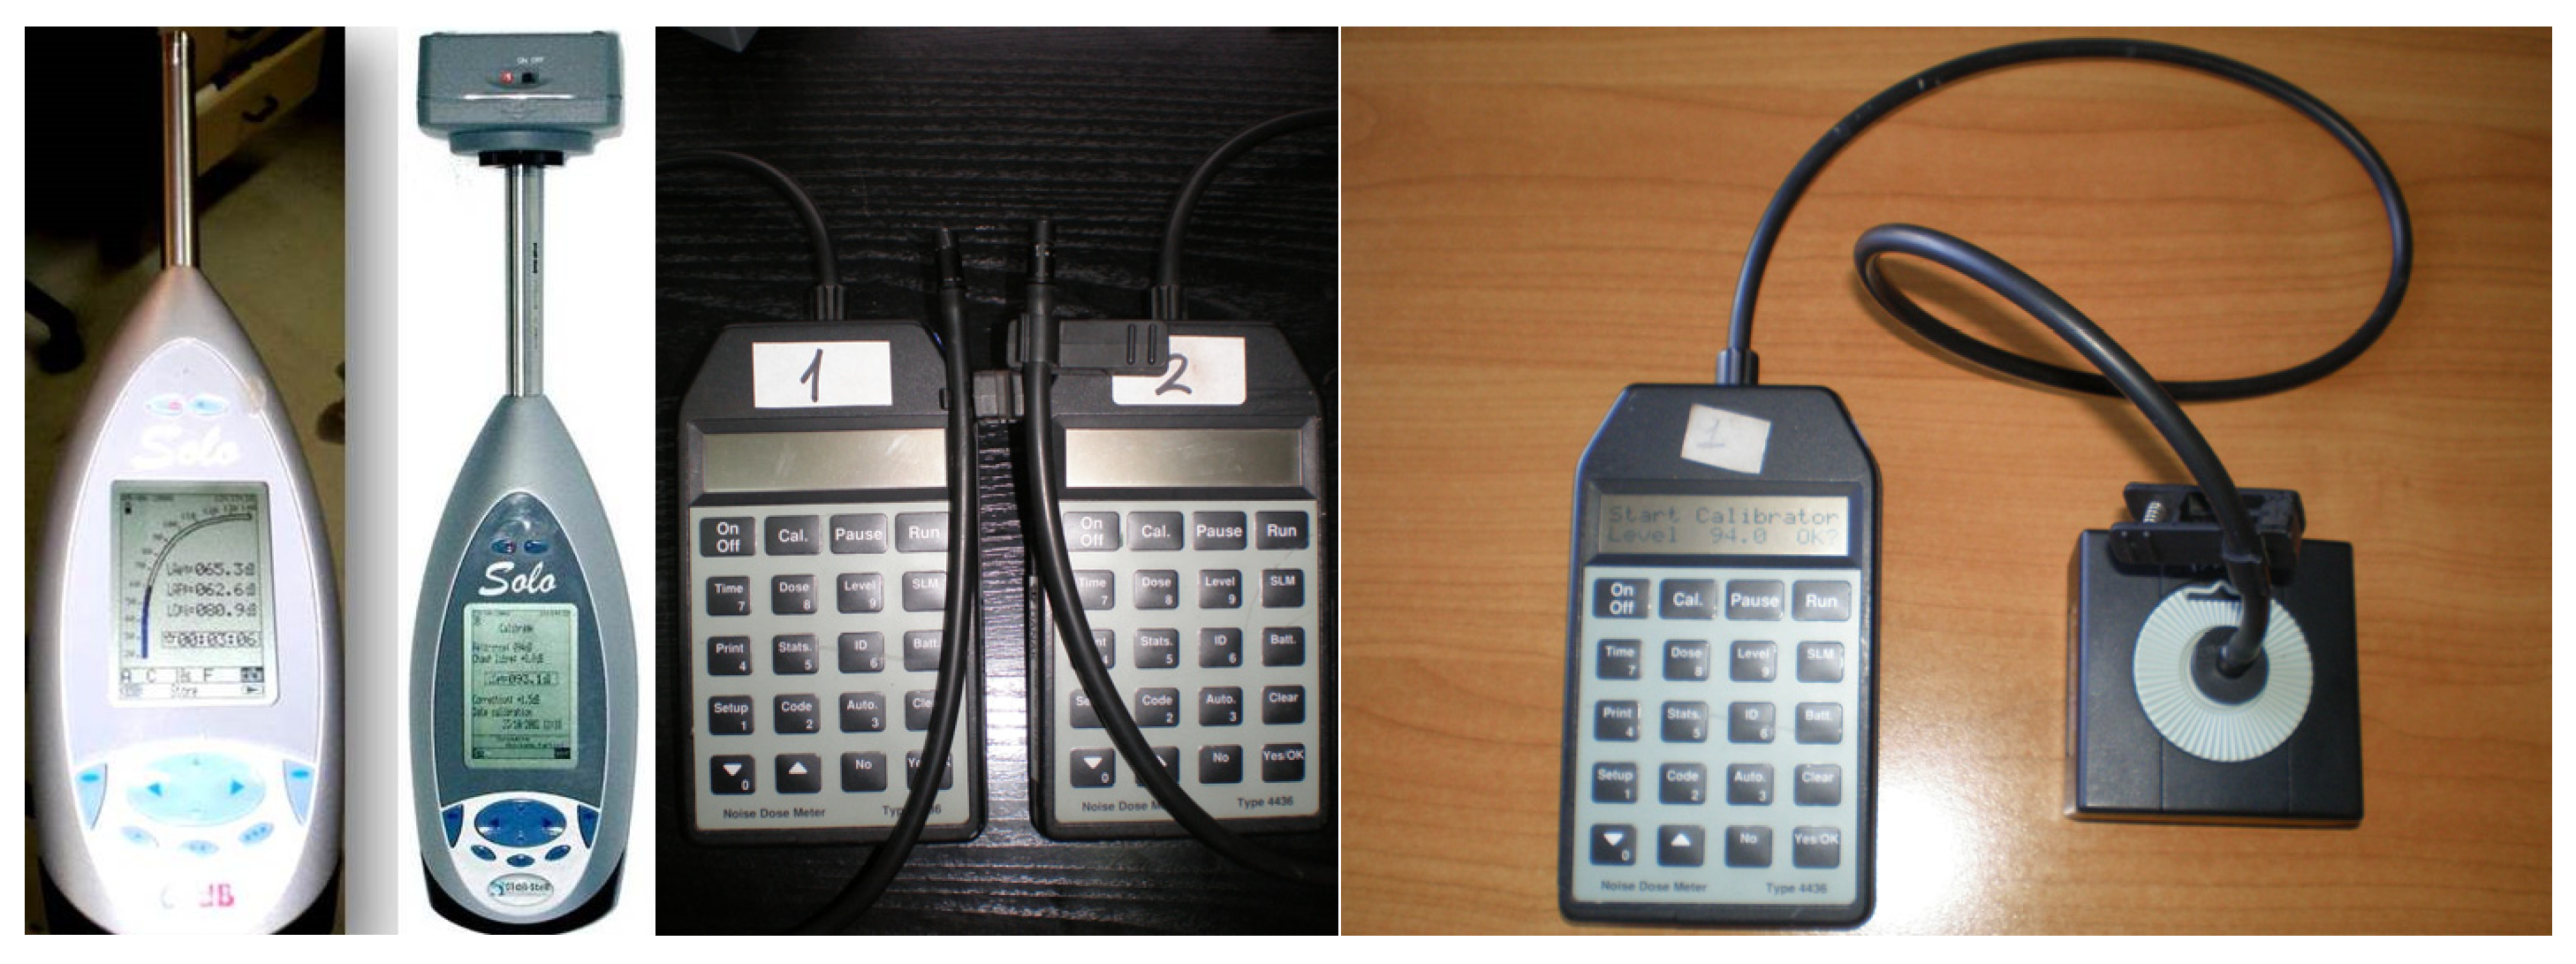
The noise measurement equipment (sound level meter, noise dosimeter, and acoustic calibrator) was calibrated using an external accredited laboratory to ISO/IEC 17,025 standards and issued calibration certificates. The Solo 01 dB-Metravib (Acoem, France) was used as a sound level meter, and both the CAL02 01 dB-Stell (Tokyo, Japan) and the Bruel and Kjaer 4231 were used as sound level calibrators. Two Bruel and Kjaer Noise Dose Meters (Type 4436) were used to measure and store the data. Each was calibrated using a Bruel and Kjaer Sound Level Calibrator (Type 4231) prior to testing (Figure 3).
For the estimation of noise levels, we followed the measurement methodology defined by P.D. 149/2006. The sound level meters, and noise dosimeters followed the specifications of IEC 804—IEC 651 for the work-related noise measurements. The sound level meters operated in fast mode (time weighting) using A and C weighting filters and recorded noise statistics every minute. From the logged parameters, Leq was analyzed (the equivalent continuous sound level represents the total noise exposure for the period of interest or an energy average noise level). Simultaneously, the spectrum analysis was recorded.
The noise exposure level in each section (fixed workstations at the center of the clinic and two randomly selected workstations in the left and right parts of the clinic (Figure 2) to assess work noise per clinic/laboratory area) was measured by a researcher holding the noise instrument by facing the microphone toward the noise source and viewing the measurement on the liquid crystal display (LCD). Personal noise measurements using dosimeters worn by selected students were performed in the dental clinics and laboratories.
For the analysis and evaluation of the data, we referred to Presidential Decree No. 149/2006 [49], which describes the “Minimum requirements regarding the exposure of workers to risks arising from physical agents (noise) in accordance with Directive 2003/10/EC” [48] and established the daily exposure values (Leq in dB(A) and Ppeak in dB(C)) for 8 h occupational exposure, as described in Table 1.
In both personal noise monitoring (chairside) and static measurement (area monitoring), all necessary information was collected in relation to the clinical training (specialty description and use of suction and/or different handpieces), the duration of the measurement, the weighting circuits used, and any hearing protection devices used by students. Sound level meters and noise dosimeters were randomly used by students during their performance, according to their willingness to participate and their position in the setting of the clinic to be at least 5 m away from the position of the static measurements in the area to avoid bias in different measurements.
Average noise levels were calculated and compared between various positions and methods of measurement using an Analysis of Variance (ANOVA). Furthermore, Tukey’s test was applied to perform a pairwise comparison between groups. Intra-setting measurements comparing the differences between various times were analyzed using Wilcoxon’s Signed Sum Rank Test. Comparisons between the postgraduate and undergraduate clinics were made using the Mann–Whitney U test. The level of significance was set at p < 0.05.

4. Results

Description of Results

Table 3 shows data gathered from measurement positions.
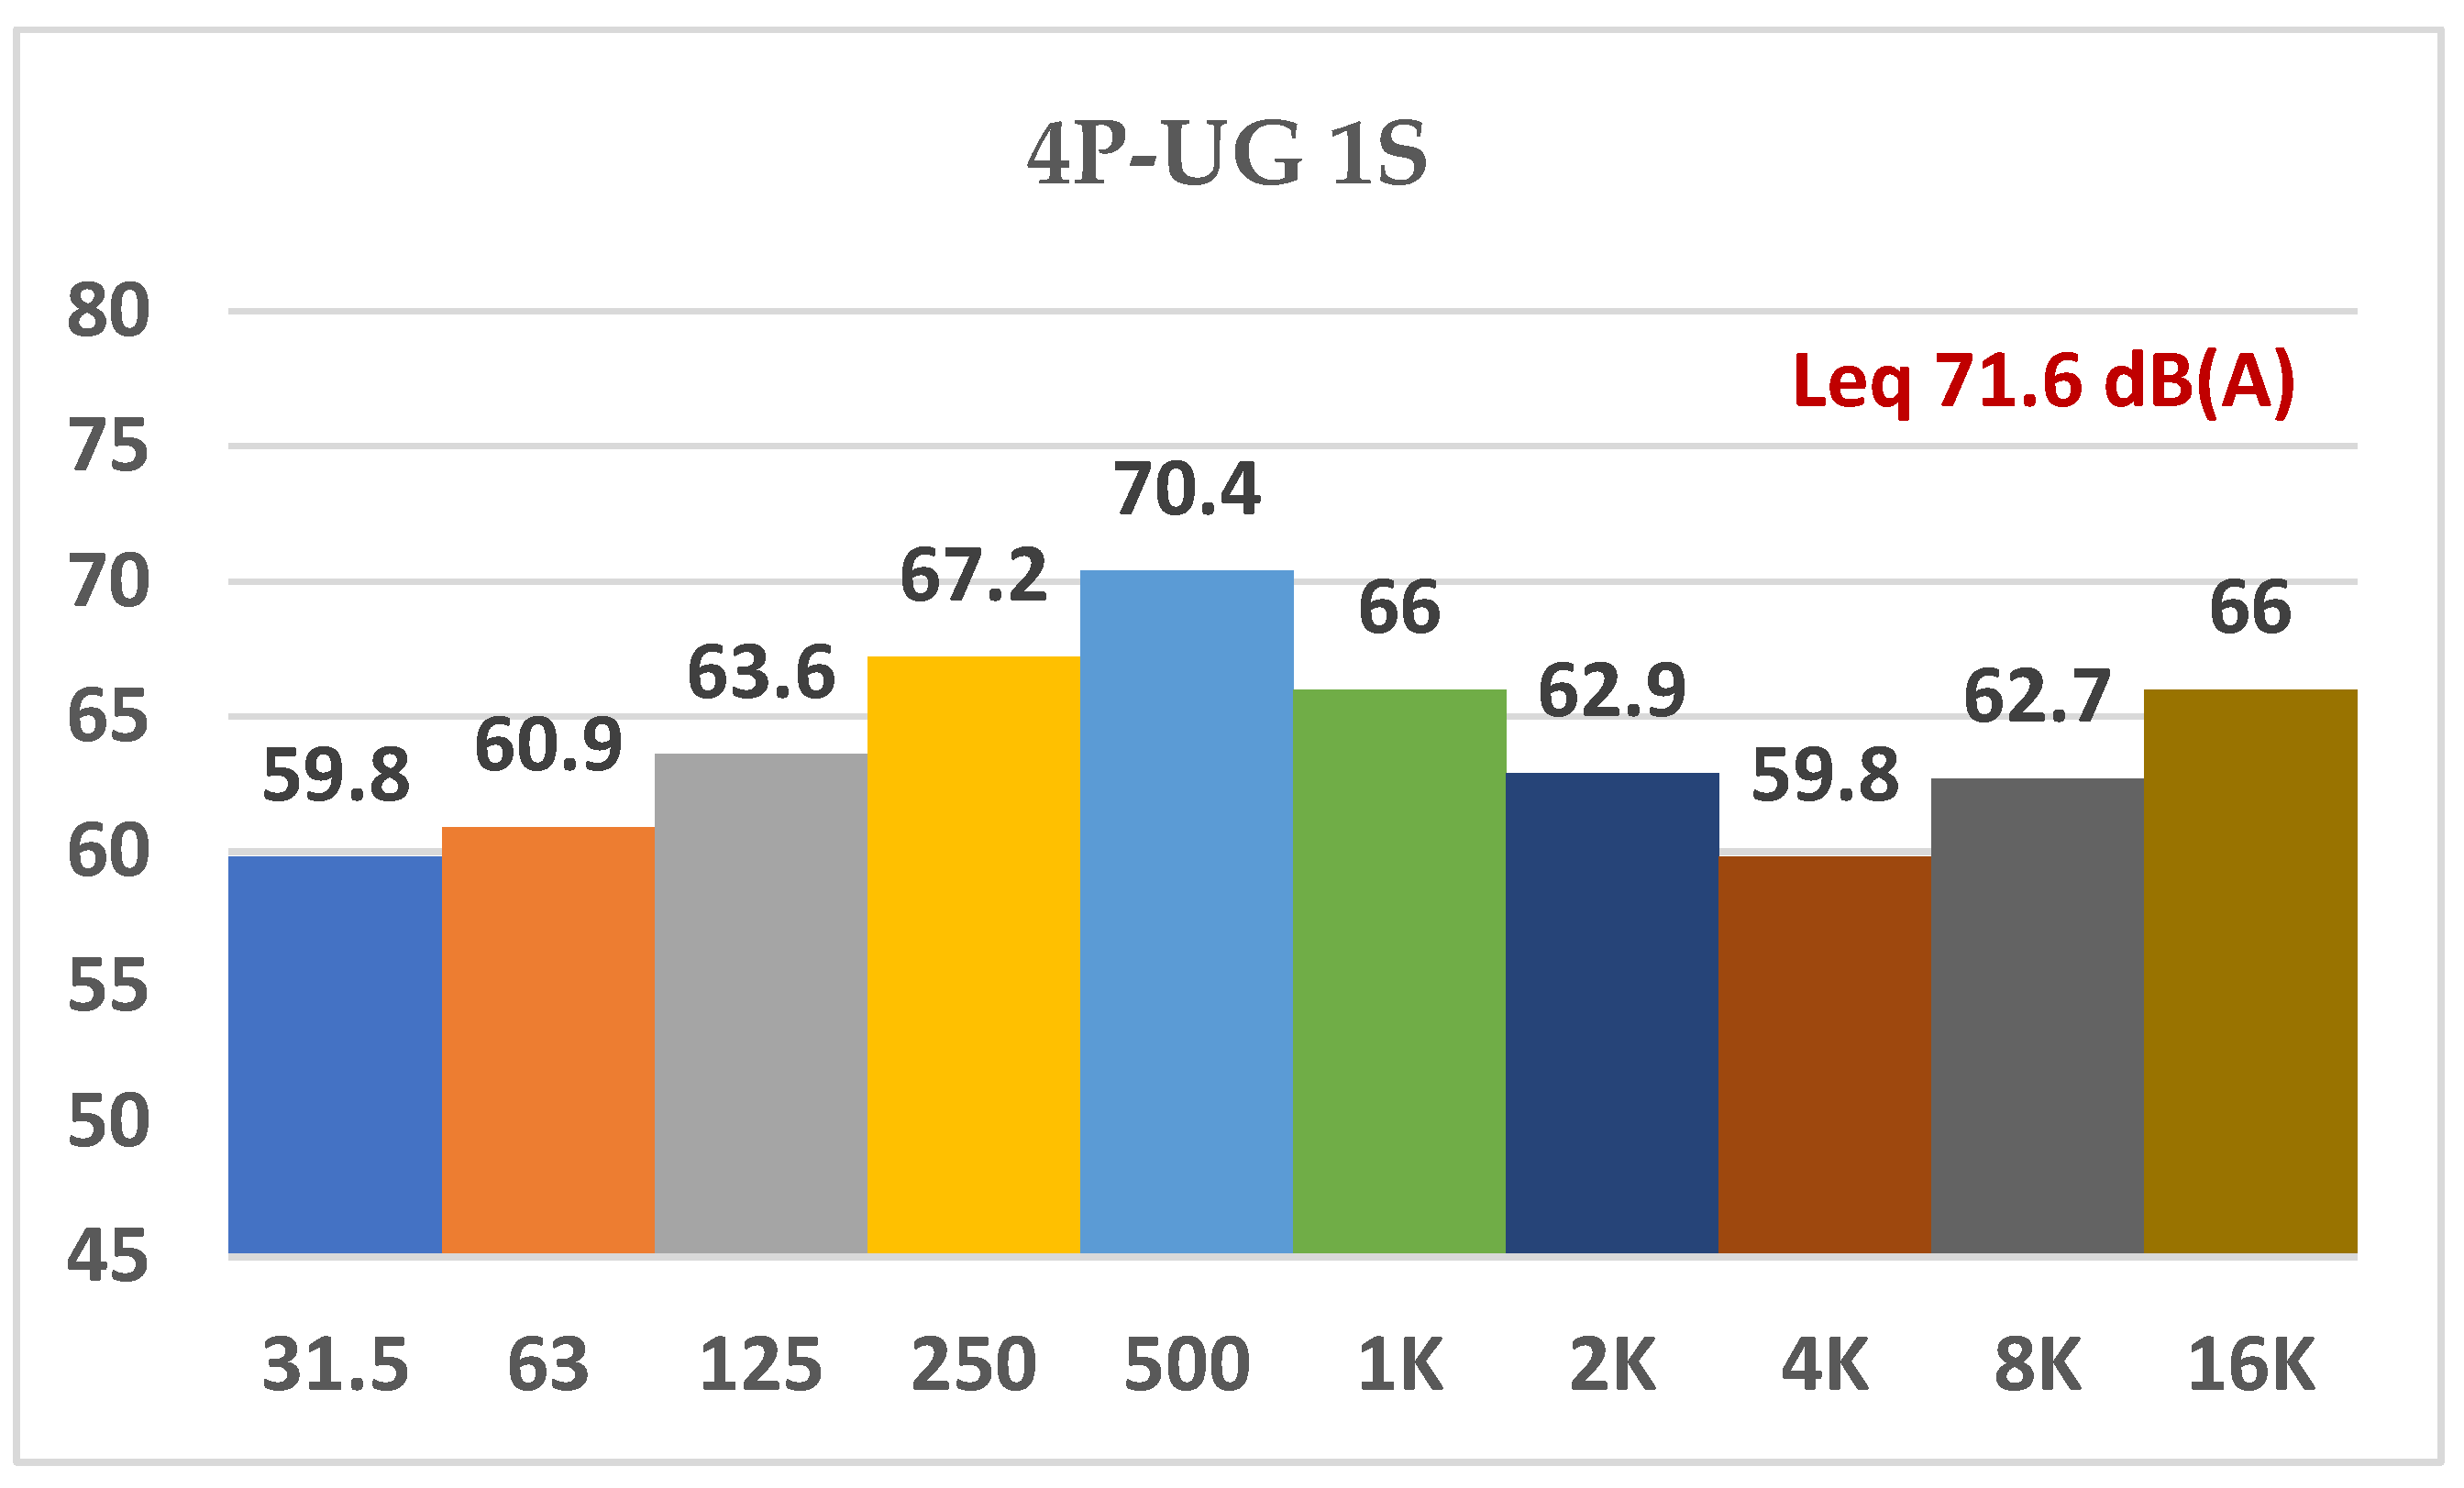
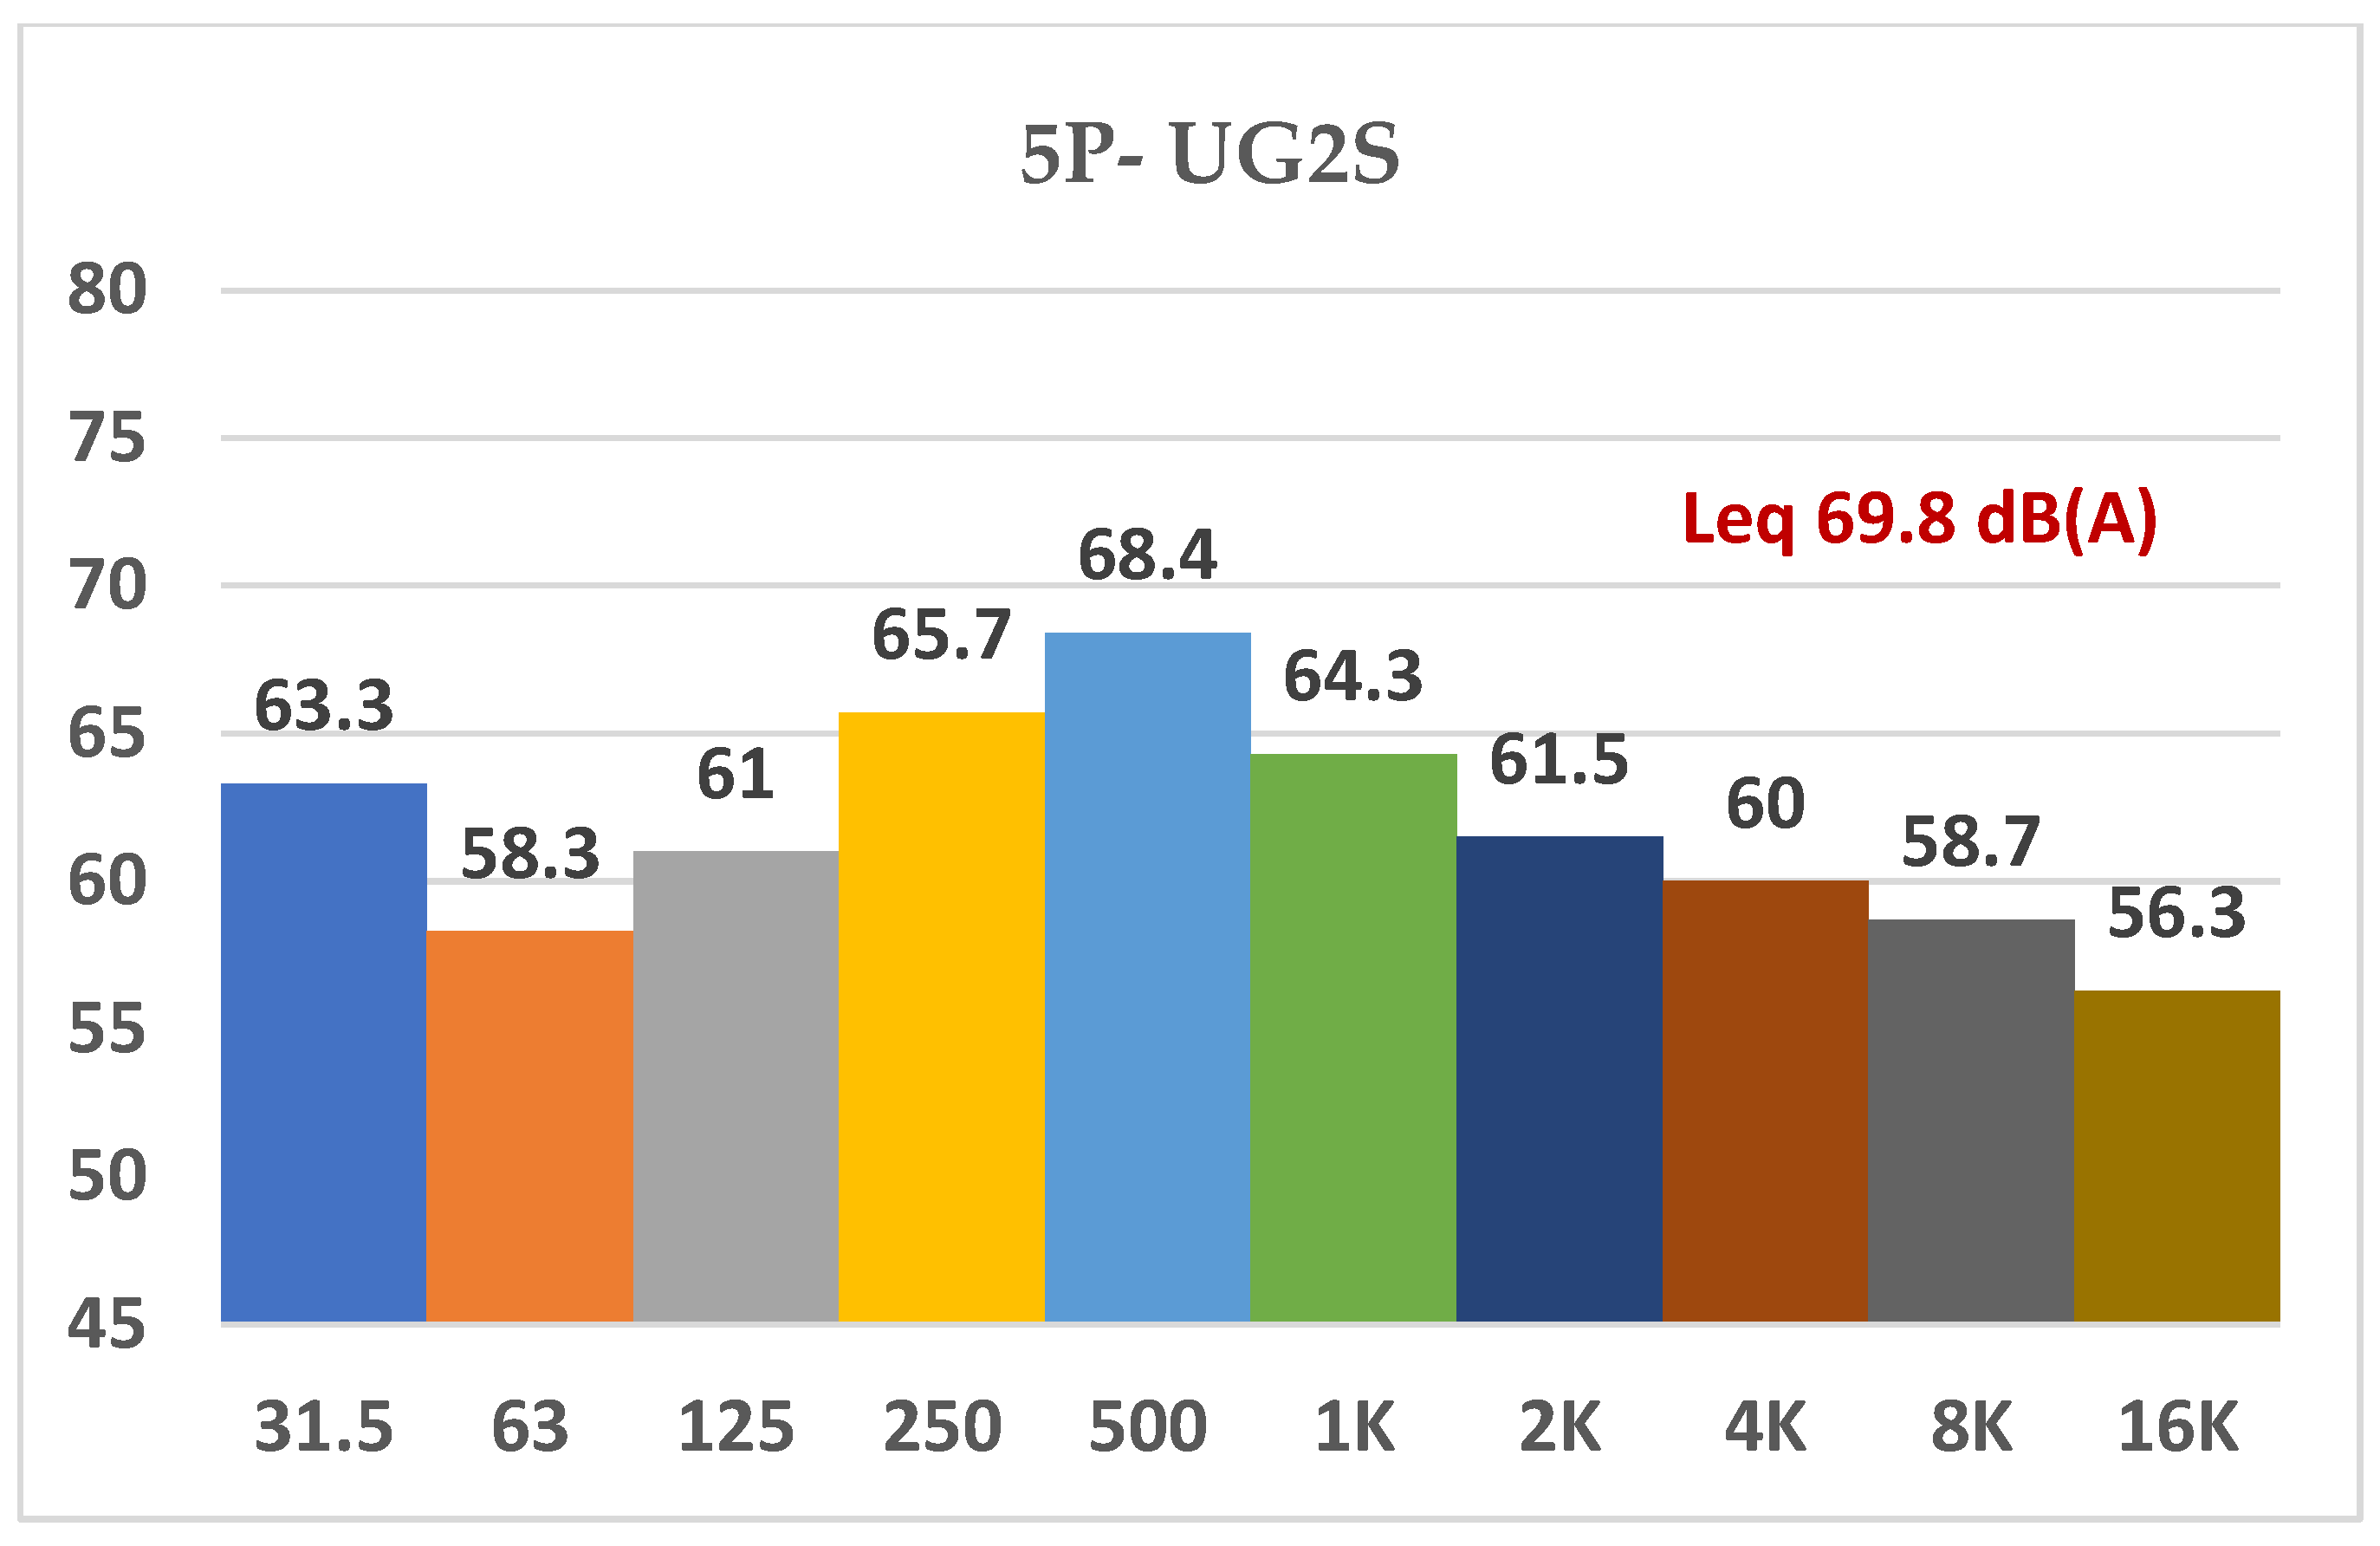
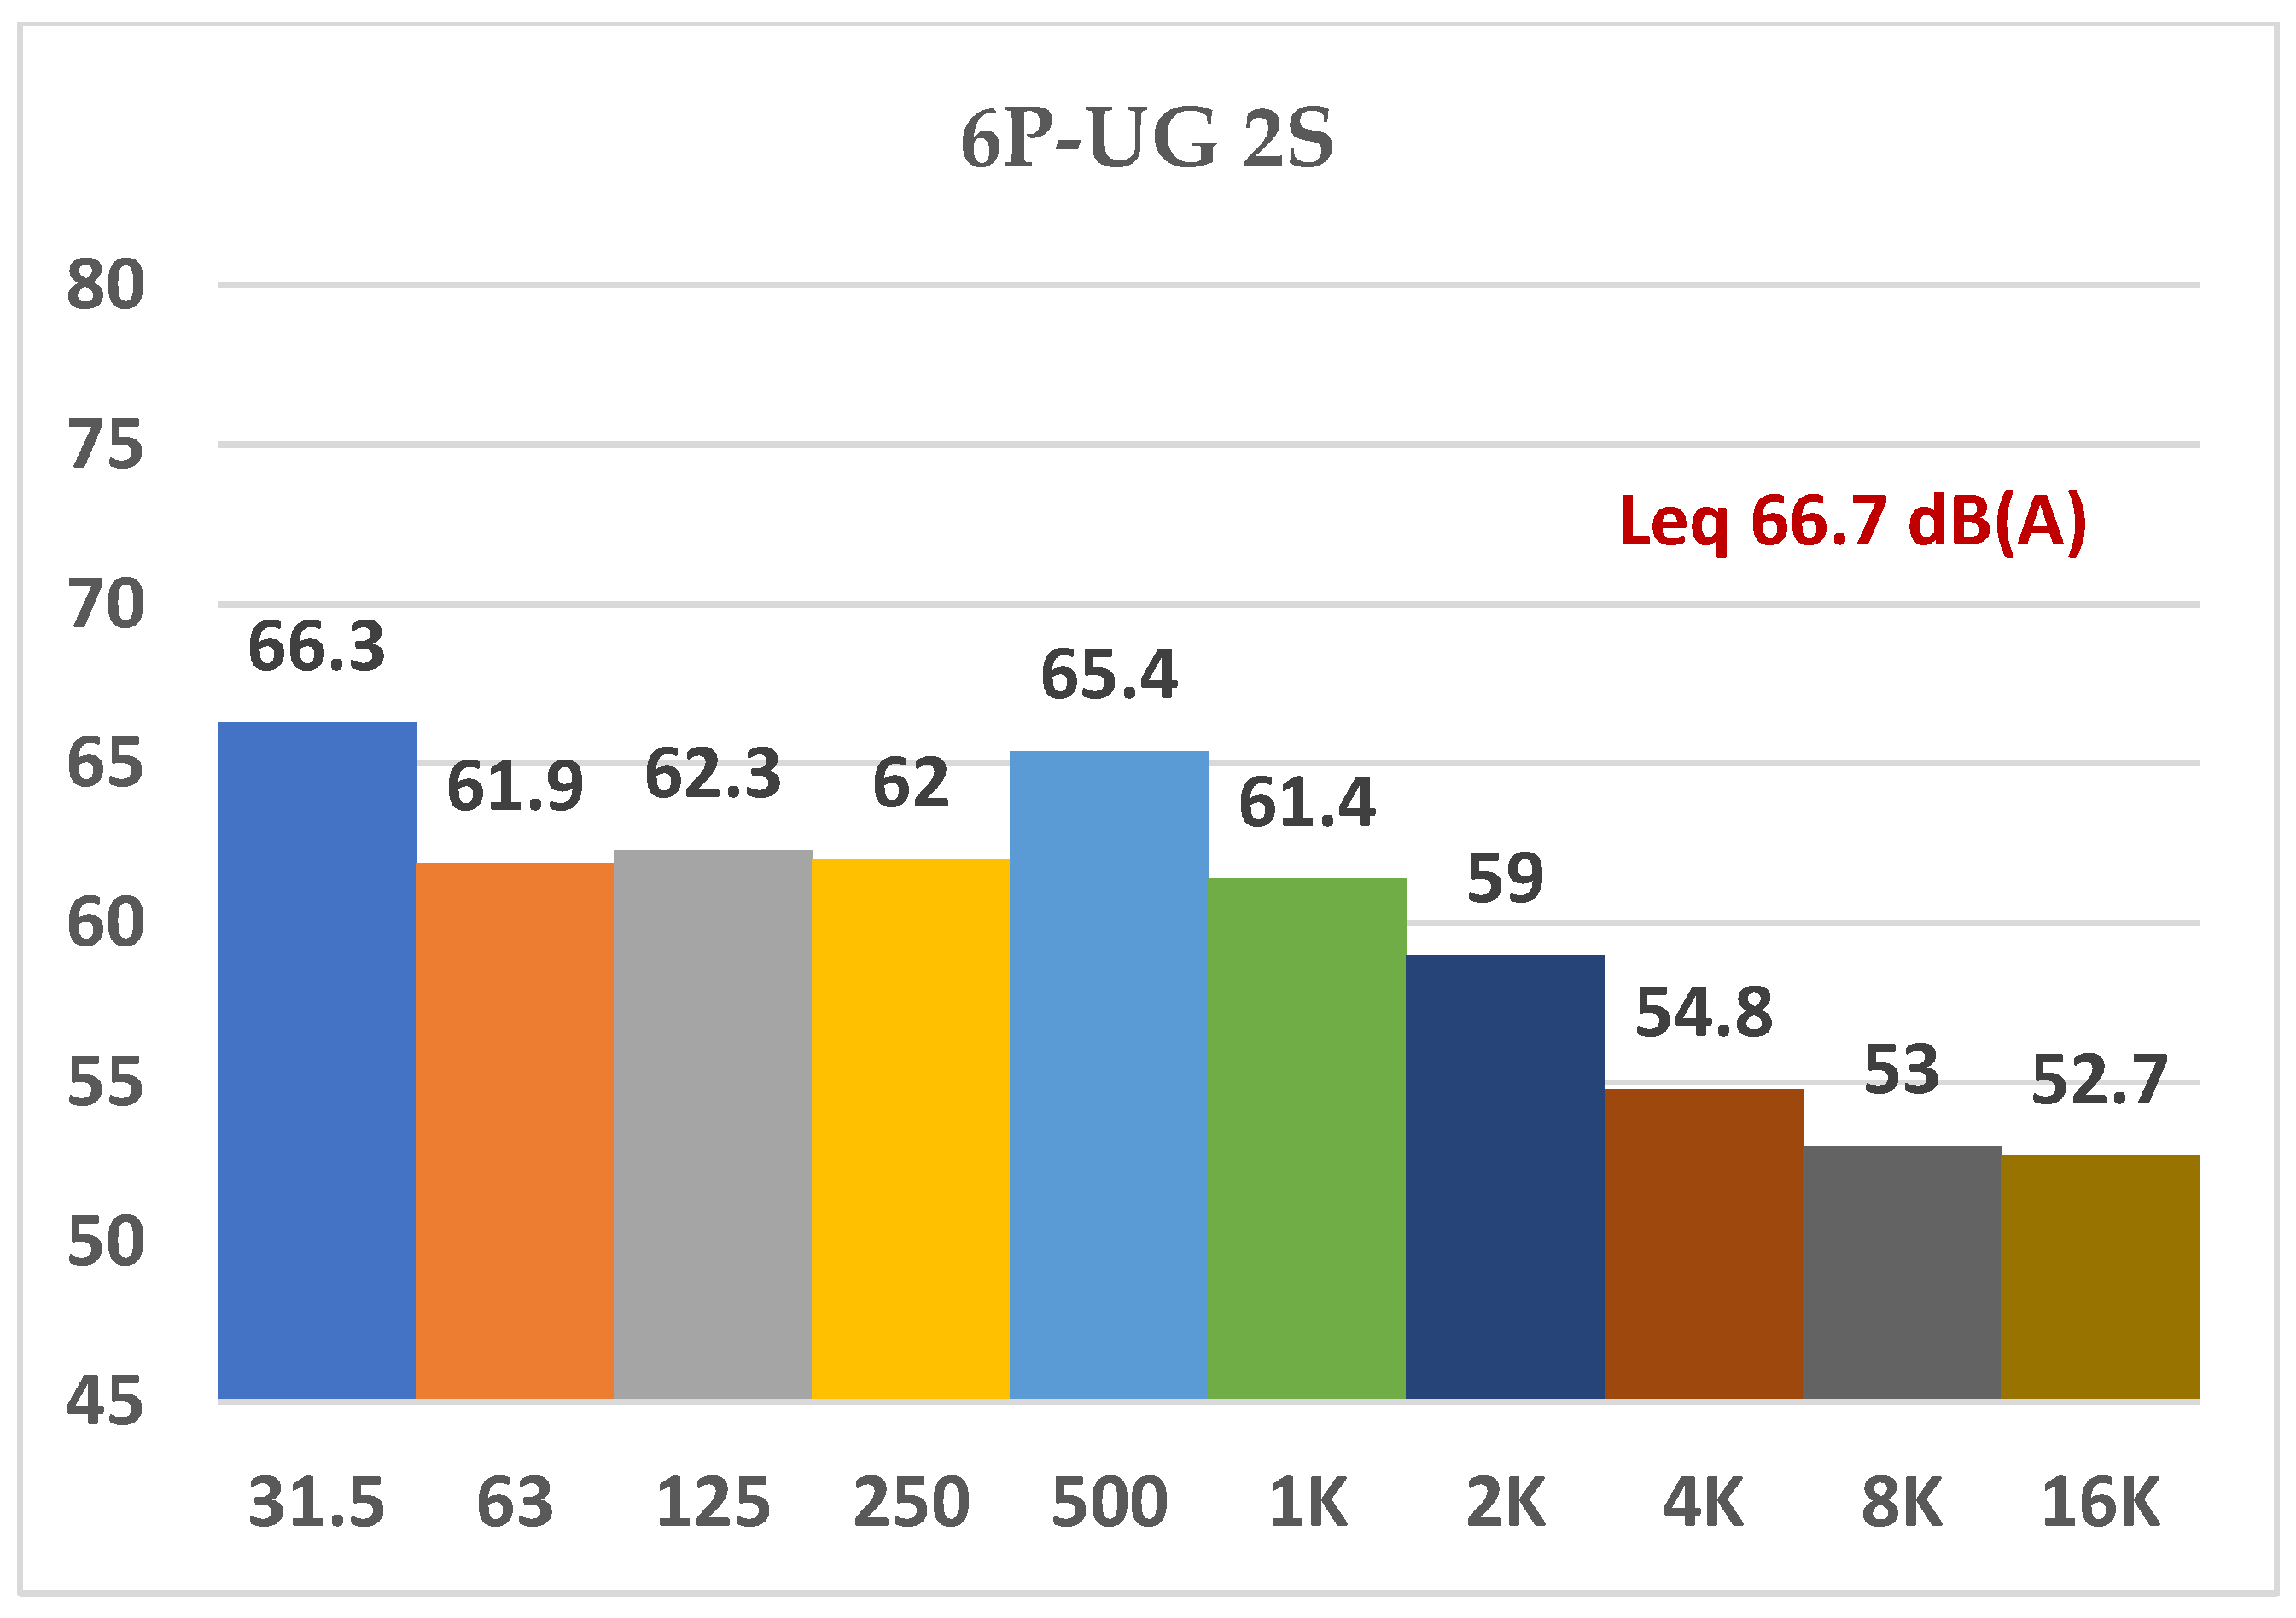
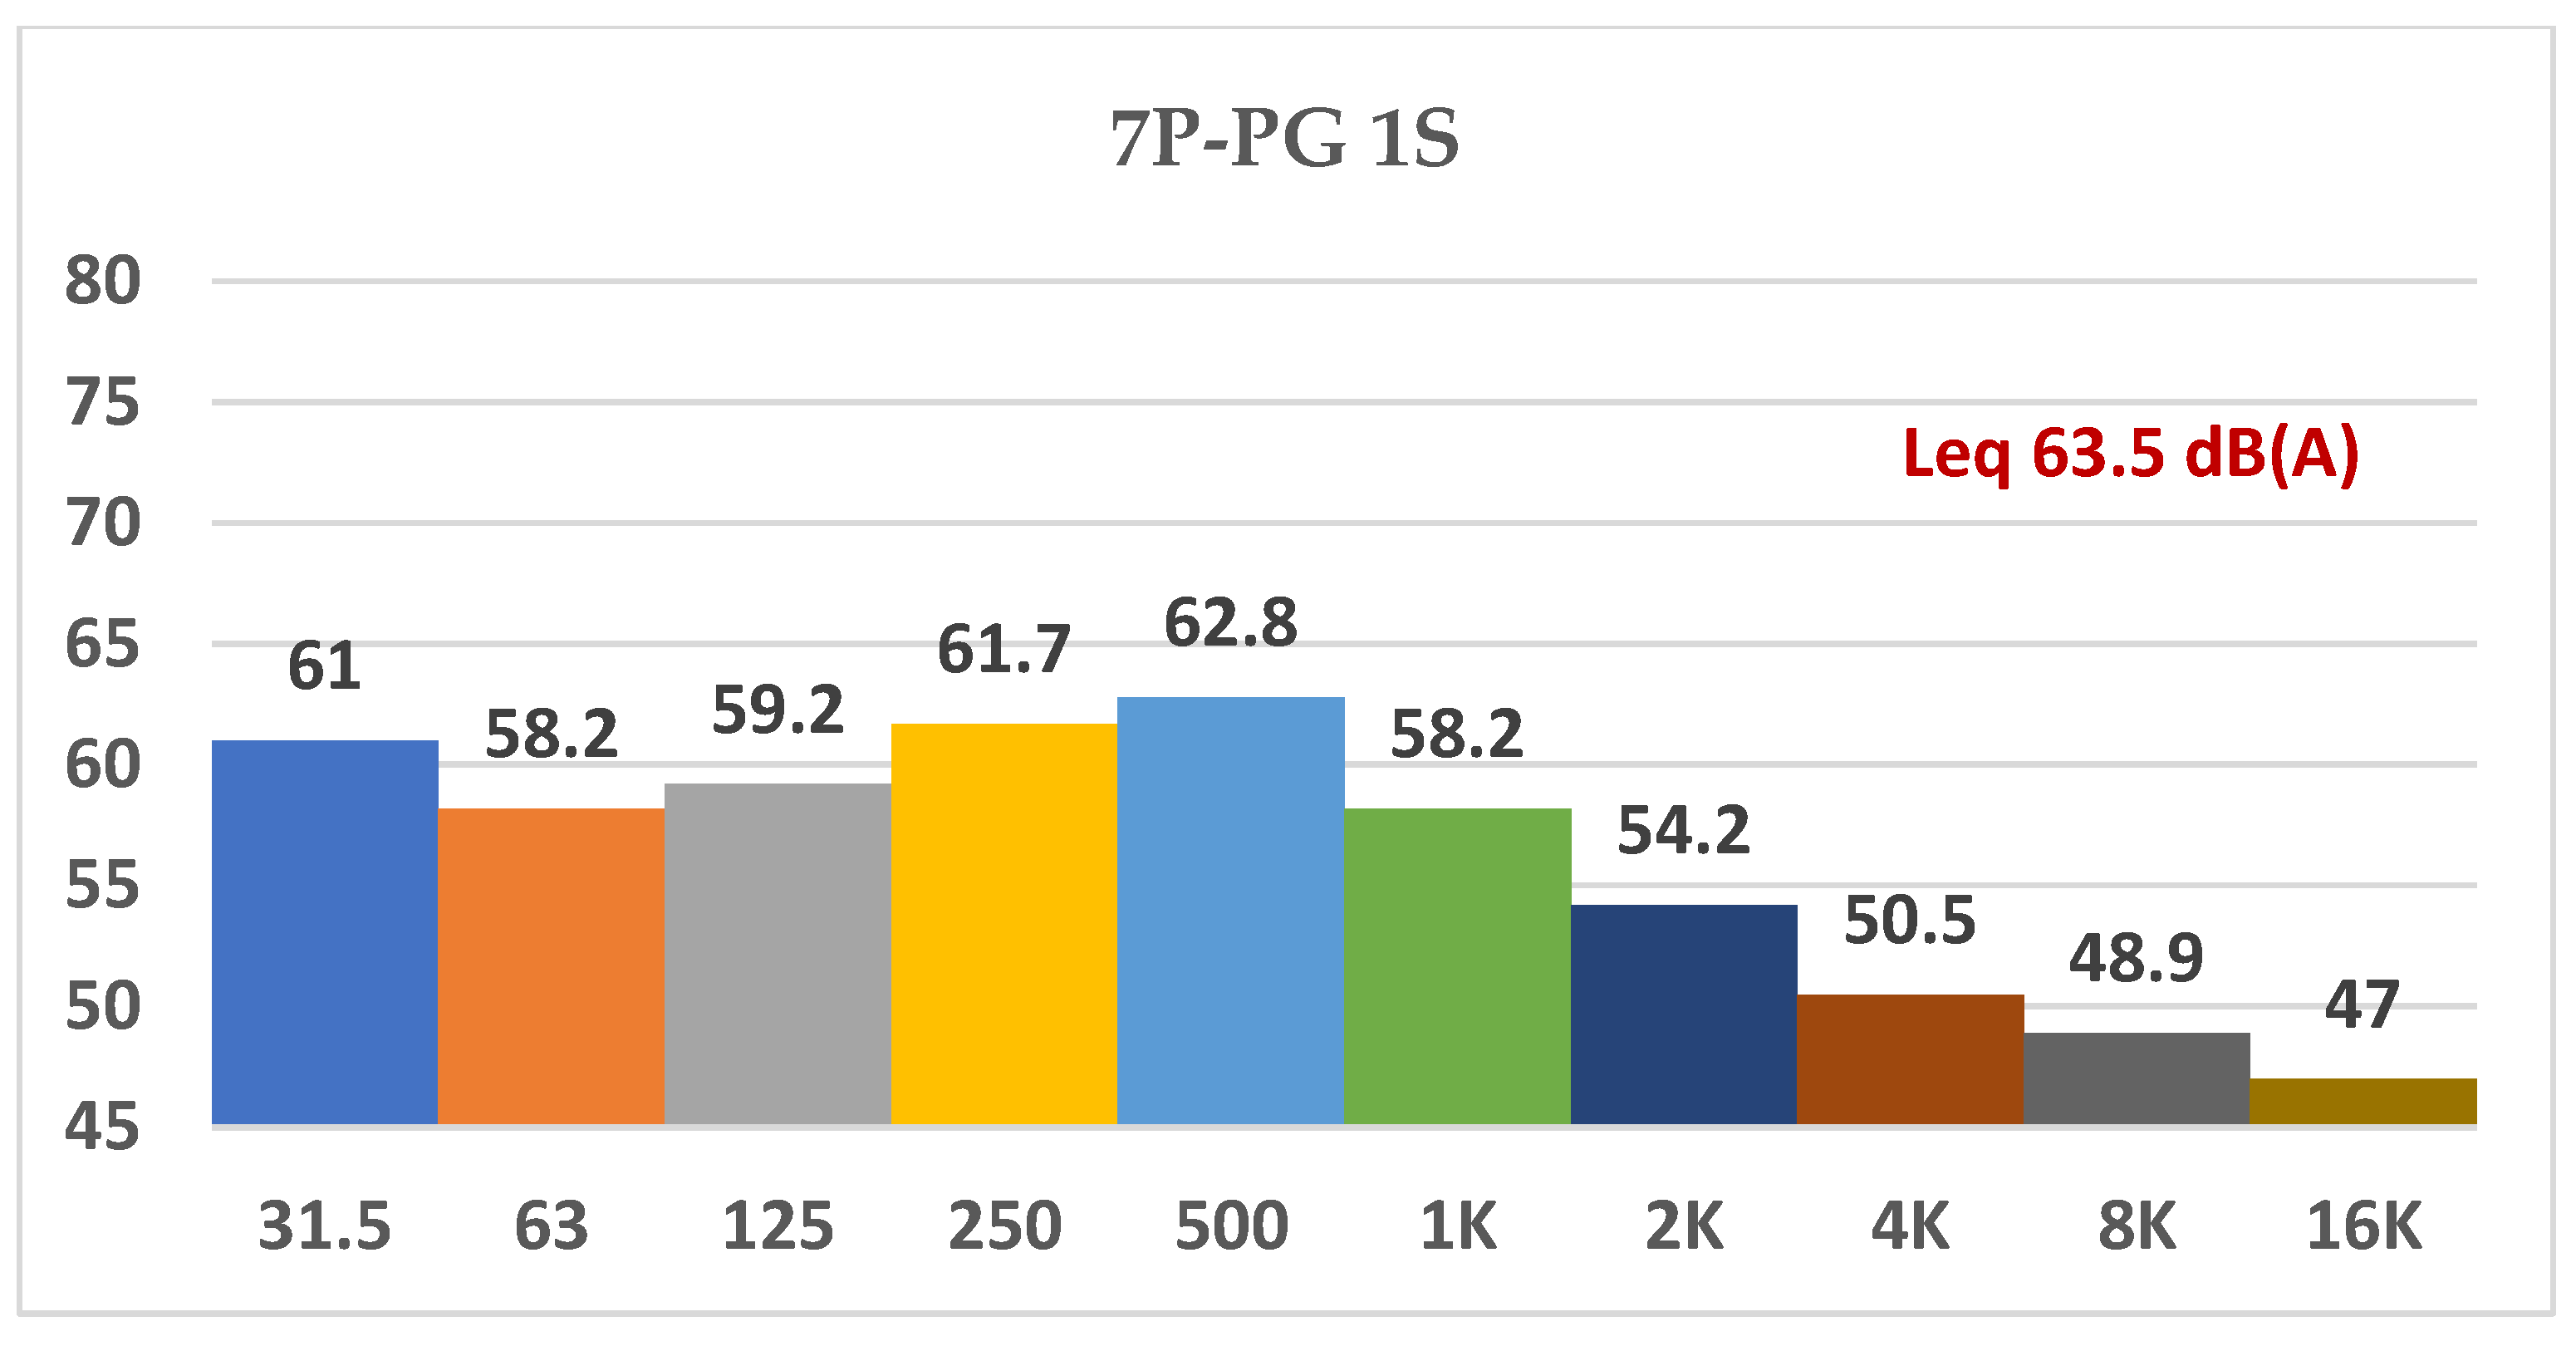
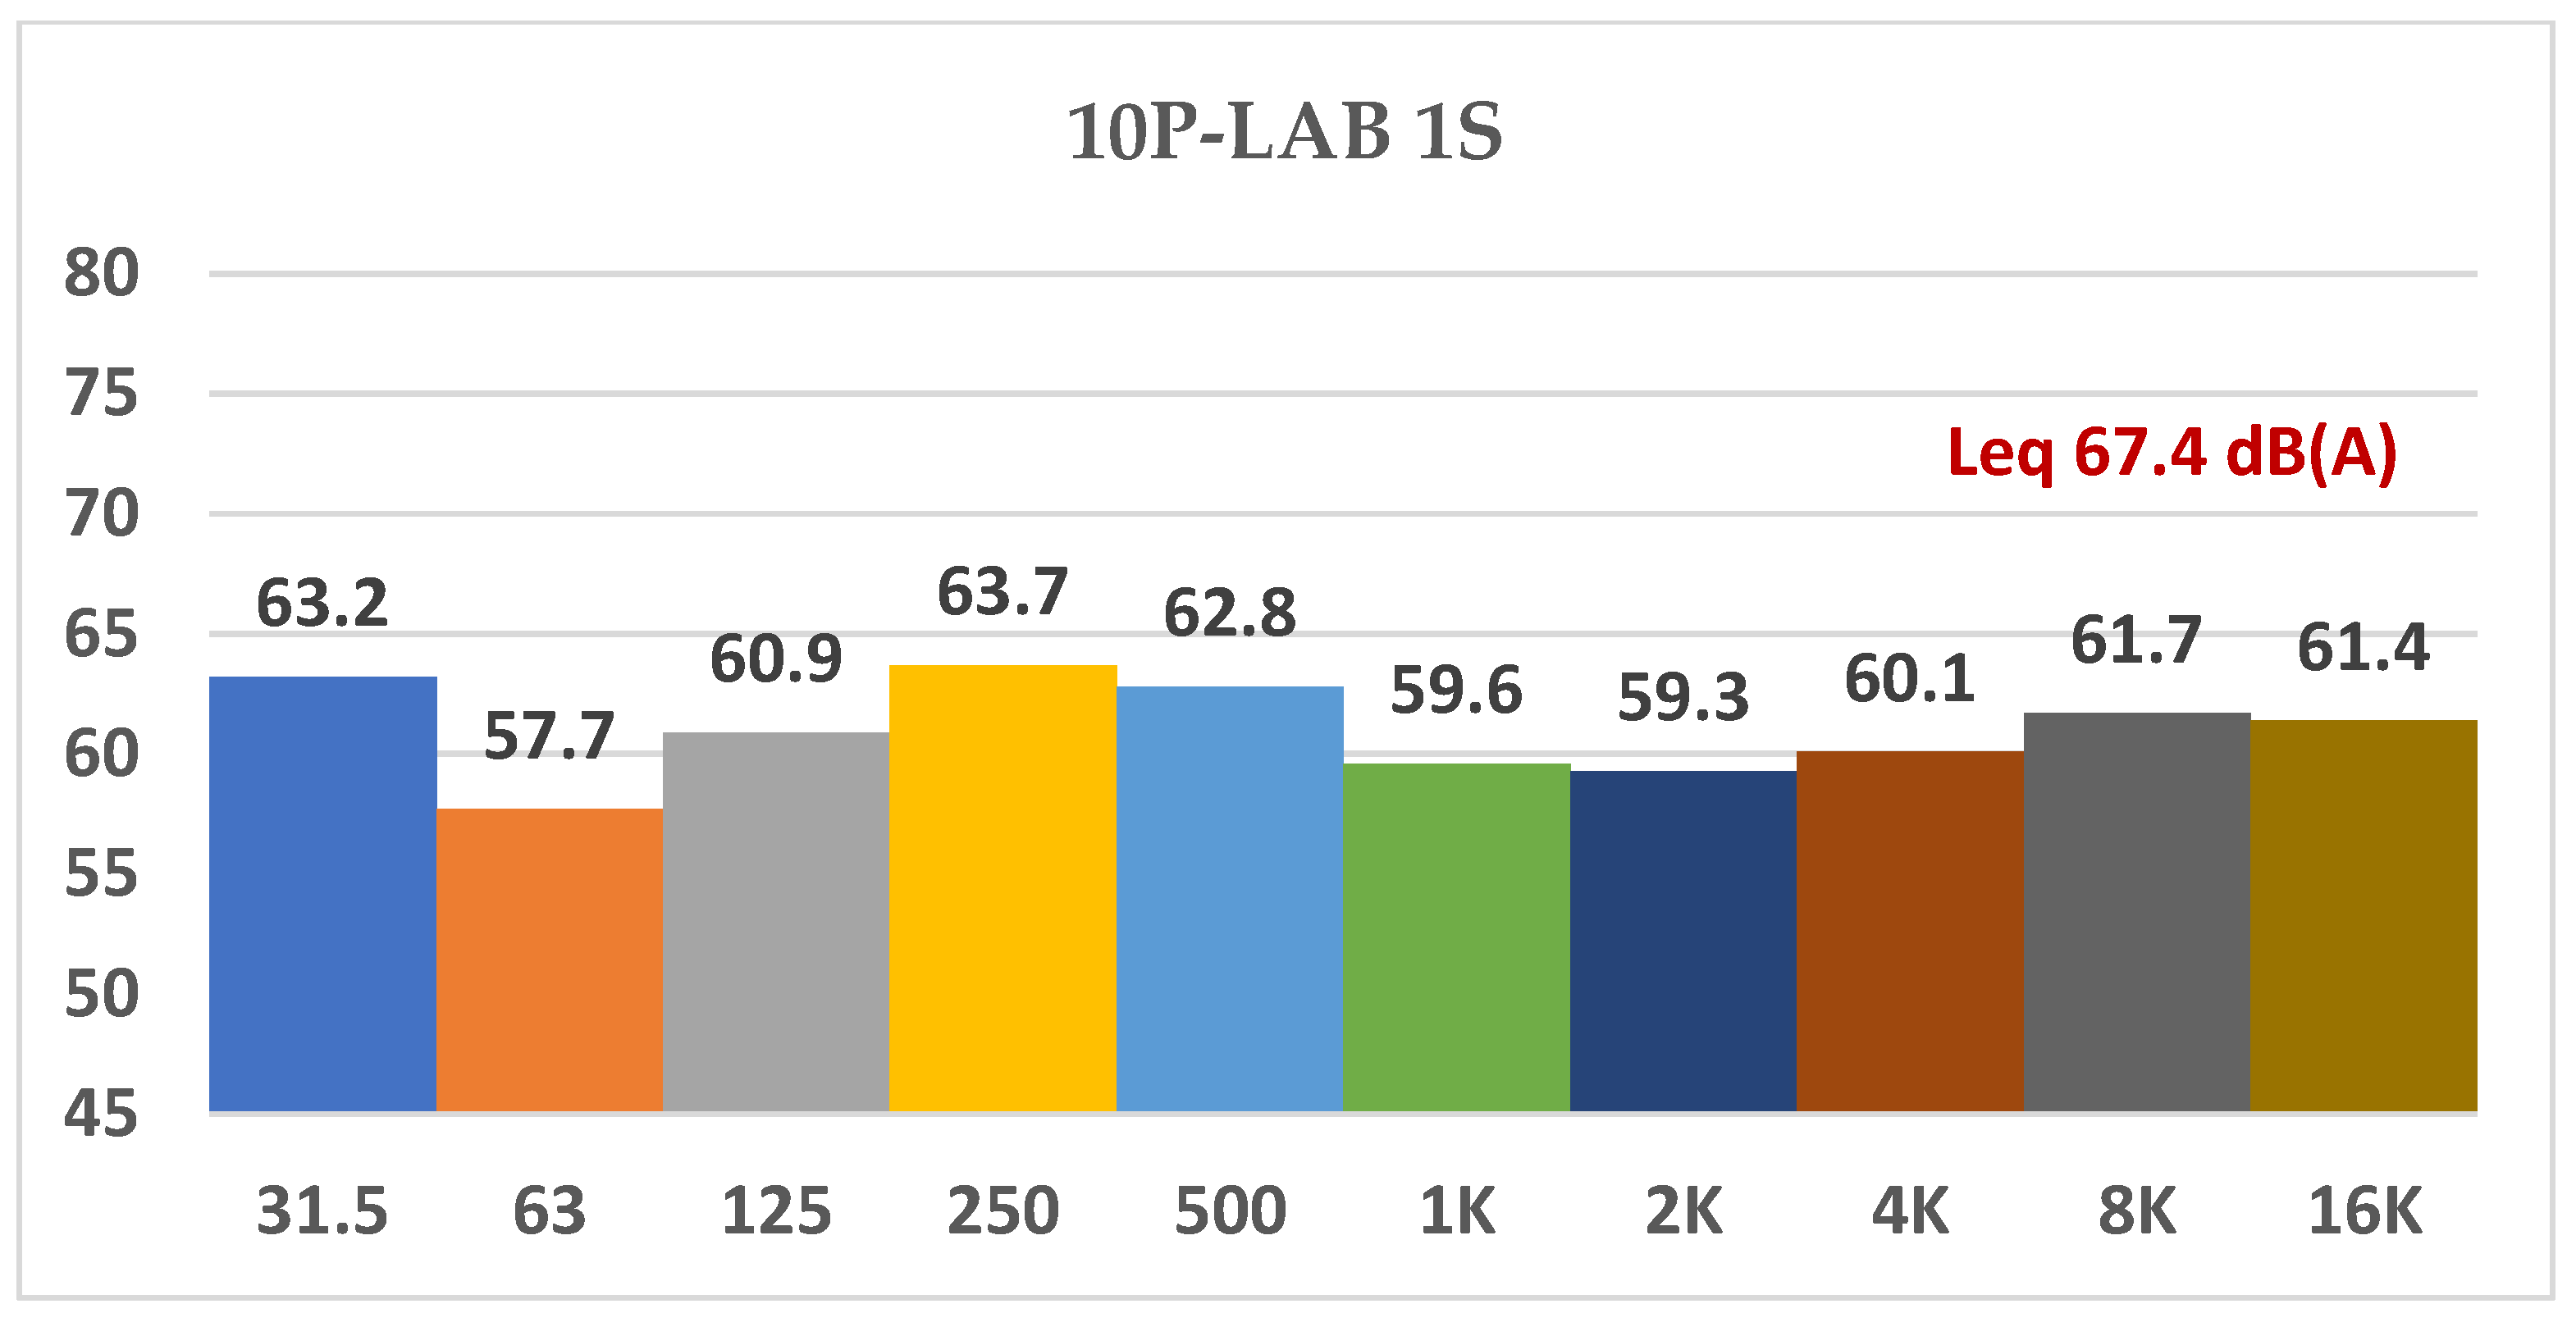
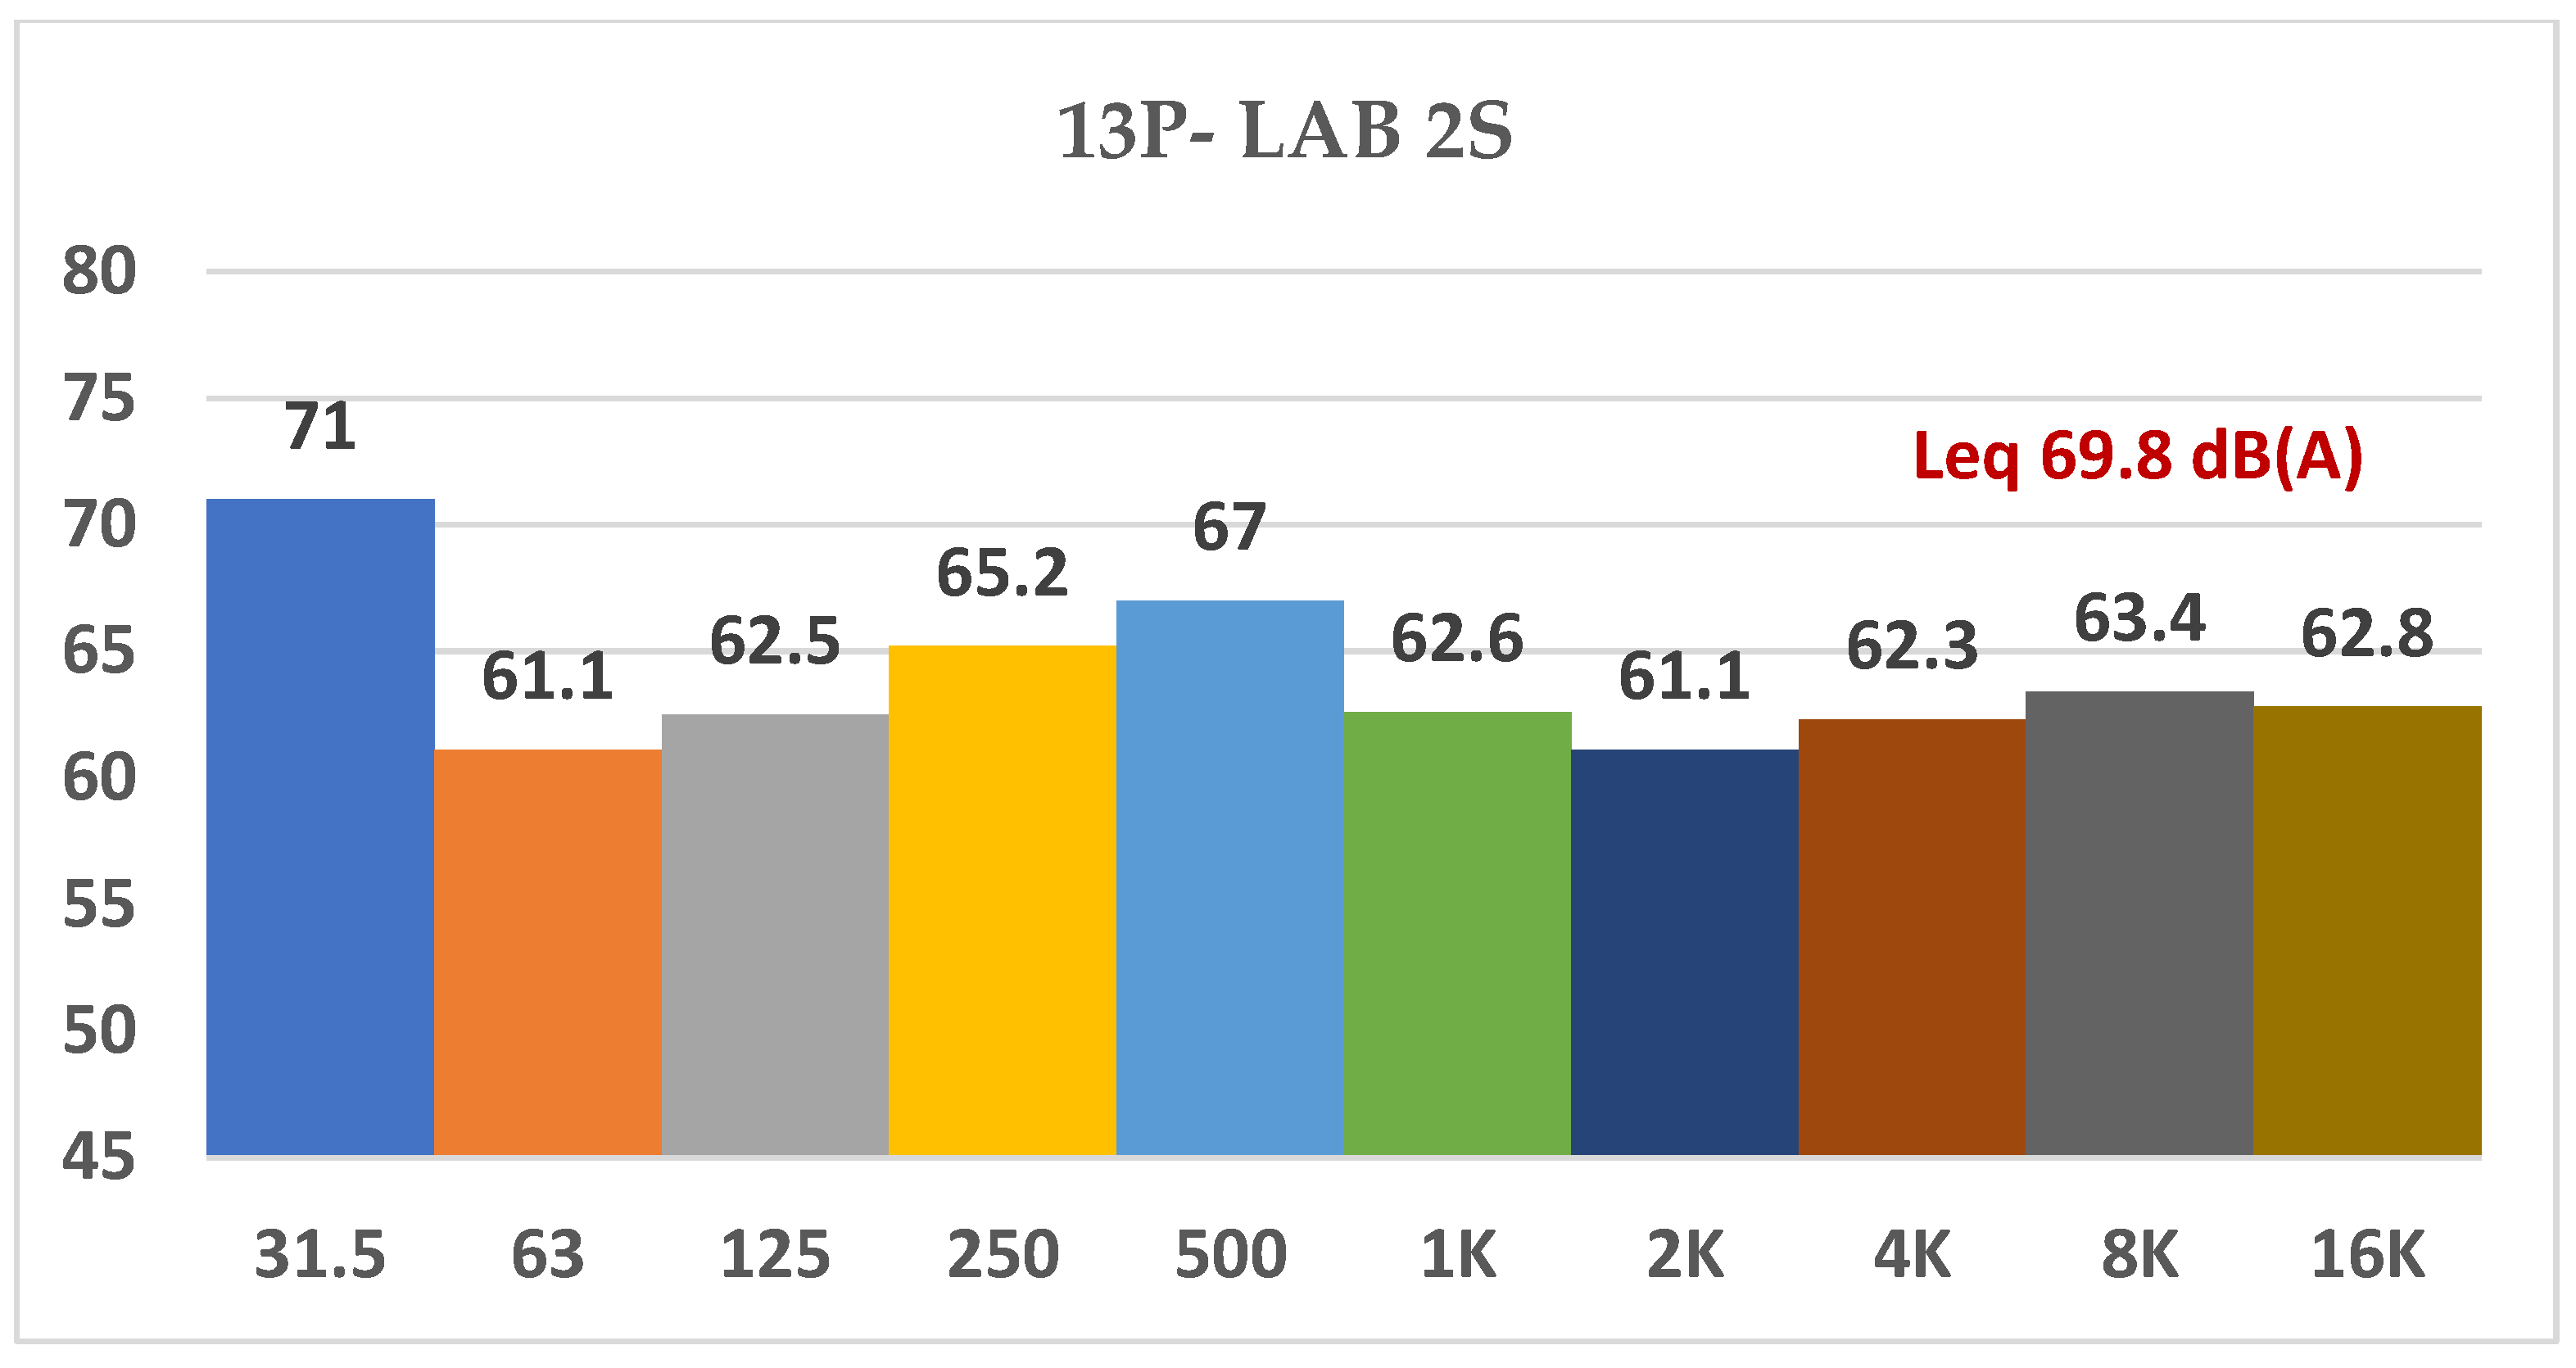
Spectrum analysis of noise at previous sites during the measurement periods is presented in Figure 4, Figure 5, Figure 6, Figure 7, Figure 8, Figure 9 and Figure 10. In these figures, Leq (or LAeq) represents the equivalent continuous sound pressure level.
The data show that work-related noise levels are within the recommended range discussed by Presidential Decree No.149/2006 [49] and the Directive 2003/10/EC [48]. The mean noise levels in the working clinics and laboratories ranged from 47.0 dB(A) to 80.8 dB(A). Overall, in the post-graduate (PG) clinic, there were significant differences in noise levels (p > 0.05) between the chairside (personal exposure measurement by dosimeters worn by students) (54.6–71.7 dB(A)) and the points of static measurements (area monitoring) (47.0–63.5 dB(A)) with airotor/micromotor/suction use at certain times and in comparison to settings with new dental units (1 year in use). In the undergraduate (UG) clinic, noise levels with suction and high/slow speed handpieces at the center of the clinics were highly significant for all the maximum readings (p = 0.001) between clinics with old equipment (25 years old units, UG1, vs. 15 years old units, UG2) [56.3–68.4 vs. 59.8–70.4 dB(A)]. Also, personal exposure measurements with the use of an ultrasonic handpiece were significantly different in UG1 vs. UG2 [54.5–102.5 dB(A)] vs. [47.5–101.2 dB(A)], respectively) (p > 0.05). Suction alone in the UG clinic [63–75 dB(A)] was significantly quieter than that in the PG clinic [69–79 dB(A)]. Chairside personal exposure measurements using an ultrasonic handpiece in UG and PG clinics were statistically different from chairside personal exposure measurements with the use of airotor/micromotor/suction and were highly significant for all the maximum readings (p = 0.001). Laboratory chairside personal exposure measurements with the use of airotor/micromotor were statistically higher than those in clinics in both LAB settings. Static measurements in the center of the laboratory setting with new units (1 year old) were equally high as those perceived in the laboratory with old units (30 years old) [50.6–89 dB(A) vs. 52.7–105.1 dB(A)].

5. Discussion

This study reports on estimated noise exposure assessments in undergraduate, postgraduate, and laboratory settings in the Department of Dentistry, School of Health Sciences of the National and Kapodistrian University of Athens, Greece. The settings had varied characteristics, as some had renovated dental equipment and others had units more than 15–30 years old, either in a clinical or laboratory environment. Overall, noise measurement findings were within the recommended limit values for dental equipment (47.5 to 80.8 dB(A) and corresponded to previous reports for noise estimation in university dental clinics and laboratories [39,40,41,42,57,58]. To mention accordingly, in India for example, it was concluded that the mean noise levels in the working clinics ranged from 63.0 dB(A) to 81.5 dB(A) [39] and 54 dB(A) to 83.3 dB(A) [58]. In Saudi Arabia, an overall noise level of 73.83 ± 4.39 dB within the dental clinical setting was calculated [57]; in Casablanca, noise levels were between 69.35 dB(A) and 72.07 dB(A) [42]; in Hong Kong, it was between 62.6 dB(A) and 67.7 dB(A) [41]. Previously, Dutta et al. [39] in their measurements showed a variation of 63.0 dB(A) to 81.5 dB(A) in the noise levels. The highest noise levels ever recorded so far were at the dental college of Damascus University, where the noise levels reached 96 dB(A) while using the sandblaster [27], and in Michigan’s pediatric university clinic, where the noise levels peaked at 103.5 dB(A) [40].
The personal exposure measurements in all settings were noisier than static area measurements when both air scaler/ultrasonic and airotor/micromotor were used, suggesting that in cases of constant use of all types of handpieces and water suction equipment, students should use hearing protectors on-site. Further, we should mention that the choice of timing in this study was in accordance with the patients’ inflow to the clinic where the peak working flow for each setting was used to avoid bias in measurements. The results indicated that the time of measurement had no influence on the sound generated when patients were being treated, as different hours consisted of the peak workflow in each clinic. This is in accordance with other findings [40].
In postgraduate clinics, despite new units on site, the noise levels did not differ from those found in undergraduate clinics with the old equipment, possibly due to the heavier workload performed by postgraduate students, as also mentioned elsewhere [27,40]. Furthermore, a comparison between data from the UG and PG clinics revealed that the high noise levels in PG settings were attributed mainly to suction units which are found next to each unit. When designing dental clinics, it is important to consider incorporating a central high-volume evacuation (HVE) unit instead of using separate units attached to each dental unit. Additionally, a silencer design for the main HVE should also be taken into consideration. Suction alone was equally noisy compared to suction using airotor/micromotor, whereas suction using an ultrasonic handpiece was noisier, as mentioned elsewhere [27]. Additionally, it is important to mention that in the PG settings, there were statistically important differences in the noise levels produced from different specialty treatments, with the therapeutic department being noisier than the prosthetics department, as also reported in a study by Baseer et al. [58].
Elevated noise levels in chairside settings were reported either in undergraduate (UG) or postgraduate (PG) clinics when ultrasonic handpieces with suction were used. This finding is consistent with previous research [59]. Since this previous reading of 85.8 dB(A), compared to our 80.8 dB(A), and that of Baseer et al. [57] where the use of a scaler and high-vacuum saliva ejector created a maximum noise of 71.39 dB(A), and the scaler alone produced a minimum noise of 68.53 dB(A), it seems that ultrasonic handpieces still need redesigning to further diminish noise production. UG clinics’ chairside personal exposure measurements with ultrasonic handpieces were above the high level for designing preventive actions, and this corresponds to findings in another study as well [60]. For the LAB settings, there is noise sensitivity when all students are simultaneously using airotor/micromotor cutting acrylic teeth, as reported elsewhere [27,38,60]. In this study, chairside personal exposure measurements show that students and staff members in the LABs should use hearing protectors, as also discussed elsewhere [43,44].
The data of this study show the necessity for noise evaluation in the working areas of dental schools. It is further suggested that students performing ultrasonic and cutting activities using airotor/micromotor handpieces for more than 30 min should wear hearing protectors, as shown by the spectrum analysis. They should then be advised to take breaks often. It is reported though that in modern dental offices, noise-induced hearing loss (NIHL) cannot be attributed only to noise generated by a high-speed handpiece [61]. Usually, the dentist is only exposed to the siren-like sound of the turbine for short bursts of 15–30 s, followed by relative periods of rest while undertaking other procedures [62]. Such short bursts of air turbines amounted to 45 min of high-intensity sound exposure each day in the frequency of 4000–8000 Hz, as was previously estimated [63]. This is the reason why personal (chairside) measurements, catching mainly handpiece noise production, and static (area) measurements, catching the overall noise of the clinic or laboratory, were performed in this study to address an overall view of the problem.
When applying exposure limit values, it is important to consider the noise reduction provided by any personal hearing protection worn during work, if applicable. In this case, no protection was provided. Usually, the most common choice for hearing protection is disposable foam or rubber-flanged earplugs, but this may make conversational speech sound muffled [64]. Students and personnel can use the same solution as performing and studio musicians—the custom-filtered musician’s earplug, which allows accurate hearing but at lower sound levels [65]. These combine a patented filter with the specific acoustics of a custom ear mold and help produce a resonance of approximately 2700 Hz (as in the normal ear), resulting in a smooth, flat attenuation from 9 to 25 dB [66].

5.1. Considerations for Dental-Clinic Occupants

As the spectrum analysis shows in this study, there are sudden bursts of noise when ultrasonic/airotor handpieces are used. It is advised then that students and personnel consider the following, suggested also elsewhere [36,37,38,39,57,58,59,60]: (a) other working methods, where possible, that involve less exposure to noise; (b) the choice of suitable work equipment, which, with regard to the work to be carried out, emits the least possible noise; (c) the possibility of providing dental students and personnel with dental equipment that complies with noise exposure limits; (d) the design and layout of dental clinics with larger distances between units than the ones mentioned here; (e) students and personnel should be adequately informed and trained to use work equipment correctly in order to minimize their exposure to noise. Furthermore, noise reduction by technical means, which could be applied more in this case for further noise protection and suggested also by others, are as follows [45,55,56,57,60]: (i) to reduce airborne noise, e.g., shielding, encapsulation of the noise source (in enclosures), sound-absorbing covers; (ii) to reduce solid-borne noise, e.g., damping or insulation; (f) appropriate maintenance programs for dental units, compressors, pumping systems, and handpieces.

5.2. Recommendation for Dental-Clinic Administration

For the upper exposure action values in some clinics, the administration of the dental school should implement a program, consisting of technical and/or organizational measures, to reduce exposure to noise levels for all stakeholders, as suggested in the relevant legislation [48,49]: (1) places within the clinic that are more exposed to noise should be appropriately marked; (2) information on noise emission should be provided by manufacturers of dental unit equipment to personnel and students; (3) noise in places of rest for students and personnel should be reduced to a level compatible with their intended purpose and conditions of use; (4) students and personnel who are already sensitive or have hearing problems must be protected against the risks specific to them; (5) in clinics and laboratories where noise exposure is equal to or exceeds the upper exposure action limits, the use of personal hearing protectors should be mandatory, the dental appointments should be shorter, and the reasons why the exposure limit values were exceeded should be identified. In cases of overexposure to the use of cutting instruments, the program of clinical or laboratory exercise should reduce noise by (i) limiting the duration and intensity of exposure; (ii) providing adequate rest periods; and (iii) organizing smart scheduling of patients in private dental boxes for all students.

5.3. Limitations of the Study

Limitations of the present study that may have influenced the results could be the space/distance between dental units, which differs between different clinics and laboratories. Since the environment, devices, and furniture are factors that can magnify the intensity of the noise beyond the dental devices [36], and although statistical differences were not observed between old and new units in our study, further estimation of noise levels should be designed considering distance between units, the existence of prophylactic booths, soundproof shields, or other furniture among them. Also, the use of new cutting handpieces could provide information on whether it is the type and maintenance of handpieces that influence noise levels. Further research in this field may include assessing the temporary threshold shift after a week-long work schedule. Another question could be whether the number of students working simultaneously with ultrasonic/airotor handpieces could change the upper sound limits in the renovated undergraduate clinics of the department where the compressor and water suction central unit are placed away from the dental operatory and within a metal cabin. Elsewhere, it was suggested that in such cases, the noise levels could be reduced by 75% to 47–60 dB(A) [67]. When suction units are attached to dental chairs, as in this case, the environment is often noisy and needs an exhaust silencer of the open-bore expansion type with interior baffling or shrouding to reduce sound levels below 80 dB(A), as mentioned elsewhere [68,69]. It should then be examined whether an under-floored suction network connecting all units in the newly renovated undergraduate clinics would account for lower noise levels vs. the renovated postgraduate clinics, where each unit has its own suction unit at chairside. It is important to mention that in this study, no acoustic measurements were performed since both clinics and laboratories are working places with no exaggerated needs for acoustics, as in concert hall areas, to count sound halo and other effects that could possibly interfere with noise levels. Furthermore, no construction materials of the study areas were assessed since some of the clinics were more than 50 years old, and no renovation of building walls has ever been performed since the time of measurements. The next step in this approach would be noise measurements when dental equipment like ultrasonic and/or airotors, known to produce the highest noise levels, could be used in renovated clinics with soundproof construction materials and protective shields. Interesting enough would be to finally check noise annoyance levels and mental consequences in dental clinics, possibly by using the recommendations of the International Commission on Biological Effects of Noise (ICBEN) [69,70,71,72].

6. Conclusions

Spectrum analysis of noise levels in dental settings is an effective method to show dependence on space, specialty, type, and setting of the dental equipment used, and the noise levels produced during flow dental work in both undergraduate and postgraduate clinics and laboratories. Noise levels in the newly renovated postgraduate clinics were not significantly different from those produced in clinics with old equipment. When all students work together using ultrasonic/airotor handpieces, the chances of overpassing maximum noise levels according to regulations are greater. All students should use hearing protectors when the workflow in clinics and labs is at maximum levels with the simultaneous use of handpieces, especially ultrasonic devices. Information and protection details should be shared with all stakeholders via various means.

Author Contributions

Conceptualization, M.A. and S.K.; methodology, M.A. and S.K.; software, S.K.; validation, M.A., P.T. and S.K.; formal analysis, M.A. and S.K.; investigation, M.A., P.T. and S.K.; resources, M.A.; data curation, M.A. and S.K.; writing—original draft preparation, M.A. and P.T.; writing—review and editing, M.A., P.T. and S.K.; visualization, M.A.; supervision, M.A.; funding acquisition, M.A. All authors have read and agreed to the published version of the manuscript.

Funding

This research received no external funding.

Institutional Review Board Statement

The study was conducted in accordance with the Declaration of Helsinki and approved by the Institutional Research Ethics Committee of the Department of Dentistry, School of Health Sciences, National and Kapodistrian University of Athens, Greece (no 569/02.02.2023).

Informed Consent Statement

Informed written consent was obtained from all subjects involved in the study.

Data Availability Statement

Not applicable.

Acknowledgments

The authors would like to thank the Hellenic Institute for Occupational Health and Safety (ELINYAE) for the noise measurement equipment used in the study.

Conflicts of Interest

The authors declare no conflict of interest.

Abbreviations

The physical parameters and other abbreviations used for anticipation of risks are defined as follows: dB scale: A logarithmic scale to measure sound pressure level. A two-fold increase in sound energy (eg, two identical jackhammers instead of one) will cause the sound pressure level to increase by 3 dB. A ten-fold increase in sound energy (10 jackhammers) will cause the sound pressure level to increase by 10 dB, which is perceived as about twice as loud. Lmax: The highest sound pressure level in each period. LA: MaxLdB(A). Leq: The equivalent continuous sound level is the steady sound level, which over a given period, has the same total energy as the fluctuating noise. It represents the total noise exposure for the period of interest or an energy average noise level. Exchange Rate Factor (Q): This is the increase in noise level that corresponds to a doubling of the noise energy. LAeq is always based on an Exchange Rate of 3 dB. Using the 3 dB exchange rate, the 8 h average level is known as LEP, d or LEX, 8 h. The exchange rate, which is predominantly used worldwide (and the one recommended by NIOSH, 2016), is 3 dB [73]. In the US, the exchange rate defined in the OSHA standard is 5 dB. LDEN: LDEN (Day–Evening–Night Level), also referred to as DENL, is the A-filtered average sound pressure level, measured over a 24 h period, with a 10 dB penalty added to the night (2300–0700 h or 2200–0600 h, respectively), and a 5 dB penalty added to the evening period (1900–2300 h or 1800–2200 h, respectively), and no penalty added to the average level in the daytime (0700–1900 h or 0600–1800 h, respectively). The LDN measure is like the LDEN but omits the 5 dB penalty during the evening period. The penalties are introduced to indicate people’s extra sensitivity to noise during the night and evening. Both LDEN and LDN are based on A-weighted sound pressure levels, although this factor is not usually indicated in subscript. LΕΧ,8 h: Daily noise exposure level (LΕΧ,8 h): (dB(A) in terms of 20 μPa) time-weighted average value of noise exposure over an eight-hour working day, as defined by the international standard ISO 1999:1990 [74] revised by the ISO 1999:2013 [75]. It covers all types of noise encountered in the working environment, including impulses. LΧ,8 h: Weekly noise exposure level (LΧ,8 h), time-weighted average of daily noise exposure over a week of five eight-hour working days, as defined by the international standard ISO 1999:1990 [74]. Leq: Equivalent continuous sound level is provided in standardized notation: 15–30 dB LAeq or LpAeq, the p for pressure is commonly omitted, L is for Level. NIHL: Noise-induced hearing loss. Ppeak: Ppeak (Peak sound pressure level), maximum value of C−weighted instantaneous noise pressure. SPL: Sound pressure level (SPL) can be described subjectively based on the decibel (dB) scale. SLP is a logarithmic measure of the effective pressure of a sound relative to a reference value. A range of 0 to 40 dB is considered quiet to very quiet, while 60 to 80 dB is generally described as noisy. A sound pressure level of 100 dB is perceived as very noisy, whereas anything greater than 120 dB is intolerable dB [76].

References

  1. Basner, M.; Babisch, W.; Davis, A.; Brink, M.; Clark, C.; Janssen, S.; Stansfeld, S. Auditory and non-auditory effects of noise on health. Lancet 2014, 12, 1325–1332. [Google Scholar] [CrossRef]
  2. Themann, C.L.; Masterson, E.A. Occupational noise exposure: A review of its effects, epidemiology, and impact with recommendations for reducing its burden. J. Acoust. Soc. Am. 2019, 146, 3879. [Google Scholar] [CrossRef]
  3. Neitzel, R.L.; Svensson, E.B.; Sayler, S.K.; Ann-Christin, J. A comparison of occupational and nonoccupational noise exposures in Sweden. Noise Health 2014, 16, 270–278. [Google Scholar] [CrossRef]
  4. Lee, Y.; Lee, S.; Lee, W. Occupational and Environmental Noise Exposure and Extra-Auditory Effects on Humans: A Systematic Literature Review. GeoHealth 2023, 7, e2023GH000805. [Google Scholar] [CrossRef]
  5. Antoniadou, M.; Tziovara, P.; Antoniadou, C. The Effect of Sound in the Dental Office: Practices and Recommendations for Quality Assurance—A Narrative Review. Dent. J. 2022, 10, 228. [Google Scholar] [CrossRef]
  6. Wells, T.S.; Seelig, A.D.; Ryan, M.A.; Jones, J.M.; Hooper, T.I.; Jacobson, I.G.; Boyko, E.J. Hearing loss associated with US military combat deployment. Noise Health 2015, 17, 34–42. [Google Scholar] [CrossRef]
  7. Alberti, G.; Portelli, D.; Galletti, C. Healthcare Professionals and Noise-Generating Tools: Challenging Assumptions about Hearing Loss Risk. Int. J. Environ. Res. Public Health 2023, 20, 6520. [Google Scholar] [CrossRef]
  8. Dierickx, M.; Verschraegen, S.; Wierinck, E.; Willems, G.; van Wieringen, A. Noise Disturbance and Potential Hearing Loss Due to Exposure of Dental Equipment in Flemish Dentists. Int. J. Environ. Res. Public Health 2021, 18, 5617. [Google Scholar] [CrossRef]
  9. Chadha, S.; Kamenov, K.; Cieza, A. The world report on hearing, 2021. Bull. World Health Organ. 2021, 199, 242–242A. [Google Scholar] [CrossRef]
  10. Fuente, A.; Hickson, L. Noise-induced hearing loss in Asia. Int. J. Audiol. 2011, 50, S3–S10. [Google Scholar] [CrossRef]
  11. Vos, T.; Flaxman, A.D.; Naghavi, M. Years lived with disability (YLDs) for 1160 sequelae of 289 diseases and injuries 1990–2010: A systematic analysis for the Global Burden of Disease Study 2010. Lancet 2012, 380, 2163–2196. [Google Scholar] [CrossRef]
  12. Health Assured Team. Noise Levels at Work & Mental Health. 9 December 2019. Available online: https://www.healthassured.org/blog/noise-at-work-mental-health/ (accessed on 20 August 2023).
  13. Oishi, N.; Schacht, J. Emerging treatments for noise-induced hearing loss. Expert Opin. Emerg. Drugs 2011, 16, 235–245. [Google Scholar] [CrossRef]
  14. Karpa, M.J.; Gopinath, B.; Beath, K. Associations between hearing impairment and mortality risk in older persons: The Blue Mountains Hearing Study. Ann. Epidemiol. 2010, 20, 452–459. [Google Scholar] [CrossRef]
  15. Fritschi, L.; Brown, A.L.; Kim, R.; Schwela, D.H.; Kephalopoulos, S. (Eds.) Burden of Disease from Environmental Noise; World Health Organization: Bonn, Germany, 2011.
  16. Kurabi, A.; Keithley, E.M.; Housley, G.D.; Ryan, A.F.; Wong, A.C. Cellular mechanisms of noise-induced hearing loss. Hear. Res. 2017, 349, 129–137. [Google Scholar] [CrossRef]
  17. Natarajan, N.; Batts, S.; Stankovic, K.M. Noise-Induced Hearing Loss. J. Clin. Med. 2023, 12, 2347. [Google Scholar] [CrossRef]
  18. Miedema, H.M.; Oudshoorn, C.G. Annoyance from transportation noise: Relationships with exposure metrics DNL and DENL and their confidence intervals. Environ. Health Perspect. 2001, 109, 409–416. [Google Scholar] [CrossRef]
  19. Themann, C.L.; Suter, A.H.; Stephenson, M.R. National research agenda for the prevention of occupational hearing loss—Part 1. Sem. Hear. 2013, 34, 145–207. [Google Scholar] [CrossRef]
  20. Muzet, A. Environmental noise, sleep and health. Sleep. Med. Rev. 2007, 11, 135–142. [Google Scholar] [CrossRef]
  21. Peng, L.; Chen, J.; Jiang, H. The impact of operating room noise levels on stress and work efficiency of the operating room team: A protocol for systematic review and meta-analysis. Medicine 2022, 101, e28572. [Google Scholar] [CrossRef]
  22. van Kempen, E.; Babisch, W. The quantitative relationship between road traffic noise and hypertension: A meta-analysis. J. Hypertens. 2012, 30, 1075–1086. [Google Scholar] [CrossRef]
  23. Sørensen, M.; Andersen, Z.J.; Nordsborg, R.B. Road traffic noise and incident myocardial infarction: A prospective cohort study. PLoS ONE 2012, 7, e39283. [Google Scholar] [CrossRef] [PubMed]
  24. Kerns, E.; Masterson, E.A.; Themann, C.L.; Geoffrey, T.; Calvert, M. Cardiovascular conditions, hearing difficulty, and occupational noise exposure within US industries and occupations. Am. J. Ind. Med. 2018, 61, 477–491. [Google Scholar] [CrossRef] [PubMed]
  25. Stansfeld, S.A.; Matheson, M.P. Noise pollution: Non-auditory effects on health. Br. Med. Bull. 2003, 68, 243–257. [Google Scholar] [CrossRef]
  26. Friedrich, M.G.; Boos, M.; Pagel, M. New technical solution to minimise noise exposure for surgical staff: The ‘silent operating theatre optimisation system’. BMJ Innov. 2017, 3, 196–205. [Google Scholar] [CrossRef]
  27. Qsaibati, M.L.; Ibrahim, O. Noise levels of dental equipment used in dental college of Damascus University. Dent. Res. J. 2014, 11, 624–630. [Google Scholar]
  28. Ohrstrom, E.; Skanberg, A.; Svensson, H.; Gidlof-Gunnarsson, A. Effects of road traffic noise and the benefit of access to quietness. J. Sound Vibrat. 2006, 295, 40–59. [Google Scholar] [CrossRef]
  29. Antoniadou, M. Estimation of Factors Affecting Burnout in Greek Dentists before and during the COVID-19 Pandemic. Dent. J. 2022, 10, 108. [Google Scholar] [CrossRef] [PubMed]
  30. Busch-Vishniac, I.J.; West, J.E.; Barnhill, C.; Hunter, T.; Orellana, D.; Chivukula, R. Noise levels in Johns Hopkins Hospital. J. Acoust. Soc. Am. 2005, 118, 3629–3645. [Google Scholar] [CrossRef]
  31. Berglund, B.; Lindvall, T.; Schwela, D.H. Guidelines for Community Noise; World Health Organization (WHO): Geneva, Switzerland, 1999. Available online: http://whqlibdoc.who.int/hq/1999/a68672.pdf (accessed on 11 July 2013).
  32. Messingher, G.; Ryherd, E.E.; Ackerman, J. Hospital noise and staff performance. J. Acoust. Soc. Am. 2012, 132, 2031. [Google Scholar] [CrossRef]
  33. Antoniadou, M. Quality of Life and Satisfaction from Career and Work-Life Integration of Greek Dentists before and during the COVID-19 Pandemic. Int. J. Environ. Res. Public Health 2022, 19, 9865. [Google Scholar] [CrossRef]
  34. Ryherd, E.E.; Waye, K.P.; Ljungkvist, L. Characterizing noise and perceived work environment in a neurological intensive care unit. J. Acoust. Soc. Am. 2008, 123, 747–756. [Google Scholar] [CrossRef] [PubMed]
  35. Eichwald, J.; Carroll, Y. Loud Noise: Too Loud, Too Long! J. Environ. Health 2018, 80, 34–35. [Google Scholar] [PubMed]
  36. Choosong, T.; Kaimook, W.; Tantisarasart, R.; Sooksamear, P.; Chayaphum, S.; Kongkamol, C.; Srisintorn, W.; Phakthongsuk, P. Noise exposure assessment in a dental school. Saf. Health Work. 2011, 2, 348–354. [Google Scholar] [CrossRef]
  37. da Cunha, K.; dos Santos, R.; Klien, C. Assessment of noise intensity in a dental teaching clinic. BDJ Open 2017, 3, 17010. [Google Scholar] [CrossRef]
  38. Kadanakuppe, S.; Bhat, P.K.; Jyothi, C.; Ramegowda, C. Assessment of noise levels of the equipments used in the dental teaching institution, Bangalore. Indian J. Dent. Res. 2011, 22, 424–431. [Google Scholar] [CrossRef] [PubMed]
  39. Dutta, A.; Mala, K.; Acharya, S.R. Sound levels in conservative dentistry and endodontics clinic. J. Conserv. Dent. 2013, 16, 121–125. [Google Scholar] [CrossRef]
  40. Burk, A.; Neitzel, R.L. An exploratory study of noise exposures in educational and private dental clinics. J. Occup. Environ. Hyg. 2016, 13, 741–749. [Google Scholar] [CrossRef]
  41. Ai, Z.; Mak, C.; Wong, H. Noise level and its influences on dental professionals in a dental hospital in Hong Kong. Build. Serv. Eng. Res. Technol. 2017, 38, 522–535. [Google Scholar] [CrossRef]
  42. Amine, M.; Aljalil, Z.; Redwane, A.; Delfag, I.; Lahby, I.; Bennani, A. Assessment of Noise Levels of Equipment Used in the Practical Dental Teaching Activities. Int. J. Dent. 2021, 2021, 6642560. [Google Scholar] [CrossRef]
  43. Paramashivaiah, R.; Prabhuji, M.L. Mechanized scaling with ultrasonics: Perils and proactive measures. J. Indian Soc. Periodontol. 2013, 17, 423–428. [Google Scholar] [CrossRef]
  44. Mohan, K.M.; Chopra, A.; Guddattu, V.; Singh, S.; Upasana, K. Should Dentists Mandatorily Wear Ear Protection Device to Prevent Occupational Noise-induced Hearing Loss? A Randomized Case-Control Study. J. Int. Soc. Prev. Community Dent. 2022, 12, 513–523. [Google Scholar] [CrossRef] [PubMed]
  45. Verbeek, J.H.; Kateman, E.; Morata, T.C.; Dreschler, W.A.; Mischke, C. Interventions to prevent occupational noise-induced hearing loss. Cochrane Database Syst. Rev. 2012, 10, CD006396. [Google Scholar] [PubMed]
  46. Murphy, W.; Franks, J. NIOSH Criteria for a Recommended Standard: Occupational Noise Exposure, Revised Criteria 1998. J. Acoust. Soc. Am. 2002, 111, 2397. [Google Scholar] [CrossRef]
  47. Johnson, T.A.; Cooper, S.; Stamper, G.C.; Chertoff, M. Noise Exposure Questionnaire: A Tool for Quantifying Annual Noise Exposure. J. Am. Acad. Audiol. 2017, 28, 14–35. [Google Scholar] [CrossRef]
  48. Directive 2003/10/EC of the European Parliament and of the Council on the Minimum Health and Safety Requirements Regarding the Expo. 6 February 2003. Available online: https://eur-lex.europa.eu/LexUriServ/LexUriServ.do?uri=OJ:L:2003:042:0038:0044:EN:PDF (accessed on 20 August 2023).
  49. E-Nomothesia.gr. Greek Presidential Degree No 149/2006. Available online: https://www.e-nomothesia.gr/kat-ergasia-koinonike-asphalise/pd-149-2006.html (accessed on 20 August 2023).
  50. Occupational Safety Health Administration, O.S.H.A. Available online: https://www.osha.gov/ (accessed on 20 August 2023).
  51. The National Institute for Occupational Safety and Health (NIOSH). Available online: https://www.cdc.gov/niosh/index.htm (accessed on 20 August 2023).
  52. US Environmental Protection Agency (EPA). Available online: https://www.epa.gov/ (accessed on 20 August 2023).
  53. Hammer, A.; Coene, M.; Rooryck, J.; Govaerts, P. The production of Dutch finite verb morphology: A comparison between hearing-impaired CI children and specific language impaired children. Lingua 2014, 139, 68–79. [Google Scholar] [CrossRef]
  54. Neitzel, R. Contributions of non-occupational activities to total noise exposure of construction workers. Ann. Occup. Hyg. 2004, 48, 463–473. [Google Scholar] [CrossRef]
  55. Carter, L.; Williams, W.; Black, D.; Bundy, A. The leisure-noise dilemma: Hearing loss or hearsay? What does the literature tell us? Ear Hear. 2014, 35, 491–505. [Google Scholar] [CrossRef]
  56. Antoniadou, M.; Intzes, A.; Kladouchas, C.; Christou, I.; Chatzigeorgiou, S.; Plexida, M.; Stefanidakis, V.; Tzoutzas, I. Factors Affecting Water Quality and Sustainability in Dental Practices in Greece. Sustainability 2023, 15, 9115. [Google Scholar] [CrossRef]
  57. Baseer, M.; Al Saffan, A.; Al Masoud, S.; Dahy, W.T.; Aldali, H.W.; Walid, B.A.; Walid, B.R.; Al Mugeiren, O.M. Noise levels encountered in university dental clinics during different specialty treatments. J. Fam. Med. Prim. Care 2021, 10, 2987–2992. [Google Scholar] [CrossRef]
  58. Bhagwat, S.; Hirlekar, P.; Padhye, L. Sound levels in conservative dentistry and endodontics clinic. Indian J. Oral Health Res. 2019, 5, 11–16. [Google Scholar] [CrossRef]
  59. Mojarad, F.; Massum, T.; Samavat, H.   Noise Levels in Dental Offices and Laboratories in Hamedan, Iran. J. Dent. 2009, 6, 181–186. [Google Scholar]
  60. Leather, P.; Beale, D.; Sullivan, L. Noise, psychosocial stress and their interaction in the workplace. J. Environ. Psychol. 2003, 23, 213–222. [Google Scholar] [CrossRef]
  61. Altinöz, H.C.; Gökbudak, R.; Bayraktar, A.; Belli, S. A pilot study of measurement of the frequency of sounds emitted by high-speed dental air turbines. J. Oral Sci. 2001, 43, 189–192. [Google Scholar] [CrossRef] [PubMed]
  62. Forman-Franco, B.; Abramson, A.L.; Stein, T. High-speed drill noise and hearing: Audiometric survey of 70 dentists. J. Am. Dent. Assoc. 1978, 97, 479–482. [Google Scholar] [CrossRef]
  63. Sockwell, C.L. Dental handpieces and rotary cutting instruments. Dent. Clin. N. Am. 1971, 15, 219–244. [Google Scholar] [CrossRef]
  64. Kessler, H.E. Use of earplugs. J. Am. Dent. Assoc. 1960, 61, 715. [Google Scholar] [CrossRef]
  65. Killion, M.; Devilbliss, E.D.; Stewart, J. An earplug with uniform 15 dB attenuation. Hear. J. 1988, 41, 14–17. [Google Scholar]
  66. Musicians Earplugs. 2012. Available online: http://www.etymotic.com/pdf/erme-brochure.pdf (accessed on 20 August 2023).
  67. Clean and Quiet Air. 2009. Available online: http://www.jun-air.com/catalogs/dental_english.pdf (accessed on 20 August 2023).
  68. International Labour Organization, NATLEX. Database of National Labour, Social Security and Related Human Rights Legislation. Available online: https://www.ilo.org/dyn/natlex/natlex4.detail?p_lang=en&p_isn=81113Section226219 (accessed on 20 August 2023).
  69. Section 226219.74 Dental Vacuum and Evacuation Equipment. 2010. Available online: http://www.wbdg.org/ccb/VA/VAASC/VA%2022%2062%2019.74.pdf (accessed on 20 August 2023).
  70. European Commission. Position Paper on Dose Response Relationships between Transportation Noise and Annoyance; European Communities: Luxembourg, 2002. [Google Scholar]
  71. Birk, M.; Ivina, O.; von Klot, S.; Babisch, W.; Heinrich, J. Road traffic noise: Self-reported noise annoyance versus gis modelled road traffic noise exposure. J. Environ. Monit. 2011, 13, 3237–3245. [Google Scholar] [CrossRef]
  72. Sundstrom, E.; Town, J.P.; Rice, R.W.; Osborn, D.P.; Brill, M. Office Noise, Satisfaction, and Performance. Environ. Behav. 1994, 26, 195–222. [Google Scholar] [CrossRef]
  73. NIOSH. Available online: https://www.cdc.gov/niosh/docs/98-126/pdfs/CriteriaDoc_98-126.pdf?id=10.26616/NIOSHPUB98126 (accessed on 20 August 2023).
  74. ISO 1999:1990. Acoustics — Determination of Occupational Noise Exposure and Estimation of Noise-Induced Hearing Impairment. Available online: https://www.iso.org/standard/6759.html (accessed on 20 August 2023).
  75. ISO 1999:2013. Acoustics — Estimation of Noise-Induced Hearing Loss. Available online: https://www.iso.org/standard/45103.html (accessed on 20 August 2023).
  76. SVANTEK ACADEMY. Available online: https://svantek.com/academy/sound-pressure-level-spl/#:~:text=Sound%20pressure%20level%20(SPL)%20can,than%20120%20dB%20is%20intolerable (accessed on 20 August 2023).
Figure 1. Mapping of UG and PG clinics where static (area) and personal (chairside) noise measurements took place.
Applsci 13 10869 g001
Figure 2. Students wearing personal sound measurement equipment (arrows show position of atomic measurement equipment).
Applsci 13 10869 g002
Figure 3. The Solo 01 dB-Metravib and the two Bruel and Kjaer Noise Dose Meters (Type 4436) were calibrated prior to testing noise measurements.
Applsci 13 10869 g003
Figure 4. Spectrum analysis of workplace noise at position 4P (center of the UG1).
Applsci 13 10869 g004
Figure 5. Spectrum analysis of workplace noise at position 5P (center of UG 2S).
Applsci 13 10869 g005
Figure 6. Spectrum analysis of workplace noise at position 6P (center of UG 2S).
Applsci 13 10869 g006
Figure 7. Spectrum analysis of workplace noise at position 7P (center of PG 1S).
Applsci 13 10869 g007
Figure 8. Spectrum analysis of workplace noise at position 8P (chairside PG 2A).
Applsci 13 10869 g008
Figure 9. Spectrum analysis of workplace noise at position 10P (center of LAB 1S).
Applsci 13 10869 g009
Figure 10. Spectrum analysis of workplace noise at position 13P (center of LAB 2S).
Applsci 13 10869 g010
Table 1. Exposure limit values and exposure action values according to the Directive 2003/10/EC and Presidential Decree No. 149/2006 used in the present study.
ValuesLEX, 8 hPeakPpeak
Exposure limit values87 dB(A)140 dB©200 Pa
Upper exposure action values85 dB(A)137©(C)140 Pa
Lower exposure action values 80 dB(A) 135 dB(C)112 Pa
Table 2. Noise measurements performed in dental settings.
Measurements SettingsPersonal Dosemeters (for Personal Exposure Measurement)Static
Measurements
UG1, 2nd floor
(40 dental operatory units, 25 years old, 280 m2 × height 2.90 m)
Two users for 67 min
Number of people present: 34 students, 12 personnel
Three static positions for 23 min each
UG2, 3rd floor
(40 dental operatory units, 15 years old, 280 m2, height 2.90 m)
Two users for 73 min
Number of people present: 33 students, 12 personnel
Three static positions for 18 min each
PG1, 2nd floor
(12 dental operatory units, of 1 year old, 162 m2, height 2.90 m)
Two users for 58 min
Number of people present: 10 dentists, 10 patients, and 6 personnel
Three static positions for 27 min each
PG2, 4th floor
(12 dental operatory units, 1 year old, 162 m2, height 2.90 m)
Two users for 45 min
Number of people present: 8 dentists, 8 patients, and 4 personnel
Three static positions for 18 min each
LAB1, basement
(40 dental operatory units, 1 year old, 105 m2, height 2.90 m)
Two users for 38 min
Number of people present: 36 students and 8 personnel
Three static positions for 18 min each
LAB2, basement
(40 dental operatory units, 30 years old, 105 m2, height 2.90 m)
Two users for 39 min
Number of people present: 40 students and 3 personnel
Three static positions for 31 min each
Table 3. Data from measurement positions of the study.
Position Clinic/LaboratoryMethodLAM.Peak dB(C)Time (Min)LeqdB(A)
1PUG1,
hand instruments, airotor/micromotor
Personal measurement102.5119.46778.5
2PUG2
hand instruments, airotor/micromotor
Personal measurement101.1128.57374.5
3PUG2
ultrasonic handpiece, hand instruments
Personal measurement108.6119.65880.8
4PUG1S
all sounds
Static measurement 82.1103.02371.6
5PUG2S
all sounds
Static measurement 81.2100.32069.8
6PUG2S
all sounds
Static measurement 77.597.81866.7
7PPG1
all sounds
Static measurement 77.0108.82763.5
8PPG2
all sounds
Static measurement 80.2107.51571.7
9PPG2
ultrasonic handpiece and hand instruments
Personal measurement109.6133.94578.0
10PLAB1
airotor, acrylic cutting
Static measurement 74.796.71667.4
11PLAB1
airotor/micromotor
Personal dosemeters 101.6128.93876.5
12PLAB2
airotor/micromotor use
Personal measurement105.1133.23978.9
13PLAB2
airotor/micromotor
Static measurement 89.0115.93169.8
Disclaimer/Publisher’s Note: The statements, opinions and data contained in all publications are solely those of the individual author(s) and contributor(s) and not of MDPI and/or the editor(s). MDPI and/or the editor(s) disclaim responsibility for any injury to people or property resulting from any ideas, methods, instructions or products referred to in the content.