
Study of Soot Deposits during Continuous Methane Pyrolysis in a Corundum Tube
by
 and
and
Matvey S. Galtsov-Tsientsiala
,
Aleksandr O. Dudoladov
,
Anatoly V. Grigorenko
and
Mikhail S. Vlaskin
* Joint Institute for High Temperatures, Russian Academy of Sciences, 125412 Moscow, Russia
*
Author to whom correspondence should be addressed.
Appl. Sci. 2023, 13(19), 10817; https://doi.org/10.3390/app131910817
Submission received: 7 September 2023
/
Revised: 22 September 2023
/
Accepted: 25 September 2023
/
Published: 29 September 2023
(This article belongs to the Special Issue New Insights into Green Chemistry)
Abstract
:Methane pyrolysis is one of the promising methods for producing low-carbon hydrogen, while one of the main problems of methane pyrolysis technology is soot clogging of the reactor space. In this work, soot deposits were studied during continuous methane pyrolysis in a corundum tube with an inner diameter of 50 mm. Experiments were carried out at temperatures of 1000 °C, 1050 °C, 1100 °C, 1200 °C and 1400 °C with methane flow rates of 1 L/min and 5 L/min. Each experiment lasted 1 h. The formed soot accumulated inside the reactor (corundum tube) and the connected filter, where the gaseous product of methane pyrolysis was separated from the soot. The gaseous product was studied by gas chromatography. The soot was studied by SEM, BET and ICP-MS. With an increase in the temperature of the pyrolysis process from 1000 to 1200 °C, the hydrogen yield increased from 28.64 to 92.74% and from 1.10% to 72.09% at a methane flow rate of 1 and 5 L/min, respectively. The yield of soot increased from 1.28 g at 1000 °C to 43.9 g at 1400 °C (at a methane flow rate of 1 L/min). With an increase in the flow rate of methane from 1 to 5 l/min, the yield of soot at 1200 °C increased by almost two times to 75.65 g. It was established that in the region of the reactor where maximum heating occurs, the accumulated soot sinters and forms dense growths. At 1050 °C, the particle size of soot varies from 155 to 650 nm, at 1200 °C—from 157 to 896 nm, and at 1400 °C—from 77 to 532 nm. The specific surface of soot was 3.5 m2/g at 1000 °C and 8.0 m2/g at 1400 °C. The purity of the produced carbon black was about 99.95%. This study is useful in the selection of materials and technical solutions for a pilot plant for methane pyrolysis.
1. Introduction
One of the promising methods of hydrogen and carbon black production with reduced CO2 emissions is the thermal decomposition of methane (so called methane pyrolysis) [1], the reaction of which is:
CH4 → C↓ + 2H2↑
The development of methane pyrolysis technology is an urgent task, the solution of which can significantly reduce carbon dioxide emissions into the atmosphere in the industrial production of hydrogen and carbon black, providing economic efficiency [2,3].
Hydrogen is one of the most in-demand technical gases. Annual consumption of hydrogen is about 94 million tons [4]. It is used in chemical industry for the synthesis of many substances, and it is a raw material for ammonia production [5]; methanol and hydrochloric acids are also produced using hydrogen [6]. Also, hydrogen is used in metallurgy for the direct reduction of iron [7]. Hydrogen is required for hydrotreatment of petroleum products, which increases the level of refinement of raw materials and the quality of products [8]. Hydrogen is also used in medicine [9], the food industry [10] and the glass industry [11]. In addition, hydrogen is considered a promising energy carrier in the stationery and transport energy sectors [12]. Currently, hydrogen is produced mainly by steam conversion of methane:
CH4 + 2H2O → CO2 + 4H2,
However, it leads to significant emissions of CO2. Due to the necessity of carbon dioxide emission reduction in hydrogen production, oxygen-free methane decomposition may become a sustainable alternative in hydrogen production on the industrial scale [13].
Carbon black is another important substance, which is used in many applications. Technical carbon is a specially produced industrial carbon black. It strengthens car tires, improves the mechanical properties of plastics, and determines the distinctive properties of many other chemical products. The annual production of carbon black is about 13–14 million tons [14]. Carbon black is used in the production of tires [15], rubbers and plastics, and it is used as a reinforcing component in composite materials [16]. Carbon can be used in the production of structural materials formed from carbon plastics [17]. Also, carbon black is used in the manufacture of technical products, plaster and construction mixtures, as well as in the paint and varnish industry [18]. High-quality carbon black with the minimum content of impurities and low emissions of carbon dioxide during its production is also in high demand. Today, carbon black is mainly produced from raw petroleum [19]. This process intensifies the greenhouse effect by emitting greenhouse gases. In methane pyrolysis, the formation of CO2 is negligible. The development of this method will help to normalize the level of greenhouse gas emissions and replace the existing production process, along with its high emission of carbon dioxide.
Methane pyrolysis can be carried out in several ways. One of these methods is plasma pyrolysis [20]. The advantage of this method is its low metal consumption due to the compact plasma-based equipment. Modern plants for plasma methane pyrolysis can be created without additional transformers or frequency converters; power can be supplied from an industrial three-phase network. Another basic method is catalytic methane pyrolysis [21,22,23]. The main drawback of this method is the neutralization of the catalyst by carbon deposits, which reduces the catalyst efficiency, and its subsequent destruction is possible [21]. Another method of methane pyrolysis is the decomposition in a melt of metals or salts [24,25,26].
A common method to produce hydrogen and carbon black is the thermal decomposition of methane in an oxygen-free environment. One of the main problems of thermal methane pyrolysis is a problem of solid soot deposition in the reactor space. The resulting solid carbon fills the areas, making it difficult for the gas to pass through, which can lead to equipment failure in a long-term process. A solution for the permanent removal of soot from the pyrolysis plant is a priority task in this field.
Tubes for the plants for methane pyrolysis can be made of different materials, such as quartz, carbides, etc. In this work, the methane thermal decomposition tube is made of corundum, as it is a thermally stable material that is suitable for high temperatures, chemically inert and durable.
In this paper, a study of the patterns of soot deposition during the continuous thermal decomposition of methane in a heated corundum tube is described. The paper considers the dependence of soot deposition dynamics on the process temperature and the rate of methane flow through the heated corundum tube. In addition, the properties of the generated soot depending on the pyrolysis process parameters are studied. Illustrative results are presented, including the mass of soot produced and microphotographs of the structure of soot particles. The study was carried out for the subsequent search for a technical solution for the removal of carbon sludge from the pyrolysis plant when creating a pilot plant for the thermal decomposition of gaseous hydrocarbons.
2. Experimental Part
2.1. Chemical Reagents
Pyrolysis experiments were carried out using methane grade A (methane volume fraction 99.99%) produced by the Moscow Gas Processing Plant (Moscow, Russia). Nitrogen grade 5.0 (volume fraction of nitrogen 99.999%) was used to purge the tube to remove air.
2.2. Experimental Plant
2.2.1. Schematic Diagram of the Experimental Plant
The experiments were carried out using a tube furnace. The diagram of the experimental plant is shown in Figure 1A.
The experimental plant consists of a 6 kW XINYU SK2-6-17TPB4 tube furnace. A corundum tube with internal diameter of 50 mm is installed within the furnace. The furnace heaters are made of molybdenum disilicide and the length of the heating zone is 440 mm. The furnace is equipped with a temperature regulator. Nitrogen, as an inert gas, is supplied to the reactor from a tank through a pressure reducer with the flow monitored via a rotameter. Methane is fed to the reactor from a tank connected to a methane ramp equipped with a pressure reducer, the flow is also monitored with a rotameter. Changes in pressure in the tube are monitored with the help of the manometer installed at the inlet of the corundum tube.
From the corundum tube (reactor), pyrolysis products enter the filter. The inner diameter of the pipeline between the corundum tube and the filter is 14 mm.
Gas-tight rubber gaskets are used as seals in the flanges. After the furnace, the gas stream either enters the atmosphere under extraction or is filtered and sampled in a gas chamber (sampler) for analysis of the chemical composition.
The experimental filter in Figure 1B is a plastic bucket with a tight-fitting lid. It has two openings for incoming tubes, through which the mixture of soot and gaseous product of methane pyrolysis enters the filter and the soot-free gas exits. In the bucket, the incoming gas passes through a fabric bag attached to a plastic bottle, which fixes the bag in place and prevents the filter from quickly becoming clogged with soot due to the holes in the bag. The soot is accumulated inside the bag.
2.2.2. Methodology for the Experiments
The furnace is heated to the temperature specified by the conditions of the experiment. While the furnace is heating, the corundum tube is blown with nitrogen at a rate of 1 L/min. When the furnace has been heated to the required temperature, the nitrogen supply is stopped, and methane is injected into the corundum tube. After the start of methane feeding into the corundum tube, the furnace is purged for 3–15 min, depending on the initial rate of methane feeding, while the pyrolysis products are discharged from the tube into the exhaust ventilation system. Then, the outlet from the corundum tube is connected to the filter in which soot is separated, and after the filter, the hydrogen is passed through a water trap (bubbler) and is discharged into the exhaust ventilation system. The experiment is carried out in this mode for 1 h, after which the methane flow is stopped and nitrogen is fed into the furnace again, and the filter is disconnected from the corundum tube outlet and the furnace is switched off. While the furnace is cooling down, the corundum tube is blown with nitrogen. The pressure in the furnace is monitored by means of a pressure gauge installed at the inlet of the corundum tube. After the furnace has cooled down, the soot is extracted from the tube and from the filter and weighed separately on a scale.
Experiments were carried out at different process temperatures: 1000 °C, 1050 °C, 1100 °C, 1200 °C and 1400 °C, with methane flow rates of 1 L/min and 5 L/min. The pressure inside the pyrolysis reactor was about atmospheric pressure.
At the 5th minute of the experiment, the gaseous product of methane pyrolysis was taken into a gas sampler for subsequent analysis on a gas chromatograph. The gas sampler is a rubber chamber (ball), from which air was previously pumped out with the help of a compressor, then it was attached to the filter outlet and pumped with a gas mixture. The gaseous product of methane pyrolysis was then fed into a gas chromatograph for analysis of chemical composition.
2.3. Research Methods
2.3.1. Gas Chromatography
The chemical composition of the resulting gaseous product of methane pyrolysis was studied on a Chromatec Crystal 5000 gas chromatograph. The general principle of operation of one of the analytical schemes was used in the analysis of components of a model gas mixture—H2, O2/N2 (air), CO, CO2, hydrocarbons C1–C5 (paraffin-olefin class with isomers). The chromatograph comprises three detectors, a set of multiport automatic taps, 6 chromatographic columns, and the complete analysis takes place in isothermal mode at 80 °C for 20 min. On a single start of the method, a programmable switchover of taps was carried out and a record was started for all detectors, the pre-columns were switched and blown out as the analysis progressed. The chromatograph was calibrated with gas mixtures.
2.3.2. Microscopy
The microstructure of soot particles was studied on a Nova NanoSem 650 (Riga, Latvia) scanning electron microscope using a circular backscattered electron detector, which allows the contrast of the average atomic numbers of the microstructure elements on the relief surfaces. The samples were attached using electrically conductive tape. The samples were not coated with a conductive coating to avoid possible screening of nanoscale objects. The scans were carried out with secondary electrons at accelerating voltages of 2 and 3 kV. In order to reduce the unavoidable charging of the samples by the electron probe, images were acquired by multiple scans using a “drift correction” mode.
2.3.3. Low-Temperature Nitrogen Adsorption Method
The structural characteristics of the samples of soot were determined from nitrogen adsorption isotherms at 77 K, taken on a Nova 2200e surface area analyzer (Quantachrome, Boynton Beach, FL, USA). Before measuring isotherms, samples were degassed at 200 °C and residual pressure of 10−3 mm Hg for 3 h. The surface area of the samples was calculated from the BET equation, the total pore volume was determined from the nitrogen adsorption isotherm at a relative pressure of 0.995.
2.3.4. Inductively Coupled Plasma Mass Spectrometry
Determination of element content was performed using an Agilent 7900 MS-ISP spectrometer manufactured by Agilent Technologies (Santa Clara, CA, USA) equipped with a two-way glass spray chamber cooled to 2 °C, a MicroMist glass atomizer, a quartz torch and nickel cones. The analysis results were processed using Agilent Mass Hunter software v12.0. (Agilent Technologies, Santa Clara, CA, USA).
To homogenize the sample of soot, it was ground on a planetary mono-mill Pulverisette 6 classic line from Fritsch GmbH (Idar-Oberstein, Germany) in a zirconium grinding beaker at 200 rpm for 5 min.
Conversion of the sample of soot into solution was carried out by acid mineralization using a Multiwave PRO microwave oven manufactured by Anton Paar GmbH (Austria). For this purpose, 0.1000 ± 0.0100 g of sample was placed in PTFE TFM reaction vessels and 3.0 mL of concentrated nitric acid (65%, EMSURE® ISO, for analysis, Merck Millipore Corporation, Darmstadt, Germany) was added. The PTFE TFM lidded vessels were fixed in protective ceramic coverslips placed in holders, additional outer coverslips were placed, and the resulting systems were sealed for decomposition in the 8NXF100 rotor. The samples were heated according to a two-step program by setting the microwave power: 20 min at 0 to 900 W, 30 min at 900 W. At the end of mineralization and after cooling the vessels to 50 ± 10 °C, they were opened, the obtained solutions were quantitatively transferred into 50 mL polypropylene tubes (SPL Life Sciences Co., Ltd., Pocheon, Republic of Korea) and diluted with deionized water to 30 mL. Deionized water was obtained using an Adrona B30 Trace water purification unit manufactured by Adrona SIA (Riga, Latvia).
To assess the convergence of the results obtained, three samples of each sample were subjected to decomposition. The control experiments were carried out similarly according to the above-described scheme without adding the sample to the vessels.
The concentrations of elements in the solutions obtained in the course of sample preparation were set using the calibration solutions prepared from the multi-element ICP-MS-68-A-A standard solution and single-element standard solutions of Pd, Pt (10,000 µg/cm3 each); Ru, Rh, Ir (100 µg/cm3 each); Te (1000 µg/cm3), produced by High-Purity Standards (North Charleston, SC, USA), in a matrix of 5 vol.% nitric acid.
3. Results and Discussion
3.1. Composition of Gaseous Product of Methane Pyrolysis
Table 1 shows the volumetric content of the component in the gas sample of the gaseous product of methane pyrolysis depending on the methane flow rate (1 and 5 L/min) and process temperature (1000, 1100 and 1200 °C).
Table 1 shows that the highest hydrogen yield is obtained at 1200 °C and a methane flow rate of 1 L/min. With temperature increasing, the content of hydrogen increases, but it decreases with increasing flow rate. These results are in agreement with those of Hazzim F. Abbas et al. [27] and Maryam Younessi-Sinaki et al. [28], which show that as the process temperature increases, the hydrogen yield increases at the same methane flow rate. Hydrogen yield values in this work are close to the maximum theoretical values obtained in [28] as a result of numerical simulation of the kinetics of the methane pyrolysis process.
3.2. Yield of Soot
Table 2 shows the mass of soot produced in the methane pyrolysis process at different temperatures and flow rates in different parts of the experimental plant (in reactor tube and in filter).
As can be seen from the results, the amount of soot produced increases with increasing temperature and methane flow rate. With increasing temperature, the yield of soot increases significantly, as shown in the table: from 1000 °C to 1400 °C the mass of soot produced increased from 1.28 g to 43.9 g. The main part of the soot is accumulated in the reaction zone closer to the outlet of the tube, which makes it necessary to find a technical solution for removing soot from the plant to prevent blockages and equipment failure during operation at high flow rates and for long periods. It can be noted that as the flow rate increases, the proportion of soot in the filter increases, indicating the importance of the linear velocity of the methane flow in the process of soot deposition.
Figure 2 shows the dependence of soot formation on temperature. Figure 3 and Figure 4 show the dense build-up of soot that accumulates at higher temperatures. This is due to the fact that the soot, in this case, turns out to be a little crumbly and sinters in the tube. It was noticed that the crust of sintered soot formed after the experiment was easily separated from the tube. This is due to the fact that the materials have different coefficients of thermal expansion.
Separate experiments were carried out at 1200 °C for 5 L/min to assess soot formation as a function of methane flow rate. As a result, the amount of soot produced increased by two times, with the bulk of the carbon observed in the tube, as shown in Figure 5. Due to the sintering of soot particles and the formation of build-ups in the reaction zone, the main part of the carbon is not blown out by the gas flow into the filter and accumulates in the tube.
The soot produced is not evenly distributed across the tube, but rather starts in the middle, i.e., the reaction zone, and ends at the tube outlet, as the incoming gas flow blows the produced soot further into the filter. Such carbon blockages are one of the key problems of methane pyrolysis technology. The solution to this problem is an important technical challenge.
Figure 6 shows the change in pressure in the tube during the experiments. Pressure surges are caused by blockages in the pipeline between the corundum tube and the filter, the inner diameter of which is 14 mm. Soot builds up in the constriction and pressure surges are observed. After reaching a certain pressure, the bottleneck breaks through and returns to its initial state. It can be seen that at 1000 °C, 1050 °C and 1400 °C, the pressure in the tube was almost unchanged, indicating that there were no blockages at the outlet of the tube and the gas flow was free in the whole experimental setup. The greatest number of carbon plugs occurred at 1100 °C (amounting to seven), with the pressure changing by leaps and bounds due to the penetration of carbon plugs by the incoming gas flow.
This is due to the fact that carbon accumulates in narrow sections and is knocked out of the experimental plant under gas pressure, as a result of which the pressure in the tube drops sharply. The maximum pressure was 100 mm Hg and was observed in experiments at 1100 °C and 1200 °C. It should be noted that at temperatures of 1000 °C and 1050 °C, soot is obtained in small quantities and is oily. At the same time, at 1400 °C, carbon black is formed in large quantities and sintered into build-ups in the tube. The largest number of plugs occurs at 1100 °C and 1200 °C, when soot is still oily, but more is formed than at 1000 °C.
3.3. Microstructure of Soot Particles
Figure 7A shows SEM image of soot sampled in the filter produced by methane pyrolysis at 1050 °C and a methane flow of 1 L/min at 5 µm resolution.
SEM analysis showed that the particles of soot are spherical in shape and their size depends on the process temperature. At 1050 °C, the size of soot particles varies from 155 to 650 nm, at 1200 °C the size ranges from 157 to 896 nm, and at 1400 °C particles from 77 to 532 nm are obtained. It can be seen that at 1400 °C, the soot particles are smaller than at lower temperatures.
Figure 7B shows SEM image of soot sampled in the filter produced by methane pyrolysis at 1400 °C and a methane flow rate of 1 L/min at 5 µm resolution. Figure 7B shows that with increasing temperature, the soot particles become less sticky, which should also be considered during pyrolysis at high temperatures, because sticky particles form much denser clogs in the experimental plant.
Figure 8 shows the soot obtained in the reactor tube and in the filter. Soot obtained in the reactor tube consists of a film (Figure 8A) and powder with sintered inclusions (Figure 8B). The film is what was adjacent to the inner wall of the corundum tube. The soot shown in Figure 8C was taken from the filter bag. This soot represents a fine powder without sintered inclusions.
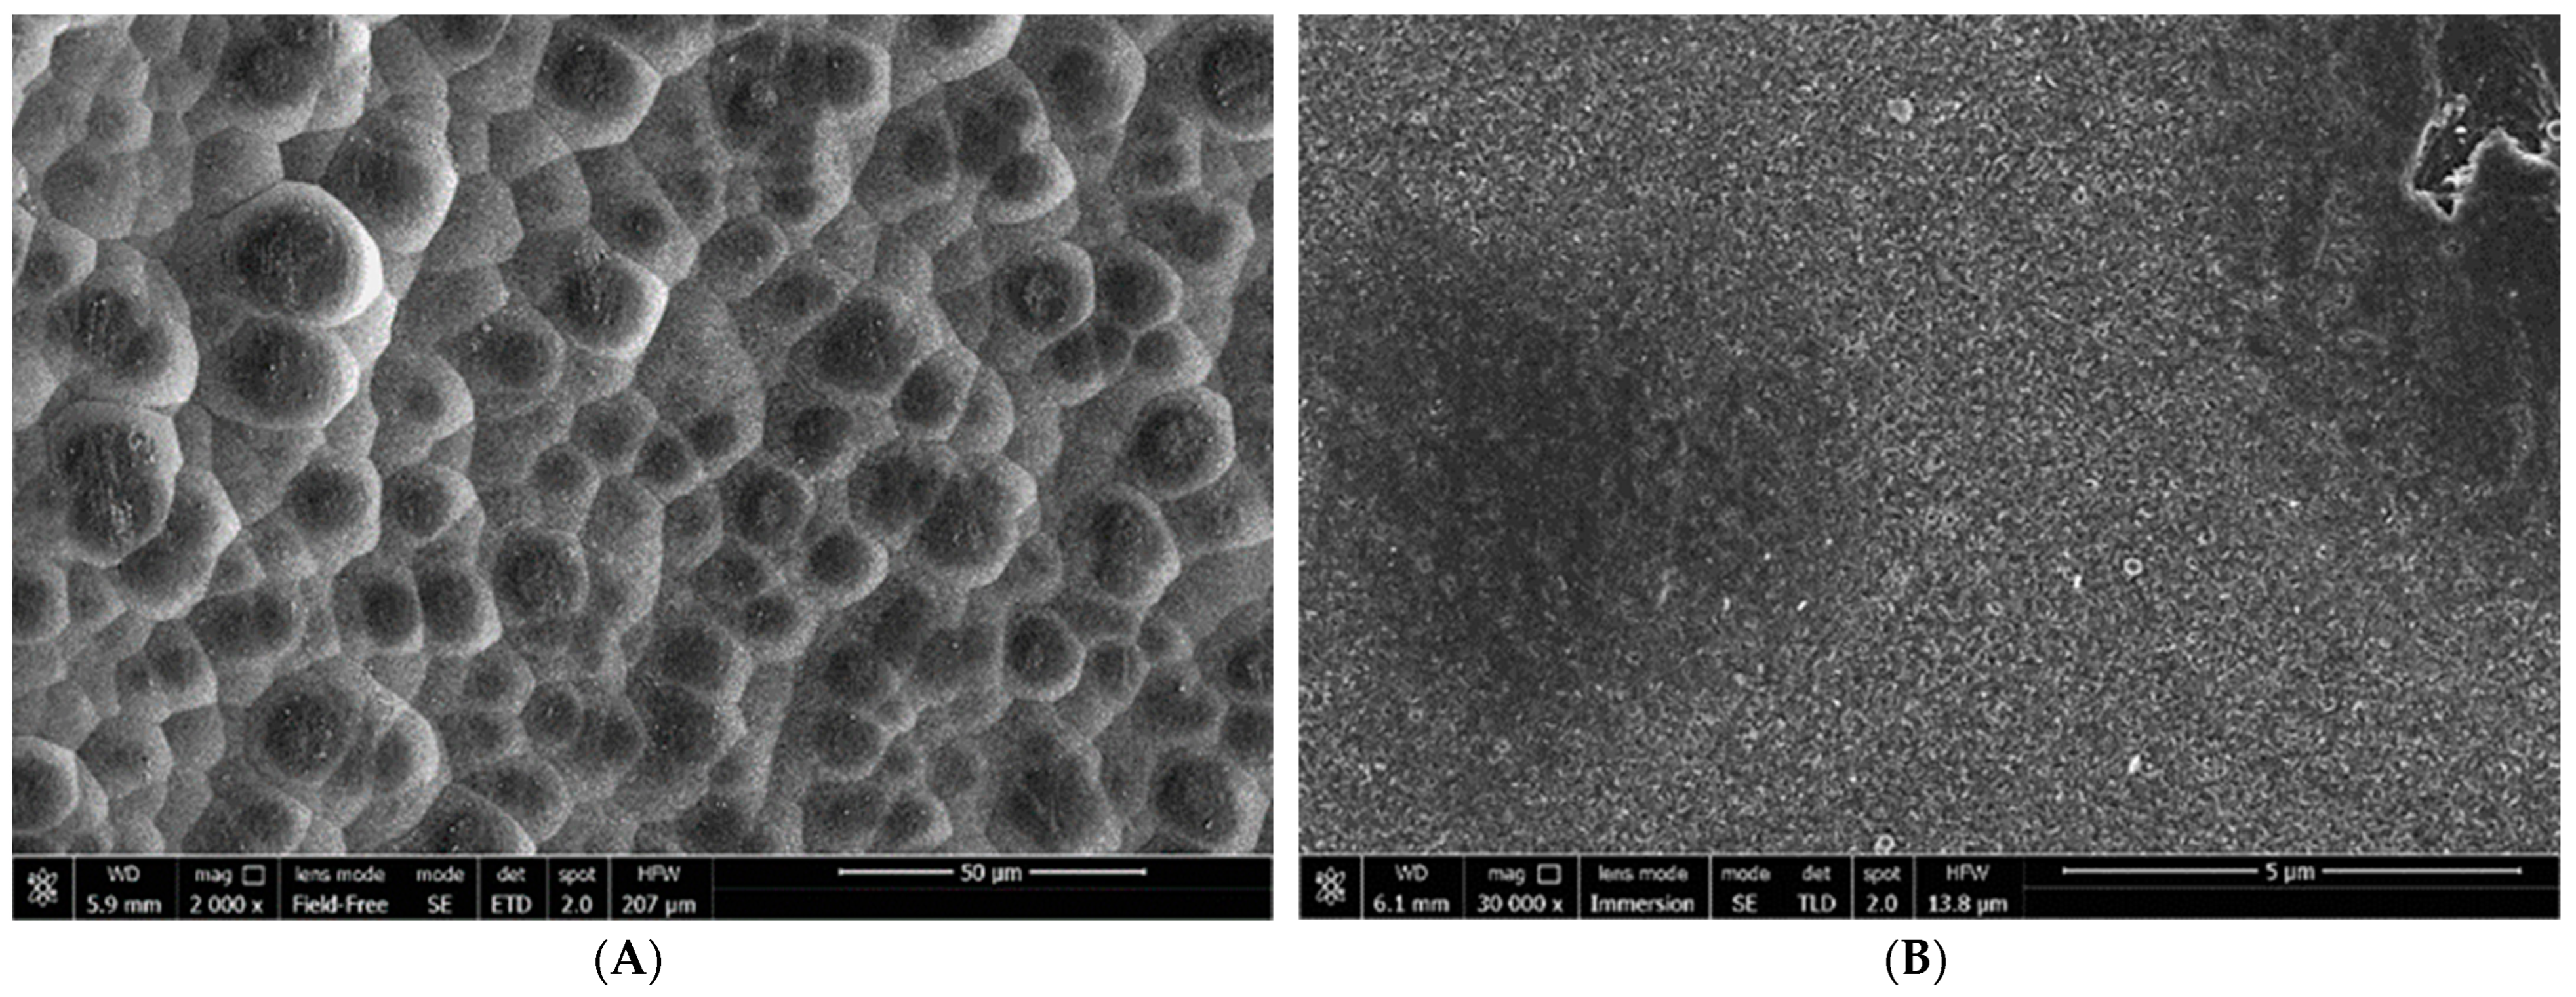
Figure 9 shows SEM images of carbon film taken from a tube after the methane pyrolysis experiment at 1400 °C and a 1 L/min methane flow rate. From Figure 9, it can be seen that the film is dense, no build-up is formed, and it is smooth and sintered. This film forms directly on the internal surface of the tube and does not exit from the tube into the filter. The carbon black obtained in the filter does not contain such structures as carbon film.
Figure 7 shows that the pores can be formed only due to gaps between soot particles, which indicates an undeveloped porous structure of the obtained samples. This observation is confirmed by the results of low-temperature nitrogen adsorption. The specific surface area of a soot sample obtained at 1000 °C, calculated according to the BET equation, was only 3.5 m2/g. The maximum specific surface area was observed for the sample obtained at 1400 °C and amounted to 8.0 m2/g.
The results of the study of particle sizes in SEM analysis are consistent with the results of the study of porous structures, since the particles obtained at 1400 °C, which are smaller in size, have a larger specific surface area than those obtained at lower temperatures.
3.4. Impurity Composition of Carbon Black
Table 3 shows the impurity composition of soot obtained in different parts of experimental plant (in reactor tube and in filter) after the pyrolysis experiment at 1200 °C and a methane flow rate of 1 L/min. Soot samples in the form of a powder, shown in Figure 8B,C, were transferred for chemical (impurity composition) analysis.
From Table 3 it is seen that the soot extracted from the tube has higher content of such elements as Mg (89 ppm), Ca (332 ppm), Al (94 ppm), Cu (2,7 ppm) as opposed to soot taken from a filter where the same elements have lower content: Mg (10 ppm), Ca (250 ppm), Al (81 ppm), Cu (0,51 ppm). This may be due to the fact that these elements are part of the tube and mix with the precipitated technical carbon during the pyrolysis process. In turn, the composition of soot sampled in the filter is dominated by such elements as Pb (9 ppm), K (14 ppm), Cr (16 ppm), Fe (63 ppm), Ni (11 ppm). For comparison, the same elements in carbon black from the tube are Pb (0.5 ppm), K (2 ppm), Cr (1.3 ppm), Fe (12 ppm), Ni (0.87 ppm). This is due to the fact that the carbon black passes through the experimental plant, including the steel pipelines, at high temperature, interacting with them before reaching the filter. The total amount of impurities in the soot from the tube was 552 ppm, and in soot from the filter, 469 ppm. This means that the purity of the produced carbon black is about 99.95%.
4. Conclusions
In this work, soot deposits formed during continuous methane pyrolysis in a corundum tube were studied.
It was shown that with an increase in the temperature of the pyrolysis process from 1000 °C to 1200 °C, the yield of hydrogen increases from 28.64% to 92.74% at a flow rate of 1 L/min and from 1.10% to 72.09% at a flow rate of 5 L/min. It was revealed that to increase the yield of hydrogen, the highest possible temperatures are required.
Experiments were carried out with an increase in temperature and methane flow rate for soot production, which showed that at a process temperature of 1400 °C, the largest amount of soot (43.9 g) is formed, and at 1000 °C, the smallest (1.28 g). In the temperature range of 1050–1100 °C, a sharp increase in the formation of soot was observed (from 2.76 to 18.77 g). It was shown that with an increase in the flow rate, the proportion of soot that remains in the tube decreases. It has been established that the linear velocity of methane affects the presence of soot inside the tube. It has also been observed that in the region of the reactor where maximum heating occurs, the accumulated soot sinters and forms dense growths. It has been established that blockages occur during the pyrolysis process, which lead to an increase in pressure in the system. It was found that these blockages were due to clogging of the pipeline (with an internal diameter of 14 mm) between the reactor (corundum tube) and the filter. The maximum observed pressure was about 100 mm Hg. When a certain pressure was reached, the blockages broke through, and the pressure returned to near atmospheric pressure. It has been revealed that the greatest number of blockages occurs in cases where the soot is still oily, but its production rate is greater than at low temperatures.
The microstructure of soot was studied. Results showed that the particles of soot obtained at 1100 °C are stickier. At 1050 °C, the particle size of soot varies from 155 to 650 nm, at 1200 °C—from 157 to 896 nm, and at 1400 °C—from 77 to 532 nm.
The specific surface and impurity compositions of the obtained carbon black were studied. The specific surface was 3.5 m2/g for the sample taken after the experiment at 1000 °C and 8.0 m2/g for the soot obtained at 1400 °C. The purity of the produced carbon black was about 99.95%.
It can be assumed that the process of pyrolysis in tubes of other materials can also occur, but the dynamics of soot deposition in these tubes may differ from what we observe in a corundum tube.
This study may be useful in selecting materials and technical solutions for a pilot methane pyrolysis plant to produce hydrogen and pure carbon black with reduced CO2 emissions.
Author Contributions
Formulation of the research problem: M.S.V., A.O.D. and M.S.G.-T. Analysis of the samples and preparation of micrographs of the samples obtained after the experiment: A.V.G. and A.O.D. Writing—the main manuscript text: M.S.G.-T. Writing—review and editing: M.S.V. and A.O.D. Funding and administration: M.S.V. All authors have read and agreed to the published version of the manuscript.
Funding
This work was supported by the Ministry of Science and Higher Education of the Russian Federation (State Assignment No. 075-01129-23-00).
Institutional Review Board Statement
Not applicable.
Informed Consent Statement
Not applicable.
Data Availability Statement
Not applicable.
Conflicts of Interest
The authors declare no conflict of interest.
References
- Dadsetan, M.; Khan, M.F.; Salakhi, M.; Bobicki, E.R.; Thomson, M.J. CO2-free hydrogen production via microwave-driven methane pyrolysis. Int. J. Hydrogen Energy 2023, 48, 14565–14576. [Google Scholar] [CrossRef]
- Lott, P.; Mokashi, M.B.; Müller, H.; Heitlinger, D.J.; Lichtenberg, S.; Shirsath, A.B.; Janzer, C.; Tischer, S.; Maier, L.; Deutschmann, O. Hydrogen Production and Carbon Capture by Gas-Phase Methane Pyrolysis: A Feasibility Study. ChemSusChem 2022, 16, e202201720. [Google Scholar] [CrossRef]
- Tatum, J.; Punia, A.; Kostiuk, L.; Secanell, M.; Olfert, J. Dataset of methane pyrolysis products in a batch reactor as a function of time at high temperatures and pressures. Data Brief. 2023, 47, 108953. [Google Scholar] [CrossRef] [PubMed]
- International Energy Agency (IEA). Global Hydrogen Review 2022; IEA: Paris, France, 2022; Available online: https://www.iea.org/reports/global-hydrogen-review-2022 (accessed on 5 May 2023).
- Li, C.; Li, M.; Zheng, Y.; Fang, B.; Lin, J.; Ni, J.; Lin, B.; Jiang, L. Revealing hydrogen migration effect on ammonia synthesis activity over ceria-supported Ru catalysts. Appl. Catal. B Environ. 2023, 320, 121982. [Google Scholar] [CrossRef]
- Meesattham, S.; Kim-Lohsoontorn, P. Low-temperature alcohol-assisted methanol synthesis from CO2 and H2: The effect of alcohol type. Int. J. Hydrogen Energy 2022, 47, 22691–22703. [Google Scholar] [CrossRef]
- Pye, S.; Welsby, D.; McDowall, W.; Reinauer, T.; Dessens, O.; Winning, M.; Calzadilla, A.; Bataille, C. Regional uptake of direct reduction iron production using hydrogen under climate policy. Energy Clim. Chang. 2022, 3, 100087. [Google Scholar] [CrossRef]
- Guan, D.; Chen, Z.; Chen, X.; Zhang, Y.; Qi, Q.; Shi, Q.; Zhao, S.; Xu, C.; Zhang, L. Molecular-level heavy petroleum hydrotreating modeling and comparison with high-resolution mass spectrometry. Fuel 2021, 297, 120792. [Google Scholar] [CrossRef]
- Sano, M.; Suzuki, M.; Homma, K.; Hayashida, K.; Tamura, T.; Matsuoka, T.; Katsumata, Y.; Onuki, S.; Sasaki, J. Promising novel therapy with hydrogen gas for emergency and critical care medicine. Acute Med. Surg. 2018, 5, 113–118. [Google Scholar] [CrossRef]
- Wang, W.-H.; Liu, X.; Bao, M. Chapter 14—Hydrogenation of fats and oils using supercritical carbon dioxide. In Green Sustainable Process for Chemical and Environmental Engineering and Science; Inamuddin, A.M., Asiri, A., Suvardhan, K., Eds.; Elsevier: Amsterdam, The Netherlands, 2020; pp. 347–356. [Google Scholar]
- Wulf, C.; Zapp, P. Analyzing the future potential of defossilizing industrial specialty glass production with hydrogen by LCA. Procedia CIRP 2022, 105, 666–671. [Google Scholar] [CrossRef]
- Autrey, T.; Chen, P. Hydrogen energy carriers. J. Energy Chem. 2023, 77, 119–121. [Google Scholar] [CrossRef]
- Sánchez-Bastardo, N.; Schlögl, R.; Ruland, H. Methane Pyrolysis for Zero-Emission Hydrogen Production: A Potential Bridge Technology from Fossil Fuels to a Renewable and Sustainable Hydrogen Economy. Ind. Eng. Chem. Res. 2021, 60, 11855–11881. [Google Scholar] [CrossRef]
- Mordor Intelligence. Carbon Black Market Size & Share Analysis—Growth Trends & Forecasts (2023–2028); Mordor Intelligence: Hyderabad, India, 2023; Available online: https://www.mordorintelligence.com/industry-reports/carbon-black-market (accessed on 5 May 2023).
- Mathew, M.; Dominic, C.M.; Neenu, K.V.; Begum, P.S.; Dileep, P.; Kumar, T.A.; Sabu, A.A.; Nagane, D.; Parameswaranpillai, J.; Badawi, M. Carbon black and chitin nanofibers for green tyres: Preparation and property evaluation. Carbohydr. Polym. 2023, 310, 120700. [Google Scholar] [CrossRef] [PubMed]
- Liu, Y.; Zhai, Z.; Tang, H. Experimental investigations on thermo-stamping of carbon fiber reinforced polyamide 6 hat-shaped components with self-resistance electrical heating: Influence on microscopic and macroscopic properties from temperature related processing parameters. J. Manuf. Process. 2023, 85, 1133–1143. [Google Scholar] [CrossRef]
- Al-Lami, A.; Hilmer, P.; Sinapius, M. Eco-efficiency assessment of manufacturing carbon fiber reinforced polymers (CFRP) in aerospace industry. Aerosp. Sci. Technol. 2018, 79, 669–678. [Google Scholar] [CrossRef]
- Kareiva, A.; Beganskiene, A.; Senvaitiene, J.; Ramanaviciene, A.; Vaitkus, R.; Barkauskas, J.; Ramanavicius, A. Evaluation of carbon-based nanostructures suitable for the development of black pigments and glazes. Colloids Surf. A Physicochem. Eng. Asp. 2019, 580, 123718. [Google Scholar] [CrossRef]
- Gusev, A.L.; Jabbarov, T.G.; Mamedov, S.G.; Malikov, R.; Hajibalaev, N.M.; Abdullaeva, S.D.; Abbasov, N.M. Production of hydrogen and carbon in the petrochemical industry by cracking of hydrocarbons in the process of heat utilization in steel production. Int. J. Hydrogen Energy 2023, 48, 14954–14963. [Google Scholar] [CrossRef]
- Fincke, J.R.; Anderson, R.P.; Hyde, T.A.; Detering, B.A. Plasma Pyrolysis of Methane to Hydrogen and Carbon Black. Ind. Eng. Chem. Res. 2002, 41, 1425–1435. [Google Scholar] [CrossRef]
- Sigaeva, S.; Temerev, V.; Borisov, V.; Tsyrulnikov, P. Pyrolysis of Methane on a Fechral Resistive Catalyst under Addition of Hydrogen or Oxygen into Reaction Mixture. Kataliz V Promyshlennosti 2015, 15, 6–9. [Google Scholar]
- Sigaeva, S.; Temerev, V.; Kuznetsova, N.; Tsyrulnikov, P. Pyrolysis of Methane over Resistible Supported Catalysts MeOx/Carborundum, where MeOx are MgO, CaO, MgO/Al2O3, MgO/ZrO2, CaO/Al2O3, CaO/ZrO2. Kataliz V Promyshlennosti 2017, 17, 178–183. [Google Scholar] [CrossRef]
- Vlaskin, M.S.; Grigorenko, A.V.; Gromov, A.A.; Kumar, V.; Dudoladov, A.O.; Slavkina, O.V.; Darishchev, V.I. Methane pyrolysis on sponge iron powder for sustainable hydrogen production. Results Eng. 2022, 15, 100598. [Google Scholar] [CrossRef]
- Parfenov, V.; Nikitchenko, N.; Pimenov, A.; Kuz’min, A.; Kulikova, M.; Chupichev, O.; Maksimov, A.L. Methane Pyrolysis for Hydrogen Production: Specific Features of Using Molten Metals. Russ. J. Appl. Chem. 2020, 93, 625–632. [Google Scholar] [CrossRef]
- Catalan, L.J.J.; Rezaei, E. Modelling the hydrodynamics and kinetics of methane decomposition in catalytic liquid metal bubble reactors for hydrogen production. Int. J. Hydrogen Energy 2022, 47, 7547–7568. [Google Scholar] [CrossRef]
- Hu, X.; Hu, Y.; Xu, Q.; Wang, X.; Li, G.; Cheng, H.; Zou, X.; Lu, X. Molten salt-promoted Ni–Fe/Al2O3 catalyst for methane decomposition. Int. J. Hydrogen Energy 2020, 45, 4244–4253. [Google Scholar] [CrossRef]
- Abbas, H.F.; Ashik, U.P.M.; Mohammed, S.A.; Daud, W.M.A.W. Impact of reactor materials on methane decomposition for hydrogen production. Chem. Eng. Res. Des. 2021, 174, 127–136. [Google Scholar] [CrossRef]
- Younessi-Sinaki, M.; Matida, E.; Hamdullahpur, F. Kinetic model of homogeneous thermal decomposition of methane and ethane. Int. J. Hydrogen Energy 2009, 34, 3710–3716. [Google Scholar] [CrossRef]
Figure 1.
(A) Scheme of the experimental plant for methane pyrolysis in corundum tube: 1—tank with nitrogen, 2—tank with methane, 3—reducers, 4—rotameters, 5—flanges, 6—oven, 7—corundum tube, 8—control unit, 9—filter, 10—needle valves, 11—water trap (bubbler), 12—manometer. (B) Scheme of the experimental filter for soot separation: 1—lid, 2—plastic bottle with holes, 3—bag, 4—inlet tubes, 5—bucket.
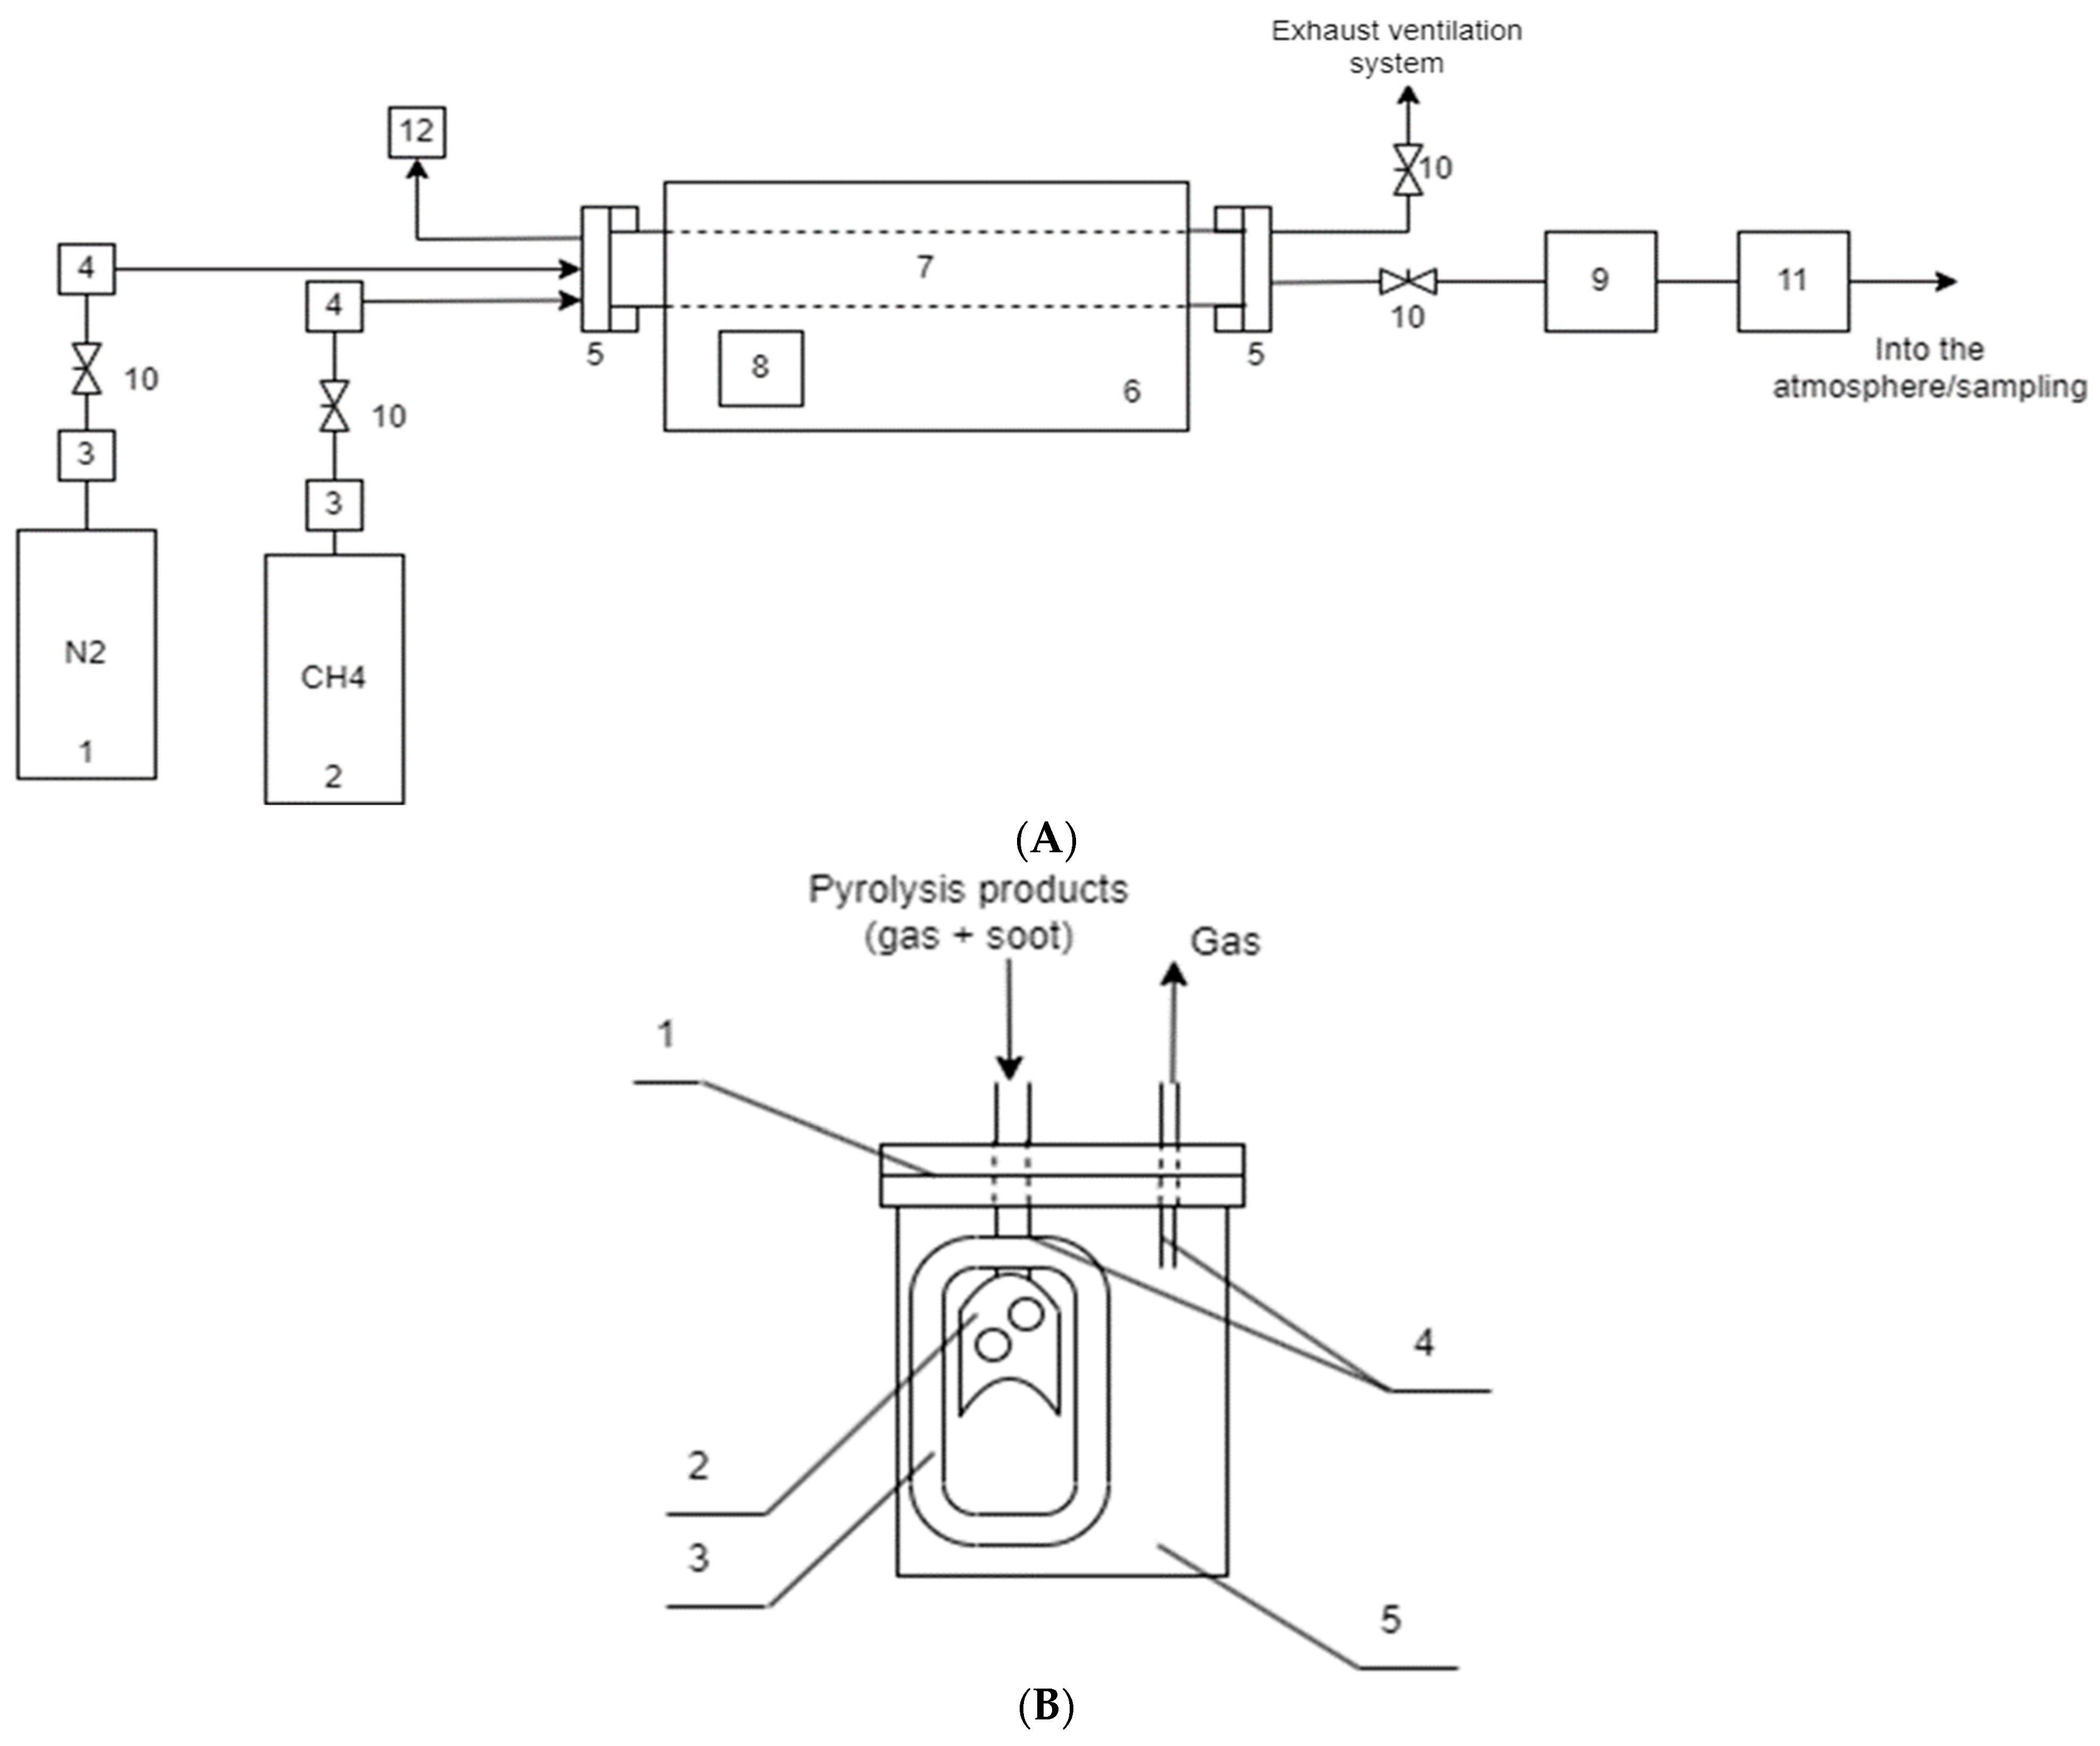
Figure 2.
Mass of soot produced in different parts of experimental plant during methane pyrolysis depending on process temperature with a methane flow rate of 1 L/min.
Figure 2.
Mass of soot produced in different parts of experimental plant during methane pyrolysis depending on process temperature with a methane flow rate of 1 L/min.
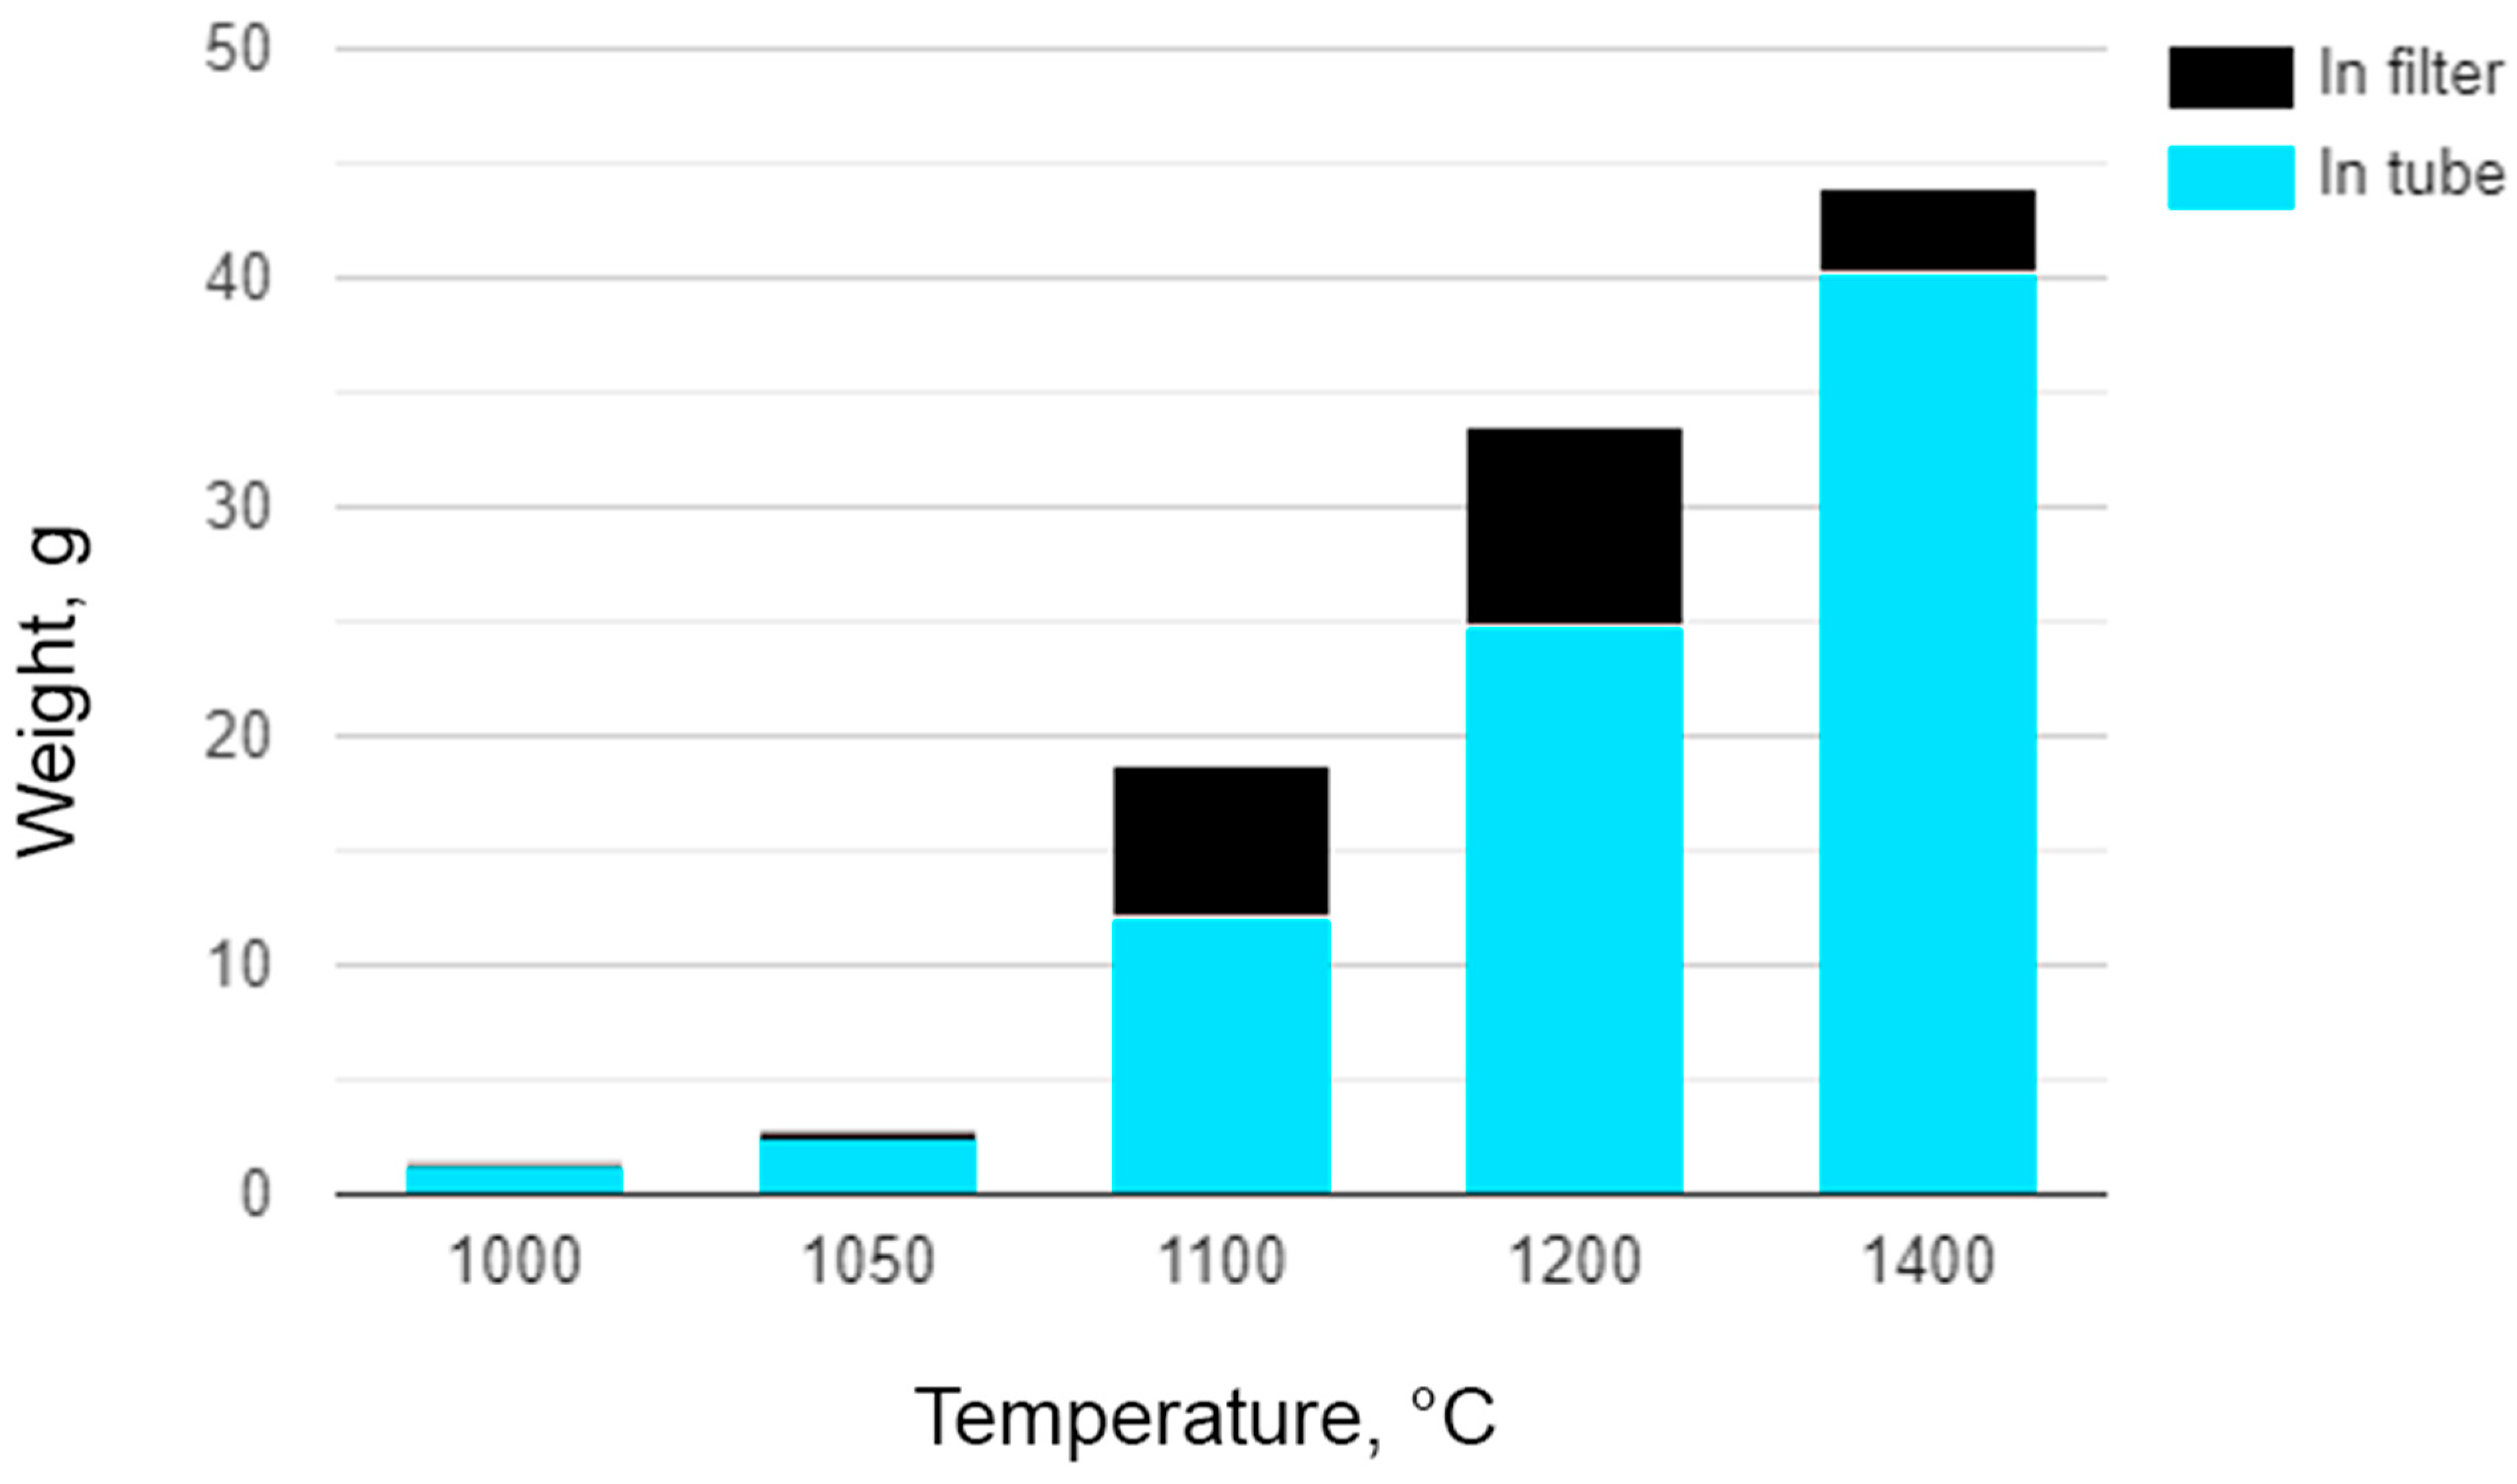
Figure 3.
Soot deposits in the tube after the experiment at 1200 °C and a methane flow rate of 1 L/min.
Figure 3.
Soot deposits in the tube after the experiment at 1200 °C and a methane flow rate of 1 L/min.

Figure 4.
Dense carbon build-up after the experiment at 1400 °C and a methane flow rate of 1 L/min.
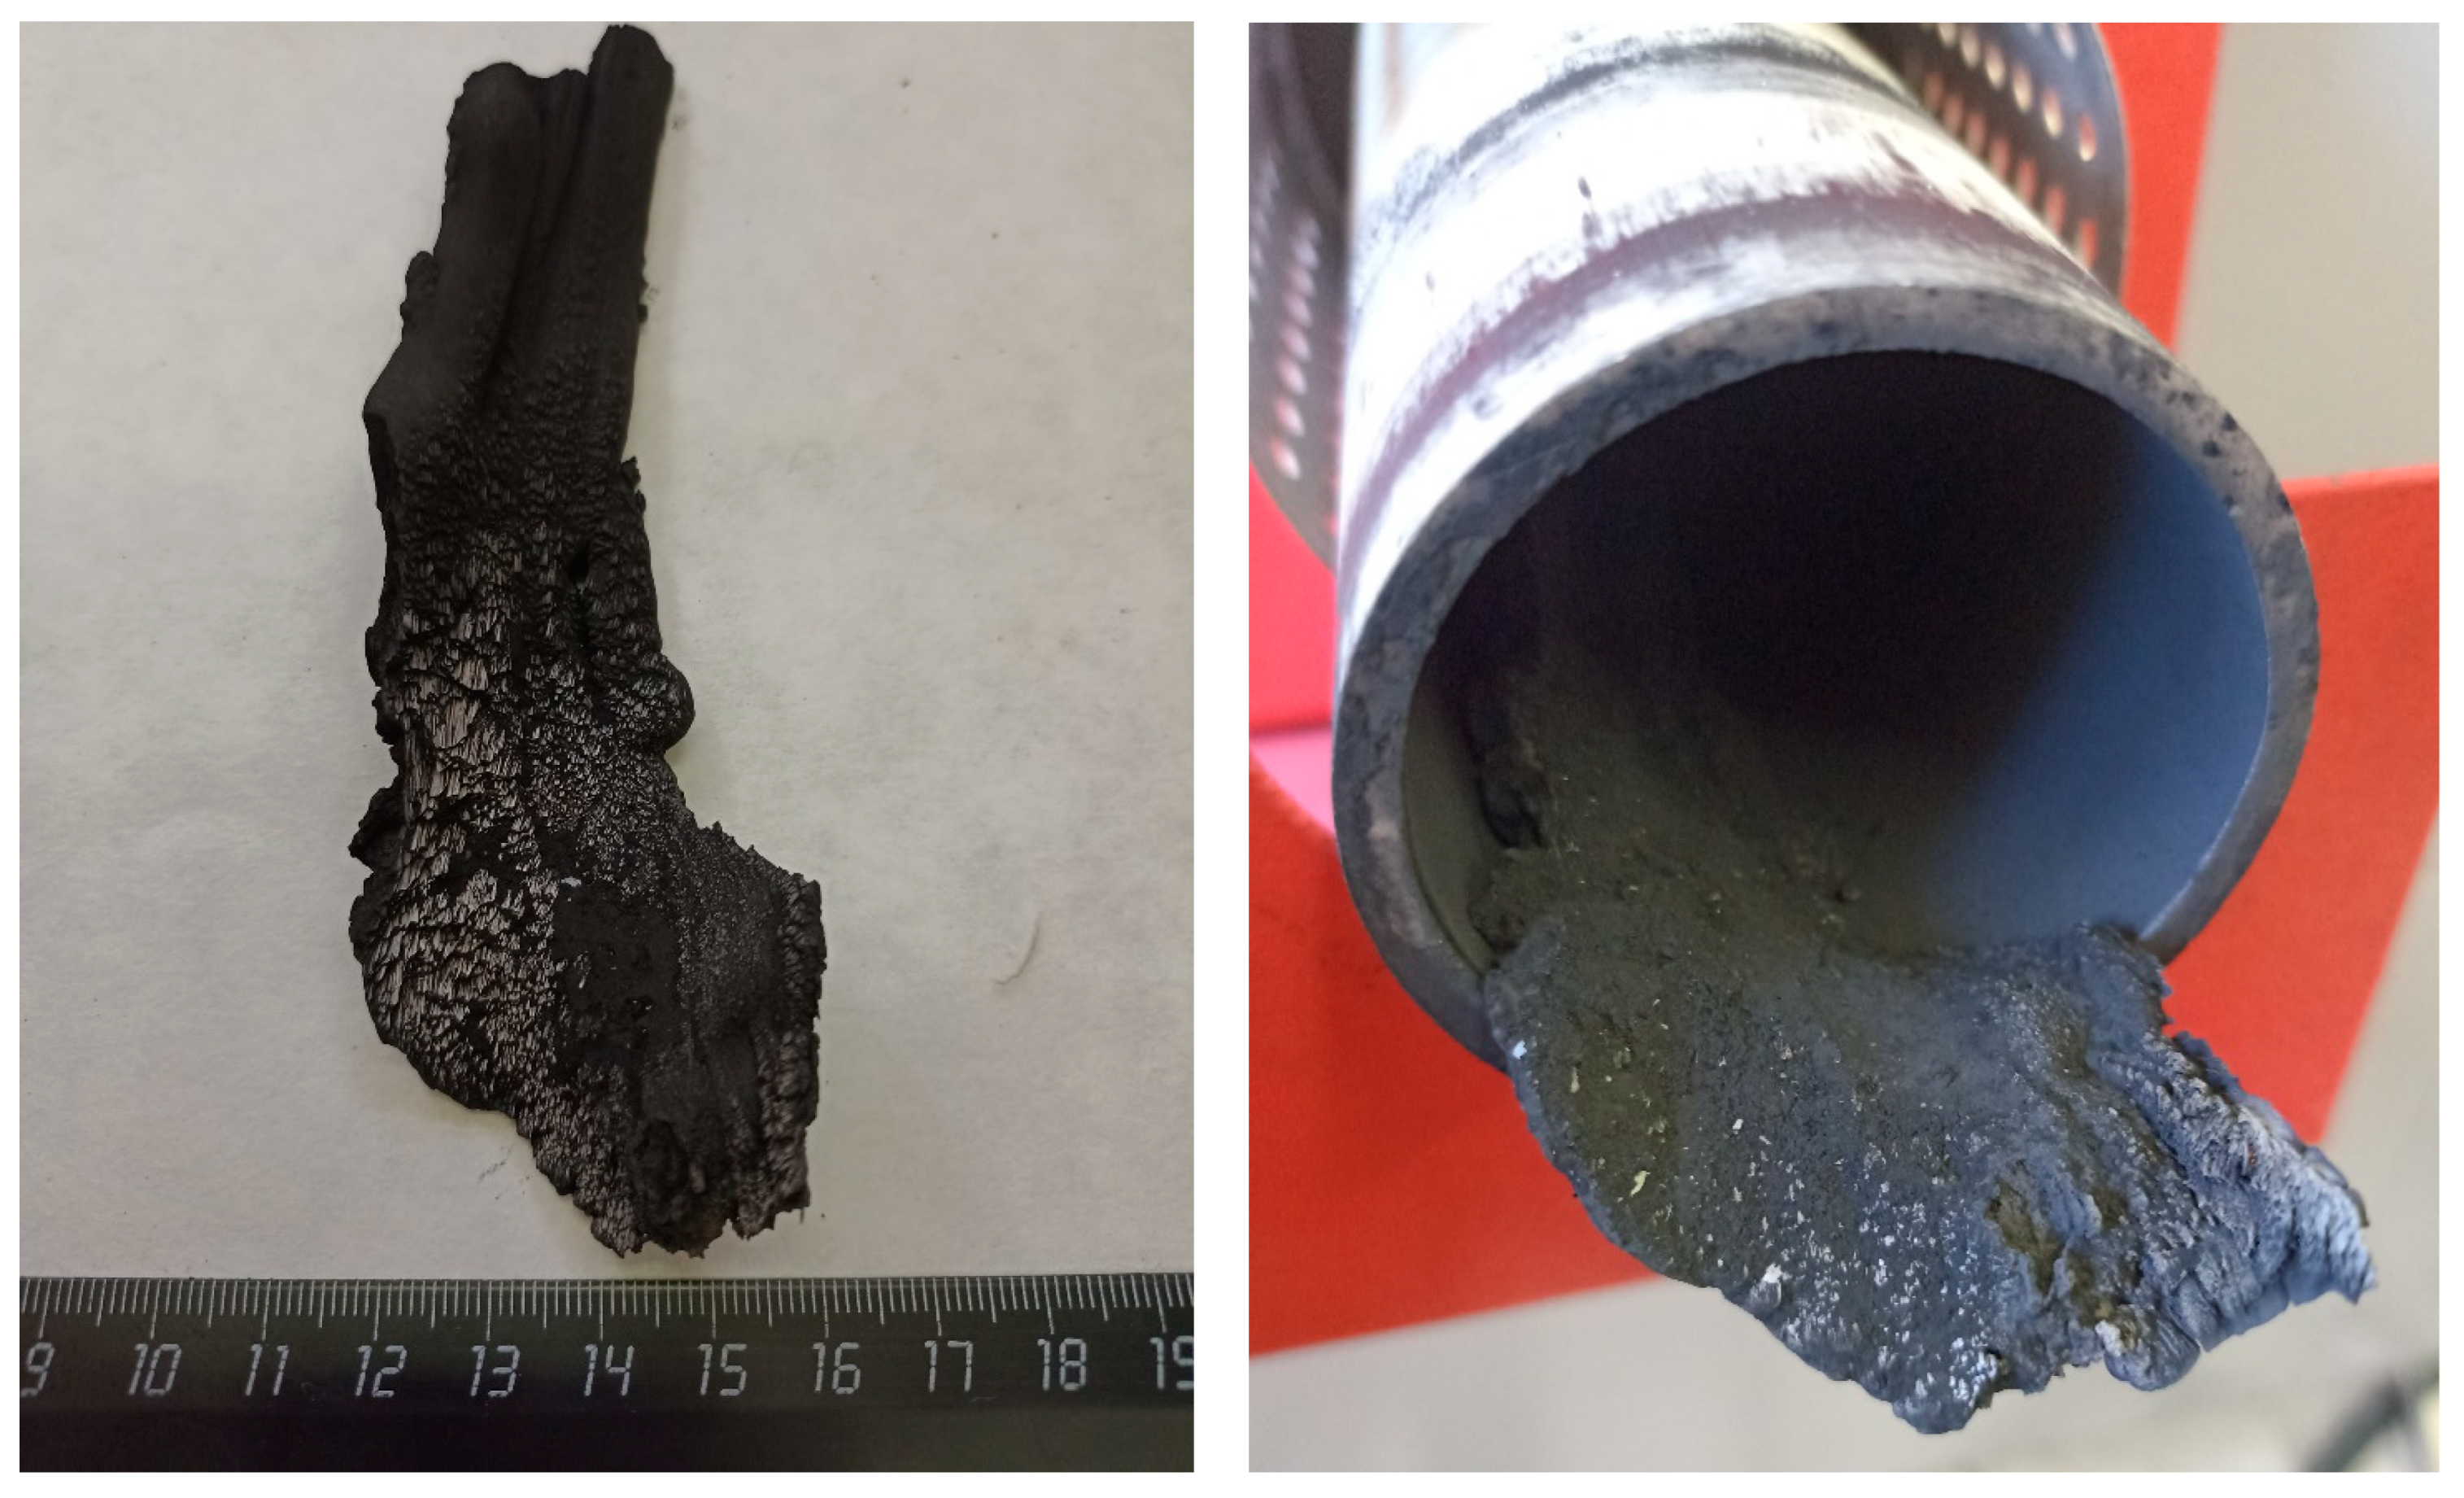
Figure 5.
Mass of soot produced in different parts of experimental plant during methane pyrolysis depending on flow rate. A—experiment at 1200 °C and 1 L/min, B, C—experiments at 1200 °C and 5 L/min.
Figure 5.
Mass of soot produced in different parts of experimental plant during methane pyrolysis depending on flow rate. A—experiment at 1200 °C and 1 L/min, B, C—experiments at 1200 °C and 5 L/min.
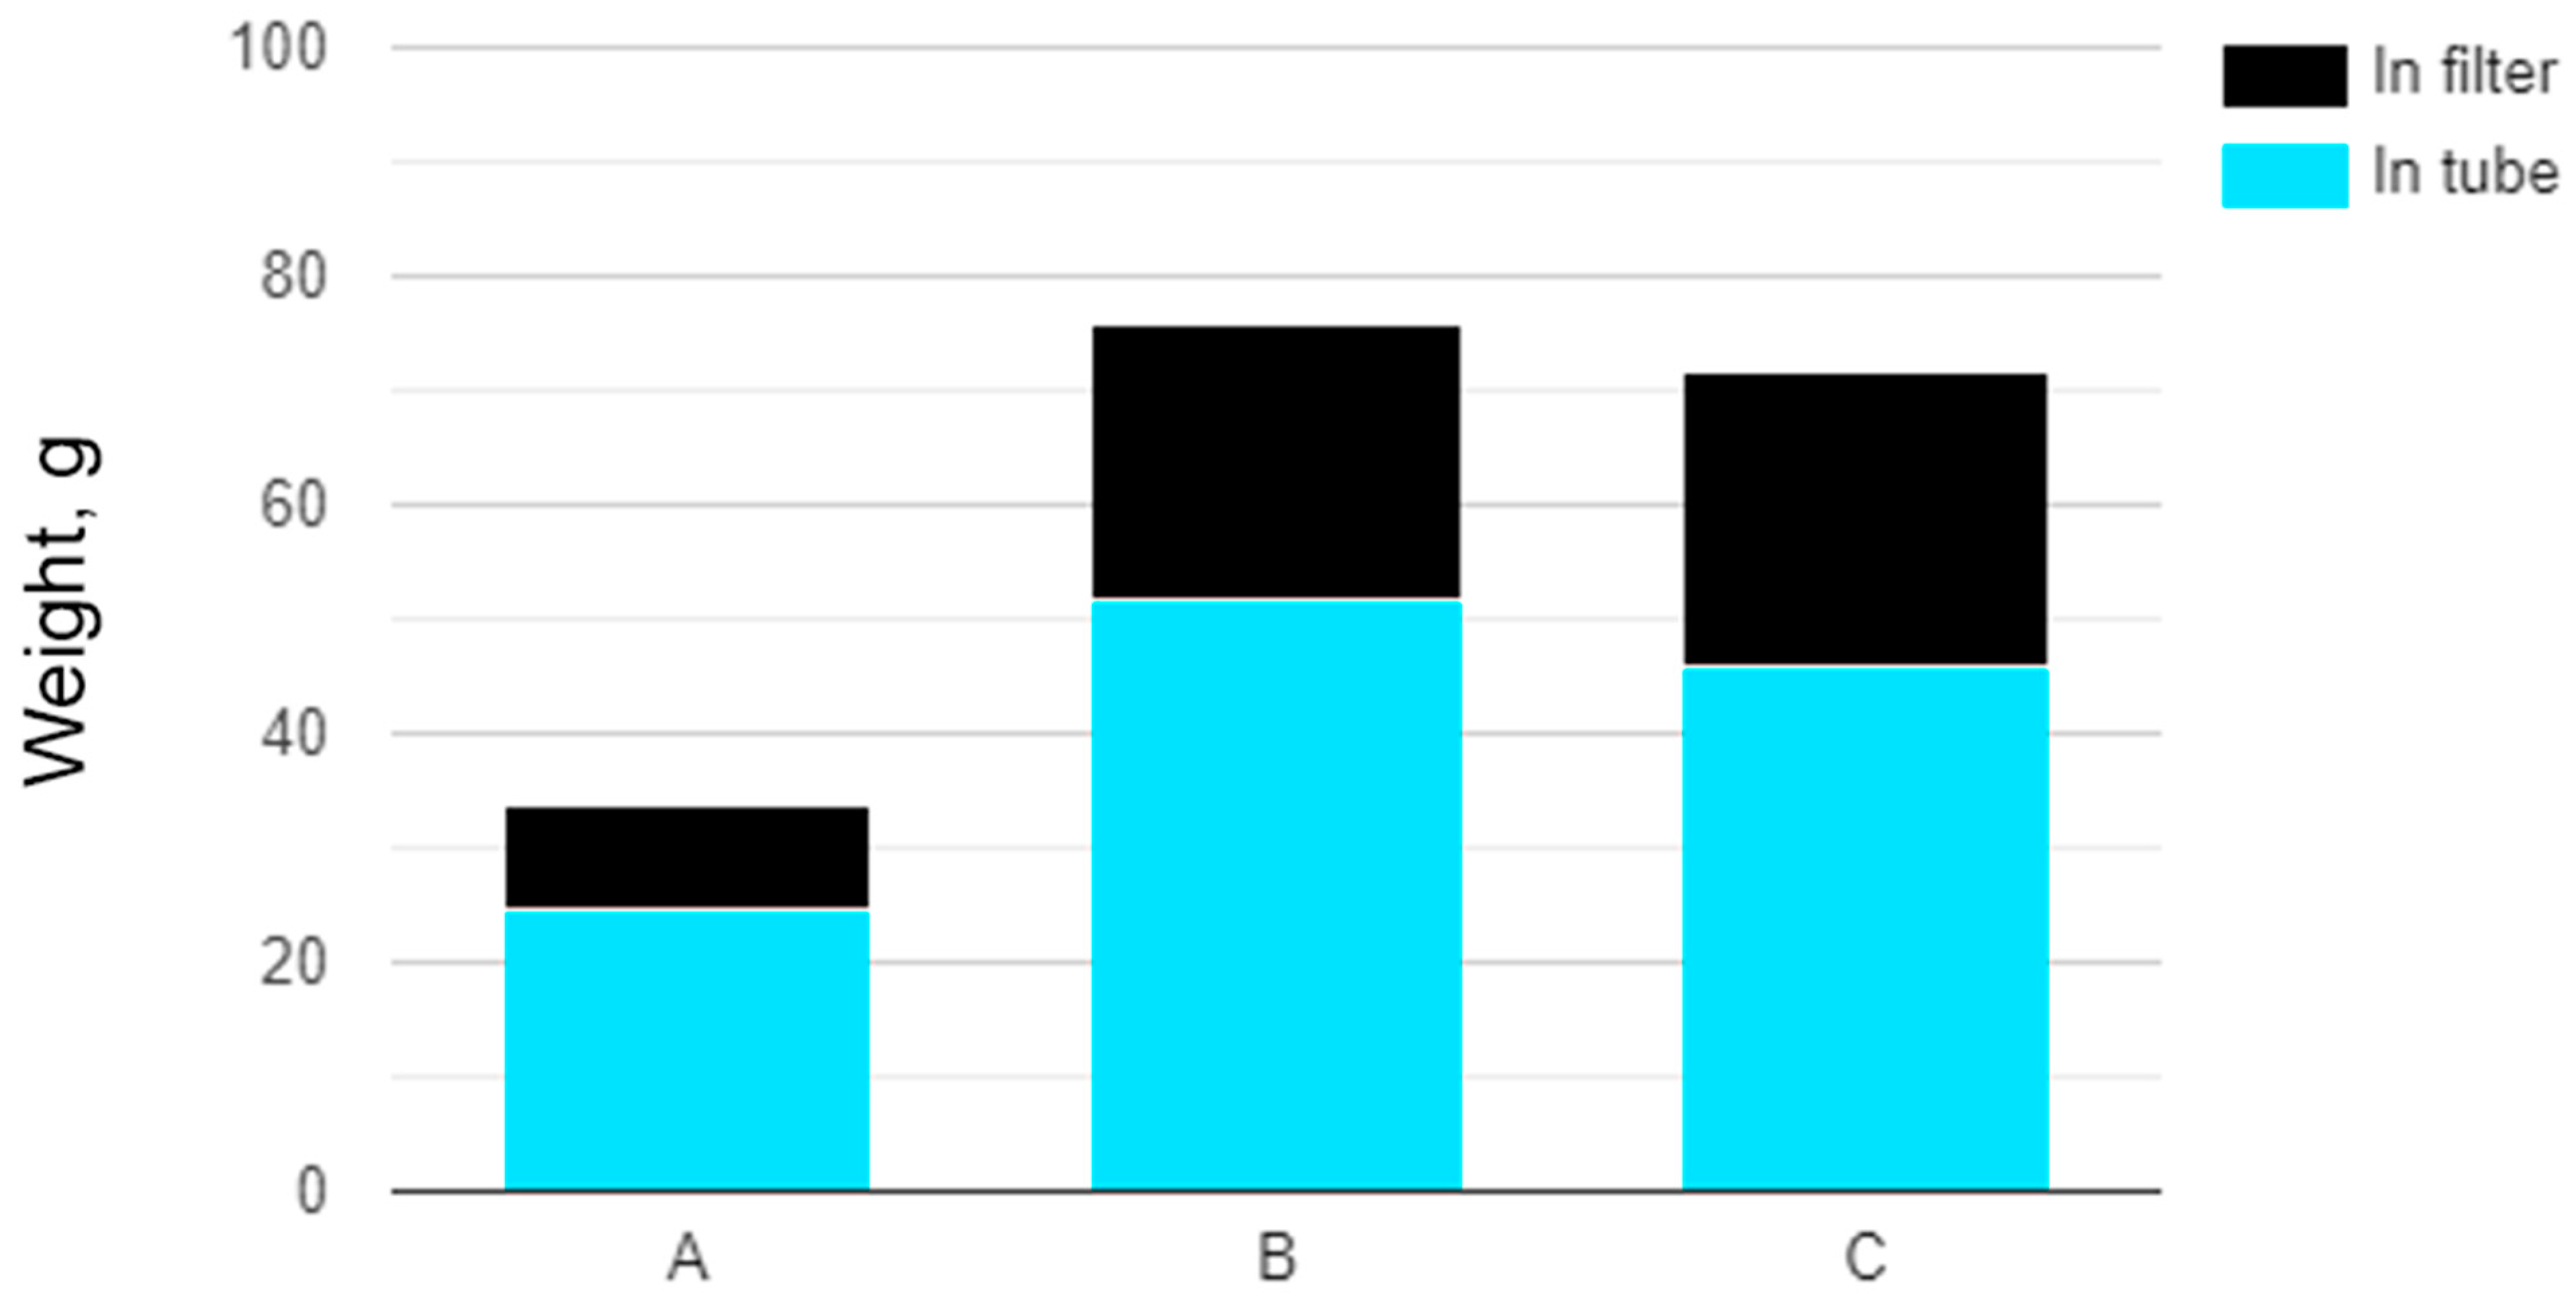
Figure 6.
Pressure inside the pyrolysis reactor (corundum tube) during the experiments at different temperatures. The methane flow rate is 1 L/min.
Figure 6.
Pressure inside the pyrolysis reactor (corundum tube) during the experiments at different temperatures. The methane flow rate is 1 L/min.

Figure 7.
SEM images of soot sampled in the filter obtained by methane pyrolysis at (A) 1050 °C and (B) 1400 °C and methane flow of 1 L/min with resolution 5 μm (enlargement ×30,000).
Figure 7.
SEM images of soot sampled in the filter obtained by methane pyrolysis at (A) 1050 °C and (B) 1400 °C and methane flow of 1 L/min with resolution 5 μm (enlargement ×30,000).
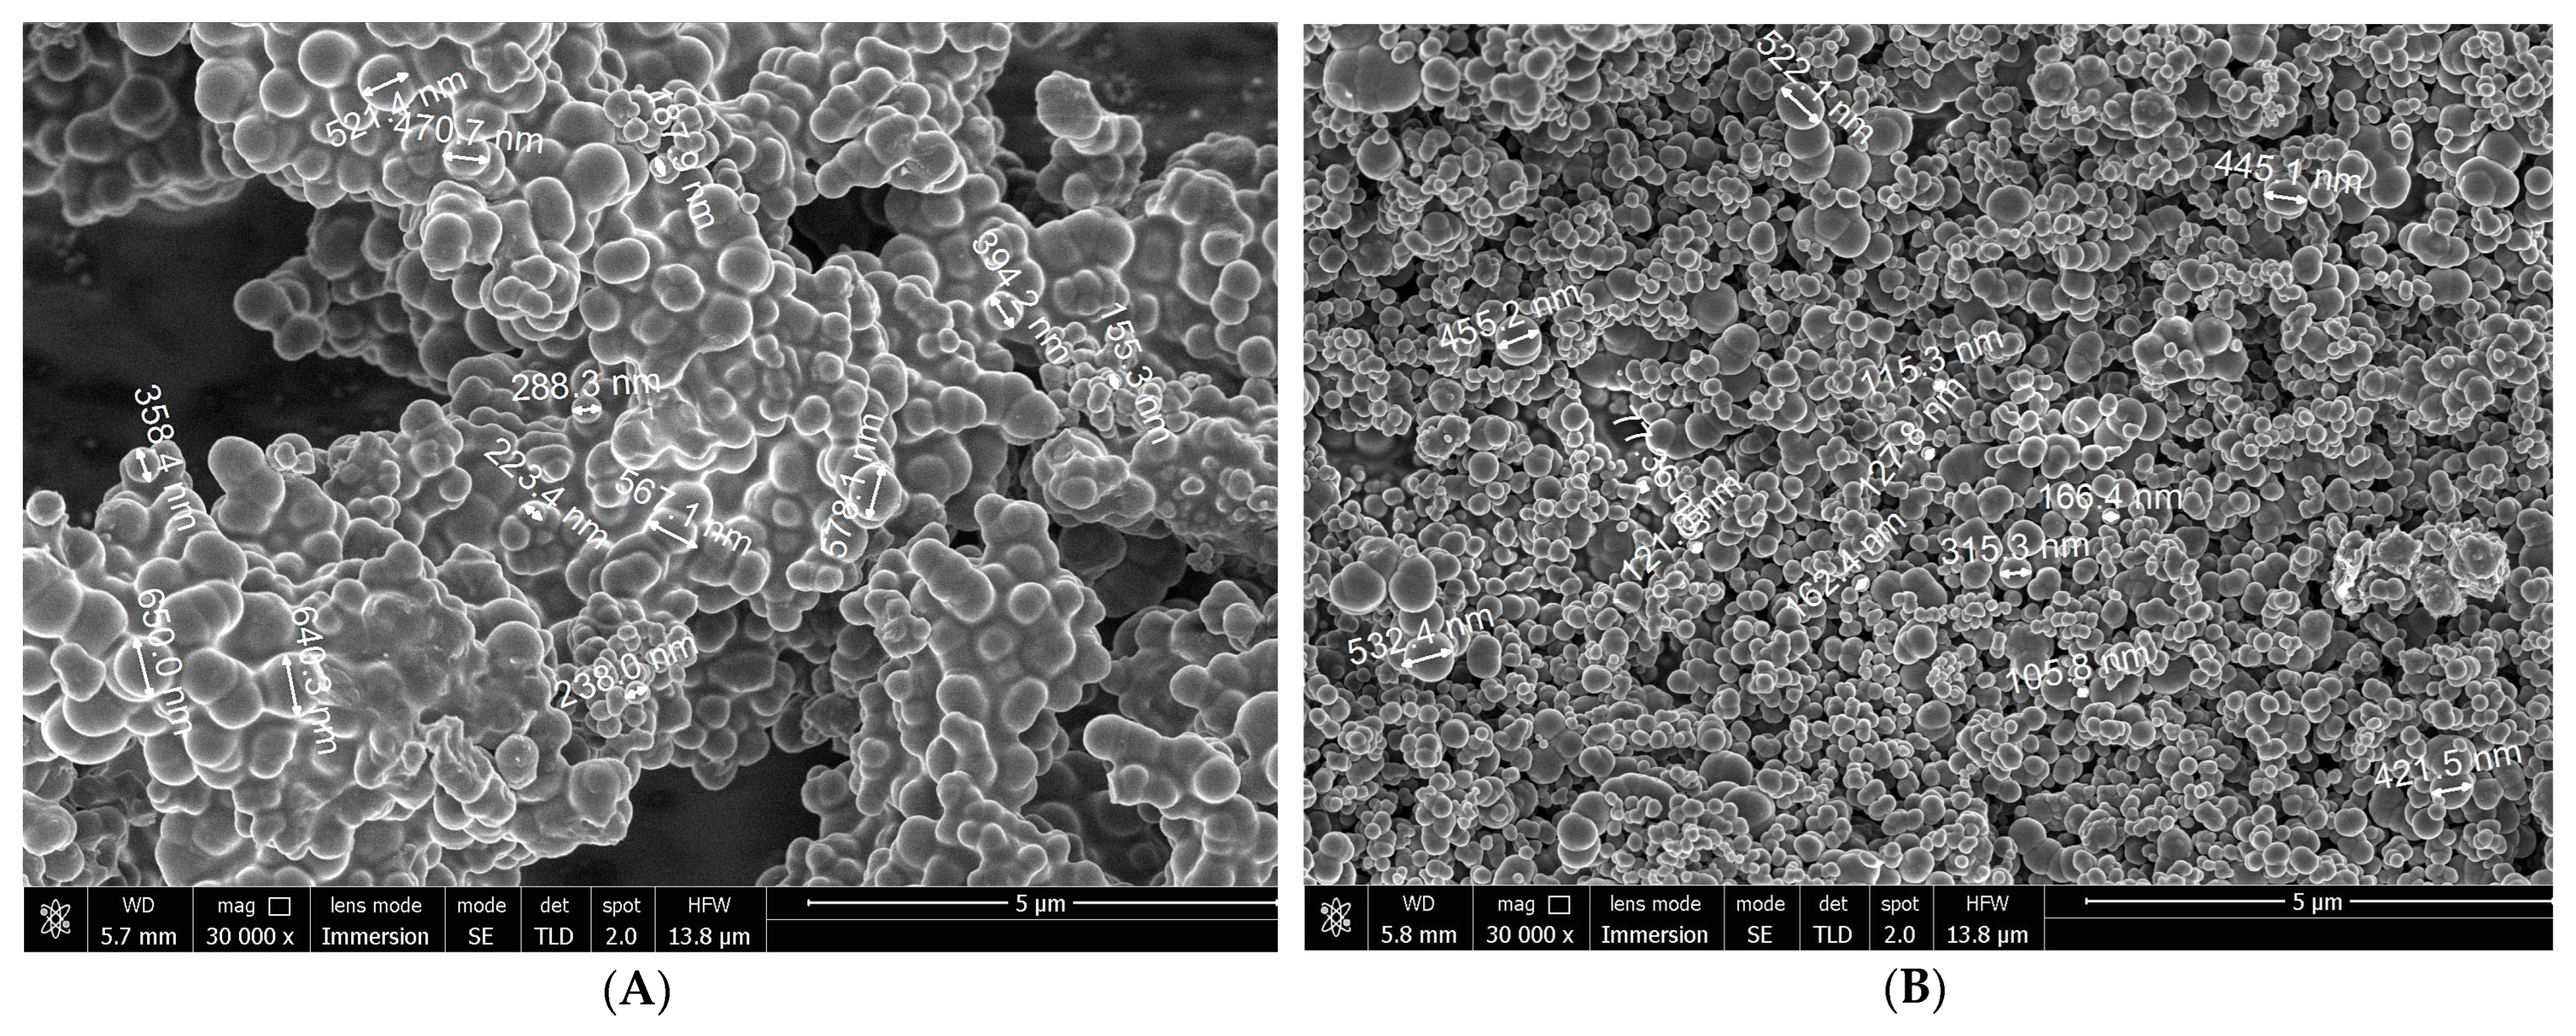
Figure 8.
Soot obtained in the reactor tube (A,B) and in the filter (C) after experiment at 1200 °C with flow rate 1 L/min.
Figure 8.
Soot obtained in the reactor tube (A,B) and in the filter (C) after experiment at 1200 °C with flow rate 1 L/min.
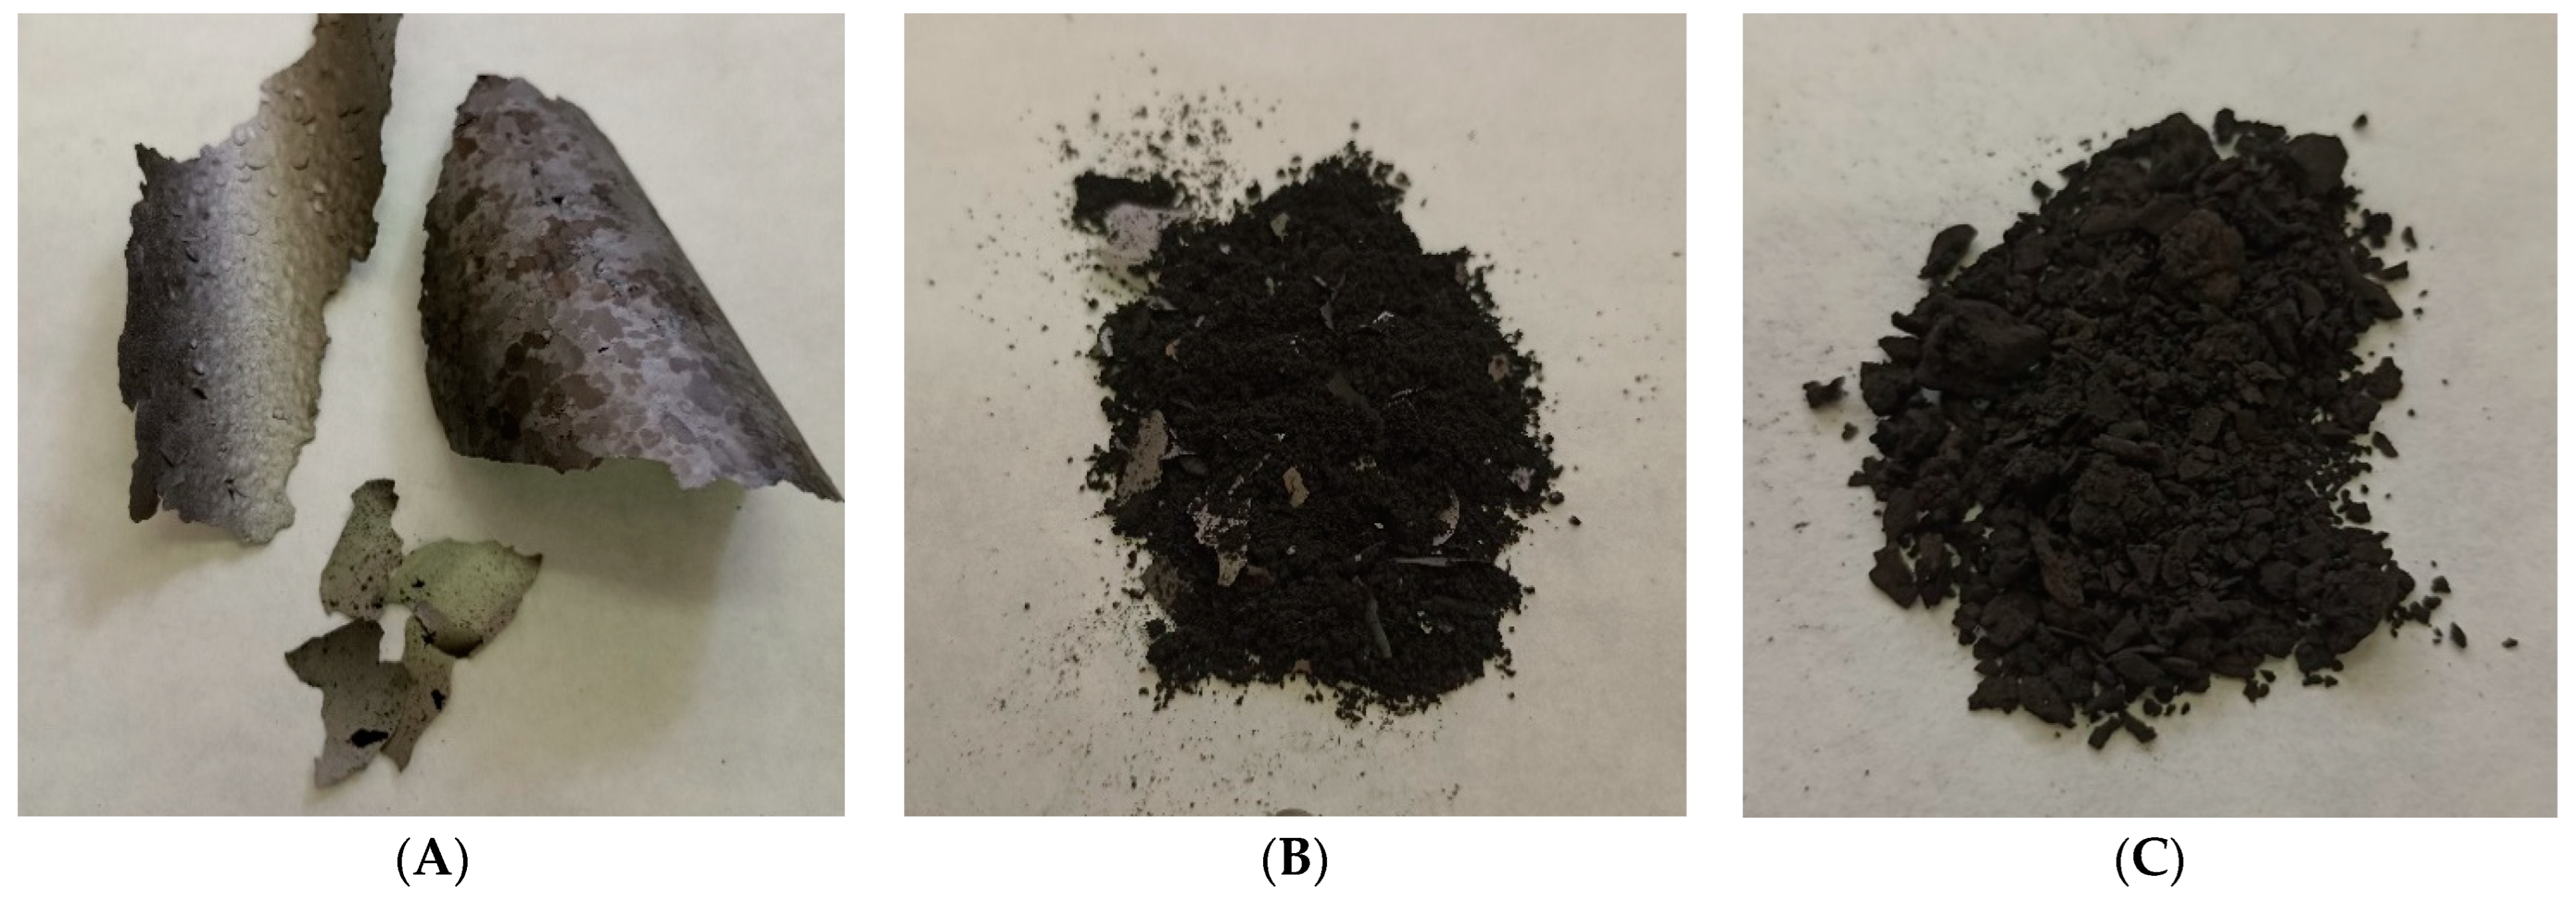
Figure 9.
SEM images of soot sampled from a tube obtained by methane pyrolysis at 1400 °C and a methane flow rate of 1 L/min at (A) 50 µm (enlargement ×2000) and (B) 5 µm (enlargement ×30,000) resolution.
Figure 9.
SEM images of soot sampled from a tube obtained by methane pyrolysis at 1400 °C and a methane flow rate of 1 L/min at (A) 50 µm (enlargement ×2000) and (B) 5 µm (enlargement ×30,000) resolution.

Table 1.
Volumetric content of the component in the gas sample of gaseous product of methane pyrolysis depending on methane flow rate (1 and 5 L/min) and process temperature (1000, 1100 and 1200 °C).
Table 1.
Volumetric content of the component in the gas sample of gaseous product of methane pyrolysis depending on methane flow rate (1 and 5 L/min) and process temperature (1000, 1100 and 1200 °C).
| Component | Volumetric Content of the Component in the Gas Sample Depending on Methane Flow Rate and Process Temperature, vol.% | |||||
|---|---|---|---|---|---|---|
| 1000 °C | 1100 °C | 1200 °C | ||||
| 1 L/min | 5 L/min | 1 L/min | 5 L/min | 1 L/min | 5 L/min | |
| H2 | 28.64 | 1.10 | 81.41 | 52.06 | 92.74 | 72.09 |
| CH4 | 68.25 | 98.63 | 16.59 | 44.82 | 6.00 | 23.86 |
| O2 | 0.05 | 0.03 | 0.3 | 0.001 | 0.03 | 0.46 |
| N2 | 0.10 | 0.05 | 0.17 | 0.02 | 0.15 | 1.40 |
| C2H6 | 0.15 | 0.04 | 0.12 | 0.13 | 0.09 | 0.09 |
| C2H4 | 0.45 | 0.14 | 1.15 | 1.97 | 0.66 | 1.17 |
| C2H2 | 0.02 | 0.01 | 0 | 0.01 | 0 | <10−4 |
| C3H8 | 0.53 | 0.01 | 0.08 | 0.001 | <10−4 | <10−4 |
| C3H6 | 0.56 | <10−4 | 0.44 | 1.06 | 0.33 | 0.93 |
Table 2.
Mass of soot produced during the methane pyrolysis experiment in different parts of experimental plant (in reactor tube and in filter).
Table 2.
Mass of soot produced during the methane pyrolysis experiment in different parts of experimental plant (in reactor tube and in filter).
| T, °C | Methane Flow Rate, L/min | Operation Time, min | Mass of Soot, g | Soot Generation Rate, g/min | |||||
|---|---|---|---|---|---|---|---|---|---|
| Through Tube | Through Filter | In the Tube | In the Filter | Total | In the Tube | In the Filter | Total | ||
| 1000 | 1 | 74 | 60 | 1.28 | 0 | 1.28 | 0.017 | 0 | 0.017 |
| 1050 | 1 | 69 | 60 | 2.4 | 0.36 | 2.76 | 0.035 | 0.006 | 0.041 |
| 1100 | 1 | 90 | 78 | 12.12 | 6.65 | 18.77 | 0.135 | 0.085 | 0.22 |
| 1200 | 1 | 69 | 60 | 24.7 | 8.9 | 33.6 | 0.358 | 0.148 | 0.506 |
| 1400 | 1 | 69 | 60 | 40.3 | 3.6 | 43.9 | 0.584 | 0.06 | 0.644 |
| 1200 | 5 | 63 | 60 | 51.8 | 23.85 | 75.65 | 0.822 | 0.398 | 1.22 |
| 1200 | 5 | 63 | 60 | 45.91 | 25.86 | 71.77 | 0.729 | 0.431 | 1.16 |
Table 3.
The impurity composition of soot obtained in different parts of experimental plant (in reactor tube and in filter) after the pyrolysis experiment at 1200 °C and a methane flow rate of 1 L/min. Soot samples in the form of a powder, shown in Figure 8B (soot from the reactor tube) and Figure 8C (soot from the filter), were transferred for chemical analysis.
| № n/a | The Element | Element Content in a Soot Sample, ppm | № n/a | The Element | Element Content in a Soot Sample, ppm | ||
|---|---|---|---|---|---|---|---|
| From the Tube | From the Filter | From the Tube | From the Filter | ||||
| 1 | Na | 5.0 ± 0.2 | 6.7 ± 0.5 | 27 | Tl | <0.002 | <0.04 |
| 2 | Mg | 89 ± 2 | 10 ± 4 | 28 | Bi | <0.07 | 0.0088 ± 0.0002 |
| 3 | Al | 94 ± 4 | 81 ± 6 | 29 | Th | 0.043 ± 0.006 | <0.002 |
| 4 | K | <2 | <14 | 30 | U | 0.063 ± 0.004 | <0.0003 |
| 5 | Ca | 332 ± 16 | 250 ± 30 | 31 | Ru | <0.00004 | <0.0007 |
| 6 | Cr | 1.3 ± 0.4 | 16 ± 3 | 32 | Rh | <0.00004 | <0.0003 |
| 7 | Mn | 6.1 ± 0.5 | 1.3 ± 0.2 | 33 | Pd | 0.0008 ± 0.0002 | <0.004 |
| 8 | Fe | 12 ± 4 | 63 ± 9 | 34 | Ir | <0.0001 | <0.005 |
| 9 | Ni | 0.87 ± 0.01 | 11 ± 1 | 35 | Pt | 0.0065 ± 0.0005 | <0.001 |
| 10 | Zn | 2.1 ± 0.4 | 4.3 ± 0.3 | 36 | Sc | 0.21 ± 0.02 | <0.002 |
| 11 | Ba | 1.8 ± 0.1 | 1.1 ± 0.3 | 37 | Y | 0.63 ± 0.04 | 0.0034 ± 0.0009 |
| 12 | Pb | <0.5 | 9 ± 1 | 38 | In | 0.0004 ± 0.0001 | <0.0003 |
| 13 | Li | 0.04 ± 0.01 | 0.18 ± 0.03 | 39 | La | 0.07 ± 0.01 | 0.0020 ± 0.0002 |
| 14 | Be | 0.0052 ± 0.0004 | <0.007 | 40 | Ce | 0.13 ± 0.01 | 0.0020 ± 0.0007 |
| 15 | V | 0.15 ± 0.03 | 0.06 ± 0.02 | 41 | Pr | 0.015 ± 0.001 | 0.0011 ± 0.0001 |
| 16 | Co | 0.025 ± 0.001 | 0.10 ± 0.01 | 42 | Nd | 0.058 ± 0.005 | 0.25 ± 0.01 |
| 17 | Cu | 2.7 ± 0.3 | 0.51 ± 0.02 | 43 | Sm | 0.013 ± 0.001 | <0.0004 |
| 18 | Ga | 0.020 ± 0.003 | 0.029 ± 0.005 | 44 | Eu | 0.0029 ± 0.0002 | <0.0001 |
| 19 | As | <0.004 | <0.02 | 45 | Gd | 0.016 ± 0.001 | 0.0003 ± 0.0001 |
| 20 | Se | <0.03 | <0.2 | 46 | Tb | 0.0035 ± 0.0001 | 0.00014 ± 0.00004 |
| 21 | Rb | 0.016 ± 0.005 | <0.002 | 47 | Dy | 0.030 ± 0.001 | <0.0003 |
| 22 | Sr | 1.25 ± 0.06 | 0.09 ± 0.03 | 48 | Ho | 0.010 ± 0.001 | <0.00008 |
| 23 | Cd | 0.0020 ± 0.0003 | <0.002 | 49 | Er | 0.041 ± 0.004 | 0.0005 ± 0.0001 |
| 24 | Te | <0.003 | <0.01 | 50 | Tm | 0.008 ± 0.001 | <0.00007 |
| 25 | Cs | 0.0011 ± 0.0004 | <0.0005 | 51 | Yb | 0.097 ± 0.006 | 0.00022 ± 0.00001 |
| 26 | Re | 0.0010 ± 0.0001 | <0.0006 | 52 | Lu | 0.013 ± 0.001 | <0.00009 |
Disclaimer/Publisher’s Note: The statements, opinions and data contained in all publications are solely those of the individual author(s) and contributor(s) and not of MDPI and/or the editor(s). MDPI and/or the editor(s) disclaim responsibility for any injury to people or property resulting from any ideas, methods, instructions or products referred to in the content. |
© 2023 by the authors. Licensee MDPI, Basel, Switzerland. This article is an open access article distributed under the terms and conditions of the Creative Commons Attribution (CC BY) license (https://creativecommons.org/licenses/by/4.0/).
Share and Cite
MDPI and ACS Style
Galtsov-Tsientsiala, M.S.; Dudoladov, A.O.; Grigorenko, A.V.; Vlaskin, M.S. Study of Soot Deposits during Continuous Methane Pyrolysis in a Corundum Tube. Appl. Sci. 2023, 13, 10817. https://doi.org/10.3390/app131910817
AMA Style
Galtsov-Tsientsiala MS, Dudoladov AO, Grigorenko AV, Vlaskin MS. Study of Soot Deposits during Continuous Methane Pyrolysis in a Corundum Tube. Applied Sciences. 2023; 13(19):10817. https://doi.org/10.3390/app131910817
Chicago/Turabian StyleGaltsov-Tsientsiala, Matvey S., Aleksandr O. Dudoladov, Anatoly V. Grigorenko, and Mikhail S. Vlaskin. 2023. "Study of Soot Deposits during Continuous Methane Pyrolysis in a Corundum Tube" Applied Sciences 13, no. 19: 10817. https://doi.org/10.3390/app131910817
Note that from the first issue of 2016, this journal uses article numbers instead of page numbers. See further details here.