Article

Determination of Vehicle Emission Rates for Ammonia and Organic Molecular Markers Using a Chassis Dynamometer

1
Department of Environmental Engineering, Mokpo National University, Muan 58554, Republic of Korea
2
Climate Change Assessment Division, National Institute of Agricultural Sciences, Wanju 55365, Republic of Korea
*
Author to whom correspondence should be addressed.
Appl. Sci. 2023, 13(16), 9366; https://doi.org/10.3390/app13169366
Submission received: 19 July 2023 / Revised: 10 August 2023 / Accepted: 16 August 2023 / Published: 18 August 2023
(This article belongs to the Special Issue Short- and Long-Term Air Pollution Analysis, Modeling and Prediction)

Abstract

:
Stringent regulations have been implemented to address vehicle exhaust emissions and mitigate air pollution. However, the introduction of exhaust gas reduction devices, such as Three-Way Catalytic converters, has raised concerns about the generation and release of additional pollutants such as NH3. This study utilized a chassis dynamometer to investigate the characteristics of exhaust pollutants, including carbon monoxide (CO), hydrocarbons (HC), nitrogen oxides (NOx), particulate matter (PM), ammonia (NH3), organic carbon (OC), and elemental carbon (EC). The emissions were examined across various vehicle fuel types, namely liquefied petroleum gas, gasoline, and diesel (EURO4, EURO6), to assess their individual contributions to exhaust emissions. The results revealed significant variations in the emission levels of regulated pollutants (CO, HC, NOx, and PM) during driving, depending on factors such as engine technology, emissions control strategies, fuel type, and test cycle. Notably, NH3 emissions analysis according to driving mode indicated that gasoline vehicles exhibited the highest NH3 emissions, while diesel vehicles emitted negligible amounts. This observation can be attributed to the production of NH3 as a byproduct of catalytic reduction processes implemented by exhaust gas reduction devices targeting CO, HC, and NOx. In addition, EURO4 vehicles demonstrated higher emission levels of OC and EC compared with other fuel types. Furthermore, the presence of diesel particulate filters (DPFs) in diesel vehicles effectively reduced PM emissions. Moreover, this study investigated the emission characteristics of organic molecular markers within the organic carbon fraction, revealing distinct emission profiles for each vehicle and fuel type. These findings contribute to the identification of emission sources by discerning the primary components emitted by specific fuel types.

1. Introduction

Vehicle emissions, known to be a significant source of air pollution, can be classified into distinct categories: (1) combustion products of fuel, (2) products resulting from incomplete combustion, (3) unburned fuel and decomposition products, (4) combustion products of fuel additives, (5) combustion products of impurities, and (6) major air components chemically transformed within high-temperature combustion chambers [1,2].
Emissions of PM2.5 (Particulate Matter Less Than 2.5 μm) from vehicles pose severe risks to human health and contribute to climate change due to their small size and complex physiochemical characteristics [3,4]. Diesel vehicle exhaust has been designated as a carcinogen due to an increased incidence of lung cancer associated with exposure [1,5]. While petroleum-based fuels such as gasoline and diesel theoretically produce only water vapor and carbon dioxide upon complete combustion, in reality, incomplete combustion leads to the emission of hazardous compounds. Hazardous substances predominantly comprise PM (particulate matter), NOx, polyaromatic hydrocarbons (PAHs), hydrocarbons (HCs), carbon dioxide (CO2), and aldehydes [6]. Among these, PM, PAHs, and HCs contribute to vehicle emissions. In addition, the proportion of carbon components in exhaust emissions is particularly high in PM2.5 [2,7,8].
Table 1 presents the findings of previous studies investigating exhaust gas emissions from diesel and gasoline vehicles. These studies have consistently demonstrated that diesel vehicles emit higher levels of NOx compared with gasoline vehicles [9,10,11,12,13,14,15]. Furthermore, as emissions regulations were strengthened, carbon monoxide (CO) emissions exhibited a decreasing trend, with EURO4 > EURO5 > EURO6. Han et al. [16] conducted a chassis dynamometer test to examine the emission characteristics of HCs, CO, and NOx from vehicles using gasoline, diesel, and liquefied petroleum gas (LPG) fuels. The results revealed that gasoline, diesel, and LPG vehicles emitted 0.334 g/km, 0.267 g/km, and 0.304 g/km, respectively, when considering the total emissions comprising HC, CO, and NOx. Diesel vehicles emitted negligible amounts of HC, while LPG vehicles emitted 125% more HC compared with gasoline vehicles. Moreover, diesel vehicles exhibited the lowest CO emissions, while gasoline vehicles exhibited the highest. Notably, diesel and LPG vehicles emitted 523% and 100% more NOx, respectively, than gasoline vehicles, indicating the significant impact of fuel type on emissions. Previous studies have employed chassis dynamometer testing to comparatively analyze exhaust gas emissions during regulatory mode testing for each fuel type [17,18].
Currently, the PM mass emitted as exhaust gas is regulated, but not in terms of emissions of harmful compounds present in PM [19]. Polycyclic aromatic hydrocarbons (PAHs) are products of incomplete combustion of organic matter and are ubiquitous in city air [20]. Due to its low vapor pressure, it is easily adsorbed on combustion emissions and airborne particles. Human exposure to PAHs is problematic because many PAHs are mutagenic and carcinogenic. PAHs are present in gasoline and diesel engine exhaust, cigarette and wood smoke, and emissions from natural gas and oil-fired burners. Vehicles are a major source of PAHs in the air in many cities worldwide. n-Alkanes are one of the most abundant classes of organic compounds identified in PM exhaust emissions [21]. Even when organic markers such as PAHs are present in trace amounts in the total mass of PM, they can have significant negative effects on human health. Therefore, quantifying emissions of unregulated trace pollutants from vehicles is a key aspect of controlling the health effects of PM pollution. Biodiversity loss can occur when excess nitrogen from NH3 emissions is deposited in terrestrial and aquatic ecosystems through wet and dry deposition [22,23]. As a result, it causes soil acidification and eutrophication of the aquatic environment. In addition, NH3 is an indirect source of nitrous oxide, and its deposition also affects carbon dioxide sequestration, so its effect on greenhouse gases cannot be ignored. However, recent studies have reported significant NH3 emissions from gasoline and LPG vehicles equipped with three-way catalytic (TWC) converters [24,25]. Currently, a TWC device for reducing vehicle exhaust gas is obligatory attached to gasoline vehicles, so ammonia emissions are increasing in areas with many vehicles. The conversion process of CO to CO2 generates H2, which subsequently combines with NO to form NH3 [26,27]. Consequently, NH3 reacts with nitric and sulfuric acid in the atmosphere, leading to the formation of secondary PM components such as ammonium nitrate and ammonium sulfate [28,29,30]. High concentrations of NH3 emitted from vehicles have been observed, particularly in urban areas along major roadways [31,32]. For instance, measurements conducted in Shanghai, China, recorded NH3 concentrations as high as 85.51 ppb at a roadside location [31]. Similarly, observations in tunnels in Switzerland indicated NH3 levels as high as 200 ppb at tunnel exits [33,34]. Despite the potential impact of vehicle-emitted NH3 on atmospheric PM concentrations, studies on this topic remain limited.
Despite the importance of emissions to air pollution, little is known about the consequences of unregulated pollutant emissions. Therefore, the present study aimed to analyze the emission rates (ER) of CO, HC, NOx, organic markers, and NH3 from different types of vehicles based on driving mode, utilizing a chassis dynamometer.

2. Materials and Methods

2.1. Test Vehicle Selection

The present study aimed to investigate the chemical characteristics of ER using a chassis dynamometer for eight different vehicles. The specifications of the selected vehicles in this study are presented in Table A1 and Table A2, as shown in Appendix A. Initially, two gasoline vehicles employing Gasoline Direct Injection (GDI), which is the most recent fuel supply method, were chosen. A 2.0 L class vehicle and a 1.6 L class vehicle were selected to diversify vehicle displacement and technology. The 2.0 L class vehicle featured a turbocharger, while the 1.6 L class vehicle was a naturally aspirated model. Both vehicles were equipped with TWC converters designed to reduce CO, NOx, and HC emissions. For the LPG vehicles, two vehicles in the 2.0 L class equipped with TWC were selected. However, the impact of fuel injection technology on air pollutant emissions was assessed by including an LPLi vehicle that injects LPG in a liquid phase and an LPGi vehicle that injects LPG in a gaseous phase. Regarding the diesel vehicles, two vehicles complying with EURO4 regulations and two vehicles complying with EURO6 regulations were chosen. EURO4 vehicles utilized Exhaust Gas Recirculation (EGR) and a Diesel Oxidation Catalyst (DOC). The DOC served to reduce concentrations of CO, HC, and PM by utilizing an oxidation catalytic converter. EURO6 vehicles employed EGR, DOC, Selective Catalyst Reduction (SCR), and a diesel particulate filter (DPF). EGR and SCR were employed to mitigate NOx emissions, while the DPF served as an aftertreatment device for particulate matter reduction. In addition, vehicles with displacements of 2.0 L and 1.6 L were selected for each regulation to evaluate the impact of displacement on diesel vehicle emissions.

2.2. Test Mode

In this study, regulatory test modes were employed to measure exhaust gas ER for different vehicle types and fuel types. Gasoline and LPG vehicles were tested using the Constant Volume Sampler (CVS-75), which is a regulatory test mode. Diesel vehicles were tested using the New European Driving Cycle (NEDC), another regulatory test mode. Two additional modes were incorporated into the standard regulatory test mode for each vehicle type to account for diverse driving conditions. The Supplemental Federal Test Procedure (US06), characterized by rapid acceleration and deceleration, was conducted, along with the World Harmonized Light-duty Vehicle Test Cycle (WLTC), designed specifically for diesel vehicles. The WLTC was proposed by the GRoup of Pollution and Energy (GRPE) within the framework of the World Forum for Harmonization of Vehicle Regulation (WP.29) under the UN Economic Commission for Europe (UNECE) to enhance the limitations of the NEDC mode. Table 2 provides an overview of the speed profiles for each test mode.

2.3. Chassis Dynamometer System and Exhaust Gas Analysis

In this study, a chassis dynamometer system was employed to replicate actual road conditions by controlling the load applied to the vehicle. The chassis dynamometer simulates the driving process of repeated stoppage, acceleration, constant speed, and deceleration that occurs on real roads. Specifically, a dynamometer designed for small passenger vehicles and trucks with a total vehicle weight of less than 3.5 tons was utilized. Figure 1 depicts the chassis dynamometer system employed in this study, comprising an exhaust gas analyzer, a sampling device, a dilution tunnel, PM measurement equipment, an exhaust gas heat exchanger, and auxiliary operation devices (such as a driver’s aid and weather station). The exhaust gas analyzer was utilized to analyze the composition of exhaust gases emitted through the vehicle’s exhaust pipe. Furthermore, a dilution tunnel was incorporated to achieve a clean gas-to-exhaust gas dilution ratio of 100:1.
The exhaust gas emitted from the vehicle’s exhaust pipe during each mode of operation on the chassis dynamometer was diluted with a specific volume of air using a Constant Volume Sampler (Figure 2a). The diluted exhaust gas was then collected in a sampling bag for subsequent quantitative analysis. A MEXA-7200H (HORIBA) instrument capable of analyzing CO, HC, NOx, CO2, and CH4 was used to measure the exhaust gas composition (Figure 2b). CO and CO2 were analyzed using the Non-Dispersive InfraRed (NDIR) method, HC was measured using the Heated Flame Ionization Detection (HFID) technique, NOx was determined using Chemiluminescence Detection (CLD), and CH4 was analyzed via Gas Chromatography-Flame Ionization Detection (GC-FID) [17,35]. The real-time instrument performs a background value and calibration before each measurement. The collection of PM2.5 involved diluting the exhaust gas with air at a predetermined ratio while the vehicle was driven on the chassis dynamometer, and the particulate matter was collected on a filter (Figure 2c). Samples were collected using quartz filters (Pallflex, 2500QATUP, Pall Corp., USA) for PM and organic marker analysis. Prior to sampling, the quartz filters were baked at 450 °C for 6 h to remove impurities and minimize the presence of carbonaceous components in the blank samples. The PM2.5 emissions were calculated by measuring the weight difference of the filter before and after collection. Vehicle NH3 emissions were analyzed using an Off-Axis Integrated Cavity Output Spectroscopy (OA-ICOS) instrument (Los Gatos Research (LGR), ABB Inc., Quebec, Canada) based on Laser Diode Spectrometry. Figure 2d shows the equipment used in this study. This method utilizes the Lambert–Beer law, which calculates absorbance based on the variation in laser intensity before and after transmission through the sample. In addition, measurements of gas temperature, pressure, wavelength travel distance, and wavelength after passing through the sample were taken to calculate the NH3 concentration. The NH3 meter used in this study was calibrated by a diluter treated with electrolytic polishing (EP) before measurement. All instruments were calibrated before and after major measurements using a chassis dynamometer.
Organic carbon in PM2.5 was analyzed using the Thermal-Optical Transmittance Protocol for Pyrolysis Correction based on the National Institute for Occupational Safety and Health (NIOSH) 5040 protocol. This analysis was performed on the samples collected on quartz filters during the chassis dynamometer test [36,37]. Organic molecular markers encompass both insoluble components directly released as primary components (e.g., PAHs) and soluble components such as organic acids. Insoluble components were analyzed using the gas chromatography/mass spectrometry (GC/MS) method, while soluble components were analyzed using liquid chromatography/tandem mass spectrometry (LC/TS). The GC/MS analysis was conducted using a 7890 Gas Chromatograph coupled with a 5975 Mass Spectrum Detector with helium as the carrier gas. LC/TS quantification employed a time-programmable selected ion monitoring mode for the analysis of multiple target compounds. The analysis in this study encompassed organic molecular markers, including PAHs, alkanes, Hopanes, Cycloalkanes, Alkanoic acids, Benzene carboxylic acids, and Di-carboxylic acids. Detailed analytical methods, including calibrations and quality controls, can be found in previous studies [36,37].

3. Results

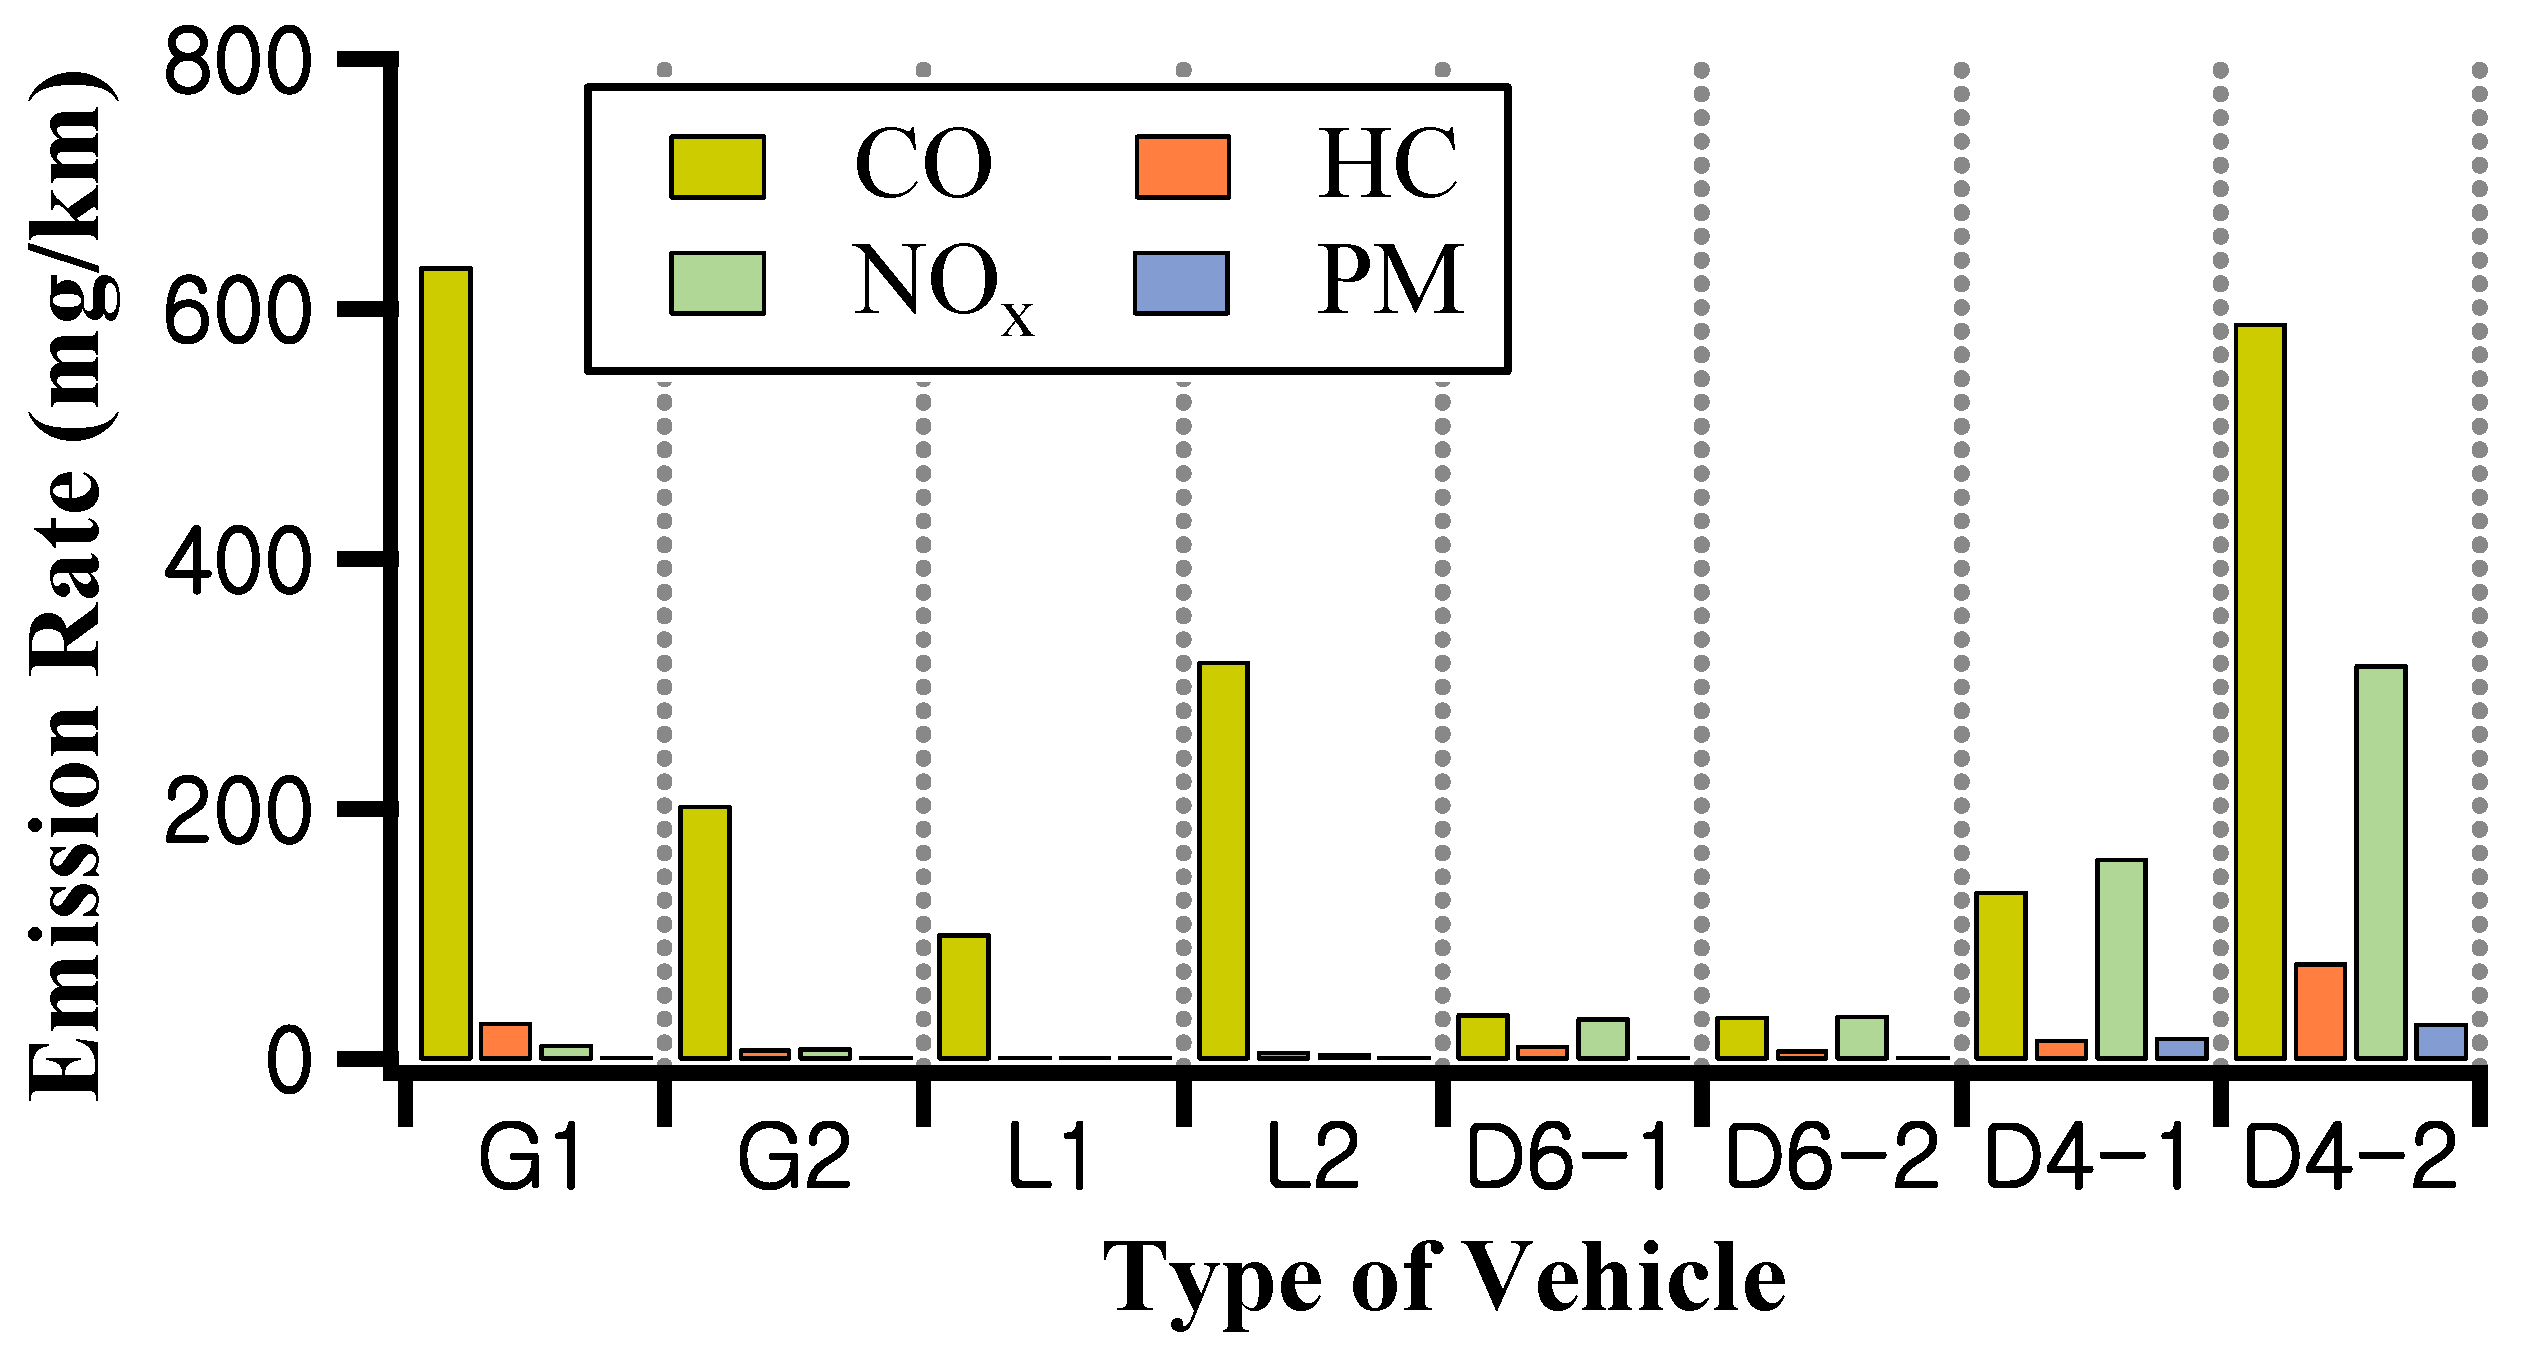
3.1. Emission Rate of CO, HC, NOx, and PM on the Regulatory Test Mode

Figure 3 and Table 3 show the ER of CO, HC, NOx, and PM obtained during the regulatory test mode for each vehicle type. It is noteworthy that all eight vehicle types emitted CO levels below the prescribed emission standards. Among the gasoline vehicles, G2, equipped with a turbocharger, exhibits higher HC emissions compared with G1. This outcome can be attributed to the larger fuel injection volume necessary to maintain the desired air-fuel ratio, given the increased air supply facilitated by the turbocharger. The LPG vehicle L2 demonstrates higher CO and HC emissions than L1, which can be attributed to differences in aftertreatment systems and fuel control methods employed in L1, compliant with the latest regulations. The diesel vehicle D4-2, despite its inherent lean combustion characteristics, exhibits CO ER similar to that of gasoline vehicles. This observation is likely associated with the selection of customized engine operation control optimization for each fuel type (gasoline and LPG: CVS-75; diesel: NEDC) in accordance with emission regulations. Moreover, D4-2 emits the highest levels of HC, which can be attributed to the application of EGR for NOx reduction, as EURO4 vehicles are subject to the sum of NOx and HC regulations. These findings align with previous studies [17]. In summary, the reduction of nitrogen oxide and the decrease in oxygen concentration, along with the lowering of combustion temperatures due to exhaust gas components with high specific heat (H2O and CO2), results in relatively increased CO and HC emissions.
All vehicles in the study demonstrate NOx ER below the prescribed emission standards. The gasoline vehicles exhibit similar NOx emissions despite their varying displacements. Among the eight vehicle types, LPG vehicles emit the lowest levels of NOx. In the case of diesel vehicles, the EURO6 vehicle displays lower NOx emissions compared with other vehicle types, while the EURO4 vehicles emit the highest levels. These results can be attributed to the utilization of NOx reduction technologies such as EGR and SCR.
Regarding PM emissions during the regulatory test mode, all gasoline vehicles complied with the emission standards, with only G1, equipped with a turbocharger, exhibiting detectable PM emissions while G2 remained below the detection limit. Historically, particulate emissions have been associated with diesel engines [38]. However, PM2.5 emitted from GDI engines equipped with turbochargers has recently become a problem. Studies have shown that PM emissions from GDI engines are comparable to or even higher than PM emissions from diesel engines equipped with DPFs [39]. Particulate emissions from GDI engines must be addressed through combustion processes or aftertreatment systems. Similarly, both LPG and EURO6 diesel vehicles emit minimal levels of PM. However, EURO4 vehicles, lacking DPF, display the highest PM ER as PM was emitted without undergoing significant reduction. It is well-established that diesel combustion, initiated by the auto-ignition of diesel fuel in hot compressed air, tends to generate higher PM emissions compared with gasoline combustion, which starts with a spark igniting a uniform mixture of gasoline vapor and air [2]. The EURO6 vehicles exhibit significantly reduced PM emissions due to the efficient PM collection through the DPF. In contrast, EURO4 vehicles emit a larger amount of PM, primarily due to the absence of filtration, although a small fraction of PM might have undergone oxidation by the DOC.

3.2. Emission Rate of CO, HC, NOx, and PM on Diverse Test Mode Characteristics

Table 4 presents the ER of CO, HC, NOx, and PM obtained during the diverse test mode for each vehicle type. Among the gasoline vehicles, G1 exhibits higher CO ER in the US06 mode compared with other test modes. The US06 mode is a test mode including warm-up (preheating) driving warm-up before test measurement to satisfy the rapid acceleration driving speed, and the analysis was conducted after the vehicle was sufficiently warmed up. During the preheating mode, G1 demonstrated significantly higher emissions than in other test modes. G2, on the other hand, emitted the highest amount of CO in both the NEDC and US06 modes. This result can be attributed to rapid acceleration and deceleration, as well as variations in test mode configurations that may include different starting conditions compared with G1. In the case of LPG vehicles, L2 displays considerable CO ER in the US06 mode. This can be attributed to the increased fuel consumption necessary to overcome the high load demands and achieve the desired driving speeds in the rapid acceleration test mode. Conversely, the reason why L1 has a lower ER than L2 is judged to be influenced by the fuel control technology or aftertreatment device applied to meet the regulation of L1 produced in 2017. Notably, the EURO4 diesel vehicles emit higher levels of all pollutants compared with gasoline and LPG vehicles in the NEDC mode; however, their emission rates remain lower than those of gasoline and LPG vehicles overall.
The emission levels of HC in each test mode were analyzed. G1 exhibits the highest HC emissions in the NEDC mode, indicating that a portion of the fuel used during vehicle startup is not fully combusted and subsequently emitted as exhaust gas. This can be attributed to the inclusion of starting conditions in the test mode. Furthermore, the delayed activation of the catalyst due to the gentle driving conditions at the beginning of the NEDC mode also influenced the HC emissions. Similarly, G2 emits the highest levels of HC in the NEDC mode, with overall lower HC emissions compared with G1 across all test modes. For LPG vehicles, L2 consistently exhibits higher HC emissions than L1 in all test modes. L2 displays significant HC emissions in the US06 mode, which can be attributed to increased fuel consumption and the subsequent emission of unburned HC due to the high load conditions. The EURO6 vehicles are estimated to have high HC emissions before reaching the activation temperature of DOC, a CO and HC abatement device. As a result, the EURO6 vehicles display the highest ER of HC in the WLTC mode. Conversely, EURO4 vehicles demonstrate the highest ER of HC in the NEDC mode, despite the application of the reduction device DOC. In the case of NOx ER, LPG is the lowest among fuels. Gasoline has CVS-75, EURO6 has the lowest WLTC, and EURO4 has the lowest NEDC, resulting in the lowest NOx emission in the corresponding regulatory mode. Regarding PM emissions, EURO4 vehicles emit the highest levels in each test mode. The greatest amount of PM is emitted during the rapid acceleration/deceleration US06 mode. This observation can be attributed to the absence of a DPF in EURO4 vehicles, unlike the EURO6 counterparts, resulting in the emission of larger quantities of PM.

3.3. Emission Rate of Ammonia

Measurements were conducted using the CVS-75 mode for gasoline and LPG vehicles, the WLTC mode for EURO6 vehicles, and the NEDC mode for EURO4 vehicles in Table 5 to assess NH3 emissions based on the regulatory test mode. The findings indicate that gasoline vehicles emit the highest levels of NH3, followed by LPG and diesel vehicles. During the CVS-75 cycle, the gasoline vehicle G1 exhibits the highest NH3 ER of 61.8 mg/km, while the LPG vehicle L2 displays the second-highest ER, measuring 17.8 mg/km. In contrast, both EURO4 and EURO6 diesel vehicles demonstrate negligible NH3 emissions, with values of 0.2 mg/km or lower.
Table 5 provides the NH3 emissions of each vehicle type in different test modes. Among the gasoline vehicles, G1 exhibits the lowest NH3 emissions in the CVS-75 mode, a regulatory test mode, but emits the highest levels of NH3 in the US06 and WLTC modes, which are preheating modes (hot start). In the US06 mode, characterized by an average speed of 77 km/h and maximum acceleration of 3.8 m/s2, the increased NH3 emissions can be attributed to the more rapid driving characteristics compared with other modes. The higher NH3 emission rate in US06 can be mainly attributed to the higher emission during the aggressive acceleration section [40]. Furthermore, NH3 emissions in the NEDC mode are higher than those in the CVS-75 mode. This result suggests that the emission variation is influenced by the difference in driving stability between the CVS-75 and NEDC modes, despite both being under the same cold start condition. Similarly, G2 exhibits the lowest NH3 emissions in the CVS-75 mode, consistent with G1 but with a different absolute value. In addition, G2 demonstrates similar NH3 emission levels in the US06 and WLTC modes compared with G1, highlighting the impact of turbocharger absence, unlike G1, and resulting in differing NH3 emissions during rapid acceleration/deceleration. Consequently, G2 exhibits the highest NH3 emissions in modes characterized by frequent acceleration sections.
Among the two LPG vehicles, emissions tests were conducted solely in the CVS-75 and US06 modes. The 2.0 L class L1 exhibits minimal NH3 emissions of 4.4 mg/km, lower than that of the equivalent 2.0 L class G1. L2 emits higher levels of NH3 compared with L1, with NH3 emissions in the US06 mode, a rapid acceleration/deceleration mode, being 1.7 times higher than those in the CVS-75 mode. These two vehicles share the same displacement but differ in fuel control method, suggesting that the fuel injection method of LPG vehicles influenced NH3 generation.
All four diesel vehicles emit small amounts of NH3, measuring 0.4 mg/km or less across all modes. Despite EURO6 vehicles being equipped with SCR, which could result in ammonia slip, no NH3 emissions indicative of slip are detected in the actual regulatory and rapid acceleration/deceleration modes. In addition, minimal NH3 emissions are observed in the driving mode after initial startup, distinguishing diesel vehicles from gasoline and LPG vehicles. This discrepancy can be attributed to differences in the combustion method, with diesel vehicles employing lean combustion compared with gasoline and LPG vehicles equipped with air–fuel ratio control devices. Furthermore, the variation in NH3 emission rates among vehicles can be attributed to the use of oxidation catalysts in diesel vehicles, while gasoline and LPG vehicles undergo both oxidation and reduction processes. EURO4 vehicles, equipped with EGR and DOC aftertreatment devices, exhibit NH3 emissions at similar levels to EURO6 vehicles. Similar to EURO6, NH3 emissions are only detected during the initial startup, with no NH3 emissions detected under normal driving conditions.
It is known that the precursor CO in exhaust gas contributes most to the formation of NH3. Previous studies showed a high correlation (r2 = 0.76, 0.97) between NH3 and CO from EURO6 (WLTC mode) and EURO5, 6 (NEDC mode) [24,41]. A correlation analysis between the ammonia released from each regulatory mode and the ammonia precursor CO was performed. Gasoline and LPG show a high correlation (r2 = 0.96), and diesel shows a low correlation with NH3 ER less than 0.02 mg/km.
In the current regulatory framework, legal standards are in place for controlling exhaust gas pollutants such as HC, CO, and NOx. To simultaneously reduce these pollutants, the installation of TWC aftertreatment devices is mandatory for gasoline and LPG vehicles. This device utilizes catalysts such as platinum (Pt), palladium (Pd), and rhodium (Rd) to facilitate the reduction of regulated exhaust emissions [42]. However, a challenge arises as these aftertreatment devices also generate a significant precursor to secondary pollutants, namely NH3. NH3 formation occurs through the reaction of NOx with H2, which is generated from the reaction of CO and H2O [43,44]. Liu et al. [43] reported NH3 concentrations of 10.9 mg/km in the NEDC mode and 46.9 mg/km in the WLTC mode when measured after the TWC. Furthermore, the sulfur content present in the fuel can contaminate the TWC converter, affecting the production and conversion of NH3 and NOx [26]. However, previous studies have primarily focused on measuring NH3 solely at the vehicle tailpipe after the TWC without confirming whether the NH3 is actually generated by the catalyst. Hence, this study aimed to measure NH3 both at the vehicle tailpipe and at the front of the TWC to determine the catalyst’s role in NH3 generation. GDI vehicles were utilized for experimental purposes, conducted under the NEDC mode. The findings revealed trace amounts of NH3 detected at the TWC front and substantial amounts detected at the TWC tailpipe, confirming the TWC as the primary source of NH3 production. These results underscore the necessity of developing strategies to mitigate NH3 emissions from gasoline and LPG vehicles, aiming to reduce PM2.5 pollution in the atmosphere.

3.4. Emission Rate of Organic Molecular Markers

According to Zhang et al. [45], a significant proportion of pollutants emitted from vehicles consists of organic components. In this study, exhaust gas samples were collected and analyzed during driving in the US06 and CVS-75 modes to determine the ER of OC and EC based on the fuel type. OC and EC emissions were quantified using quartz filters for gas collection, and the results are presented in Table 6. Diesel engines are extensively utilized in various applications such as vehicles, ships, and construction machinery due to their high thermal efficiency, cost-effectiveness, and durability [1,45]. However, the widespread use of diesel engines also contributes to significant environmental pollution issues [32]. To mitigate PM emissions, the installation of DPF in diesel vehicles has become crucial for effective exhaust gas emission control, considering the substantial role of diesel vehicles as a major source of PM production [1]. Nevertheless, despite the oxidation and combustion of most PM during vehicle operation, non-volatile substances such as elemental carbon, ash, and soot persist [7,32,45]. Hence, this study focused on analyzing the carbon content by capturing exhaust gas during DPF regeneration (DPFre) using EURO6 vehicles (EURO6 DPFre).
Regarding the CVS-75 mode, all vehicles except for gasoline vehicles exhibit minimal emissions of OC and EC. Therefore, the carbon components generated in the US06 mode were analyzed for LPG and diesel vehicles. Among the vehicles, EURO4 vehicles emit the highest levels of OC and EC. On the other hand, EURO6 vehicles show the lowest emissions of OC and EC. During DPF regeneration, OC and EC emissions increased to 0.03 and 0.04 mg/km, respectively, which were 2.2 and 3.3 times higher than normal levels. These findings indicate that while DPFs effectively remove significant amounts of PM from exhaust gases, they also contribute to the generation and emission of another air pollutant, carbonaceous material.
Furthermore, this study analyzed the presence of organic molecular markers in the samples collected from the quartz filters, categorized by fuel type. The analyzed OC data were normalized, and Table 7 presents the quantities of specific organic markers such as PAHs, Hopanes, Cycloalkanes, Alkanes, Alkanoic acids, Benzo carboxylic acids, and Di-carboxylic acids per unit of OC. The results revealed variations in emission rates depending on the fuel type. EURO4 vehicles, which exhibit the highest OC emissions among all vehicles, also show the highest emissions of organic marker substances overall. Notably, PAHs, Hopanes, Cycloalkanes, and Alkanes exhibit higher values compared with the other vehicles. With the exception of EURO4, EURO6 vehicles exhibit the highest values for Cycloalkanes, Alkanes, and Benzo carboxylic acids, while gasoline vehicle G1 shows the highest values for PAHs, Alkanoic acids, and Di-carboxylic acids. These findings provide significant data for distinguishing between the emission characteristics of EURO regulations and diesel vehicles based on air-soluble organic markers. In addition, the lower PAH emissions observed in EURO6 vehicles compared with gasoline vehicles indicate the relatively superior exhaust gas component reduction function of EURO6. Notably, EURO6 DPFre exhibits much higher PAH emissions at 49.3 ng/km, approximately 114 times higher than EURO6. Moreover, EURO6 vehicles do not emit Cycloalkanes, whereas EURO6 DPFre emits 47.7 ng/km of Cycloalkanes, indicating a distinct difference. As emissions during DPF operation exceeded general emissions, further studies are necessary to investigate the organic molecular markers generated during the operation of aftertreatment devices.
Among the analyzed PAHs, EURO4 vehicles exhibited the highest ER, with notable increases in Phenanthrene, Fluoranthene, and Pyrene emissions compared with other vehicles in Table 8. These findings serve as important indicators for identifying EURO4-specific emission sources, as the aforementioned three components show significantly higher emission rates compared with other vehicles. Most of the PAHs emitted from EURO6 are below the detection limit. Similarly, in the analysis of 16 Hopane types in Table 9, EURO4 vehicles exhibit the highest emissions overall. Emissions of 22S-Trishomohopane, 22R-Trishomohopane, AAA-20S-C27-Cholestane, ABB-20R-C27-Cholestane, and AAA-20R-27-cholestane are exclusively observed in EURO4 vehicles. Among the Alkane series, n-Tetradecane and n-Hexadecane exhibit the highest emissions. EURO4 vehicles also emit the highest levels of the Cycloalkane series, whereas EURO6 vehicles emit negligible amounts, indicating contrasting emission patterns between EURO4 and EURO6. Regarding the Alkane series, EURO4 vehicles show the highest emissions of Phytane, while EURO6 vehicles display the highest emissions of n-Tetradecane. Notably, EURO6 DPFre vehicles show the highest emissions of n-Heneicosane. Components such as n-Tridecane, n-Pentadecane, Norpristane, Pristane, and Phytane are exclusively emitted by EURO4 vehicles, making them potential representative emission components in future studies. However, components after n-Hexacosane exhibited characteristics of being unanalyzed. Particularly, among the polar components, all components of Benzene carboxylic acid (i.e., Phthalic Acid, Isophthalic Acid, Terephthalic Acid, 1,2,4-Benzenetricarboxylic Acid, 1,2,3-Benzenetricarboxylic Acid, 1,3,5-Benzenetricarboxylic Acid, 1,2,4,5-Benzenetetracarboxylic Acid, and Methylphthalic Acid) display elevated levels in EURO4 vehicles, indicating their high emission rates in Table 10.
The EURO4 vehicles exhibit the highest relative emissions of OC and EC. Notably, specific organic marker substances such as PAHs (Phenanthrene, Fluoranthene, Pyrene), 17A(H)-22,29,30-Trisnorhopane, 17A(H)-21B(H)-30-Norhopane, and A(H)-21B(H)-Hopane were identified. Furthermore, the highest relative distribution of Alkanoic acid is observed in the G1 vehicles. These findings indicate that the emission contributions to the atmosphere from different fuel types can be estimated based on the distinctive distribution patterns of organic marker substances, Alkane, and Benzo carboxylic acid, particularly for EURO4 vehicles.

4. Conclusions

Despite the importance of vehicle emissions, little is known about the consequences of unregulated pollutant emissions. In the present study, we checked the ER of CO, HC, NOx, PM, NH3, and organic markers emitted from gasoline, LPG, and diesel (EURO4, EURO6) vehicles using a chassis dynamometer to look into the characteristics of the pollutants emitted from vehicles. Chassis dynamometers can measure pollutant emissions from various vehicles under controlled driving conditions and can effectively evaluate emission control technology. The CO, HC, NOx, and PM emitted in regulatory test modes all satisfied the acceptance criteria. As for NH3 emission in different regulatory test modes, the gasoline and LPG vehicles emitted NH3 in the CVS-75 mode. The diesel vehicles emitted very small NH3 amounts of 0.1 mg/km or less in the NEDC (EURO4) and WLTC (EURO6) modes. In addition, the gasoline vehicles showed characteristics where the higher the displacement, the greater the increase in NH3 emission. Because the water gas shift reaction of CO generated hydrogen, which increased the probability of NH3 being generated, it brought the result where NH3 emission increased in the vehicles with large CO emissions. The EURO4 vehicles showed the greatest emissions of organic carbon. In addition, the difference in the organic marker substances emitted from EURO4 and EURO6 of the same fuel type was confirmed. Furthermore, the present study centered on the analysis of carbon content by capturing exhaust gas during diesel particulate filter (DPF) regeneration employing EURO6 vehicles, thereby warranting additional consideration. As a result, each fuel showed different organic molecular marker profiles and total ER. The results of this study highlight the importance of considering specific marker components for each fuel to assess unregulated pollutants in vehicle emissions.

Author Contributions

G.-H.Y. contributed to this work via experiment measurements, data analysis, and manuscript preparation. M.-K.S., S.-H.O., S.-Y.C. and M.-W.K. contributed research sample analyses. M.-S.B. contributed to experiment planning and data analysis. All authors have read and agreed to the published version of the manuscript.

Funding

This study was supported by a grant (NRF-2023M3G1A1090662 and 2020R1I1A3054851) of the Center for FRIEND Project in the National Research Foundation Korea (NRF) and Cooperative Research Program for Agriculture Science & Technology Development (PJ0170302023) Rural Development Administration, Republic of Korea.

Institutional Review Board Statement

Not applicable.

Informed Consent Statement

Not applicable.

Data Availability Statement

Not applicable.

Conflicts of Interest

The authors declare no conflict of interest.

Appendix A

Table A1. Specifications of Gasoline and LPG Vehicles (G1, G2, L1, and L2).
VehicleG1G2L1L2
FuelGasolineGasolineLPGLPG
Production year2015201720172015
Mileage76,00026,000400078,000
EngineTheta IIAlphaNUl4
Fuel supply methodGDI
(Turbocharger)
GDILPLiLPGi
Displacement (cc)1999159819991998
Maximum output (HP)16813146137
Maximum torque (kg·m)20.515.719.518.7
Fuel efficiency (km/L]10.813.710.38.3
Reduction deviceThree-way
catalytic converter
(Tier-2)
Three-way
catalytic converter
(Tier-2)
Three-way
catalytic converter
(Tier-3)
Three-way
catalytic converter
(Tier-2)
Table A2. Specifications of Diesel Vehicles (D6-1, D6-2, D4-1, and D4-2).
VehicleD6-1D6-2D4-1D4-2
FuelDieselDieselDieselDiesel
Production year2018201820072008
Mileage4000250089,000190,000
EngineR VGTUIII e-VGTJ3D-VGT
Fuel supply methodCRDICRDICRDICRDI
Displacement (cc)1995159829021991
Max. output (HP)186136174151
Max. torque (kg·m)41.032.636.034.0
Fuel efficiency (km/L)13.816.310.012.6
Reduction deviceEGR + DOC + SCR + DPF
(EURO-6)
EGR + LNT + SCR + DPF
(EURO-6)
EGR + DOC
(EURO-4)
EGR + DOC
(EURO-4)

References

  1. Meng, Z.; Chen, C.; Li, J.; Fang, J.; Tan, J.; Qin, Y.; Jiang, Y.; Qin, Z.; Bai, W.; Liang, K. Particle emission characteristics of DPF regeneration from DPF regeneration bench and diesel engine bench measurements. Fuel 2020, 262, 116589. [Google Scholar] [CrossRef]
  2. Wallington, T.J.; Sullivan, J.L.; Hurley, M.D. Emissions of CO2, CO, NOx, HC, PM, HFC-134a, N2O and CH4 from the global light duty vehicle fleet. Meteorol. Z. 2008, 17, 109–116. [Google Scholar] [CrossRef]
  3. Chow, J.C.; Watson, J.G.; Fujita, E.M.; Lu, Z.; Lawson, D.R.; Ashbaugh, L.L. Temporal and spatial variations of PM2.5 and PM10 aerosol in the southern California air quality study. Atmos. Environ. 1994, 28, 2061–2080. [Google Scholar] [CrossRef]
  4. Rönkkö, T.; Kuuluvainen, H.; Karjalanen, P.; Keskinen, J.; Hillamo, R.; Niemi, J.V.; Pirjola, L.; Timonen, H.; Saarikoski, S.; Saukko, E.; et al. Traffic is a major source of atmospheric nanocluster aerosol. Proc. Natl. Acad. Sci. USA 2017, 114, 7549–7554. [Google Scholar] [CrossRef]
  5. Feng, R.; Hu, X.; Li, G.; Sun, Z.; Deng, B. A comparative investigation between particle oxidation catalyst (POC) and diesel particulate filter (DPF) coupling aftertreatment system on emission reduction of a non-road diesel engine. Ecotoxicol. Environ. Saf. 2002, 238, 113576. [Google Scholar] [CrossRef]
  6. Pathak, S.K.; Sood, V.; Singh, Y.; Channiwala, S.A. Real world vehicle emissions: Their correlation with driving parameters. Transp. Res. Part D Transp. Environ. 2016, 44, 157–176. [Google Scholar] [CrossRef]
  7. Meng, Z.; Zeng, B.; Tan, J.; Chen, Z.; Ou, J. Study of gas and particulate emission characteristics during the fast regeneration period of DPF. Fuel 2022, 317, 123353. [Google Scholar] [CrossRef]
  8. Shibata, K.; Enya, K.; Ishikawa, N.; Sakamoto, K. EC/OC and PAHs Emissions from a Modern Diesel Engine with DPF Regeneration Fueled by 10% RME Biodiesel. Aerosol Air Qual. Res. 2019, 19, 1765–1774. [Google Scholar] [CrossRef]
  9. Cheung, K.L.; Polidori, A.; Ntziachristos, L.; Tzamkiozis, T.; Samaras, Z.; Cassee, F.R.; Gerlofs, M.; Sioutas, C. Chemical Characteristics and Oxidative Potential of Particulate Matter Emissions from Gasoline, Diesel, and Biodiesel Vehicles. Environ. Sci. Technol. 2009, 43, 6334–6340. [Google Scholar] [CrossRef]
  10. Tsai, J.H.; Chang, S.Y.; Chiang, H.L. Volatile organic compounds from the exhaust of light-duty diesel vehicles. Atmos. Environ. 2012, 61, 499–506. [Google Scholar] [CrossRef]
  11. Chiang, H.L.; Lai, Y.M.; Chang, S.Y. Pollutant constituents of exhaust emitted from light-duty diesel vehicles. Atmos. Environ. 2012, 47, 399–406. [Google Scholar] [CrossRef]
  12. Louis, C.; Liu, Y.; Tassel, P.; Perret, P.; Chaumond, A.; André, M. PAH, BTEX, carbonyl compound, black-carbon, NO2 and ultrafine particle dynamometer bench emissions for Euro 4 and Euro 5 diesel and gasoline passenger vehicles. Atmos. Environ. 2016, 141, 80–95. [Google Scholar] [CrossRef]
  13. Liu, Y.; Martinet, S.; Louis, C.; Pasquier, A.; Tassel, P.; Perret, P. Emission Characterization of In-Use Diesel and Gasoline Euro 4 to Euro 6 Passenger Vehicles Tested on Chassis Dynamometer Bench and Emission Model Assessment. Aerosol Air Qual. Res. 2017, 17, 2289–2299. [Google Scholar] [CrossRef]
  14. Yang, H.H.; Dhital, N.B.; Wang, L.C.; Hsieh, Y.S.; Lee, K.T.; Hsu, Y.T.; Huang, S.C. Chemical Characterization of Fine Particulate Matter in Gasoline and Diesel Vehicle Exhaust. Aerosol Air Qual. Res. 2019, 19, 1439–1449. [Google Scholar] [CrossRef]
  15. Šarkan, B.; Jaśkiewicz, M.; Kubiak, P.; Tarnapowicz, D.; Loman, M. Exhaust Emissions Measurement of a Vehicle with Retrofitted LPG System. Energies 2022, 15, 1184. [Google Scholar] [CrossRef]
  16. Han, S.B.; Kim, Y.T.; Lee, H.K.; Kang, J.H.; Jung, J.W.; Chung, Y.J. Characteristics Analysis of Exhaust Emission according to Fuels at CVS-75 Mode. J. Energy Eng. 2009, 18, 69–73. [Google Scholar]
  17. Park, G.; Mun, S.; Hong, H.; Chung, T.; Jung, S.; Kim, S.; Seo, S.; Kim, J.; Lee, J.; Kim, K.; et al. Characterization of Emission Factors Concerning Gasoline, LPG, and Diesel Vehicles via Transient Chassis-Dynamometer Tests. Appl. Sci. 2019, 9, 1573. [Google Scholar] [CrossRef]
  18. Yang, Z.; Deng, B.; Deng, M.; Huang, S. An Overview of Chassis Dynamometer in the Testing of Vehicle Emission. MATEC Web Conf. 2018, 175, 02015. [Google Scholar] [CrossRef]
  19. Perrone, M.G.; Carbone, C.; Faedo, D.; Ferrero, L.; Maggioni, A.; Sangiorgi, G.; Bolzacchini, E. Exhaust emissions of polycyclic aromatic hydrocarbons, n-alkanes and phenols from vehicles coming within different European classes. Atmos. Environ. 2014, 82, 391–400. [Google Scholar] [CrossRef]
  20. Dunbar, J.C.; Lin, C.I.; Vergucht, I.; Wong, J.; Durant, J.L. Estimating the contributions of mobile sources of PAH to urban air using real-time PAH monitoring. Sci. Total Environ. 2001, 279, 1–19. [Google Scholar] [CrossRef]
  21. Schauer, J.J.; Kleeman, M.J.; Cass, G.R.; Simoneit, B.R. Measurement of emissions from air pollution sources. 5. C1−C32 organic compounds from gasoline-powered motor vehicles. Environ. Sci. Technol. 2002, 36, 1169–1180. [Google Scholar] [CrossRef]
  22. Liu, P.; Ding, J.; Ji, Y.; Xu, H.; Liu, S.; Xiao, B.; Jin, H.; Zhong, X.; Guo, Z.; Wang, H.; et al. Satellite Support to Estimate Livestock Ammonia Emissions: A Case Study in Hebei, China. Atmosphere 2022, 13, 1552. [Google Scholar] [CrossRef]
  23. Hernández, D.L.; Vallano, D.M.; Zavaleta, E.S.; Tzankova, Z.; Pasari, J.R.; Weiss, S.; Selmants, P.C.; Morozumi, C. Nitrogen pollution is linked to US listed species declines. BioScience 2016, 66, 213–222. [Google Scholar] [CrossRef]
  24. Suarez-Bertoa, R.; Zardini, A.A.; Astorga, C. Ammonia exhaust emissions from spark ignition vehicles over the New European Driving Cycle. Atmos. Environ. 2014, 97, 43–53. [Google Scholar] [CrossRef]
  25. Livingston, C.; Rieger, P.; Winer, A. Ammonia emissions from a representative in-use fleet of light and medium-duty vehicles in the California South Coast Air Basin. Atmos. Environ. 2009, 43, 3326–3333. [Google Scholar] [CrossRef]
  26. Jo, S.; Cha, J.; Park, S. Exhaust emission characteristics of stoichiometric combustion applying to diesel particulate filter (DPF) and three-way catalytic converter (TWC). Energy 2022, 254, 124196. [Google Scholar] [CrossRef]
  27. Zhang, Q.; Xu, Z.; Li, M.; Shao, S. Combustion and emissions of a Euro VI heavy-duty natural gas engine using EGR and TWC. J. Nat. Gas Sci. Eng. 2016, 28, 660–671. [Google Scholar] [CrossRef]
  28. Liu, M.; Huang, X.; Song, Y.; Tang, J.; Cao, J.; Zhang, X.; Zhang, Q.; Wang, S.; Xu, T.; Kang, L.; et al. Ammonia emission control in China would mitigate haze pollution and nitrogen deposition, but worsen acid rain. Proc. Natl. Acad. Sci. USA 2019, 116, 7760–7765. [Google Scholar] [CrossRef]
  29. Pinder, R.W.; Adams, P.J.; Pandis, S.N. Ammonia emission controls as a cost-effective strategy for reducing atmospheric particulate matter in the eastern United States. Environ. Sci. Technol. 2007, 41, 380–386. [Google Scholar] [CrossRef]
  30. Wang, C.; Tan, J.; Harle, G.; Gong, H.; Xia, W.; Zheng, T.; Yang, D.; Ge, Y.; Zhao, Y. Ammonia Formation over Pd/ Rh Three-Way Catalysts during Lean-to-Rich Fluctuations: The Effect of the Catalyst Aging. Exhaust Temperature, Lambda, and Duration in Rich Conditions. Environ. Sci. Technol. 2019, 53, 12621–12628. [Google Scholar] [CrossRef]
  31. Liu, T.; Wang, X.; Wang, B.; Ding, X.; Deng, W.; Lu, S.; Zhang, Y. Emission rate of ammonia (NH3) from on-road vehicles in China: Tunnel tests in urban Guangzhou. Environ. Res. Lett. 2014, 9, 064027. [Google Scholar] [CrossRef]
  32. Wong, P.K.; Chadikolaei, M.A.; Chen, S.H.; Fadairo, A.A.; Ng, K.W.; Lee, S.M.Y.; Xu, J.C.; Lian, Z.D.; Li, L.; Wong, H.C.; et al. Physical, chemical, and cell toxicity properties of mature/aged particulate matter (PM) trapped in a diesel particulate filter (DPF) along with the results from freshly produced PM of a diesel engine. J. Hazard. Mater. 2022, 434, 128855. [Google Scholar] [CrossRef] [PubMed]
  33. Chang, Y.H.; Zou, Z.; Deng, C.; Huang, K.; Collett, J.L.; Lin, J.; Zhuang, G. The importance of vehicle emissions as a source of atmospheric ammonia in the megacity of Shanghai. Atmos. Chem. Phys. 2016, 16, 3577–3594. [Google Scholar] [CrossRef]
  34. Emmenegger, L.; Mohn, J.; Sigrist, M.; Marinov, D.; Steinemann, U.; Zumsteg, F.; Meier, M. Measurement of ammonia emissions using various techniques in a comparative tunnel study. Int. J. Environ. Pollut. 2004, 22, 326–341. [Google Scholar] [CrossRef]
  35. Tong, H.Y.; Hung, W.T.; Cheung, C.S. On-Road Motor Vehicle Emissions and Fuel Consumption in Urban Driving Conditions. J. Air Waste Manag. Assoc. 2000, 50, 543–554. [Google Scholar] [CrossRef] [PubMed]
  36. Park, M.; Wang, Y.; Chong, J.; Lee, H.; Jang, J.; Song, H.; Kwak, N.; Borlaza, L.J.S.; Maeng, H.; Cosep, E.M.R.; et al. Simultaneous Measurements of Chemical Compositions of Fine Particles during Winter Haze Period in Urban Sites in China and Korea. Atmosphere 2020, 11, 292. [Google Scholar] [CrossRef]
  37. Song, M.K.; Park, J.S.; Lim, Y.J.; Oh, S.H.; Lee, J.Y.; Lee, K.H.; Ro, C.U.; Bae, M.S. Long-range transport impacts from biomass burning and secondary pollutant sources based on receptor models during KORUS-AQ campaign. Atmos. Environ. 2022, 276, 119060. [Google Scholar] [CrossRef]
  38. Wang, C.; Xu, H.; Herreros, J.M.; Wang, J.; Cracknell, R. Impact of fuel and injection system on particle emissions from a GDI engine. Appl. Energy 2014, 132, 178–191. [Google Scholar] [CrossRef]
  39. Bonatesta, F.; Chiappetta, E.; La Rocca, A. Part-load particulate matter from a GDI engine and the connection with combustion characteristics. Appl. Energy 2014, 124, 366–376. [Google Scholar] [CrossRef]
  40. Durbin, T.D.; Wilson, R.D.; Norbeck, J.M.; Miller, J.W.; Huai, T.; Rhee, S.H. Estimates of the emission rates of ammonia from light-duty vehicles using standard chassis dynamometer test cycles. Atmos. Environ. 2002, 36, 1475–1482. [Google Scholar] [CrossRef]
  41. Selleri, T.; Melas, A.; Bonnel, P.; Suarez-Bertoa, R. NH3 and CO Emissions from Fifteen Euro 6d and Euro 6d-TEMP Gasoline-Fuelled Vehicles. Catalysts 2022, 12, 245. [Google Scholar] [CrossRef]
  42. Bae, W.B.; Kim, D.Y.; Hyun, S.W.; Hazlett, M.; Yoon, D.Y.; Jung, C.; Kim, C.H.; Kang, S.B. Emission of NH3 and N2O during NO reduction over commercial aged three-way catalyst (TWC): Role of individual reductants in simulated exhausts. Chem. Eng. J. Adv. 2022, 9, 100222. [Google Scholar] [CrossRef]
  43. Liu, Y.; Ge, Y.; Tan, J.; Wang, H.; Ding, Y. Research on ammonia emissions characteristics from light-duty gasoline vehicles. J. Environ. Sci. 2021, 106, 182–193. [Google Scholar] [CrossRef]
  44. Lyu, L.; Sun, W.; Feng, P.; Wang, H.; Hao, L.; Tan, J.; Wang, X.; Song, C.; Li, H.; Li, Z.; et al. NH3 and N2O emission durability of the heavy-duty diesel engine with DOC, DPF, SCR, and ASC through the accelerated aging method. Fuel 2023, 339, 126950. [Google Scholar] [CrossRef]
  45. Zhang, J.; Liggio, J.; Chan, T.W.; Huang, L.; Brook, J.R. Gasoline Direct Injection Engine Emissions of OC and EC: Laboratory Comparisons with Port Fuel Injection Engine. Aerosol Air Qual. Res. 2022, 22, 220032. [Google Scholar] [CrossRef]
Figure 1. Schematic diagram of the chassis dynamometer system.
Applsci 13 09366 g001
Figure 2. (a) Chassis dynamometer system, (b) gas analyzer, (c) filter sampler for PM and organic marker, and (d) NH3 analyzer.
Applsci 13 09366 g002
Figure 3. CO, HC, NOx, and PM emissions characteristics (mg/km) of LPG, gasoline, and diesel vehicles according to regulatory test mode conditions (gasoline; LPG: CVS-75; EURO4: NEDC; EURO6: WLTC).
Applsci 13 09366 g003
Table 1. Results of previous studies on emission rate of diesel and gasoline vehicles.
Fuel TypeVehiclePM
(mg/km)
NOx
(mg/km)
CO
(mg/km)
CO2
(g/km)
Reference
DieselEuro427.10 [9]
Euro5 DPF0.63 [9]
Light-duty 17351395 [10]
Light-duty 19071138 [10]
Light-duty98.001173980281.6[11]
Light-duty85.0011281685283.9[11]
Light-duty233.0010011208311.7[11]
Light-duty243.0039832650442.4[11]
Light-duty52.001642671377.2[11]
Light-duty315.0014801178407.8[11]
EURO5 DPF0.01–0.65209–770 [12]
EURO5 DPF0–0.32158–900 [12]
EURO4 DPF0.72–3.74244–515 [12]
EURO5 DPF0–0.18311–747 [12]
EURO5 1 212–76314–57289–172[13]
EURO5 2 162–91017–18587–169[13]
EURO4 l 233–50358–1625108–226[13]
EURO5 3 315–7463–87192–167[13]
EURO6b 201–107616–38080–140[13]
SUV2201188 [14]
Light truck13371115 [14]
Heavy truck312560209 [14]
Heavy truck18521801100 [14]
GasolineEURO32.41 [9]
EURO172.10 [9]
EURO40.04–18.3810–125 [12]
EURO52.67–29.445–214 [12]
EURO4 11–12221–954113–205[13]
EURO5 128–12832–32233[13]
EURO6b 3–1532–2791–174[13]
Sedan1.2520256 [14]
Sedan1.1084714 [14]
SUV3.28322340 [14]
Light truck0.6439.11000 [14]
LPGEURO4 353000233[15]
EURO4 31947184[15]
EURO4 921949230[15]
Table 2. Driving mode conditions using a chassis dynamometer to test vehicles.
ParametersDriving Mode
CVS-75NEDCWLTCUS06
Driving time (second)187411801800600
Driving distance (km)17.841123.2612.9
Average speed (km/h)34.133.646.377.9
Maximum speed (km/h)91.2120131.6128
Table 3. CO, HC, NOx, and PM regulation values (mg/km) for LPG, petrol, and diesel vehicles under regulatory test mode conditions.
VehicleTest ModeCOHCNOxHC + NOxPM
G1, G2CVS-751.310.0340.044-0.004
L1CVS-750.625-0.019-0.002
L2CVS-751.310.0340.044--
EURO6WLTC0.5-0.080.170.0045
D4-1NEDC0.5-0.250.30.025
D4-2NEDC0.74-0.390.460.06
Table 4. Emission Rate of CO, HC, NOx, and PM by test mode (mg/km).
CompoundModeG1G2L1L2D6-1D6-2D4-1D4-2
COCVS-75634.7204.0101.4500.5----
US062577.0576.0126.07660.4---130.0
NEDC1711.5612.6----135.0590.0
WLTC1770.5491.7--37.035.00.0125.0
HCCVS-7530.09.03.010.0----
US0621.07.01.034.04.04.02.018.0
NEDC177.045.0----17.078.0
WLTC23.02.0--8.512.04.021.0
NOxCVS-7513.010.03.05.0----
US0640.050.02.02.038.060.0430.0670.0
NEDC40.010.0----162.0316.0
WLTC50.035.0--33.436.0323.0480.0
PMCVS-751.2--0.2----
US06-2.00.40.90.4-21.433.0
NEDC------18.329.8
WLTC0.9---0.40.114.021.0
Table 5. Emission rate of NH3 by test mode (mg/km).
ModeG1G2L1L2D6-1D6--2D4-1D4-2
CVS-7561.88.74.417.8----
WLTC114.927.4--0.20.000.070.03
US06123.922.04.730.30.40.050.010.03
NEDC106.015.0--0.40.09-0.040.12
Table 6. Emission Rate of OC and EC by test mode (mg/km).
VehiclesModeOCECOC/EC
LPGUS060.040.014.0
Gasoline (G1)US06, CVS-750.100.030.3
Gasoline (G2)US06, CVS-750.020.021.2
Diesel EURO4US061.4410.380.1
Diesel EURO6US060.010.010.9
Diesel EURO6 during DPF regenerationUS060.030.040.6
Table 7. Emission Rate of Organic Molecular Markers (ng/km).
LPGGasolineGasolineDiesel
EURO4
Diesel
EURO6
Diesel (DPFre)
EURO6
CompoundsL2 + L1G1G2D4-1 + D4-2D6-1 + D6-2D6-1 + D6-2
PAHs17.301482.0990.4462,997.680.4349.28
Hopanes1.8310.444.60854.520.535.31
Cycloalkanes5.1428.3016.891208.50-47.68
n-Alkanes211.13717.99355.8885,290.67171.171177.62
Alkanoic acids1444.593836.631693.6847,426.311913.942697.11
Benzene carboxylic acids21.49111.0917.1635,419.1538.7660.52
Di-carboxylic acids193.071315.33212.127430.1672.65228.02
Table 8. Emission Rate of Organic Molecular Markers (PAHs) (ng/km).
LPGGasolineGasolineDiesel
EURO4
Diesel
EURO6
Diesel (DPFre)
EURO6
CompoundsL2 + L1G1G2D4-1 + D4-2D6-1 + D6-2D6-1 + D6-2
Phenanthrene0.52234.998.1914,826.950.2741.42
Anthracene0.2163.602.013343.98-0.45
Fluoranthene1.64420.1324.0715,904.90-2.18
Acephenanthrylene0.2663.562.723341.99--
Pyrene4.68576.8920.0218,199.490.162.85
Benzo(ghi)fluoranthene2.4530.215.181,588.51-0.44
Cyclopenta(cd)pyrene-2.83-148.72--
Benz(a)anthracene3.0914.242.00748.48-0.36
Chrysene2.3417.142.75901.46-0.35
Retene0.281.200.3563.11--
Benzo(b)fluoranthene0.708.491.57714.58--
Benzo(k)fluoranthene0.175.570.87492.06--
Benzo(j)fluoranthene0.000.820.0777.93--
Benzo(e)pyrene0.397.411.99623.55--
Benzo(a)pyrene0.274.321.23408.46--
Perylene-0.88-46.29--
Indeno(123cd)pyrene-8.113.00426.25--
Benzo(ghi)perylene0.2813.218.30694.45-1.25
Coronene0.008.495.77446.52--
Dibenzo(ae)pyrene0.000.000.34---
Table 9. Emission Rate of Organic Molecular Markers (Hopanes) (ng/km).
LPGGasolineGasolineDiesel
EURO4
Diesel
EURO6
Diesel (DPFre)
EURO6
CompoundsL2 + L1G1G2D4-1 + D4-2D6-1 + D6-2D6-1 + D6-2
17A(H)-22,29,30-Trisnorhopane0.231.210.3155.75-0.71
17A(H)-21B(H)-30-Norhopane0.534.571.32235.820.151.81
17A(H)-21B(H)-Hopane0.512.200.92140.730.381.07
22S-Homohopane0.191.550.4284.46-0.72
22R-Homohopane0.160.920.3663.98-0.51
22S-Bishomohopane--0.3549.56--
22R-Bishomohopane--0.3737.19--
22S-Trishomohopane---30.80--
22R-Trishomohopane---18.78--
AAA-20S-C27-Cholestane---29.84--
ABB-20R-C27-Cholestane---22.22--
AAA-20R-27-Cholestane---23.54--
ABB-20R-C28-Ergostane--0.138.28--
ABB-20S-C28-Ergostane--0.1111.23--
ABB-20R-C29-Sitostane0.13-0.1626.78-0.26
ABB-20S-C29-Sitostane0.07-0.1515.56-0.23
Table 10. Emission Rate of Organic Molecular Markers (Benzene carboxylic acid) (ng/km).
LPGGasolineGasolineDiesel
EURO4
Diesel
EURO6
Diesel (DPFre)
EURO6
CompoundsL2 + L1G1G2D4-1 + D4-2D6-1 + D6-2D6-1 + D6-2
Phthalic Acid12.5050.5710.201512.5020.1030.26
Isophthalic Acid2.7518.092.204959.335.5010.02
Terephthalic Acid4.1036.623.382180.726.009.50
1,2,4-Benzene carboxylic Acid---5936.00--
1,2,3-Benzene carboxylic Acid1.17--16,689.74--
1,3,5-Benzene carboxylic Acid---486.09--
1,2,4,5-Benzene carboxylic Acid---2970.78--
Methylphthalic Acid0.965.821.38683.987.1710.74
Disclaimer/Publisher’s Note: The statements, opinions and data contained in all publications are solely those of the individual author(s) and contributor(s) and not of MDPI and/or the editor(s). MDPI and/or the editor(s) disclaim responsibility for any injury to people or property resulting from any ideas, methods, instructions or products referred to in the content.

