Abstract
With the development of deep learning, convolutional neural networks (CNNs) and Transformer-based methods have become key techniques for medical image classification tasks. However, many current neural network models have problems such as high complexity, a large number of parameters, and large model sizes; such models obtain higher classification accuracy at the expense of lightweight networks. Moreover, such larger-scale models pose a great challenge for practical clinical applications. Meanwhile, Transformer and multi-layer perceptron (MLP) methods have some shortcomings in terms of local modeling capability and high model complexity, and need to be used on larger datasets to show good performance. This makes it difficult to utilize these networks in clinical medicine. Based on this, we propose a lightweight and efficient pure CNN network for medical image classification (Eff-PCNet). On the one hand, we propose a multi-branch multi-scale CNN (M2C) module, which divides the feature map into four parallel branches along the channel dimensions by a certain scale factor and carries out a deep convolution operation using different scale convolution kernels, and this multi-branch multi-scale operation effectively replaces the large kernel convolution. This multi-branch multi-scale operation effectively replaces the large kernel convolution. It reduces the computational cost of the module while fusing the feature information between different channels and thus obtains richer feature information. Finally, the four feature maps are then spliced along the channel dimensions to fuse the multi-scale and multi-dimensional feature information. On the other hand, we introduce the structural reparameterization technique and propose the structural reparameterized CNN (Rep-C) module. Specifically, it utilizes multiple linear operators to generate different feature maps during the training process and fuses all the participants into one through parameter fusion to achieve fast inference while providing a more effective solution for feature reuse. A number of experimental results show that our Eff-PCNet performs better than current methods based on CNN, Transformer, and MLP in the classification of three publicly available medical image datasets. Among them, we achieve 87.4% Acc on the HAM10000 dataset, 91.06% Acc on the SkinCancer dataset, and 97.03% Acc on the Chest-Xray dataset. Meanwhile, our approach achieves a better trade-off between the number of parameters; computation; and other performance metrics as well.
1. Introduction
With the rapid development of social productivity and the rapid progress of society, people’s living standards are gradually rising, but the number of illnesses and types of diseases are increasing, and a large number of medical images (including X-ray images, CT images, pathology image, and magnetic resonance images) provide a rich reference value for medical diagnosis by imaging physicians. Traditionally, radiologists and clinicians have performed the majority of medical image interpretation. However, their analysis is vulnerable to inter-observer variability, fatigue, and significant omission rates. As a result, clinicians are unable to consistently analyze and interpret medical data with high accuracy. However, with the development of deep learning, the use of machine learning algorithms in medicine is becoming more common. By analyzing the features of input images, abnormalities can be detected faster by machine learning algorithms in medical imaging. Computer-aided diagnosis and treatment can effectively solve the above problems, make up for the shortcomings of manual diagnosis, and relieve the work pressure experienced by doctors. However, medical images are usually characterized by a relatively limited size and a low signal-to-noise ratio. It is difficult for deep learning algorithms to locate abnormalities based on image content alone. Therefore, knowing how to correctly and quickly classify and segment medical images to help doctors identify patient foci and conduct disease diagnosis is a thorny problem in the field of medical image analysis.
In recent years, with the rapid development of high-performance computing resources, deep learning techniques have made a big splash in the field of computer vision. Since AlexNet [1] started to make its mark in the ImageNet [2] image classification competition in 2012, it set records for accuracy and low error, beating all other models by rate. Convolutional neural networks (CNN) gained the attention of all research scholars in the field. In the following decade, many scholars explored and researched deep learning theory, and various high-performance CNN models were proposed one after another. CNN became indispensable in major vision tasks and achieved a lot of success. Influenced by this, some researchers have also tried to apply CNN to medical image analysis tasks [3,4,5]. Since the convolutional operation establishes a close connection between a pixel in an image and the surrounding pixel points, this property allows CNN-based models to better extract information about local details in an image. Therefore, these methods also show good classification performance in medical image analysis tasks. However, these methods suffer from the problem of large number of parameters and computational effort. Meanwhile, since the convolutional operation itself can only extract local features, it has certain deficiencies in remote modeling capability. In response to these problems with CNN, many researchers have tried to find new solutions.
As the Transformer model [6] was proposed in the field of natural language processing (NLP) and achieved significant results in various NLP tasks, researchers have tried to apply it in the field of computer vision. Vit [7] is a pioneering work on vision Transformers that splits an image into small patches, each of which is considered as a wordor token. The success of Vit validates the feasibility of a pure Transformer architecture for computer vision tasks. The self-attention mechanism in Transformer is a key component that helps the model to capture global dependencies when processing sequential data. In computer vision, this mechanism can help the model focus on the associations between different locations when processing an image, to better understand the global structure and contextual information of the image. The development of the Transformer model in computer vision has brought new ideas and performance breakthroughs for tasks such as image classification, target detection, and image generation. Its global dependencies, semantic information modeling, and end-to-end advantages in processing images have made it widely used in computer vision and changed the design paradigm of traditional computer vision models to some extent. Since then, the improved Vit-based methods and their variants have performed well in major vision tasks and have been widely used. However, although the Transformer model has shown much potential in the field of medical images, it also has some drawbacks. Compared to CNN, it has some disadvantages in extracting localized information. This makes the Transformer model not as effective on some medical image datasets where the lesion region accounts for a relatively small amount. In addition, the Transformer model has a more complex structure and more parameters than the traditional CNN model. This is due to the secondary computation and memory overhead associated with the token length. This also results in the training and inference process requiring more time and computational resources, which may pose a significant challenge for resource-limited clinical applications.
Meanwhile, multi-layer perceptron (MLP) was revived by the proposal of the MLP-mixer [8], the first pure MLP network architecture that uses MLP instead of convolutional operations in traditional CNN and self-attention in Transformer and achieves very competitive performance in image classification tasks. The emergence of MLP-mixer provoked a new research boom, and many works in the same line of work ensued. The fact that RepMLP [9], CycleMLP [10], HireMLP [11], and other works has been proposed one after another has brought the old structure of MLP back to the stage. However, the excellent performance of MLP usually requires a large amount of training data. For medical image classification tasks with high complexity and a limited number of data, pure MLP-based models may suffer from underfitting, which may affect the performance of the model. Meanwhile, most of the current MLP-based network architectures have the problem of relatively large number of parameters and computations. These computationally expensive models are not lightweight and efficient enough and thus present great challenges in practical clinical applications.
Based on the above discussions and observations, we propose a lightweight and efficient medical image classification network (Eff-PCNet) based on pure CNN. Eff-PCNet retains the baseline [12] CNN stage; on the one hand, we propose a multi-branch multi-scale CNN (M2C) module, which utilizes multi-branch and multi-scale operation as an effective alternative to the large kernel convolution. It reduces the computational cost of the module while fusing the feature information between different channels, thus obtaining richer feature information. On the other hand, we introduce the structural reparameterization technique and propose the structural reparameterized CNN (Rep-C) module, which provides a more effective solution for feature reuse. We have conducted extensive experiments using Eff-PCNet on three publicly available medical image classification datasets, and the experimental results show that the classification performance of Eff-PCNet outperforms the currently available methods. As shown in Figure 1 and Figure 2, our Eff-PCNet achieves a better trade-off between the number of parameters and accuracy, and the amount of computation and degree of accuracy on the three publicly available datasets, respectively.
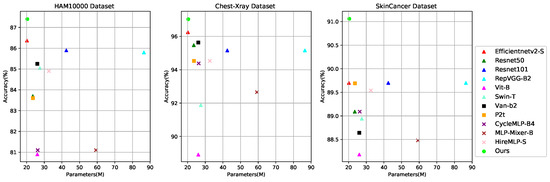
Figure 1.
Trade-offs between Acc and Params for different methods on three datasets, where our Eff-PCNet is in green.
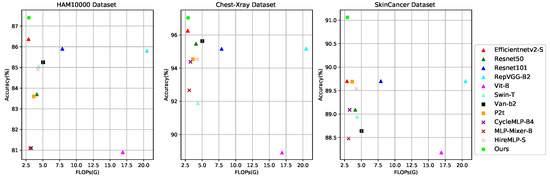
Figure 2.
Trade-offs between Acc and FLOPs for different methods on the three datasets, with our Eff-PCNet in green.
In summary, the main contributions of this paper are as follows:
1. We propose a lightweight and efficient medical image classification network (Eff-PCNet) based on pure CNN, and the experimental results show that it achieves a better trade-off between the number of parameters, the computation, and the classification performance on three publicly available medical image classification datasets.
2. We propose a multi-branch multi-scale CNN (M2C) module, which effectively replaces large kernel convolution with multi-branch multi-scale operation. It reduces the computational cost of the module while fusing the feature information between different channels, thus obtaining richer feature information.
3. We introduce the structural reparameterization technique and propose the structural reparameterized CNN (Rep-C) module, which provides a more effective solution for feature reuse.
2. Related Work
2.1. CNN-Based Methods
In recent years, with the rapid development of high-performance computing resources, deep learning techniques have made a big splash in the field of computer vision, and efficient convolutional neural networks (CNNs) have become indispensable in various fields. However the classification task is one of the most widely used tasks in different fields. Since the introduction of AlexNet [1], many scholars have been exploring and researching CNN architectures, and subsequently many excellent CNN models have been proposed one after another. ResNet [13] introduced a residual structure that allowed the “depth” of neural networks to exceed 100 layers for the first time, with the largest neural networks even exceeding 1000 layers. In 2017, DenseNet [14] introduced dense connectivity, connecting each layer to all its successor layers to simplify optimization. This was followed by Shufflenet [15] and MobileNet [16], which established benchmarks by using a large number of deep convolutions instead of dense ones. With this concept of neural architecture search (NAS), many excellent CNN models emerged, such as EfficientNet [17], MnasNet [18], AtomNAS [19], and NASNet [20], which all have good classification on ImageNet data performance. Recently, it has also been found that using deep convolution or group convolution to extract spatial features, the operator often suffers from the side effect of increased memory accesses in the process of reducing FLOPs. In order to solve this problem, FasterNet [21] proposes a simple but fast and effective operator PConv, which can extract spatial features more efficiently by simultaneously reducing redundant computations and memory accesses. All of the above are classically excellent network architectures with both elegance and performance and are landmark CNN models that are still widely used in various computational vision domains. However, compared with traditional natural image datasets, medical image datasets are usually characterized by a relatively limited size and a low signal-to-noise ratio. Therefore, it is difficult for traditional machine learning algorithms to accomplish disease classification based on image content localization anomalies alone, and many CNN-based methods have appeared in medical classification tasks. ResGANet [22] proposed a modularized group attention block to capture key features in medical images in the spatial and in channel dimensions, respectively, to improve the classification performance. The authors of [23] proposed to utilize the CXR images to detect new cases of Crown pneumonia with the COVID-NET algorithm. The authors of [24] proposed a system to detect breast cancer using histopathology images by combining CNN and hierarchical voting applications. Their goal was to accurately classify the images as benign or malignant tumors. The authors of [25] proposed a new crown pneumonia detection model using CNN and pre-trained the Alexnet algorithm.
2.2. Transformer-Based Methods
In recent years, Transformer-based methods have achieved some success in various domains because of their ability to model remote dependency and the globally receptive field. Dosovitskiy et al. proposed Vit [7] as a seminal work, and a number of excellent Transformer-based architectures have been proposed one after another. T2T-Vit [26] proposes to use overlapping segmented images to better preserve local structure. CPVT [27] proposes to replace absolute positional coding with conditional positional coding through deep convolution. Swin Transformer [28] restricts self-attention to being performed within a localized window, which reduces the computation of attention, and at the same time, the sliding window mechanism is used to make the connection between different windows, which makes Swin Transformer become the new Backbone in the field of machine vision, and it is used in a variety of machine vision applications, such as image classification, object detection, semantic segmentation, and many other machine vision tasks at the state of the art (SOTA) level. P2T [29] drastically reduces the computation of MHSA in the Transformer and provides a powerful multi-level feature representation. Biformer [30] proposes a two-layer routing attention module for the dynamic, query-aware efficient allocation of computation. Similarly, several researchers have used Transformer structures in medical image classification tasks. Pocformer [31] proposed a lightweight Transformer model for diagnosing neocoronary pneumonia. Ref. [32] used Transformer for skin cancer classification. Hosain et al. [33] describe a model that uses visual transformations and transfer learning models to assist in medical diagnostic procedures and techniques to recognize gastrointestinal diseases.
2.3. MLP-Based Methods
In recent years, the Google Vit team proposed MLP-mixer [8], which uses MLP to replace the convolution operation in traditional CNN and self-attention in Transformer. Although it achieves competitive performance, it lacks the ability of fine-grained feature extraction and requires a large number of training data, which is easy to be trained if starting from scratch. Then, -MLP [34] proposed a spatial transfer MLP architecture with a pure MLP structure without convolution and self-attention for communication between spatial locations. HireMLP [11] aggregates spatial information by hierarchically rearranging tokens. CycleMLP [10] can accept arbitrary scale size processing accepts inputs of arbitrary resolution, while improving the disadvantage of spatial global context aggregation consumes a large amount of computation and can expand the sensory field to a certain extent while maintaining computational complexity. In the same period, some other MLP-based works appeared, such as AS-MLP [35] and VIP [36]. These methods have also brought the old structure of MLP back to the stage. Moreover, to the best of our knowledge, there is no work using pure MLP for medical image classification tasks.
3. Methodology
In this chapter, we mainly introduce our proposed Eff-PCNet, which is a pure CNN and efficient medical image classification network. Firstly, we mainly introduce the overall network architecture of Eff-PCNet in Section 3.1, which mainly consists of the baseline CNN stage and our proposed multi-branch multi-scale CNN (M2C) module and re-parameterized CNN (Rep-C) module. Then, we introduce the M2C module in detail in Section 3.2 and Section 3.3, which focuses on the Rep-C module. Finally, the loss function used in our work is introduced in Section 3.4.
3.1. Overall Architecture
In recent years, network architectures such as Transformer- and MLP-based have made a big splash in the field of computer vision, and Transformer-based methods seem to have replaced CNN-based methods for many tasks. However, in medical image classification tasks, Transformer- and MLP-based methods require a large number of training data to show their effective performance, and these models are large and complex, which makes them difficult to advance in practical clinical applications. Therefore, we believe that designing an efficient and lightweight CNN model is a must. In this paper, we propose Eff-PCNet, an efficient medical image classification network based on pure CNN. It achieves better classification performance than Transformer- and MLP-based methods with fewer parameters and less computation and is able to classify dermatological and pneumonic diseases quickly and accurately. Eff-PCNet is a lightweight efficient medical image classification network, and its overall network architecture is shown in the upper side of Figure 3. It mainly consists of a stem layer and 8 CNN stages, and we keep the structure of stages 1, 2, and 3 and stages 5, 7, and 8 in the CNN stages similar to the baseline, and the number of repetitions of each stage consistent with the baseline. Stage 4 and stage 6 are our proposed M2C module and Rep-C module (because the position of our proposed module is set in the whole network architecture; we will explain the reason for this in the ablation experiment in Section 4.5).
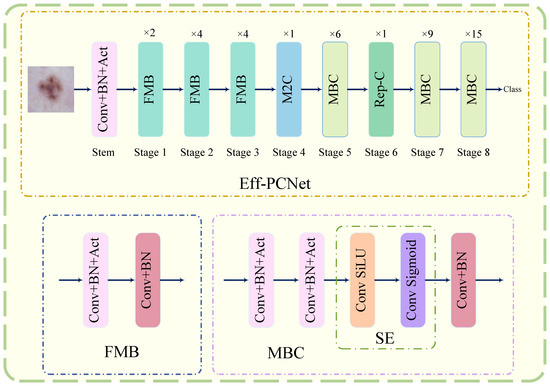
Figure 3.
Eff-PCNet overall network architecture.
When the input image enters the network, it first enters the stem layer, which consists of a 3 × 3 convolution with a stride of 2, a BN [37] layer, and a Swish [38] activation function, and the output feature map after downsampling in the stem layer is . Then, stages 1, 2, and 3 are repeated 2, 4, and 4 times, respectively, on the fused mobile inverted bottleneck (FMB) module, and the output feature map is . The structure of the FMB module is shown in the lower side of Figure 3, which mainly contains a CBA block consisting of the Conv, BN, and Act layers, and a CB block consisting of the Conv and BN layers. Its working principle can be summarized as follows:
where is denoted as regular convolution, is BatchNorm, and is the activation function.
Stage 4 is our proposed M2C module. We divide the feature map after entering M2C into four parallel branches along the channel dimension by a certain ratio factor. One of the branches is a identity mapping, and the remaining three branches utilize deep convolution at different scales to complete feature extraction; these concatenate along the channel dimensions to fuse the multi-scale and multi-dimensional feature information. The input feature map enters the M2C module after the number of channels, width and height do not change, and the final output feature map is . Stage 5 is the mobile inverted bottleneck convolution (MBC) module, whose structure is shown in the lower side of Figure 3, and it mainly consists of two CBA blocks: the SE block and the CB block. Its working principle can be summarized as follows:
where , and are the same as in Equation (1). denotes convolution, and SiLU [39] denotes activation function, convolution, and Sigmoid [40] activation function in that order.
The feature map that goes to stage 5 the output feature map after repeating the MBC module 6 times is . Stage 6 is our proposed Rep-C module. In Rep-C module, we use structural re-parameterization technique to transfer the feature reuse process from feature space to weight space, and also use residual connection instead of concatenates operator. This design makes the whole module reduce the computational cost and more efficient. The output feature map after repeating Rep-C module once is . The last two stages of the network (stage 7,8) have the same structure as stage 5, repeating the MBC module 9 and 15 times, respectively. However, the number of repetitions in each stage increases, and using a larger number of channels would seriously increase the computational and parametric counts of the model, so we did not expand the width of the model several times in the deeper layers of the network in the design of the overall network, as some classical methods do. Therefore, the final output feature map of Eff-PCNet after all CNN stages is .
3.2. M2C Module
Inspired by the long range modeling capability of Vit, large kernel convolution algorithms have been widely studied and adopted in recent years to expand the receptive field and improve the model performance, e.g., the well-known work ConvNext [41] employs a 7 × 7 depth convolution. Although this depth operator consumes only a small number of FLOPs, it greatly impairs the efficiency of the model on powerful computing devices due to the high cost of memory access. Although the use of small convolutional kernels can be effective in reducing complexity and speedup, it also significantly degrades the model performance. To address this problem, we propose the M2C module, whose specific structure is shown in Figure 4 (the feature map dimension is taken as stage 4). Inspired by inceptionnext, our M2C module divides the feature map into four parallel branches along the channel dimension by a certain ratio factor. One of the branches is an identity mapping; the remaining three branches utilize deep convolution at different scales to complete the feature extraction and are then concatenated along the channel dimensions to fuse the multi-scale and multi-dimensional feature information. In order to reduce the computational spending of the module, we choose to not perform deep convolution operations on all the channels but select some of the channels to perform deep convolution operations. Specifically, for the input feature map in the M2C module, we first divide the input channels into two parts, 24 and 40, according to the ratio factor a = 0.375. Among them, the part with 40 channels is kept unchanged and denoted as an identity mapping branch, and the rest of the parts with 24 channels are divided into three branches for deep convolution operation. In particular, for the three parallel branches where deep convolution is performed, we set the kernel functions for deep convolution as 3 × 3, 1 × K, and K × 1, respectively. After the multi-branch and multi-scale deep convolution operation, we concatenate the feature maps generated from the four different channels along the channel dimensions. This process can be formulated as follows:
where ,,, denotes the division of the input into four parallel branches along the channel dimension. C is the number of channels in the input. k denotes the small square kernel size set to 3 by default, and denotes the banded kernel size set to 11 by default. is an operation that concatenates the output of each branch.
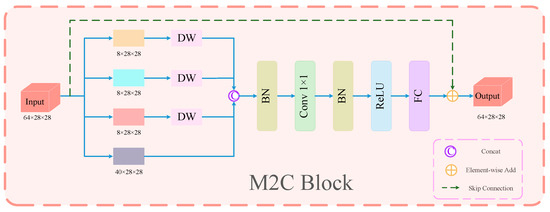
Figure 4.
Specific structure of M2C module (as an example of the feature map dimension of stage 4.
The M2C module divides the feature map into four parallel branches along the channel and utilizes convolution kernels of different scales to perform deep convolution operations, and this multi-branch multi-scale operation effectively replaces the large kernel convolution such as 7 × 7. It reduces the computational cost of the module and at the same time fuses the feature information between different channels, thus obtaining richer feature information.
3.3. Rep-C Module
Feature reuse plays a key role in lightweight convolutional neural network design. Current methods usually employ concatenates operators to maintain a large number of channels by reusing feature mappings from other layers to achieve a large network capacity. However, the computational cost of connection operations, although parameter-free and FLOPs-free, on hardware devices cannot be ignored. Refs. [42,43] shift the feature reuse process from the feature space to the weight space, thus improving the efficiency of the module. Meanwhile, we note that structural reparameterization can also be regarded as an effective implicit feature reuse technique. Therefore, in this paper we introduce the structural reparameterization technique and use it as the basis to design an efficient re-parameterized CNN (Rep-C) module to provide a more efficient solution for feature reuse, and the detailed structure of the module is shown in Figure 5. The Rep-C module implements feature reuse through the structural reparameterization technique. Specifically, multiple linear operators are utilized to generate different feature mappings during the training process, and all the participants are fused into one by parameter fusion to achieve fast inference. As shown Figure 5, our Rep-C module mainly consists of two Rep blocks; SE blocks; and skip connections, and its general structure is similar to that of the base building block in Ghost [42]. The base building block in Ghost adopts a cascading feature punch-in approach, which can be expressed as follows:
where is the concatenates operation, and denotes other neural network layers applied to X, such as Convolution or BN.
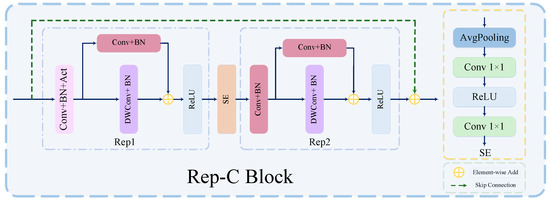
Figure 5.
Detailed structure of Rep-C module.
However, we believe that the use of concatenates is relatively inefficient to achieve feature reuse. Therefore, we introduced a structural reparameterization technique using additive operators (skip connections) instead of concatenates operators, as well as a 1 × 1 convolution and BN layer in the identity mapping branch. This brings nonlinearity to the training process, making it more flexible and effective in improving the efficiency of the model. The feature reuse for structural reparameterization can be expressed as follows:
where is the addition operation, as a feature fusion. is the same representation as in Equation (4).
In addition, during the design process of our module, we found that the use of downsample and SE blocks works better when the number of channels of the feature map decreases, while the application of deep convolution expands the network capacity when the number of channels of the feature map increases just as effectively. Therefore, we followed this principle during the design of the Rep-C module.
3.4. Loss Function
Medical image classification tasks are of critical importance for the early diagnosis of diseases and treatment decisions, and the choice of loss function is crucial for model training and performance. The cross-entropy loss function is one of the most commonly used loss functions in deep learning classification tasks, and it is widely used in classification tasks. The cross-entropy loss function is a metric used to measure the difference between two probability distributions. In the medical image classification task, we want the output probability distribution of the model to be as close as possible to the probability distribution of the real label. The cross-entropy loss function evaluates the prediction accuracy of the model by comparing the probability distribution of the real label with the probability distribution of the model output. Meanwhile, the cross-entropy loss function has good mathematical properties and its gradient calculation is relatively simple. This is conducive to updating the model parameters efficiently using the backpropagation algorithm and accelerating the training speed of the model. In addition, medical image classification tasks usually involve multiple categories, such as identifying different lesion types or tissue structures. The cross-entropy loss function performs well in multi-category classification problems, which can effectively deal with the relationship between multiple categories and drive the model to learn the features that distinguish different categories. Therefore, cross entropy loss is used as the loss function in this paper.The computational equation of CrossEntropyLoss is as follows:
where N represents the batch size, represents the true label, and is the predicted probability.
4. Experiments and Analysis
In this chapter, we demonstrate the effectiveness and generalization ability of our proposed method (Eff-PCNet) through a series of experiments. In this paper, EfficientNetV2 [12] is used as a baseline. In order to evaluate the performance of the model architecture, first we focus on the three publicly available medical datasets from different modalities that we use in Section 4.1. Then, our experimental setup and experimental environment are described in Section 4.2. Then, in Section 4.3 we introduce the evaluation metrics used in this paper. Finally, we present the comparison experiments of Eff-PCNet with other models and ablation experiments in Section 4.4 and Section 4.5 to explore the effectiveness of the Eff-PCNet method.
4.1. Datasets
(1) HAM10000 Dataset: HAM10000 [44] is a commonly used dermatologic image dataset for research in the field of machine learning and computer vision. This dataset collects a total of 10,015 dermatologic patient images for detecting pigmented skin lesions. In this paper, we randomly divide this dataset into a training set and a test set in the ratio of 8:2, where the training set is 8015 images and the validation set is 2000 images. It mainly includes seven different types of skin cancers: melanoma (MEL, 11.1%), melanocytic nevus (NV, 66.9%), basal cell carcinoma (BCC, 5.1%), actinic keratosis (AKIEC, 3.3%), benign keratoses (BKL, 11%), dermatofibromas (DF, 1.1%), and vascular lesions (VASC, 1.4%). The data distribution of the HAM10000 dataset is shown in Table 1, and the samples for each category are shown at the first column of Figure 6.

Table 1.
Distribution of lesions in the HAM10000 dataset.
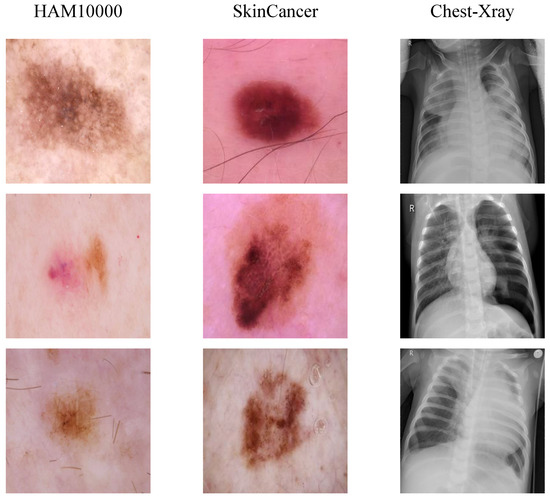
Figure 6.
Original images on the three datasets.
(2) SkinCancer Dataset: SkinCancer is a mini-dataset of the ISIC 2018 [45] challenge dataset. Due to the imbalance of samples in the categories in [45], this dataset removes dermoscopic images of diseases other than melanoma from the original data and retains only benign skin moles and malignant skin moles, the two categories with a more balanced number of samples. The dataset has a total of 3297 samples. We maintain a consistent division with [46]. The training set has a total of 2637 samples containing 1440 benign samples and 1197 malignant samples. The test set has a total of 660 samples containing 360 benign samples and 300 malignant samples. The distribution of lesions on the small-ISIC2018 dataset is shown in Table 2, and an example of maligant skin moles image is shown in the second column of Figure 6.
Table 2.
Distribution of lesions in the SkinCancer dataset.
(3) Chest-Xray Dadaset: The Chest-Xray dataset was developed by [47] published online, the chest-Xray images in the dataset were selected from pediatric patients between the ages of 1 and 5 years old at the Guangzhou Women’s and Children’s Medical Center (GWCMC), and a total of 5856 high-resolution chest-Xray images were collected. The dataset was divided into two categories, normal and pneumonia, with 1583 samples of normal images and 4273 samples of pneumonia images. We randomly selected 1341 samples of normal images and 3875 samples of pneumonia images as the training set, and 242 samples of normal images and 398 samples of pneumonia images as the test set for the experiments.The distribution of the data in the Chest-Xray dataset is shown in Table 3, and the example of pneumonia is shown in thethird column of Figure 6.
Table 3.
Distribution of lesions in the Chest-Xray dataset.
4.2. Implementation Details
For all of the experiments in this article, the image resolution path size of the input model was set to 224 × 224 by default, the batch size was set to 32, and the model was trained for 300 epochs by default, when not otherwise specified. For image preprocessing, we used the most common data enhancement methods, such as random clipping, normalization, and level flipping. In addition, we trained our model with the Adaw [48] optimizer with an initial learning rate set to 0.0001 and then used cosine annealing to adjust the learning rate, where was set to 10. To ensure the fairness of the experiments, the same operating environment and hyperparameters were shared, and the same training, validation, and test sets were used. Finally, all the experiments in this paper are trained and tested on the NVIDIA Telsa T4.
4.3. Evaluation Indicators
For the medical image classification direction, when the number of samples of the categories in the dataset is not balanced, a single evaluation metric does not reflect the performance of the model very comprehensively, so in this paper we use four metrics—accuracy (Acc), precision, recall, and F1 Score—to measure the performance of the proposed model. All these evaluations are calculated based on the confusion matrix. The definitions of the symbols in the confusion matrix are as follows: true-positive example (), true-negative example (), false-positive example (), and false-negative example ().
The equation for accuracy () is as is shown as follows:
The equation for precision is as is shown as follows:
The equation for recall is as is shown as follows:
The equation for F1 Score is as is shown as follows:
In addition, we use the area under the receiver ROC curve () as an evaluation metric to assess the classification performance of different models, and the is calculated as follows:
where M is the number of positive samples, N is the number of negative samples and is the model’s ranking of the samplei ranking of the predicted probability.
4.4. Experiments and Analysis
In this section, we compare our Eff-PCNet with some classical and new methods in three datasets: HAM10000, SkinCancer, and Chers-Xray. The models involved in our analysis mainly include ResNet [13], Regnet [49], RepVGG [50], FasterNet [21], Vit [7], Swin Transformer [28], Cswin [51], P2T [29], VAN [52], MLP-mixer [8], HireMLP [11], CycleMLP [10], SCNet [53], NextVit [54], and ConvMLP [55]. In the following, we will present the results of the experiments on each of the three datasets.
4.4.1. Results of Comparison Experiments on the HAM10000 Dataset
Table 4 shows the experimental comparison results of Eff-PCNet with some models in HAM10000. We evaluate it with other models in terms of five metrics: Acc, precision, recall, F1, and Auc. At the same time, we also compare the number of parameters and the FLOPs of the models. From the table, we can see that Eff-PCNet has a significant advantage over other competing methods. Eff-PCNet achieves an Acc of 0.874, an F1 of 0.7744, precision of 0.7845, recall of 0.7669, and an Auc of 0.8664. In CNN-based methods such as compared to the classical Resnet50, Eff-PCNet improves Acc by 3.7 percentage points, F1 by 6.31 percentage points, and precision by 10.08 percentage points. Meanwhile, compared with the SOTA FasterNet network, Eff-PCNet improves Acc by 2.75 percentage points, and Auc by 2.87 percentage points, and F1 by 4.86 percentage points. For the Transformer-based method, our Eff-PCNet improves all three metrics: F1, precision, and recall, by more than ten percentage points compared to Vit-B-16. Compared with the MLP-based method, Eff-PCNet exceeds CycleMLP-B4 by 6.3 percentage points in Acc; 6.71 percentage points in Auc; and more than ten percentage points in the remaining three metrics of F1, precision, and recall. In addition, Eff-PCNet improves all three metrics—F1, precision, and recall—by more than nine percentage points over P2T compared to the hybrid model-based model. From the table, it can be seen that our Eff-PCNet maintains high performance, while the number of parameters and FLOPs still maintains a better advantage, which also shows that our method achieves a better trade-off between performance and the number of parameters and computation compared to other methods.
Table 4.
Results of comparison experiments on the HAM10000 dataset.
In addition, Figure 7 shows the Grad-CAM [56] visualization results of some comparison models on the HAM10000 dataset, where column h is the visualization result of our model. From the figure, we can clearly see that our model can better localize the lesion region in the image compared to other models. This further illustrates the better classification performance of our model compared to other models. Finally, we show the confusion matrix of our method on the HAM10000 dataset on the left side of Figure 8, showing the classification of each category separately.
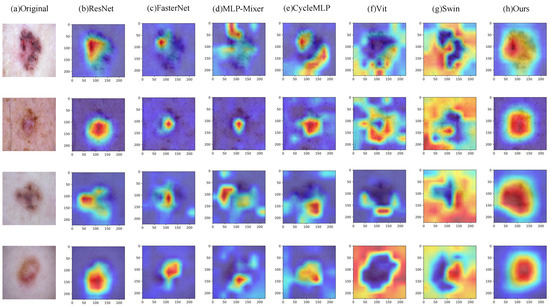
Figure 7.
Grad-CAM visualization results on the HAM10000 dataset.
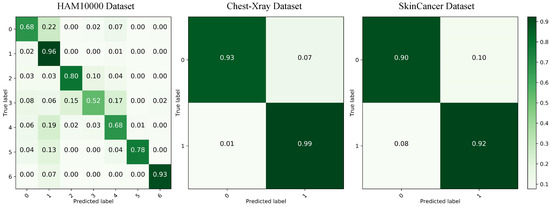
Figure 8.
Results of confusion matrices on three datasets.
4.4.2. Results of Comparison Experiments on the SkinCancer Dataset
Table 5 shows the experimental results of Eff-PCNet and some models on the SkinCancer dataset. As can be seen from the table, Eff-PCNet achieves 0.9106 for Acc, 0.9102 for F1, 0.9094 for precision, 0.9117 for recall, and 0.9117 for Auc. Compared with Efficiencynetv2, Eff-PCNet improves Acc by 1.36 percentage points, F1 by 1.4 percentage points, precision by 1.36 percentage points, recall by 1.5 percentage points, and in Auc by 1.5 percentage points. In addition, Eff-PCNet improves to some extent on all five evaluation metrics compared to other CNN-, Transformer-, MLP-, and hybrid model-basedmethods and achieves the highest results among all of the compared methods. This also fully proves the effectiveness and innovation of our proposed method. Figure 9 shows the Grad-CAM visualization of benign samples in the SkinCancer dataset on different methods. By comparing the visualization results of different columns, we notice that the CNN-based method is able to focus on the lesion area better; the MLP-based network just focuses on the vicinity of the lesion area, and the localization shows some deviation. The comparison shows that our Eff-PCNet accurately localizes to the lesion region. The right side of Figure 8 shows the confusion matrix of our method on the SkinCancer dataset, and from the confusion matrix visualization, we can observe that our Eff-PCNet classifies the two categories in the dataset in approximately the same way.
Table 5.
Results of comparison experiments on the SkinCancer dataset.
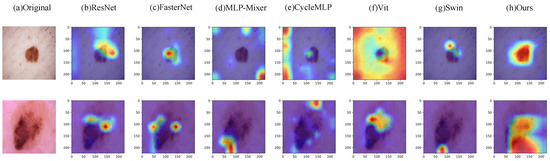
Figure 9.
Grad-CAM visualization results on the SkinCancer dataset.
4.4.3. Results of Comparison Experiments on the Chest-Xray Dataset
To further verify that Eff-PCNet has better generalization ability, we conducted experimental validation on the Chest-Xray dataset. Table 6 shows the experimental results of all comparison models on the Chest-Xray dataset. From the table, we can see that the Acc of Eff-PCNet reaches 0.9703, the F1 reaches 0.9766, the precision reaches 0.9588, the recall reaches 0.9950, and the Auc reaches 0.9624. As with the two datasets above, we similarly compare Eff-PCNet with a number of classical, newer methods. On the Chest-Xray dataset, our Eff-PCNert achieves the highest metrics on Acc, F1, and AUC, and precision and recall rank second among all models. Considering the five evaluation metrics, and the number of parameters and FLOPs, our Eff-PCNet still has a clear advantage over other methods. Our method has fewer parameters and computation while achieving high performance. Meanwhile, this lightweight and efficient medical image classification network has a good advantage in practical clinical applications. In addition, Figure 10 demonstrates the Grad-CAM visualization results of different methods on the Chest-Xray dataset, from which we can see that our model is able to localize the chest lesion region better. The middle of Figure 8 demonstrates the confusion matrix visualization of our method on the Chest-Xray dataset, from which it can be observed that Eff-PCNet is better able to correctly classify the category 1.
Table 6.
Results of comparison experiments on the Chest-Xray dataset.
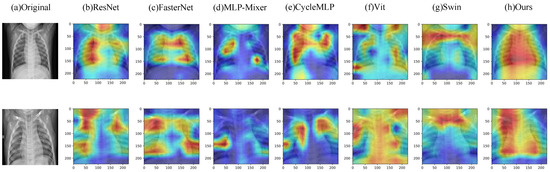
Figure 10.
Grad-CAM visualization results on the Chest-Xray dataset.
4.5. Ablation Experiments
In this section, we conduct two ablation studies on the two modules proposed in this paper, M2C and Rep-C, on three datasets. First, we analyze the effects of the individual M2C and Rep-C modules on the model classification performance, respectively. Then, in order to investigate the effect of the change of position of the M2C and Rep-C modules in Eff-PCNet on the model performance, we similarly conducted an ablation study.
Individual contribution of each module: In order to verify the impact of individual M2C and Rep-C modules on the model classification performance, we conducted an ablation study. In this ablation study, we always used the CNN stage in the baseline. The results of the ablation experiments on the three datasets—HAM10000, SkinCancer and Chest-Xray—are shown in Table 7. From the table, we can see that the use of M2C and Rep-C modules alone compared to the baseline has different degrees of improvement on all three datasets, which further proves the effectiveness of our proposed module. Overall, it seems that the Rep-C module alone contributes more than the M2C module on all three datasets.
Table 7.
Ablation experiments for each module, where ‘✘’ means that the module was not added and ‘✔’ means that it was added.
Variation of M2C module and Eff-rep module positions: In this part, we explore the effect of variation of the M2C module and Rep-C module positions in Eff-PCNet on the model performance. The results of the M2C module and the Rep-C module on the three datasets at different locations of Eff-PCNet are shown in Table 8. In the table, we only list the experimental results for the main locations, where 0 means that the M2C module or Rep-C module is in the same location as the corresponding module in our Eff-PCNet (stage 4 for the M2C module, and stage 6 for the Rep-C module), 3 means that the M2C module or Rep-C module is in the location of stage 3, and 7 means that the M2C module or Rep-C module is stage 7. By comparing the results of the ablation experiments with the M2C and Rep-C modules in different positions, we can see that the combination of the positions of the M2C and Rep-C modules in any way has mixed results on the three datasets, with some combinations having a small enhancement with respect to the baseline and some combinations having a decrease instead. Overall, the highest classification metrics were achieved on all three datasets when setting the M2C module to stage 4 and the Rep-C module to stage 6. Therefore, we adopt this combination as the design rule for the Eff-PCNet architecture.
Table 8.
Variation of module positions for ablation experiments: 0 means that the M2C module or Rep-C module is in the same location as the corresponding module in our Eff-PCNet (stage 4 for the M2C module, and stage 6 for the Rep-C module), 3 means that the M2C module or Rep-C module is in the location of stage3, and 7 means that the M2C module or Rep-C module is stage 7.
5. Conclusions
In this paper, we propose a lightweight and efficient medical image classification network (Eff-PCNet) based on pure CNN. On the one hand, we propose a multi-branch multi-scale CNN (M2C) module, which utilizes the multi-branch multi-scale operation to effectively replace the large kernel convolution. It reduces the computational cost of the module while fusing the feature information between different channels, thus obtaining richer feature information. On the other hand, we introduce the structural re-parameterization technique and propose the structural reparameterized CNN (Rep-C) module, which provides a more effective solution for feature reuse. Numerous experimental results show that our Eff-PCNet is better than the current methods based on CNN, Transformer, and MLP in the classification performance of three publicly available medical image datasets, namely, HAM10000, SkinCancer, and Chest-Xray. At the same time, our method achieves a better trade-off between the number of parameters, the computational effort, and the performance. Although our method has achieved relatively good results so far, the classification performance on a dataset like HAM10000, which has extremely unbalanced categories, is still not up to the level of real clinical applications. At the same time, for clinical applications, our method is still lacking in lightweight. In addition, our work is currently only in the practice stage, and we do not have a large number of medical image datasets to validate our experimental results. In our future work, we will continue to optimize the model mainly in these three directions.
Author Contributions
W.Y.: writing—original draft, software, and conceptualization. S.L.: validation, writing—review and editing, and formal analysis. Y.L.: supervision, funding acquisition, and writing—review and editing. All authors have read and agreed to the published version of the manuscript.
Funding
This research was funded by the Xinjiang Uygur Autonomous Region Tianshan Talent Training Program Project under grant 2022TSYCLJ0036, the National Science Foundation of China under grant U1903213, the Scientific and Technological Innovation 2030 major project under grant 2022ZD0115800.
Institutional Review Board Statement
Not applicable.
Informed Consent Statement
Not applicable.
Data Availability Statement
Publicly available datasets were analyzed in this study. These data can be found here: [https://www.kaggle.com/datasets/kmader/skin-cancer-mnist-ham10000], [https://www.cvmart.net/dataSets/detail/729?channel_id=op10] and [https://www.kaggle.com/datasets/paultimothymooney/chest-xray-pneumonia) (all accessed on 18 December 2022).
Conflicts of Interest
The authors declare no conflict of interest.
References
- Krizhevsky, A.; Sutskever, I.; Hinton, G.E. ImageNet Classification with Deep Convolutional Neural Networks. In Proceedings of the Advances in Neural Information Processing Systems 25: Proceedings of the 26th Annual Conference on Neural Information Processing Systems 2012, Lake Tahoe, NV, USA, 3–6 December 2012; pp. 1106–1114. [Google Scholar]
- Deng, J.; Dong, W.; Socher, R.; Li, L.; Li, K.; Fei-Fei, L. ImageNet: A large-scale hierarchical image database. In Proceedings of the 2009 IEEE Computer Society Conference on Computer Vision and Pattern Recognition (CVPR 2009), Miami, FL, USA, 20–25 June 2009; pp. 248–255. [Google Scholar] [CrossRef]
- Liu, S.; Liu, S.; Cai, W.; Pujol, S.; Kikinis, R.; Feng, D. Early diagnosis of Alzheimer’s disease with deep learning. In Proceedings of the IEEE 11th International Symposium on Biomedical Imaging, ISBI 2014, Beijing, China, 29 April–2 May 2014; pp. 1015–1018. [Google Scholar] [CrossRef]
- Tang, Y.; Tang, Y.; Zhu, Y.; Xiao, J.; Summers, R.M. E2Net: An Edge Enhanced Network for Accurate Liver and Tumor Segmentation on CT Scans. In Proceedings of the Medical Image Computing and Computer Assisted Intervention—MICCAI 2020—23th International Conference, Lima, Peru, 4–8 October 2020; Martel, A.L., Abolmaesumi, P., Stoyanov, D., Mateus, D., Zuluaga, M.A., Zhou, S.K., Racoceanu, D., Joskowicz, L., Eds.; Proceedings, Part IV; Lecture Notes in Computer Science. Springer: Berlin/Heidelberg, Germany, 2020; Volume 12264, pp. 512–522. [Google Scholar] [CrossRef]
- Kim, E.; Kim, S.; Seo, M.; Yoon, S. XProtoNet: Diagnosis in Chest Radiography with Global and Local Explanations. In Proceedings of the IEEE Conference on Computer Vision and Pattern Recognition, CVPR 2021, Virtual, 19–25 June 2021; pp. 15719–15728. [Google Scholar] [CrossRef]
- Vaswani, A.; Shazeer, N.; Parmar, N.; Uszkoreit, J.; Jones, L.; Gomez, A.N.; Kaiser, L.; Polosukhin, I. Attention is All you Need. In Proceedings of the Advances in Neural Information Processing Systems 30: Annual Conference on Neural Information Processing Systems 2017, Long Beach, CA, USA, 4–9 December 2017; pp. 5998–6008. [Google Scholar]
- Dosovitskiy, A.; Beyer, L.; Kolesnikov, A.; Weissenborn, D.; Zhai, X.; Unterthiner, T.; Dehghani, M.; Minderer, M.; Heigold, G.; Gelly, S.; et al. An Image is Worth 16x16 Words: Transformers for Image Recognition at Scale. In Proceedings of the 9th International Conference on Learning Representations, ICLR 2021, Virtual Event, Austria, 3–7 May 2021. [Google Scholar]
- Tolstikhin, I.O.; Houlsby, N.; Kolesnikov, A.; Beyer, L.; Zhai, X.; Unterthiner, T.; Yung, J.; Steiner, A.; Keysers, D.; Uszkoreit, J.; et al. MLP-Mixer: An all-MLP Architecture for Vision. In Proceedings of the Advances in Neural Information Processing Systems 34: Annual Conference on Neural Information Processing Systems 2021, NeurIPS 2021, Virtual, 6–14 December 2021; pp. 24261–24272. [Google Scholar]
- Ding, X.; Chen, H.; Zhang, X.; Han, J.; Ding, G. RepMLPNet: Hierarchical Vision MLP with Re-parameterized Locality. In Proceedings of the IEEE/CVF Conference on Computer Vision and Pattern Recognition, CVPR 2022, New Orleans, LA, USA, 18–24 June 2022; pp. 568–577. [Google Scholar] [CrossRef]
- Chen, S.; Xie, E.; Ge, C.; Chen, R.; Liang, D.; Luo, P. CycleMLP: A MLP-like Architecture for Dense Prediction. In Proceedings of the Tenth International Conference on Learning Representations, ICLR 2022, Virtual Event, 25–29 April 2022. [Google Scholar]
- Guo, J.; Tang, Y.; Han, K.; Chen, X.; Wu, H.; Xu, C.; Xu, C.; Wang, Y. Hire-MLP: Vision MLP via Hierarchical Rearrangement. In Proceedings of the IEEE/CVF Conference on Computer Vision and Pattern Recognition, CVPR 2022, New Orleans, LA, USA, 18–24 June 2022; pp. 816–826. [Google Scholar] [CrossRef]
- Tan, M.; Le, Q.V. EfficientNetV2: Smaller Models and Faster Training. In Proceedings of the 38th International Conference on Machine Learning, ICML 2021, Virtual Event, 18–24 July 2021; Volume 139, pp. 10096–10106. [Google Scholar]
- He, K.; Zhang, X.; Ren, S.; Sun, J. Deep Residual Learning for Image Recognition. In Proceedings of the 2016 IEEE Conference on Computer Vision and Pattern Recognition, CVPR 2016, Las Vegas, NV, USA, 27–30 June 2016; pp. 770–778. [Google Scholar] [CrossRef]
- Huang, G.; Liu, Z.; van der Maaten, L.; Weinberger, K.Q. Densely Connected Convolutional Networks. In Proceedings of the 2017 IEEE Conference on Computer Vision and Pattern Recognition, CVPR 2017, Honolulu, HI, USA, 21–26 July 2017; pp. 2261–2269. [Google Scholar] [CrossRef]
- Zhang, X.; Zhou, X.; Lin, M.; Sun, J. ShuffleNet: An Extremely Efficient Convolutional Neural Network for Mobile Devices. In Proceedings of the 2018 IEEE Conference on Computer Vision and Pattern Recognition, CVPR 2018, Salt Lake City, UT, USA, 18–22 June 2018; pp. 6848–6856. [Google Scholar] [CrossRef]
- Howard, A.G.; Zhu, M.; Chen, B.; Kalenichenko, D.; Wang, W.; Weyand, T.; Andreetto, M.; Adam, H. MobileNets: Efficient Convolutional Neural Networks for Mobile Vision Applications. arXiv 2017, arXiv:1704.04861. [Google Scholar]
- Tan, M.; Le, Q.V. EfficientNet: Rethinking Model Scaling for Convolutional Neural Networks. In Proceedings of the 36th International Conference on Machine Learning, ICML 2019, Long Beach, CA, USAm 9–15 June 2019; Volume 97, pp. 6105–6114. [Google Scholar]
- Tan, M.; Chen, B.; Pang, R.; Vasudevan, V.; Sandler, M.; Howard, A.; Le, Q.V. MnasNet: Platform-Aware Neural Architecture Search for Mobile. In Proceedings of the IEEE Conference on Computer Vision and Pattern Recognition, CVPR 2019, Long Beach, CA, USA, 16–20 June 2019; pp. 2820–2828. [Google Scholar] [CrossRef]
- Mei, J.; Li, Y.; Lian, X.; Jin, X.; Yang, L.; Yuille, A.L.; Yang, J. AtomNAS: Fine-Grained End-to-End Neural Architecture Search. In Proceedings of the 8th International Conference on Learning Representations, ICLR 2020, Addis Ababa, Ethiopia, 26–30 April 2020. [Google Scholar]
- Zoph, B.; Vasudevan, V.; Shlens, J.; Le, Q.V. Learning Transferable Architectures for Scalable Image Recognition. In Proceedings of the 2018 IEEE Conference on Computer Vision and Pattern Recognition, CVPR 2018, Salt Lake City, UT, USA, 18–22 June 2018; pp. 8697–8710. [Google Scholar] [CrossRef]
- Chen, J.; Kao, S.h.; He, H.; Zhuo, W.; Wen, S.; Lee, C.H.; Chan, S.H.G. Run, Don’t Walk: Chasing Higher FLOPS for Faster Neural Networks. In Proceedings of the IEEE/CVF Conference on Computer Vision and Pattern Recognition, CVPR2023, Vancouver, BC, Canada, 18–22 June 2023; pp. 12021–12031. [Google Scholar]
- Cheng, J.; Tian, S.; Yu, L.; Gao, C.; Kang, X.; Ma, X.; Wu, W.; Liu, S.; Lu, H. ResGANet: Residual group attention network for medical image classification and segmentation. Med. Image Anal. 2022, 76, 102313. [Google Scholar] [CrossRef] [PubMed]
- Wang, L.; Lin, Z.Q.; Wong, A. Covid-net: A tailored deep convolutional neural network design for detection of covid-19 cases from chest x-ray images. Sci. Rep. 2020, 10, 19549. [Google Scholar] [CrossRef] [PubMed]
- Senan, E.M.; Alsaade, F.W.; Al-Mashhadani, M.I.A.; Theyazn, H.; Al-Adhaileh, M.H. Classification of histopathological images for early detection of breast cancer using deep learning. J. Appl. Sci. Eng. 2021, 24, 323–329. [Google Scholar]
- Saha, P.; Sadi, M.S.; Islam, M.M. EMCNet: Automated COVID-19 diagnosis from X-ray images using convolutional neural network and ensemble of machine learning classifiers. Inform. Med. Unlocked 2021, 22, 100505. [Google Scholar] [CrossRef] [PubMed]
- Yuan, L.; Chen, Y.; Wang, T.; Yu, W.; Shi, Y.; Jiang, Z.; Tay, F.E.H.; Feng, J.; Yan, S. Tokens-to-Token ViT: Training Vision Transformers from Scratch on ImageNet. In Proceedings of the 2021 IEEE/CVF International Conference on Computer Vision, ICCV 2021, Montreal, QC, Canada, 10–17 October 2021; pp. 538–547. [Google Scholar] [CrossRef]
- Chu, X.; Tian, Z.; Zhang, B.; Wang, X.; Shen, C. Conditional Positional Encodings for Vision Transformers. In Proceedings of the Eleventh International Conference on Learning Representations, ICLR 2023, Kigali, Rwanda, 1–5 May 2023. [Google Scholar]
- Liu, Z.; Lin, Y.; Cao, Y.; Hu, H.; Wei, Y.; Zhang, Z.; Lin, S.; Guo, B. Swin Transformer: Hierarchical Vision Transformer using Shifted Windows. In Proceedings of the 2021 IEEE/CVF International Conference on Computer Vision, ICCV 2021, Montreal, QC, Canada, 10–17 October 2021; pp. 9992–10002. [Google Scholar] [CrossRef]
- Wu, Y.; Liu, Y.; Zhan, X.; Cheng, M. P2T: Pyramid Pooling Transformer for Scene Understanding. arXiv 2021, arXiv:2106.12011. [Google Scholar] [CrossRef] [PubMed]
- Zhu, L.; Wang, X.; Ke, Z.; Zhang, W.; Lau, R.W. BiFormer: Vision Transformer with Bi-Level Routing Attention. In Proceedings of the IEEE/CVF Conference on Computer Vision and Pattern Recognition, CVPR2023, Vancouver, BC, Canada, 18–22 June 2023; pp. 10323–10333. [Google Scholar]
- Perera, S.; Adhikari, S.; Yilmaz, A. Pocformer: A Lightweight Transformer Architecture For Detection of Covid-19 Using Point of Care Ultrasound. In Proceedings of the 2021 IEEE International Conference on Image Processing, ICIP 2021, Anchorage, AK, USA, 19–22 September 2021; pp. 195–199. [Google Scholar] [CrossRef]
- Aladhadh, S.; Alsanea, M.; Aloraini, M.; Khan, T.; Habib, S.; Islam, M. An Effective Skin Cancer Classification Mechanism via Medical Vision Transformer. Sensors 2022, 22, 4008. [Google Scholar] [CrossRef] [PubMed]
- Hosain, A.K.M.S.; Islam, M.; Mehedi, M.H.K.; Kabir, I.E.; Khan, Z.T. Gastrointestinal Disorder Detection with a Transformer Based Approach. arXiv 2022, arXiv:2210.03168. [Google Scholar]
- Yu, T.; Li, X.; Cai, Y.; Sun, M.; Li, P. S2-MLP: Spatial-Shift MLP Architecture for Vision. In Proceedings of the IEEE/CVF Winter Conference on Applications of Computer Vision, WACV 2022, Waikoloa, HI, USA, 3–8 January 2022; pp. 3615–3624. [Google Scholar] [CrossRef]
- Lian, D.; Yu, Z.; Sun, X.; Gao, S. AS-MLP: An Axial Shifted MLP Architecture for Vision. In Proceedings of the The Tenth International Conference on Learning Representations, ICLR 2022, Virtual Event, 25–29 April 2022. [Google Scholar]
- Hou, Q.; Jiang, Z.; Yuan, L.; Cheng, M.; Yan, S.; Feng, J. Vision Permutator: A Permutable MLP-Like Architecture for Visual Recognition. IEEE Trans. Pattern Anal. Mach. Intell. 2023, 45, 1328–1334. [Google Scholar] [CrossRef] [PubMed]
- Ioffe, S.; Szegedy, C. Batch Normalization: Accelerating Deep Network Training by Reducing Internal Covariate Shift. In Proceedings of the 32nd International Conference on Machine Learning, ICML 2015, Lille, France, 6–11 July 2015; Volume 37, pp. 448–456. [Google Scholar]
- Ramachandran, P.; Zoph, B.; Le, Q. Swish: A self-gated activation function. arXiv 2017, arXiv:1710.05941. [Google Scholar]
- Elfwing, S.; Uchibe, E.; Doya, K. Sigmoid-weighted linear units for neural network function approximation in reinforcement learning. Neural Netw. 2018, 107, 3–11. [Google Scholar] [CrossRef] [PubMed]
- Glorot, X.; Bordes, A.; Bengio, Y. Deep Sparse Rectifier Neural Networks. In Proceedings of the Fourteenth International Conference on Artificial Intelligence and Statistics, AISTATS 2011, Fort Lauderdale, FL, USA, 11–13 April 2011; Volume 15, pp. 315–323. [Google Scholar]
- Liu, Z.; Mao, H.; Wu, C.; Feichtenhofer, C.; Darrell, T.; Xie, S. A ConvNet for the 2020s. In Proceedings of the IEEE/CVF Conference on Computer Vision and Pattern Recognition, CVPR 2022, New Orleans, LA, USA, 18–24 June 2022; pp. 11966–11976. [Google Scholar] [CrossRef]
- Han, K.; Wang, Y.; Tian, Q.; Guo, J.; Xu, C.; Xu, C. GhostNet: More Features From Cheap Operations. In Proceedings of the 2020 IEEE/CVF Conference on Computer Vision and Pattern Recognition, CVPR 2020, Seattle, WA, USA, 13–19 June 2020; pp. 1577–1586. [Google Scholar] [CrossRef]
- Huang, G.; Liu, S.; van der Maaten, L.; Weinberger, K.Q. CondenseNet: An Efficient DenseNet Using Learned Group Convolutions. In Proceedings of the 2018 IEEE Conference on Computer Vision and Pattern Recognition, CVPR 2018, Salt Lake City, UT, USA, 18–22 June 2018; pp. 2752–2761. [Google Scholar] [CrossRef]
- Tschandl, P.; Rosendahl, C.; Kittler, H. The HAM10000 dataset, a large collection of multi-source dermatoscopic images of common pigmented skin lesions. Sci. Data 2018, 5, 180161. [Google Scholar] [CrossRef] [PubMed]
- Codella, N.; Rotemberg, V.; Tschandl, P.; Celebi, M.E.; Dusza, S.; Gutman, D.; Helba, B.; Kalloo, A.; Liopyris, K.; Marchetti, M.; et al. Skin lesion analysis toward melanoma detection 2018: A challenge hosted by the international skin imaging collaboration (isic). arXiv 2019, arXiv:1902.03368. [Google Scholar]
- Alfi, I.A.; Rahman, M.M.; Shorfuzzaman, M.; Nazir, A. A non-invasive interpretable diagnosis of melanoma skin cancer using deep Learning and ensemble stacking of machine learning models. Diagnostics 2022, 12, 726. [Google Scholar] [CrossRef] [PubMed]
- Kermany, D.S.; Goldbaum, M.; Cai, W.; Valentim, C.C.; Liang, H.; Baxter, S.L.; McKeown, A.; Yang, G.; Wu, X.; Yan, F.; et al. Identifying medical diagnoses and treatable diseases by image-based deep learning. Cell 2018, 172, 1122–1131. [Google Scholar] [CrossRef] [PubMed]
- Loshchilov, I.; Hutter, F. Decoupled Weight Decay Regularization. In Proceedings of the 7th International Conference on Learning Representations, ICLR 2019, New Orleans, LA, USA, 6–9 May 2019. [Google Scholar]
- Radosavovic, I.; Kosaraju, R.P.; Girshick, R.B.; He, K.; Dollár, P. Designing Network Design Spaces. In Proceedings of the 2020 IEEE/CVF Conference on Computer Vision and Pattern Recognition, CVPR 2020, Seattle, WA, USA, 13–19 June 2020; pp. 10425–10433. [Google Scholar] [CrossRef]
- Ding, X.; Zhang, X.; Ma, N.; Han, J.; Ding, G.; Sun, J. RepVGG: Making VGG-Style ConvNets Great Again. In Proceedings of the IEEE Conference on Computer Vision and Pattern Recognition, CVPR 2021, Virtual, 19–25 June 2021; pp. 13733–13742. [Google Scholar] [CrossRef]
- Dong, X.; Bao, J.; Chen, D.; Zhang, W.; Yu, N.; Yuan, L.; Chen, D.; Guo, B. CSWin Transformer: A General Vision Transformer Backbone with Cross-Shaped Windows. In Proceedings of the IEEE/CVF Conference on Computer Vision and Pattern Recognition, CVPR 2022, New Orleans, LA, USA, 18–24 June 2022; pp. 12114–12124. [Google Scholar] [CrossRef]
- Guo, M.; Lu, C.; Liu, Z.; Cheng, M.; Hu, S. Visual Attention Network. arXiv 2022, arXiv:2202.09741. [Google Scholar] [CrossRef]
- Zhang, R.; Wang, L.; Cheng, S.; Song, S. MLP-based classification of COVID-19 and skin diseases. Expert Syst. Appl. 2023, 228, 120389. [Google Scholar] [CrossRef] [PubMed]
- Li, J.; Xia, X.; Li, W.; Li, H.; Wang, X.; Xiao, X.; Wang, R.; Zheng, M.; Pan, X. Next-ViT: Next Generation Vision Transformer for Efficient Deployment in Realistic Industrial Scenarios. arXiv 2022, arXiv:2207.05501. [Google Scholar]
- Li, J.; Hassani, A.; Walton, S.; Shi, H. ConvMLP: Hierarchical Convolutional MLPs for Vision. arXiv 2021, arXiv:2109.04454. [Google Scholar]
- Selvaraju, R.R.; Cogswell, M.; Das, A.; Vedantam, R.; Parikh, D.; Batra, D. Grad-CAM: Visual Explanations from Deep Networks via Gradient-Based Localization. In Proceedings of the IEEE International Conference on Computer Vision, ICCV 2017, Venice, Italy, 22–29 October 2017; pp. 618–626. [Google Scholar] [CrossRef]
Disclaimer/Publisher’s Note: The statements, opinions and data contained in all publications are solely those of the individual author(s) and contributor(s) and not of MDPI and/or the editor(s). MDPI and/or the editor(s) disclaim responsibility for any injury to people or property resulting from any ideas, methods, instructions or products referred to in the content. |
© 2023 by the authors. Licensee MDPI, Basel, Switzerland. This article is an open access article distributed under the terms and conditions of the Creative Commons Attribution (CC BY) license (https://creativecommons.org/licenses/by/4.0/).