Article

Design of a Miniaturized Electron Cyclotron Resonance Ion Source for High-Voltage Proton Accelerator

1
School of Communication and Information Engineering, Shanghai University, Shanghai 200444, China
2
Shanghai Institute of Applied Physics, Chinese Academy of Sciences, Shanghai 201800, China
3
School of Physical Science and Technology, ShanghaiTech University, Shanghai 201210, China
*
Author to whom correspondence should be addressed.
Appl. Sci. 2023, 13(15), 8831; https://doi.org/10.3390/app13158831
Submission received: 16 June 2023 / Revised: 24 July 2023 / Accepted: 28 July 2023 / Published: 31 July 2023

Abstract

:

Featured Application

We provide a microwave system design that is much smaller than the conventional design, and provide a method for judging whether the size of the discharge chamber is better under the condition of a limited permanent magnetic ring. This is of reference value for workers with similar design requirements.

Abstract

The Electron Cyclotron Resonance (ECR) ion source fulfills high-current, high-efficiency, and compactness requirements for high-voltage proton accelerators. It is a cathode-free source that uses microwaves to heat a magnetically confined plasma, so there is no cathode loss resulting in a short service life. We finished the design for a miniaturization ECR ion source system, including a microwave system and source body. The traditional microwave system’s scale, which is approximately 1 m, has been reduced to 0.234 m, and the transmission efficiency is greater than 90%. The influence of cavity size and magnetic field distribution on gas ionization is analyzed under the condition that the outer size of the permanent magnet ring is limited, and the optimal scheme of cavity size and saddle-shaped magnetic field distribution is obtained. This design meets the requirement of fitting the ion source system into the restricted space in the high-voltage accelerator’s head.

1. Introduction

Because of their high beam quality, stability, dependability, high beam power and low cost, high-voltage accelerators are widely used in electron irradiation, nuclear physics investigations, and analysis. High-voltage proton accelerators have become popular in recent years for proton irradiation, boron neutron capture treatment (BNCT), and as injectors for proton medical accelerators. Budker Institute of Nuclear Physics in Russia, IBA in the United States, Neutron Therapeutics in Finland, and Nagoya University in Japan are all working on high-power, high-voltage proton accelerators capable of producing proton beams of several MeV and tens of milliamperes [1,2]. These institutions have achieved different results in the development of high-voltage accelerators. Among them, the high-current, high-voltage proton accelerator constructed by Nagoya University can extract a 2.8 MeV/15 mA DC proton beam, which has been utilized in the development of the BNCT neutron source [3,4]. The 2.6 MeV/30 mA commercial proton high-voltage accelerator developed by Neutron Therapeutics has been used in the BNCT project at the University of Helsinki and completed its first clinical trial. The University of Birmingham also purchased the company’s high-voltage proton accelerator to develop high-flux neutron sources for producing nuclear energy materials [5]. Shanghai Institute of Applied Physics (SINAP) is currently developing such a kind of proton accelerator for BNCT. Figure 1a shows the main structure of the accelerator, which is designed to hit the target and generate the neutron beam. The design parameters of the high-voltage proton accelerator are shown in Table 1:
The ion source is typically set to the high potential of the high-voltage accelerator, necessitating a small size, high microwave transmission efficiency, and good heat dissipation. The proton accelerator developed by SINAP has two requirements for the ion source: 1. The ion source needs to be positioned in a high-voltage spherical shell at the high-voltage end, as shown in Figure 1b. 2. The extracted beam must meet the injection intensity requirements of the accelerator and ensure that most ions can enter the accelerating tube and be consistently accelerated. The design parameters of the ion source are thus displayed in Table 2.
Currently, various institutions employ ion sources such as the Penning source, the radiofrequency (RF) source, and the ECR ion source for proton accelerators, as illustrated in Table 3. The ECR ion source is a cathode-free source. Compared to other ion sources, it is stable and reliable, has high repeatability, can generate multiple types of highly charged ions and extract ion beams with low energy divergence and low emittance, and theoretically has no lifetime limit. Nonetheless, the typical ECR ion source is usually equipped with a longish microwave transmission system, preventing it from being well placed in the high-voltage spherical shell of the high-voltage accelerator, as shown in Figure 1b.
The miniaturization of ECR ion sources can be classified into three categories: 1. Miniaturization of the microwave system. 2. Miniaturization of the source body. 3. Miniaturization of the extraction system. The miniaturization of the microwave system primarily involves the use of coaxial lines instead of waveguides for microwave energy input. The miniaturization of the source body is achieved through the adoption of smaller discharge chambers and permanent magnets. Meanwhile, the miniaturization of the extraction system focuses on reducing the length of the extraction electrode while ensuring its performance. The miniaturization approaches employed by different institutions for ECR ion sources are summarized in Table 4. It can be observed that currently none of these ion sources fully meet the requirements of high-current high-voltage accelerators in terms of source size and performance.
Therefore, based on the aforementioned miniaturization schemes for ECR ion sources, we propose an ECR ion source miniaturization approach that can meet the requirements of high-voltage accelerators. This approach combines the miniaturization of both the waveguide transmission system and the source body to achieve the desired outcomes. First, the transmission length of the microwave system was compressed by removing the three-pin tuner and circulator and miniaturizing other waveguide devices. With these enhancements, the total length of the microwave system is less than 300 mm. Second, because the ECR ion source is installed in the accelerator’s high-voltage terminal spherical shell, the external dimensions of the ion source magnetic components are limited. More plasma can be generated while ensuring efficient microwave transmission by optimizing the magnetic field distribution and the size of the discharge chamber.
Figure 2 shows a physical structure model for calculating the transmission of a miniaturized microwave transmission system and a physical structure model of the source body for calculating the discharge inside the discharge chamber. Figure 2a shows the model of the miniaturized microwave transmission system, which mainly consists of a magnetron, an excitation chamber, a high-voltage isolated waveguide, a matched waveguide, and a source body, as shown in Figure 2b. Figure 2b shows the structural diagram of the source body used to calculate the discharge case, which includes a microwave window composed of alumina ceramics and boron nitride, a discharge chamber, a mounting barrel, and permanent magnet rings. These simulations were performed using the COMSOL Multiphysics software, which allowed for a comprehensive analysis of microwave, magnetic, electric, and plasma processes.

2. Miniaturization of the Microwave System

2.1. Conventional Microwave System

Figure 3 shows the three-dimensional structure of the ECR ion source experimental platform equipped with a conventional microwave transmission system, the physical object, and the measurement results of the microwave transmission of this ion source. Among them, Figure 3a shows the three-dimensional structure of the experimental platform. The experimental platform includes a magnetron, an excitation cavity, a circulator, a three-pin tuner, a directional coupler, a high-voltage isolated waveguide, a matched waveguide, a source body, and a three-pass chamber. The platform can be used to measure the transmission of microwave systems and to perform preliminary experiments on gas ionization. Figure 3b shows a physical diagram of the experimental platform and microwave transmission measurements. By replacing the magnetron and excitation cavity with a waveguide coaxial converter and connecting it to a vector network analyzer, the microwave transmission of the platform can be measured. The match between the microwave system and the discharge chamber is changed by adjusting the three-pin tuner to minimize microwave reflections throughout the system. At this moment, the reflection situation is represented by the S11 parameter and the standing wave ratio, which are, respectively, −20.213 dB and 1.2159.

2.2. Microwave Transmission System Miniaturization Design

To realize the miniaturization of the microwave system, the method we adopted was to directly match the microwave power source to the discharge chamber in the design, remove the circulator, and integrate the three-pin tuner function into the matching waveguide. The directional coupler is utilized chiefly for measuring microwave power, but it is canceled in the existing system. The system leaves just the magnetron, excitation cavity, high-voltage isolation waveguide, matching waveguide, and the source body. This method allows for the efficient transmission of high-power microwaves and decreases the total size of the microwave transmission system by a substantial amount. When combined with a compact discharge chamber, this allows for the ion source system to be located within the accelerator’s high voltage terminal spherical shell.
The microwave transmission system from power source to load includes: magnetron, excitation cavity, high voltage isolation waveguide, transition waveguide and source body. The source body is composed of a microwave window and a discharge chamber. The microwave window is composed of three pieces of 10 mm aluminum oxide and one piece of 2 mm boron nitride. The discharge chamber is made of stainless steel, and the inner cavity size is Φ30 mm × L40 mm.
However, the discharge cells with the dimensions mentioned above have the following issues: In conventional electromagnetic wave theory, a cavity discharge chamber with a diameter of 30 mm is significantly smaller than the maximum discharge chamber diameter D = 2λ/3.412 ≈ 72 mm corresponding to the 2.45 GHz TE11 wave in the classical electromagnetic wave theory [11]. The discharge chamber is so compact that electromagnetic waves cannot fit inside. The relative permittivity of the plasma εp can be expressed as [14]:
ε p = 1 ( ω pe / ω ) 2 1 ω ce / ω ,
where ω represents the microwave frequencies, ωce is the electron cyclotron frequency, ωpe is the plasma oscillation frequency given by ω pe = n e e 2 / m e ε 0 , and ε0 is the dielectric constant in vacuum. The electron cyclotron frequency is denoted by ω c e = e B / m e , where e is the elementary charge, B is the axial magnetic induction, and me is the electron mass. Additionally, the microwave frequency is represented by ω = e B 0 / m e , with B0 corresponding to a magnetic flux density of 875 G for a microwave frequency of 2.45 GHz. By substituting these values into Equation (1), we obtain:
ε p = 1 + n e m e ε 0 B 0 ( B B 0 ) ,
where ne represents the electron density. According to the above equation, when B > B0, the dielectric constant will be larger than the vacuum dielectric constant, and the minimum diameter Dp that can transmit a 2.45 GHz microwave can be changed to D p = λ / 3.412 ε p . When the plasma dielectric constant is large enough, the 2.45 GHz electromagnetic wave can enter the small size discharge chamber.
To verify the miniaturization scheme, the numerical simulation of the microwave system was carried out. We used a 50 Ω coaxial line instead of the magnetron antenna for microwave feed in the simulation. We used the water load instead of plasma to match the microwave transmission section impedance for the calculation [15]. For plasmas, the water load corresponds to plasma at a steady state. Water has a dielectric constant of 78.5, comparable to plasma at 890 G with a density of 1 × 10¹⁷ m−3.
Eventually, since the complete microwave transmission system lacks a circulator and three-pin tuner, the matching waveguide’s design is crucial to the system’s performance. Right now, transitional waveguide and ridge waveguide are used for microwave system matching. The waveguide system is connected to the source body through a matching waveguide. Electromagnetic simulations are conducted on the entire microwave transmission segment, which extends from the microwave source to the discharge chamber. The effectiveness of the system matching is evaluated based on the results obtained from the electromagnetic simulations. There are three matching strategies in the simulation: 1. Standard length excitation cavity, high voltage isolation waveguide, and transition waveguide. 2. Standard length excitation cavity, high voltage isolation waveguide, and miniaturized ridge waveguide. 3. Shortened length excitation cavity, high voltage isolation waveguide, and miniaturized ridge waveguide. The results of these three schemes shown in Figure 4 and Figure 5, and the electric field, S11 parameters, and power transfer efficiency at the entry to the discharge chamber are used to assess the performance of the microwave system.

2.2.1. Conventional Length Waveguide Plus Transition Waveguide

The electromagnetic simulation outcomes corresponding to scheme, which involves conventional length waveguide plus transition waveguide, are exhibited in Figure 4a and Figure 5’s plan 1 curves. The simulation results about the electric field distribution of the entire system are as follows: when the power is one watt, the microwave energy coupled into the discharge chamber through the microwave window, and a maximum electric field of 1661 V/m can be formed in the discharge chamber, but the highest electric field of the entire microwave system is indeed primarily focused inside the transition waveguide, which leads the plasma to migrate towards the waveguide section and might result in the power blockage [16]. The scattering parameter S11 and the transmission efficiency of the system in the 2–3 GHz frequency range, respectively, are shown as plan 1 curves in parts (a) and (b) of Figure 5. At 2.45 GHz, the S11 parameter is only −0.826 dB, and the power transmission efficiency is just 13.4%. The above demonstrates that the system’s impedance is incompatible. As a result, this matching strategy needs to include a three-pin tuner or it will fail to meet the requirements of efficient microwave transmission.

2.2.2. Conventional Length Waveguide Plus Miniaturized Ridged Waveguide

The ridge waveguide has a low cut-off frequency, low impedance, and high bandwidth. It is commonly used to connect the front-end waveguide system and the ion source body. The impedance of the whole ridge waveguide depends on several factors, such as the impedance of each ridge waveguide (Zn), the number of ridge steps (N), the length of the ridge segment (Ln), the gap between the ridge segments (dn), and the width of the ridge segment (sn). The commonly used ridge waveguide has 3–4 segments, and the length of each part is λg/4, where λg is the waveguide wavelength for transmitting microwaves. The relationship of each segment of the ridge waveguide is as follows [16,17]:
Z n + 1 = exp ( ln ( Z n ) + 2 N C n N ln Z L Z I V ) ,
where n is the current number of ridge step, N is the total number of ridge steps, ZIV is the input impedance, and ZL is the load impedance.
The impedance of a ridge waveguide is described differently, with the characteristic impedance being determined by the voltage-to-power ratio as follows [18,19]:
Z P V = V 0 2 2 P ,
where V0 is the peak voltage across the ridge gap, and P is the power transmitted by the ridge waveguide.
Assuming that the medium in the waveguide is air, at frequency f = ∞, the characteristic impedance ZPV of the ridge waveguide is expressed as follows:
Z P V = 1 k 120 π 2 β { m 2 β k cos 2 π γ k ln csc π d 2 b + π γ 2 k + 1 4 sin 2 π γ 2 k + d b cos 2 π γ k sin 2 2 π δ k [ π δ k 1 4 sin 4 π δ k ] } ,
k = λ c a ;   β = d a ;   γ = s a ;   δ = ( 1 s / a ) 2 ,
where λc represents the cut-off wavelength of the relevant frequency, a represents the length of the rectangular surface of the ridge waveguide, and b represents its breadth.
According to the formula mentioned above, the impedance of each conventional ridge waveguide segment may be determined. However, the length of each part of a standard ridge waveguide is typically a quarter of the wavelength λg of the waveguide. For 2.45 GHz, each section of the ridge waveguide is 30.6 mm, so the length of the conventional waveguide used should be around 91.8 mm or 122.4 mm. The dimensions of the waveguide do not suit our requirements. Therefore, based on the traditional ridge waveguide, referring to the design of the transition waveguide, the cavity part of the ridge waveguide is designed as a transition waveguide with three sections of openings gradually reduced. Three equal-width steps are arranged along the transmission direction at the center of both sides of the long side of the inner surface of the cavity, and the gaps between the three steps gradually decrease. By adjusting the width of the ridge and the relative size of the steps, the impedance-matching of the entire microwave system can be realized. The overall length of the miniaturized ridge waveguide is about half that of the conventional ridge waveguide.
Figure 4b shows the simulation results of the miniaturized ridge waveguide instead of the transition waveguide. Using the miniaturized ridge waveguide as a matching waveguide can boost the electric field strength inside the discharge chamber. The maximum field strength inside the discharge chamber is increased to 6027 V/m, roughly four times that of using the BJ26 to BJ32 transition waveguide.
The curves (plan 2) in Figure 5 show that the system has an experience with a scattering parameter S11 of −21.44 dB at 2.45 GHz, and the microwave transmission efficiency into the discharge chamber is greater than 90%. The effect of power transmission is close to the experimental result of the existing traditional microwave system.
In this case, the size of the entire microwave system can be reduced to 316 mm, and the length from the power source to the bottom of the discharge chamber is only 388 mm. Although this solution has reduced the overall size of the microwave system, it is still difficult to fit into the accelerator’s high-voltage spherical shell.

2.2.3. Reduced Length Waveguide Plus Miniaturized Ridge Waveguide

Taking into account changes in the microwave system’s working environment, the microwave system can be further reduced. The high-voltage accelerator steel tank is typically filled with SF6, and the gas environment is significantly more electrically insulated than the atmospheric environment. As a result, the insulation size of the high-voltage isolation waveguide can be reduced, as can the size of the excitation cavity, and the system can finally be installed in a high-voltage spherical shell. After optimization, the size of the entire microwave system can be reduced to 234 mm, and the length from the power source to the bottom of the discharge chamber is only 306 mm finally.
Figure 4c and plan 3 curves in Figure 5 represent the simulation results of further downsizing the microwave system. The microwave can still enter the discharge chamber very effectively while generating an electric field with a maximum field strength of 6011 V/m. Additionally, at 2.45 GHz, the scattering parameter S11 is −23.752 dB, and the transmission efficiency is higher than 90%, further demonstrating the microwave system’s superior microwave transmission capability. Thus, the two key designs of the ion source system, namely, small size and high transmission efficiency, are achieved, and the system installed in the head of a high-voltage accelerator is satisfied.

3. Optimization of Discharge Chamber Size and Magnetic Field

Optimization is based on the simulation calculations with consideration that the microwave and plasma parameter evolution are decoupled to each other, because the time scale is at the ns level. Considering the time scale of microwaves, the motion of ions is assumed to be negligible in comparison to the motion of electrons, the model ignoring the plasma’s specific evolution [20,21]. This means that we can only focus on whether the microwave is effectively absorbed and simplify the consideration of the type of ionized gas and the input power value. Therefore, we will examine the ionization of the gas at 10 watts of microwave. The influence of parameters such as the magnetic field and the size of the discharge chamber on the process of absorbing microwave energy by plasma is evaluated based on the state of the plasma.
In microwave plasma, the electric field (E) distribution satisfies the wave equation [20,22]:
× μ 0 1 ( × E ) k 0 2 ( ε r i σ ω ε 0 ) E = 0 ,
where μ0 is vacuum permeability, k0 is the vacuum wavenumber, εr is relative permittivity, ε0 is the vacuum permittivity, and σ is the plasma conductivity, which is a full tensor determined by the electron density collision frequency and the static magnetic flux density. Define the following parameters:
α = q m e ( v e + i ω ) ,
where q is the electron charge, me is the electron mass, and νe is the collision frequency between electrons and neutral particles. The inverse matrix of plasma conductivity can be expressed as:
q n e σ 1 = [ 1 α B z α B y α B z 1 α B x α B y α B x 1 ] ,
The drift–diffusion equation can be used to determine the electron density and electron energy density if the electron density is constant in the resonance region, and the Debye length is much smaller than the microwave interaction length [21,23]:
t ( n e ) + [ n e ( μ e · E ) D e · n e ] = R e ,
t ( n ε ) + · [ n ε ( μ ε · E ) D ε · n ε ] + E · Γ e = R ε ,
where Γe is the heating term, which comes from microwave heating and the motion of electrons in the bipolar field. Re is the electron source term, Rε is the energy loss due to inelastic collisions, De is the electron diffusion coefficient, Dε is the electron energy diffusion coefficient, με is the electron energy mobility, and μe is the electron mobility, which are full tensors affected by the static magnetic flux density; the specific expressions are as follows:
D e = μ e T e ;   D ε = μ ε T ε ;   μ ε = ( 5 / 3 ) μ e .
According to the above formula, different boundary conditions and the static magnetic field distribution inside the discharge chamber will change the conductivity, the mobility, and the diffusion coefficient of the plasma, resulting in ionization characteristics. The factors affecting the ionization characteristics can be studied by analyzing the electron density and temperature of the plasma.
The structure of the physical model used to perform the plasma calculations is shown in Figure 2b. It consists of a microwave window, a mounting barrel, a discharge chamber, and permanent magnet rings. The microwave window is composed of three pieces of ceramics with a thickness of 10 mm and a piece of BN with a thickness of 2 mm. This configuration effectively couples the microwave into the discharge chamber and can be easily replaced at a later stage. The mounting barrel and the discharge chamber are made of non-magnetic stainless steel, which facilitates the formation of a suitable magnetic field inside the discharge chamber. The permanent magnet ring is made of NdFeB. In the simulation, the direction of microwave power feeding and the direction of permanent magnet ring magnetization are along the Z-axis.

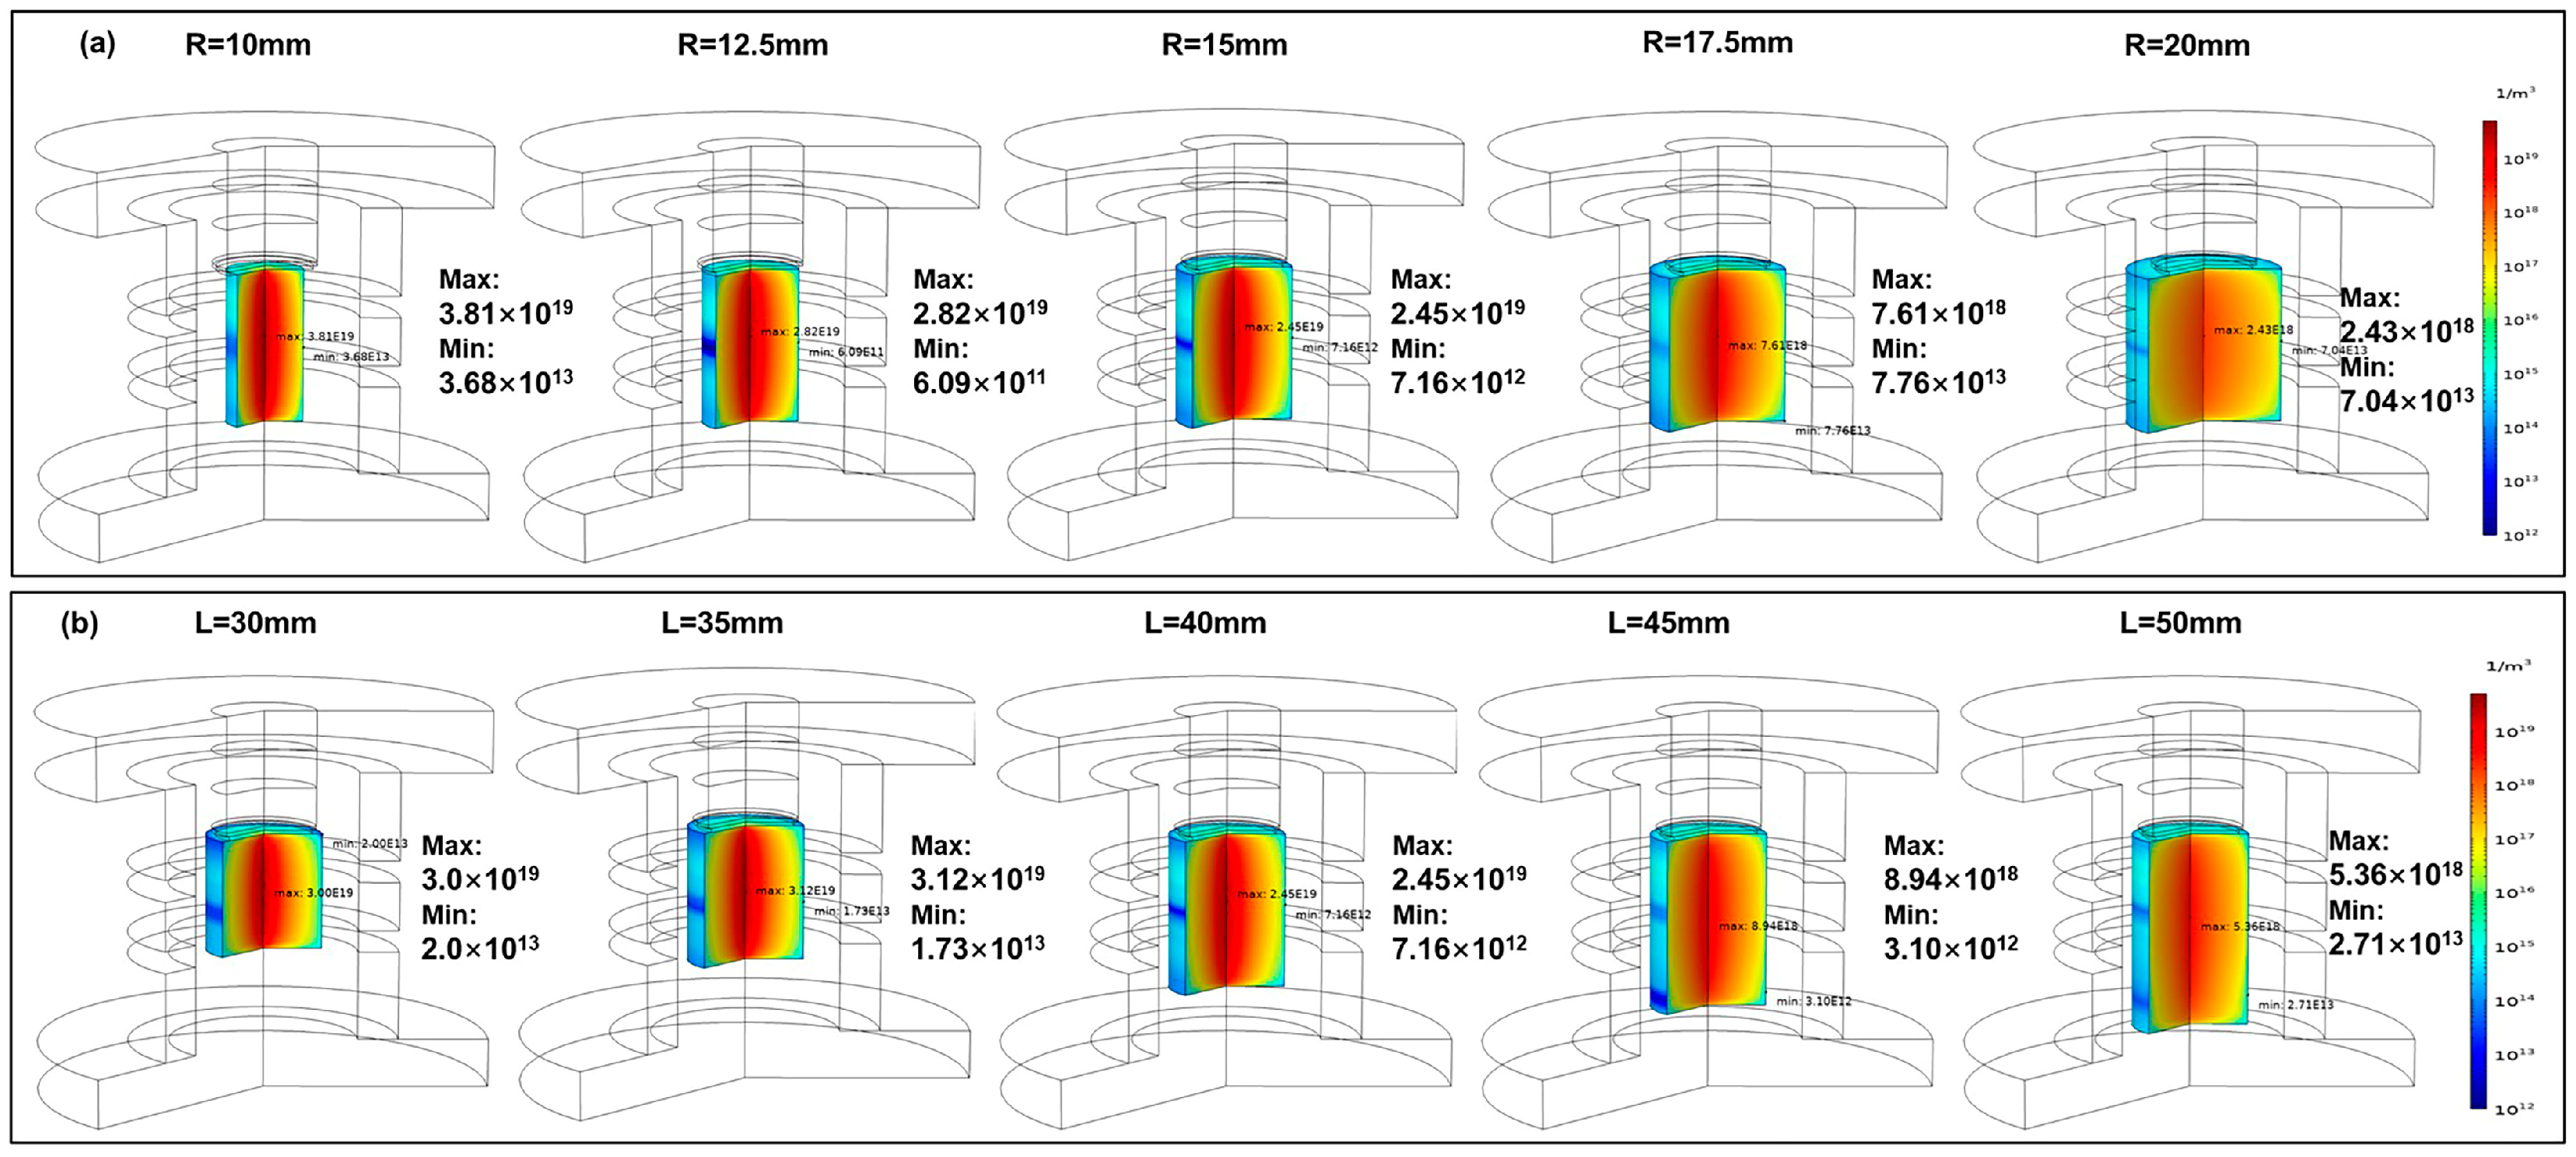
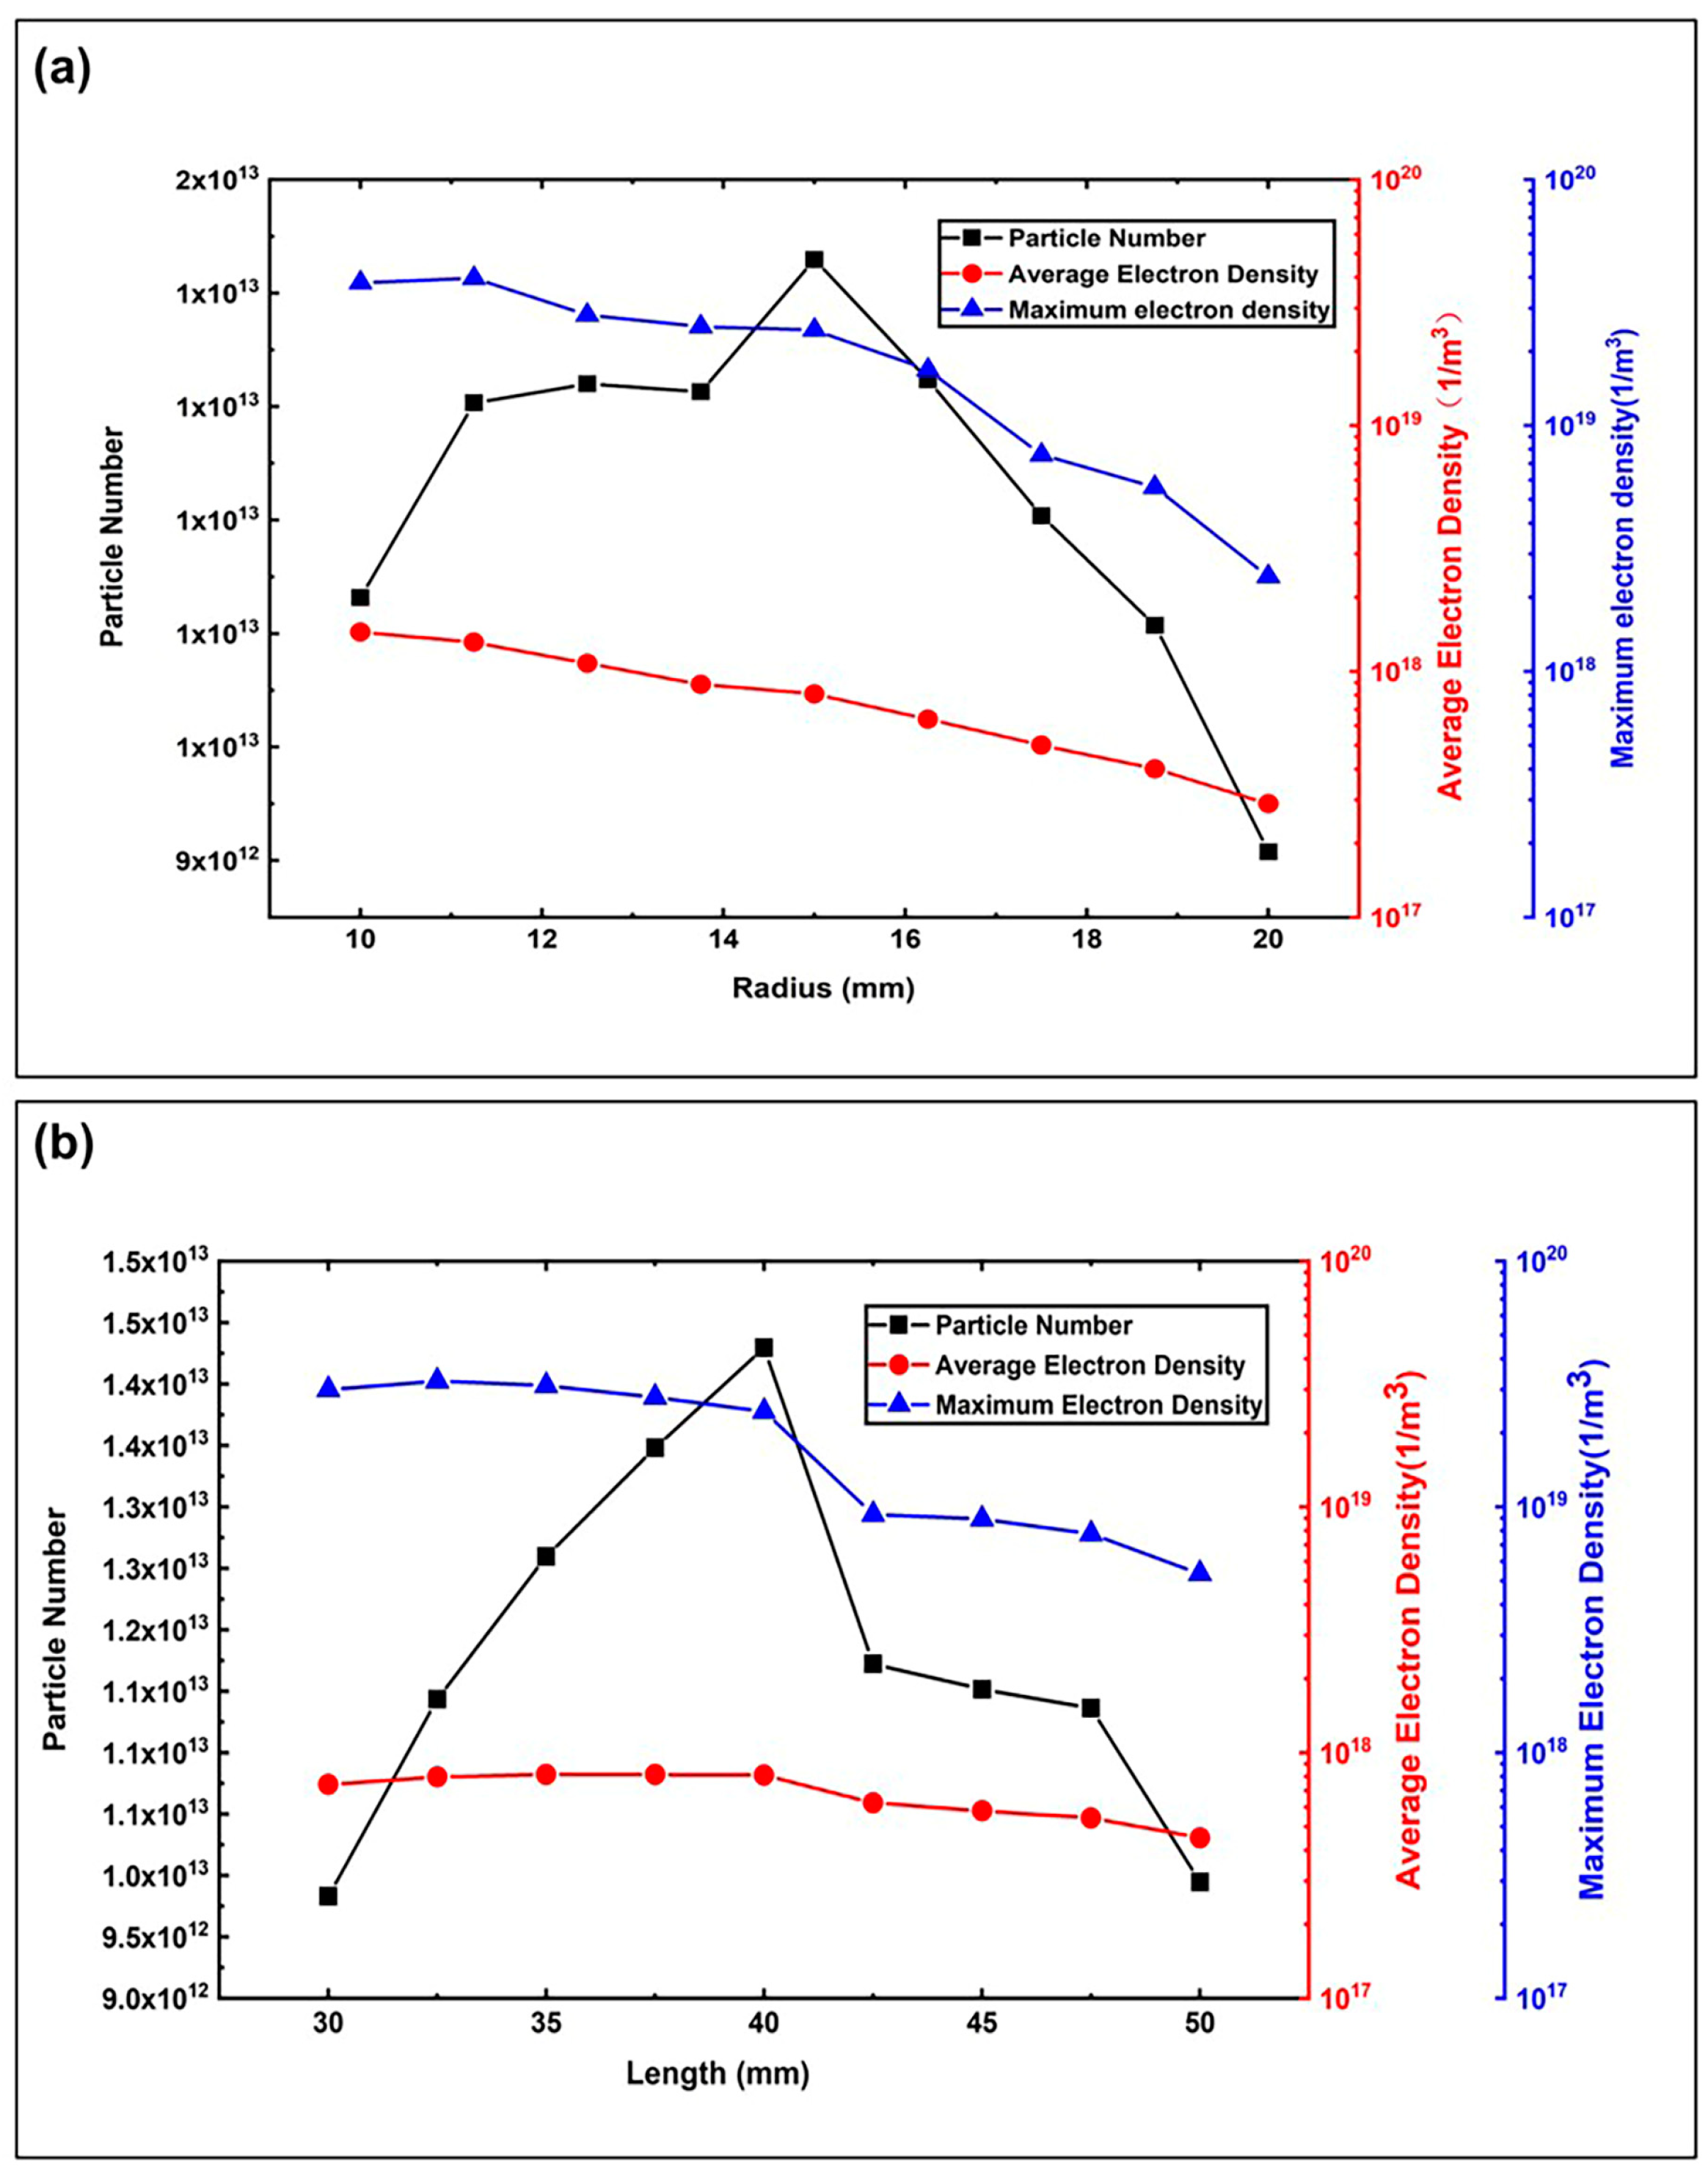
3.1. The Impact of the Discharge Chamber’s Dimensions on the Ionization Properties

The axial magnetic field distribution is determined to be a saddle-shaped magnetic field. The discharge chamber radius and length of the ion source model are modified. When adjusting the radius of the cavity, keep the length of the discharge chamber at 40 mm and the radius variation range at 10 mm–1.25 mm–20 mm. When adjusting the cavity length, keep the discharge chamber’s radius at 15 mm and the variation range of changes (L) at 30 mm–2.5 mm–50 mm. Some results of the spatial electron density distribution after changing the radius and length of the cavity are shown in Figure 6a,b.
As shown in Figure 6, the maximum electron density distribution mainly distributes near the center of the discharge chamber. In contrast, the minimum electron density is primarily distributed near the wall of the discharge chamber. The plasma is mainly concentrated in the center of the discharge chamber regardless of how the cavity’s size changes, but as the cavity’s size increases, the degree of plasma concentration in the chamber’s center will fluctuate and decrease with larger cavities.
Due to the limitations of the ion source’s placement conditions, the parameters of the permanent ring, such as the structure values, are determined first in our design. We consider the simulation results of the discharge cavities with different sizes to meet the needs of power feeding and beam extraction at the same time. The plasma state under varied size conditions, including the size of the space for accommodating the plasma and the magnetic field distribution that defines the plasma discharge state, are distinct. The simulation work judges whether the system meets the design requirements by examining the electrons in the plasma, including the number of electrons, the average electron density and the maximum electron density.
The number of particles is calculated by the volume integral of the electron density, the average electron density represents both the total number and the volume change, and the maximum electron density usually appears in the central region of the plasma. Figure 7a,b demonstrate the effects of various radii and lengths on the number of particles, average electron density, and maximum electron density in the discharge chamber, respectively. The typical tendency of the average electron density and the maximum electron density variation decreases with increasing size. Figure 7 demonstrates that the total number of electrons initially increases and then decreases as the dimensions of the discharge chamber change. As the dimensions increase, there is a peak value at a certain point, indicating a behavior that does not align with the volume scaling law. This observation is consistent with the results from reference [24], which showed a reverse volume scaling effect for the extraction current in the axial dimension for high charge states. Furthermore, our simulation results suggest that this trend is not limited to high charge states but also applies to low charge states of the ion source. Whether a higher volume contributes to the production of more intense currents requires further discussion. In practical design, optimizing the axial and radial dimensions of specific models is crucial. The results of the parameter sweep calculations of the model show that the number of particles is at the maximum when the radius of the discharge chamber is 15 mm and the length of the chamber is 40 mm. For an ion source that does not require a particularly high extraction current (more than 20 mA), the primary demand is to lower the whole size of the system including the microwave system; this size can satisfy the overall needs of the accelerator.

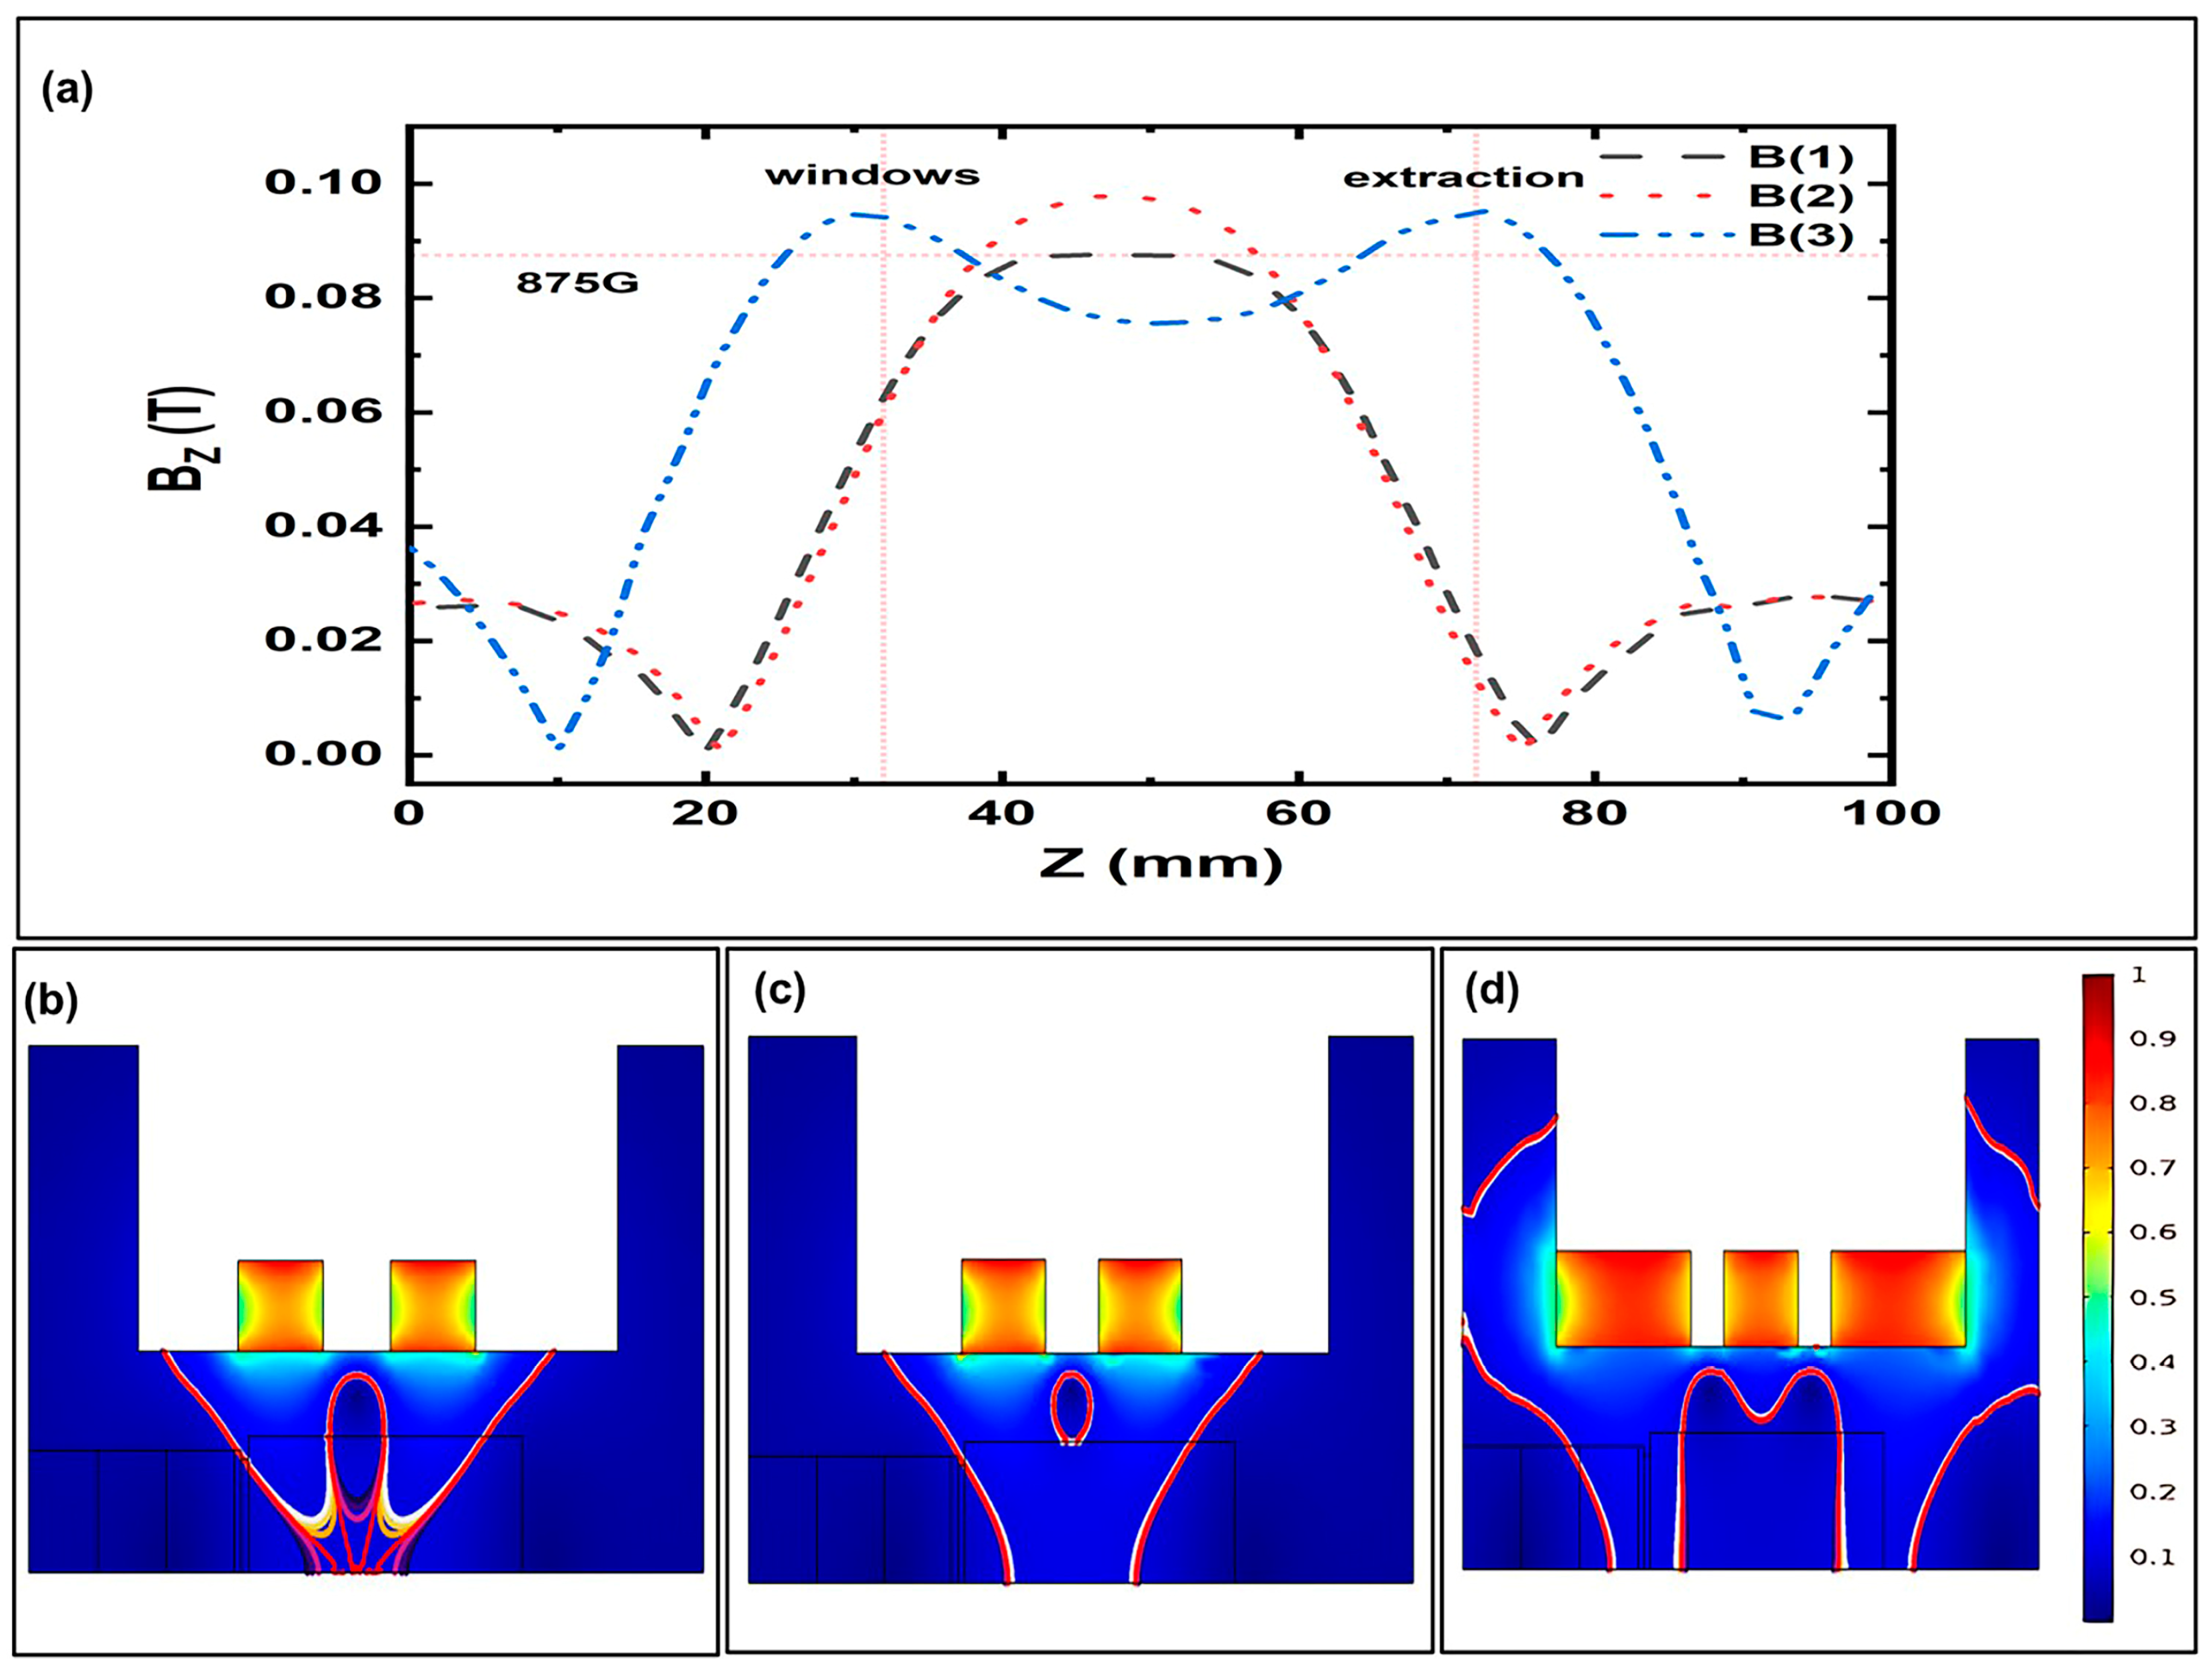
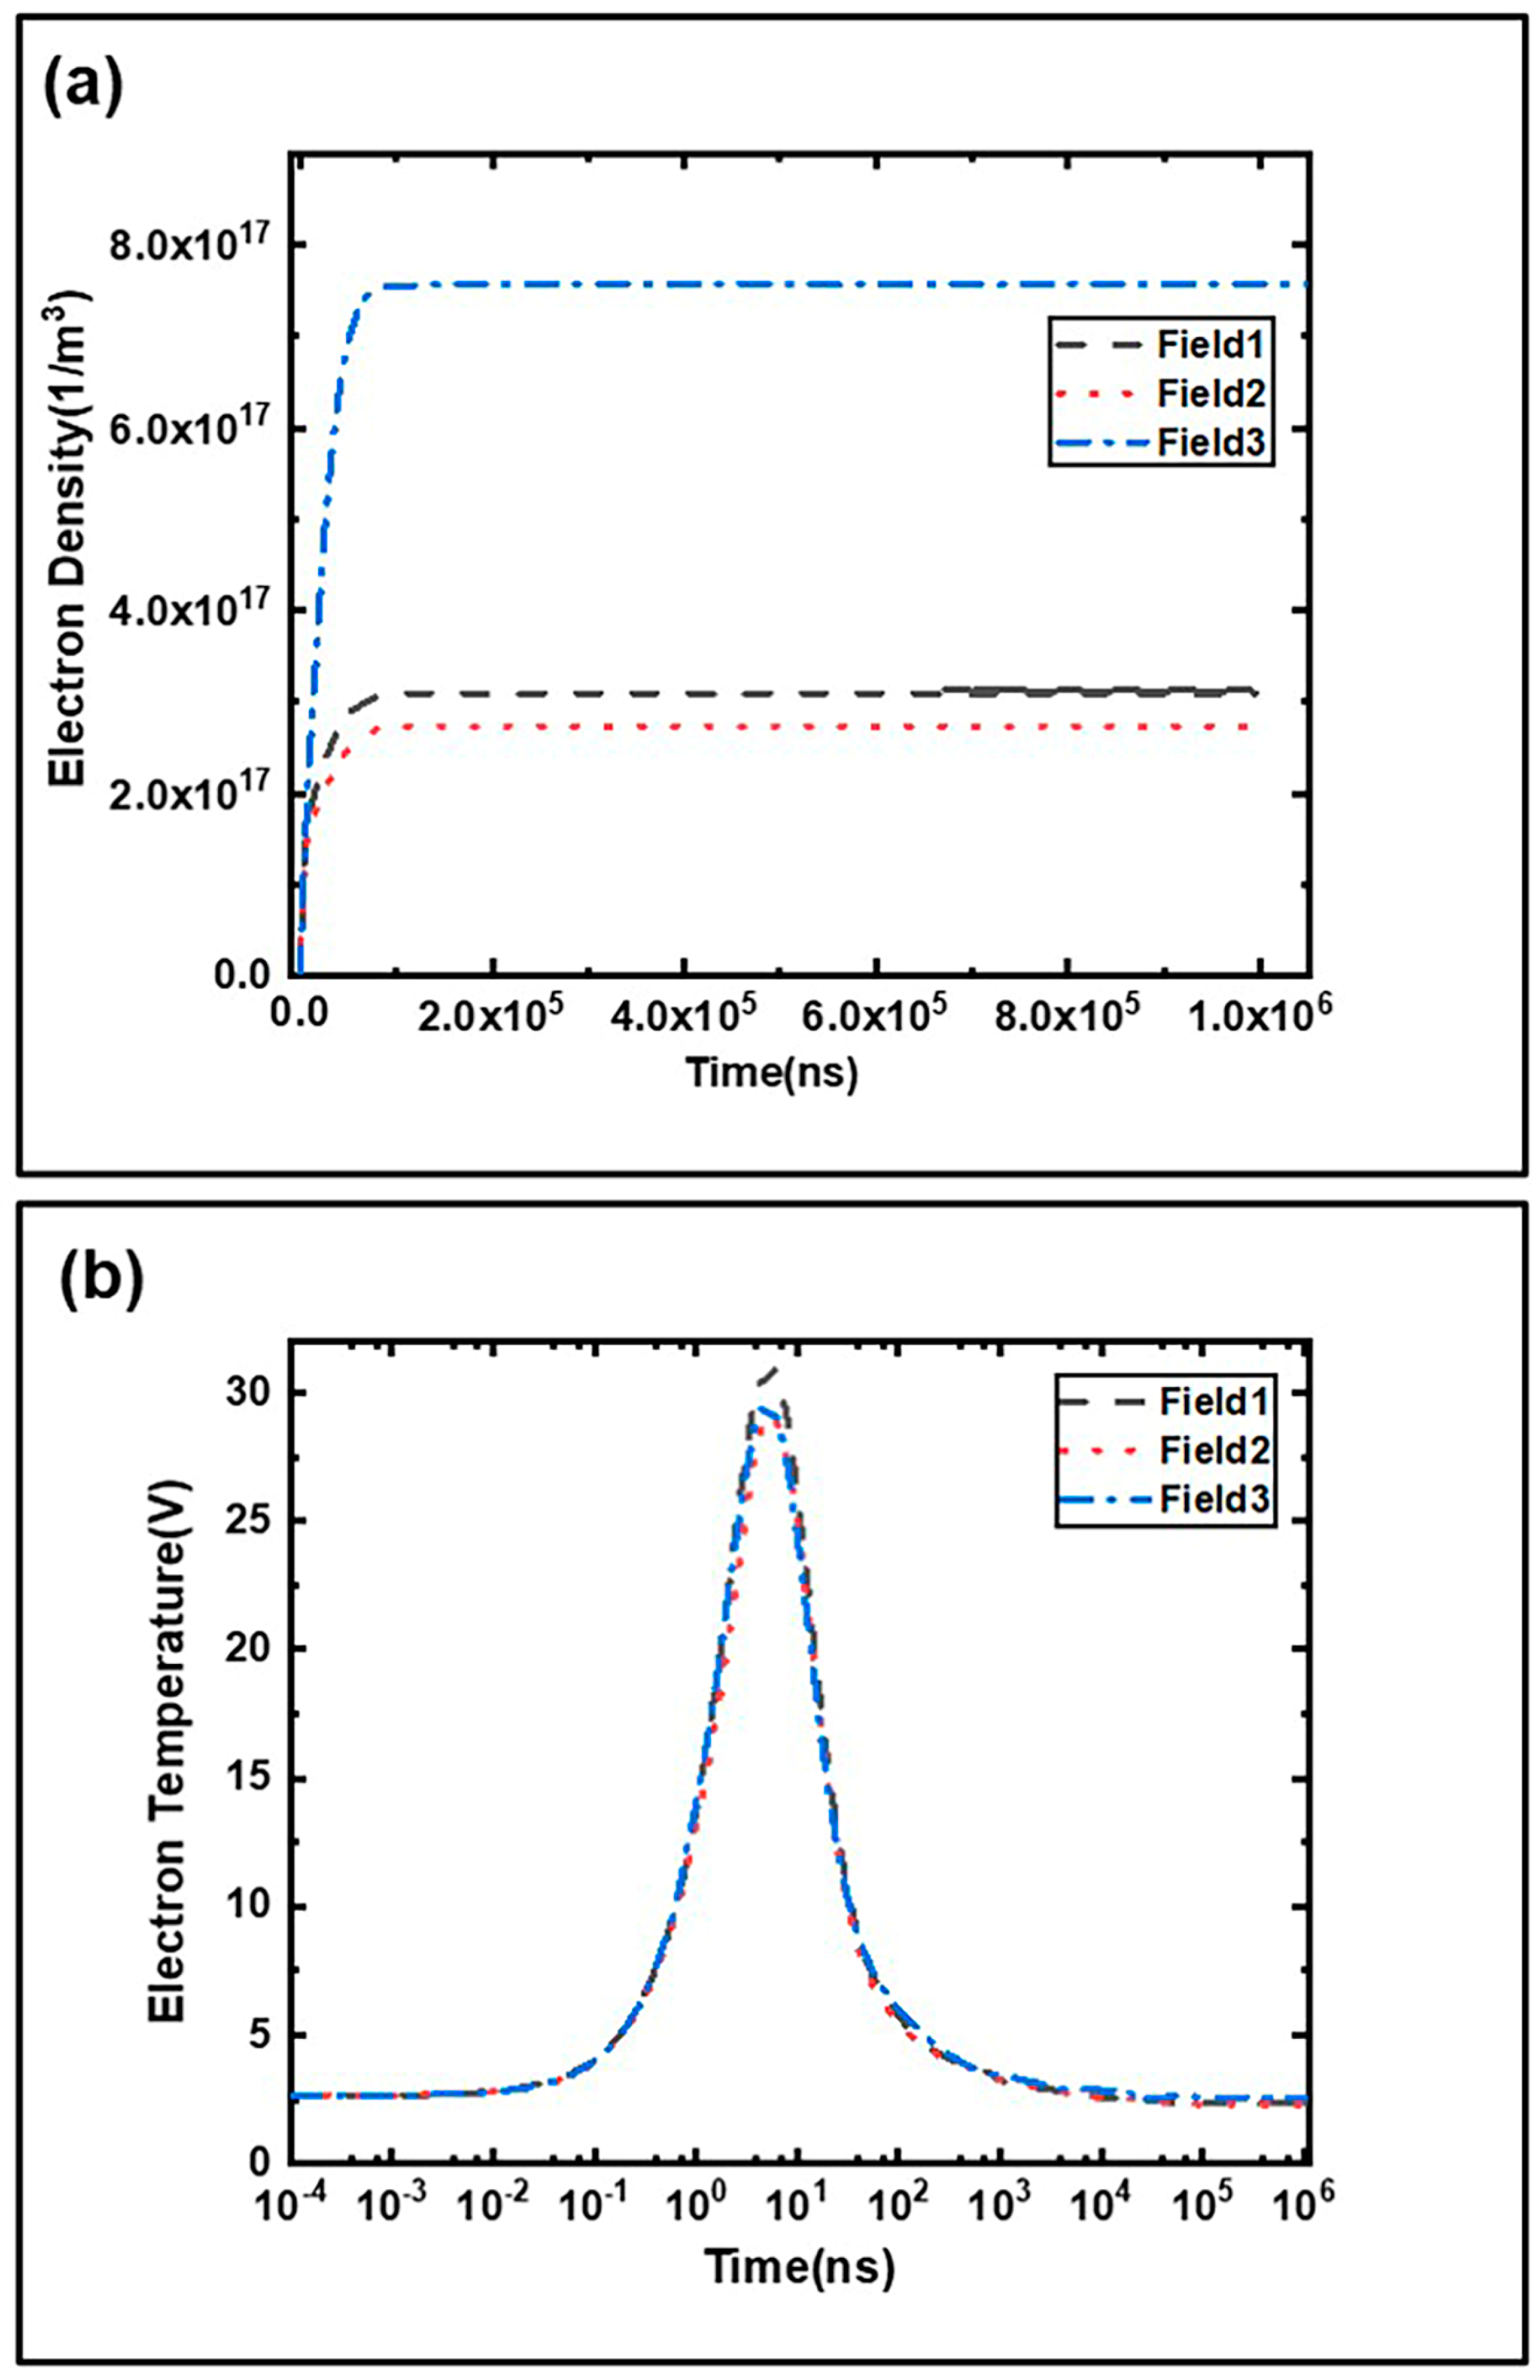
3.2. Effects of Three Classical Axial Magnetic Field Distributions on Ionization Characteristics

According to the research of ECR ion source workers, using an appropriate axial magnetic field distribution can help improve the extraction beam intensity of the ion source. The effects of three traditional axial magnetic field distributions often utilized in ECR ion sources on the ionization properties inside the discharge chamber are confirmed by modeling the plasma inside the discharge chamber [10,17,25,26,27]. In Figure 8a, the three types of field distribution are displayed. The size of the discharge chamber is Φ = 30 mm × L40 mm. Type 1 is a flat magnetic field with a uniform field of 875 G in the middle; type 2 is a Gaussian-distributed magnetic field with a peak value greater than 875 G, and type 3 is a saddle-shaped magnetic field with low sides and a high center. The distribution of the magnetic field and the contour line (860 G–5 G–890 G) are shown in parts (b)–(d) of Figure 8, where the red contour line is 875 G. To evaluate the impact of the magnetic field on the plasma from the perspective of the resonance plane, it is possible to estimate the size and form of the ECR resonance plane based on the distribution of the contour line.
Figure 9 and Figure 10 illustrate the ionization characteristics associated with the three field types. The variations in the average electron density and average electron temperature inside the discharge chamber, as seen in the time domain, are shown in Figure 9. It can be seen in Figure 9a that the electron density increases rapidly with time and tends to be stable at around 0.1 ms and no longer increases. This response time will not change with the change in the applied magnetic field. The saddle-shaped magnetic field can produce the highest average electron density compared to the flat magnetic field and the Gaussian-distributed magnetic field, which is nearly four times that of the former two magnetic field distributions. The electron density of the flat magnetic field is marginally higher than that of the Gaussian-distributed magnetic field. It further demonstrates that, under identical circumstances, the saddle-shaped magnetic field has the best effect on gas ionization and the most pronounced improvement for the ion source, which is consistent with the conclusion of the ion source extraction experiment [26]. Figure 9b illustrates this occurrence, which is compatible with the “preglow” phenomena seen in the experiment: the electron temperature would rise dramatically in a noticeably short period, reach its maximum value, decrease sharply, and then stabilize [21]. The ionization process within the discharge chamber is to be stable at about 0.1 ms since the period at which the electron temperature tends to stabilize is essentially the same as when the electron density tends to stabilize. This is further evidence that the reaction time of the plasma is not related to the distribution of the magnetic field.
When the ionization process within the discharge chamber reaches a steady state at 0.1 ms, the distribution of electron density over the whole volume is depicted in Figure 10. The following conclusions can be drawn: 1. Regardless of the variation in the magnetic field distribution, the plasma will eventually be concentrated in the center of the discharge chamber, with the maximum electron density near the discharge chamber proper and the minimum electron density at the walls. However, the distribution and concentration of the plasma are different, which is consistent with the results of the antenna source simulation [28]. The saddle-shaped magnetic field has a more vital magnetic field confinement force than the flat and Gaussian-distribution magnetic fields. It allows for the plasma to be contained in a smaller space, reducing the likelihood of ion recombination on the discharge chamber wall. 2. It is more likely that dense plasma will form with the saddle-shaped magnetic field distribution. Figure 10 shows that, compared to the other two cases, the saddle-shaped magnetic field produces a significantly higher electron density. This result could be explained by the saddle-shaped axial magnetic field distribution, which has a high magnetic field at both ends and a low magnetic field in the middle. It will constrain the electrons to move back and forth between the magnetic mirrors, thereby improving the ionization efficiency. At the same time, the saddle-shaped magnetic field is more extensive than other magnetic fields through the resonance plane of the region with high plasma density, thereby increasing the probability of electrons gaining energy.
Thus, it can be inferred from the ionization conditions of the discharge chamber under those, as mentioned above, three classical axial field distributions, that the saddle-shaped magnetic field has good aggregation ability and a larger resonance surface, which enhances the efficiency of electron ionization and decreases the ionization of ions on the cavity wall. As a result, the saddle-shaped magnetic field will perform better for the ion source employing it under the same circumstances since it is more favorable for the production of plasma [26,29,30,31].

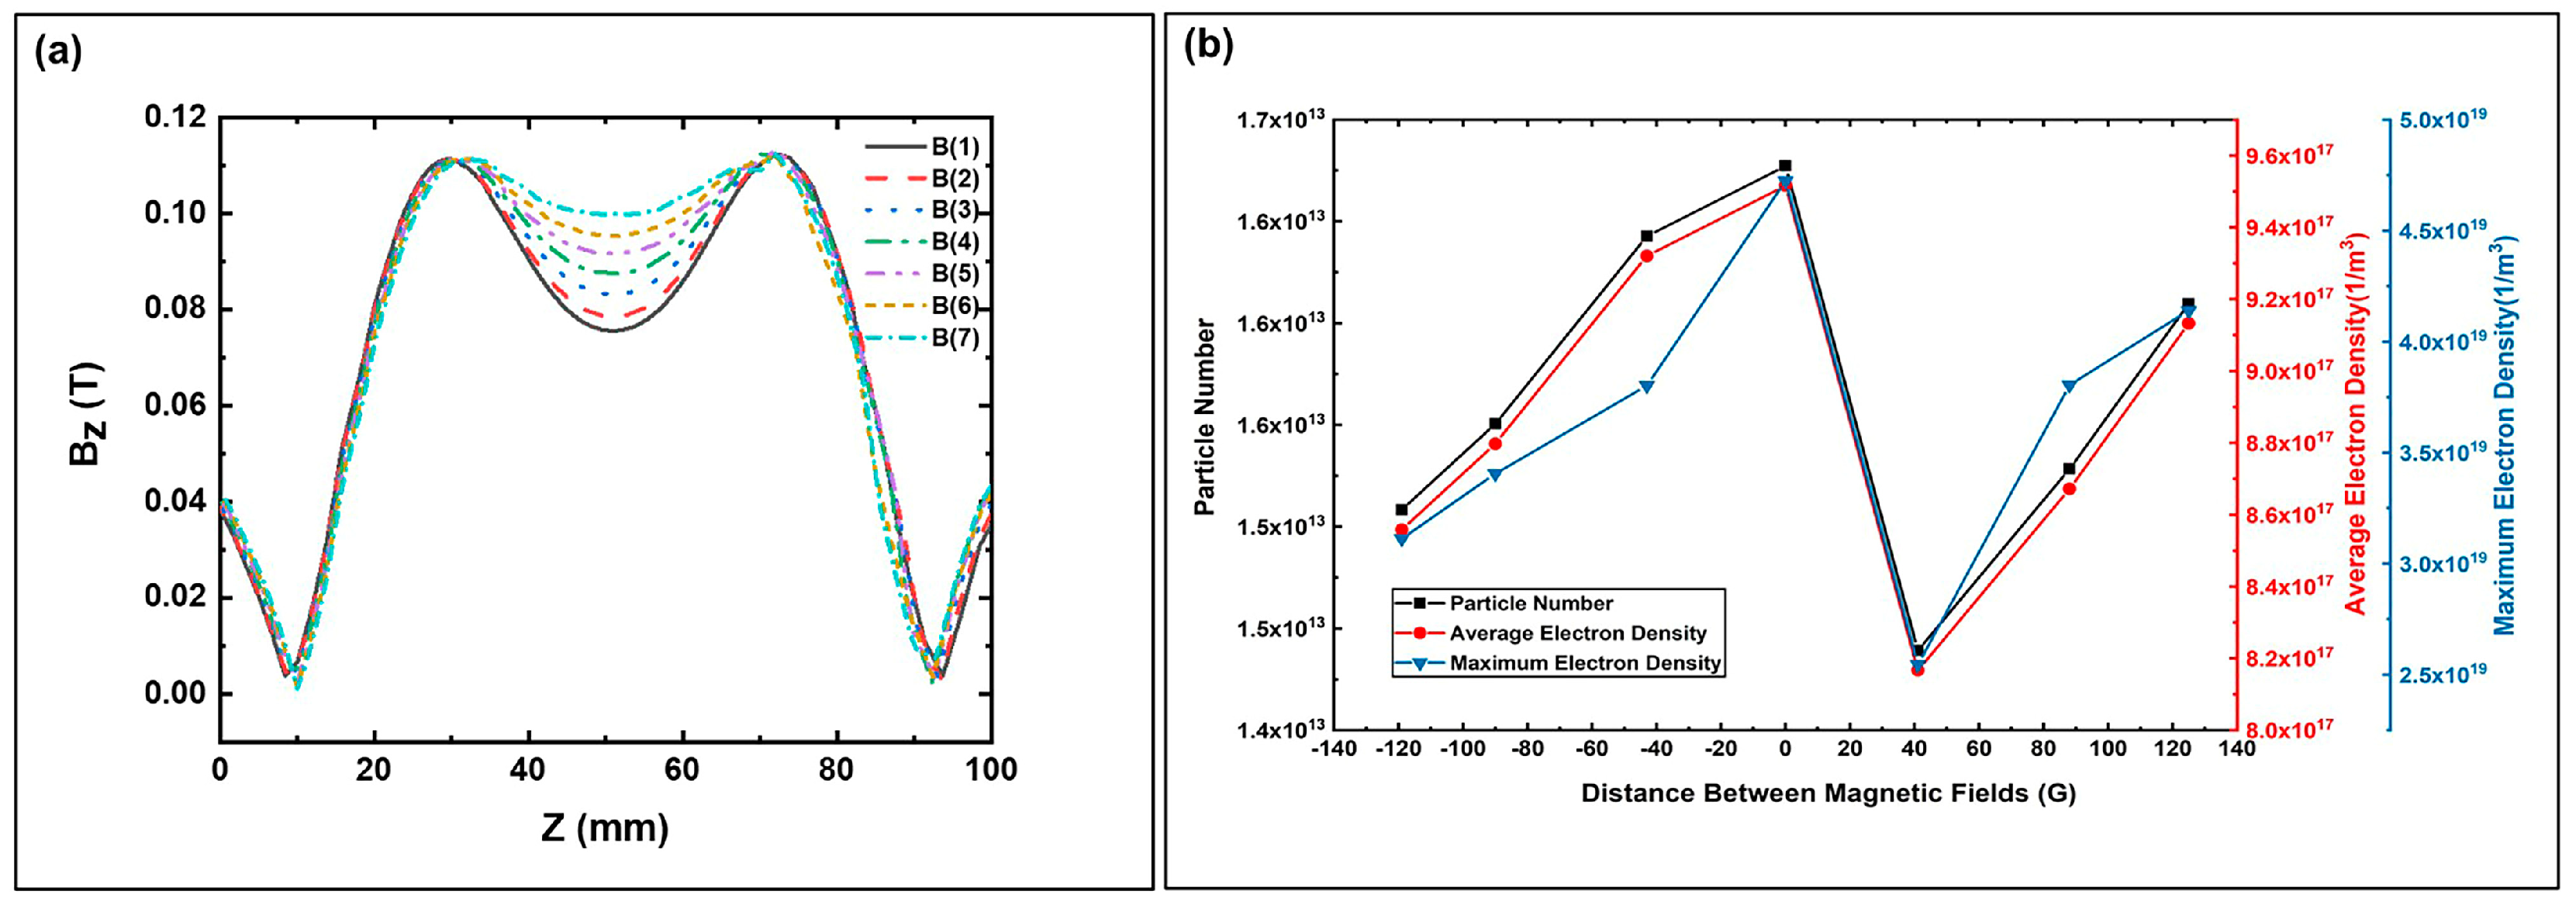
3.3. Improvement of the Saddle Magnetic Field

It can be inferred from the ionization conditions in the discharge chamber under the influence of the three conventional magnetic field distributions in the preceding section that the saddle-shaped magnetic field is more favorable for plasma production. On this basis, the influence of the magnetic field distribution on the discharge characteristics in the discharge chamber is estimated by adjusting the shape of the saddle-shaped magnetic field and the position of the central valley point.
By varying the size of the magnet while keeping the position of the peak point constant, the center valley point of the saddle-shaped magnetic field can be smaller than 875 G, equal to 875 G, or larger than 875 G. The distances between the valley point magnetic field strength and 875 G are, successively, −119 G, −88 G, −43 G, 0 G, 41 G, 88 G, and 125 G. The specific distributions of these seven axial magnetic fields are shown in the seven curves in Figure 11a.
The influence of saddle-shaped magnetic fields with varied valley locations on the discharge chamber’s discharge is displayed in Figure 11b. Because they are all saddle-shaped magnetic fields with little difference, the electron density distribution inside the space is similar. Nevertheless, Figure 11b demonstrates that the ionization properties under various magnetic fields remain distinct. In the same size of the discharge chamber, the variation in particle number, average electron density, and maximum electron density follow the same trend, and all three are oblique “N”-shaped. When the valley point is below 875 G, the particle number, average electron density, and maximum electron density increase with the height of the valley point. Moreover, they decrease and then increase when the valley point is above 875 G. This may be because the area of the resonance surface keeps rising as the valley point approaches 875 G, leading to an increase in the ionization efficiency. In a specific range above 875 G, the resonance surface decreases with the rise of the valley point, and the ionization efficiency decreases. However, a heating mechanism different from the ECR above a specific position improves the overall ionization efficiency.
According to Figure 11b, setting the valley point within a small range lower than 875 G or at 875 G can improve the ionization efficiency inside the discharge chamber to a certain extent with a relatively simple design. Consequently, the performance of the ion source is enhanced.

4. Summary

The design of an ECR ion source system for high-voltage accelerators is present in this paper from two perspectives: the miniaturization of microwave systems, and the optimization of the discharge chamber size and magnetic field. In terms of microwave transmission, a solution was proposed by analyzing the existing compact ion source and the microwave system: the removal of matching devices and the overall miniaturization design of the microwave transmission line from head to the source load. The microwave system and source matching are optimized using microwave circuit integrity simulation so that the devices used for impedance mismatch can be removed in the actual use process and the size of other waveguide devices is optimized, resulting in a 234 mm microwave system. The distance between the magnetron and the bottom of the discharge chamber is only 306 mm, which meets the requirement for size reduction while achieving an S11 of −23.752 dB. The transmission efficiency exceeds 90%.
By simulating the plasma, the effects of the discharge chamber’s size and the distribution of the static magnetic field on the ionization characteristics were studied. It was possible to obtain a trend for the effect of a small discharge chamber size on ionization characteristics. The results showed that selecting a discharge chamber with Φ30 mm × L40 mm can produce the most particles. The saddle-shaped magnetic field distribution is more able to produce dense plasma than the other two field patterns among the three distinct magnetic field distributions often employed in various ECR ion sources. At the same time, the saddle-shaped magnetic field was optimized, and the valley point of the saddle-shaped magnetic field was adjusted. It could be found that the ionization effect of altering the saddle-shaped valley point on the plasma is not as strong as the change in field type. The impact of the saddle-shaped magnetic field on the plasma can be somewhat enhanced by altering the valley point to within a narrow range of 875 G or setting it to 875 G.

Author Contributions

Conceptualization, M.-H.Z. and H.-F.Y.; methodology, Z.-F.H. and W.-S.W.; software, W.-Z.L. and H.-T.L.; validation, M.-H.Z.; formal analysis, H.-F.Y., M.-H.Z., W.-S.W. and Y.W.; investigation, H.-L.L., W.-Z.L. and M.-H.Z.; resources, M.-H.Z.; data curation, H.-F.Y., W.-Z.L., Y.W., D.-Y.Z. and H.-L.L.; writing—original draft preparation, H.-F.Y.; writing—review and editing, Z.-F.H.; visualization, H.-F.Y., D.-Y.Z. and H.-T.L.; supervision, M.-H.Z. and Z.-F.H.; project administration, Z.-F.H.; funding acquisition, Z.-F.H. and H.-L.L. All authors have read and agreed to the published version of the manuscript.

Funding

This work was supported by the Major Development Project of the Shanghai Institute of Applied Physics, Chinese Academy of Sciences [Y951011031], the National Key Research and Development Plan of China [2016YFC0105400], and the Shanghai Sailing Program [22YF1457900].

Institutional Review Board Statement

Not applicable.

Informed Consent Statement

Not applicable.

Data Availability Statement

The data that support the findings of this study are available from the corresponding author upon reasonable request.

Acknowledgments

The authors would like to thank colleagues Jian-Ming Huang and Li Guo of the Shanghai Institute of Applied Physics for their help with the article. The authors would also like to thank the anonymous reviewers for their constructive comments.

Conflicts of Interest

The authors declare no conflict of interest.

References

  1. Kasatov, D.; Koshkarev, A.; Kuznetsov, A.; Makarov, A.; Ostreinov, Y.; Shchudlo, I.; Sorokin, I.; Sycheva, T.; Taskaev, S.; Zaidi, L. The accelerator neutron source for boron neutron capture therapy. J. Phys. Conf. Ser. 2016, 769, 012064. [Google Scholar] [CrossRef]
  2. Kiyanagi, Y.; Sakurai, Y.; Kumada, H.; Tanaka, H. Status of accelerator-based BNCT projects worldwide. AIP Conf. Proc. 2019, 2160, 050012. [Google Scholar] [CrossRef]
  3. Honda, S.; Yoshihashi, S.; Tomita, S.; Tsuchida, K.; Kiyanagi, Y.; Tsurita, Y.; Watanabe, K.; Yamazaki, A.; Uritani, A. Development of a Sealed Li target as an accelerator-driven neutron source for Boron neutron capture therapy at Nagoya University. Nucl. Instrum. Methods A 2022, 1040, 167140. [Google Scholar] [CrossRef]
  4. Yoshioka, M. Review of accelerator-based boron neutron capture therapy machines. In Proceedings of the 7th International Particle Accelerator Conference (IPAC’16), Busan, Republic of Korea, 8–13 May 2016; pp. 3171–3175. [Google Scholar] [CrossRef]
  5. Porra, L.; Seppala, T.; Wendland, L.; Revitzer, H.; Joensuu, H.; Eide, P.; Koivunoro, H.; Smick, N.; Smick, T.; Tenhunen, M. Accelerator-based boron neutron capture therapy facility at the Helsinki University Hospital. Acta Oncol. 2022, 61, 269–273. [Google Scholar] [CrossRef]
  6. Chen, G.; Xu, S.W.; Xie, Y.H.; Song, Y.T.; Chen, Y.Q.; Hu, C.D.; Zhao, Y.P.; Samsonov, E.V.; Karamysheva, G.; Shirkov, G.; et al. The construction of the inner ion source for SC200 compact superconducting cyclotron. AIP Conf. Proc. 2018, 2011, 090009. [Google Scholar] [CrossRef]
  7. Ji, Q.; Sy, A.; Kwan, J.W. Radio frequency-driven proton source with a back-streaming electron dump. Rev. Sci. Instrum. 2010, 81, 02B312. [Google Scholar] [CrossRef] [Green Version]
  8. Ren, H.T.; Peng, S.X.; Zhang, M.; Zhou, Q.F.; Song, Z.Z.; Yuan, Z.X.; Lu, P.N.; Xu, R.; Zhao, J.; Yu, J.X.; et al. The deuteron injector progress of the Peking University Neutron Imaging Facility project. Rev. Sci. Instrum. 2010, 81, 02B714. [Google Scholar] [CrossRef]
  9. Gobin, R.; Beauvais, P.; Ismail, A.B.; Bogard, D.; Delferriere, O.; De Menezes, D.; Duperrier, R.; Gauthier, Y.; Harrault, F.; Leroy, P.; et al. ECR light ion sources at CEA/Saclay. Chin. Phys. C 2007, 31, 46–50. [Google Scholar]
  10. Peng, S.X.; Zhang, A.L.; Wu, W.B.; Ma, T.H.; Jiang, Y.X.; Li, K.; Zhang, J.F.; Zhang, T.; Wen, J.M.; Xu, Y.; et al. Plasma simulation and optimization for a miniaturized antenna ECR ion source. Nucl. Instrum. Methods A 2021, 1011, 165586. [Google Scholar] [CrossRef]
  11. Wen, J.M.; Peng, S.X.; Ren, H.T.; Zhang, T.; Zhang, J.F.; Wu, W.B.; Sun, J.; Guo, Z.Y.; Chen, J.E. A miniaturized 2.45 GHz ECR ion source at Peking University. Chin. Phys. B 2018, 27, 055204. [Google Scholar] [CrossRef]
  12. Fatkullin, R.; Bogomolov, S.; Efremov, A.; Loginov, V.; Kostukhov, Y.; Bondarchenko, A. Current status of the compact 2.45 GHz ECR Ion Source at FLNR JINR. EPJ Web. Conf. 2019, 201, 08002. [Google Scholar] [CrossRef] [Green Version]
  13. Delferrière, O.; Gobin, R.; Harrault, F.; Nyckees, S.; Sauce, Y.; Tuske, O. Advanced light ion source extraction system for a new electron cyclotron resonance ion source geometry at Saclay. Rev. Sci. Instrum. 2012, 83, 02A307. [Google Scholar] [CrossRef]
  14. Shimada, M.; Watanabe, I.; Torii, Y. Compact electron cyclotron resonance ion source with high density plasma. J. Vac. Sci. Technol. A 1991, 9, 707–710. [Google Scholar] [CrossRef]
  15. Qian, C.; Chen, Z.; Wu, Q.; Zhang, W.H.; Wang, Y.; Yang, Y.; Ma, H.Y.; Fang, X.; Sun, L.T.; Zhang, X.Z.; et al. Microwave impedance matching of A 2.45 GHz ECR ion source. Nucl. Phys. Rev. 2013, 30, 32–37. [Google Scholar] [CrossRef]
  16. Swaroop, R.; Kumar, N.; Rodrigues, G.; Kanjilal, D.; Banerjee, I.; Mahapatra, S.K. Design and development of a compact ion implanter and plasma diagnosis facility based on a 2.45 GHz microwave ion source. Rev. Sci. Instrum. 2021, 92, 053306. [Google Scholar] [CrossRef]
  17. Misra, A.; Pandit, V.S. Studies on the coupling transformer to improve the performance of microwave ion source. Rev. Sci. Instrum. 2014, 85, 063301. [Google Scholar] [CrossRef]
  18. Wang, P. The Parameter Calculation for Ridge Waveguide. Fire Control Radar Technol. 2004, 3, 014. [Google Scholar] [CrossRef]
  19. Sun, W.M.; Balanis, C.A. MFIE analysis and design of ridged waveguides. IEEE Trans. Microw. Theory 1993, 41, 1965–1971. [Google Scholar] [CrossRef]
  20. Hagelaar, G.J.M.; Makasheva, K.; Garrigues, L.; Boeuf, J.P. Modelling of a dipolar microwave plasma sustained by electron cyclotron resonance. J. Phys. D Appl. Phys. 2009, 42, 194019. [Google Scholar] [CrossRef]
  21. Mallick, C.; Bandyopadhyay, M.; Kumar, R. Spatio-temporal evolution of electric field inside a microwave discharge plasma during initial phase of ignition and its effect on power coupling. Phys. Plasmas 2019, 26, 043507. [Google Scholar] [CrossRef] [Green Version]
  22. Mallick, C.; Bandyopadhyay, M.; Kumar, R. Plasma characterization of a microwave discharge ion source with mirror magnetic field configuration. Rev. Sci. Instrum. 2018, 89, 125112. [Google Scholar] [CrossRef]
  23. Kinder, R.L.; Kushner, M.J. Consequences of mode structure on plasma properties in electron cyclotron resonance sources. J. Vac. Sci. Technol. A 1999, 17, 2421–2430. [Google Scholar] [CrossRef]
  24. Gammino, S.; Ciavola, G. ECR ion sources and scaling laws. In Proceedings of the 14th International Conference, Cyclotrons and Their Applications, Cape Town, South Africa, 8–13 October 1995; pp. 377–380. [Google Scholar] [CrossRef]
  25. Cortazar, O.D.; Megia-Macias, A.; Vizcaino-de-Julian, A. Experimental Study of Breakdown Time in a Pulsed 2.45-GHz ECR Hydrogen Plasma Reactor. IEEE Trans. Plasma Sci. 2012, 40, 3409–3419. [Google Scholar] [CrossRef]
  26. Song, Z.Z.; Peng, S.X.; Yu, J.X.; Ming, J.C.; Yuan, Z.Y.; Qian, F.; Guo, Z.Y. Minipermanent magnet high-current microwave ion source. Rev. Sci. Instrum. 2006, 77, 03A305. [Google Scholar] [CrossRef]
  27. Wei, X.B.; Li, G.P.; Pan, X.D.; Wu, Q.; Liu, Y.G. Proton beam intensity and proton fraction measurement of the 2.45 GHz ECR ion source. J. Instrum. 2020, 15, T04005. [Google Scholar] [CrossRef]
  28. Liu, Y.G.; Ke, J.L.; Zhao, G.Y.; Lou, B.C.; Hu, Y.H.; Liu, R. Effect of magnetic field distribution on ECR ion source discharge. Nucl. Sci. Tech. 2018, 29, 126. [Google Scholar] [CrossRef]
  29. Ke, J.L.; Liu, Y.G.; Liu, B.L.; Hu, Y.H.; Liu, M.; Tang, J.; Zheng, P.; Li, Y.; Wu, C.L.; Lou, B.C. Development of a Compact Deuterium–Deuterium Neutron Generator for Prompt Gamma Neutron Activation Analysis. Instrum. Exp. Tech. 2020, 63, 616–620. [Google Scholar] [CrossRef]
  30. Liu, Y.G.; Liu, J.L.; Wu, Q.; Sun, L.T. Ion beam production with an antenna type 2.45 GHz electron cyclotron resonance ion source. Rev. Sci. Instrum. 2020, 91, 023301. [Google Scholar] [CrossRef]
  31. Jiang, Y.; Peng, S.; Wu, W.; Ma, T.; Zhang, J.; Ren, H.; Li, K.; Zhang, T.; Wen, J.; Xu, Y. A miniaturized ECR plasma flood gun for wafer charge neutralization. Rev. Sci. Instrum. 2020, 91, 033319. [Google Scholar] [CrossRef]
Figure 1. The main structure of the high-voltage accelerator and the internal distribution of the high-voltage spherical shell: (a) is the main body of the accelerator; (b) is the distribution inside the spherical shell.
Applsci 13 08831 g001
Figure 2. Structural components of the physical computational model: (a) structural model for calculating the transmission of the miniature microwave system; (b) structural model of the source body for calculating the discharge inside the discharge cavity.
Applsci 13 08831 g002
Figure 3. Structural model of the ECR ion source experimental platform equipped with a conventional microwave transmission system and microwave transmission measurement results of the ion source: (a) is a three-dimensional structural model of the ECR ion source experimental platform equipped with a conventional microwave transmission system; (b) is a physical drawing of the experimental platform and microwave transmission measurement results of the ion source.
Applsci 13 08831 g003
Figure 4. The electric field distribution at 2.45 GHz for the microwave transmission system of the three schemes is as follows: (a) is a regular-length waveguide plus transition waveguide; (b) is a regular-length waveguide plus ridge waveguide; (c) is a reduced-length waveguide plus ridge waveguide.
Applsci 13 08831 g004
Figure 5. The transmission performance of the three schemes: (a) is the distribution of the scattering parameter S11 in the 2−3 GHz frequency band; (b) is the 2−3 GHz frequency band distribution of transmission efficiency into the discharge chamber.
Applsci 13 08831 g005
Figure 6. Spatial variation in electron density at different cavity sizes: (a) is the electron density distribution variation with discharge cell radius; (b) is the electron density variation with the length of the discharge cell.
Applsci 13 08831 g006
Figure 7. The number of particles, the average electron density, and the maximum electron density varies with the cavity: (a) is the number of particles, the average electron density, and the maximum electron density contrast with the radius of the discharge chamber. (b) is the number of particles, the average electron density, and the maximum electron density compared with the discharge chamber’s length.
Applsci 13 08831 g007
Figure 8. Three classic axial distributions and corresponding contour distributions: (a) is three classical axial distributions; (bd) are contour distributions of the flat magnetic field, Gaussian magnetic field, and saddle magnetic field, respectively (860 G–5 G–890 G).
Applsci 13 08831 g008
Figure 9. The average electron density and average electron temperature change in the time domain: (a) is the electron density; (b) is the electron temperature.
Applsci 13 08831 g009
Figure 10. Electron density under different magnetic field distributions: (a) is a flat magnetic field; (b) is a Gaussian-distributed magnetic field; (c) is a saddle-shaped magnetic field.
Applsci 13 08831 g010
Figure 11. The influence of particle number and average electron density on the magnetic fields of seven different valley points: (a) is the axial distribution of saddle-shaped magnetic fields at seven kinds of valley points; (b) the number of particles, the average electron density, and the maximum electron density varies with the valley point.
Applsci 13 08831 g011
Table 1. Design index of the high-voltage accelerator.
Index ParameterDesign Indexes
Maximum energy2.5 MeV
Maximum current intensity15 mA
Minimum current intensity10 mA
Energy stability≤0.5%
Beam scanning range100 mm × 100 mm
Table 2. Design parameters of the ion source system.
Index ParameterDesign Indexes
Beam intensity≥20 mA
Extraction voltage40 kV
Proton ratio≥85%
Normalized emittance≤0.25 π mm. mrad
External contour size600 mm(length) × 300 mm(width) × 300 mm(high)
Maximum magnetic field1100 G
Vacuum level10−5 Pa–10−3 Pa
Microwave frequency2.45 GHz
Microwave power300 W–500 W
Table 3. Comparison of proton sources currently operating on accelerator facilities.
OrganizationIon Source TypeIon SpeciesExtraction Voltage (kV)Beam (mA)
Institute of Plasma Physics, CAS [6]Penning ion sourceH+400.1
Lawrence Berkeley National Laboratory [7]High frequency sourceH+15.516
Peking University [8]ECR sourceH+50100
CEA/Saclay [9]ECR sourceH+85>100
Table 4. Comparison of ECR ion source parameters in accelerator facilities.
OrganizationMicrowave Transmission ModeOverall Size of the Ion Source System (mm)Miniaturized ComponentPower (W)Magnetic Field Generation ModeExtraction Voltage (kV)Beam (mA)
Peking University [10,11]waveguide + coaxial line>600 (without coaxial line length)microwave system + discharge chamber180permanent magnet ring4021.7
antenna + coaxial line<200 (without coaxial line length)microwave system + discharge chamber200permanent magnet ring354.5
Institute for Theoretical and Experimental Physics(ITEP) [12]coaxial line<200 (without coaxial line length)microwave system + discharge chamber100permanent magnet ring150.5
CEA/Saclay [13]waveguide>1000 mmextraction system--focus coil5048.5
Our workwaveguide<350 mmmicrowave system + discharge chamber>300permanent magnet ring40>20
Disclaimer/Publisher’s Note: The statements, opinions and data contained in all publications are solely those of the individual author(s) and contributor(s) and not of MDPI and/or the editor(s). MDPI and/or the editor(s) disclaim responsibility for any injury to people or property resulting from any ideas, methods, instructions or products referred to in the content.

