
The Use of a 3D Image Comparison Program for Dental Identification

 , and
, and
Abstract
:1. Introduction
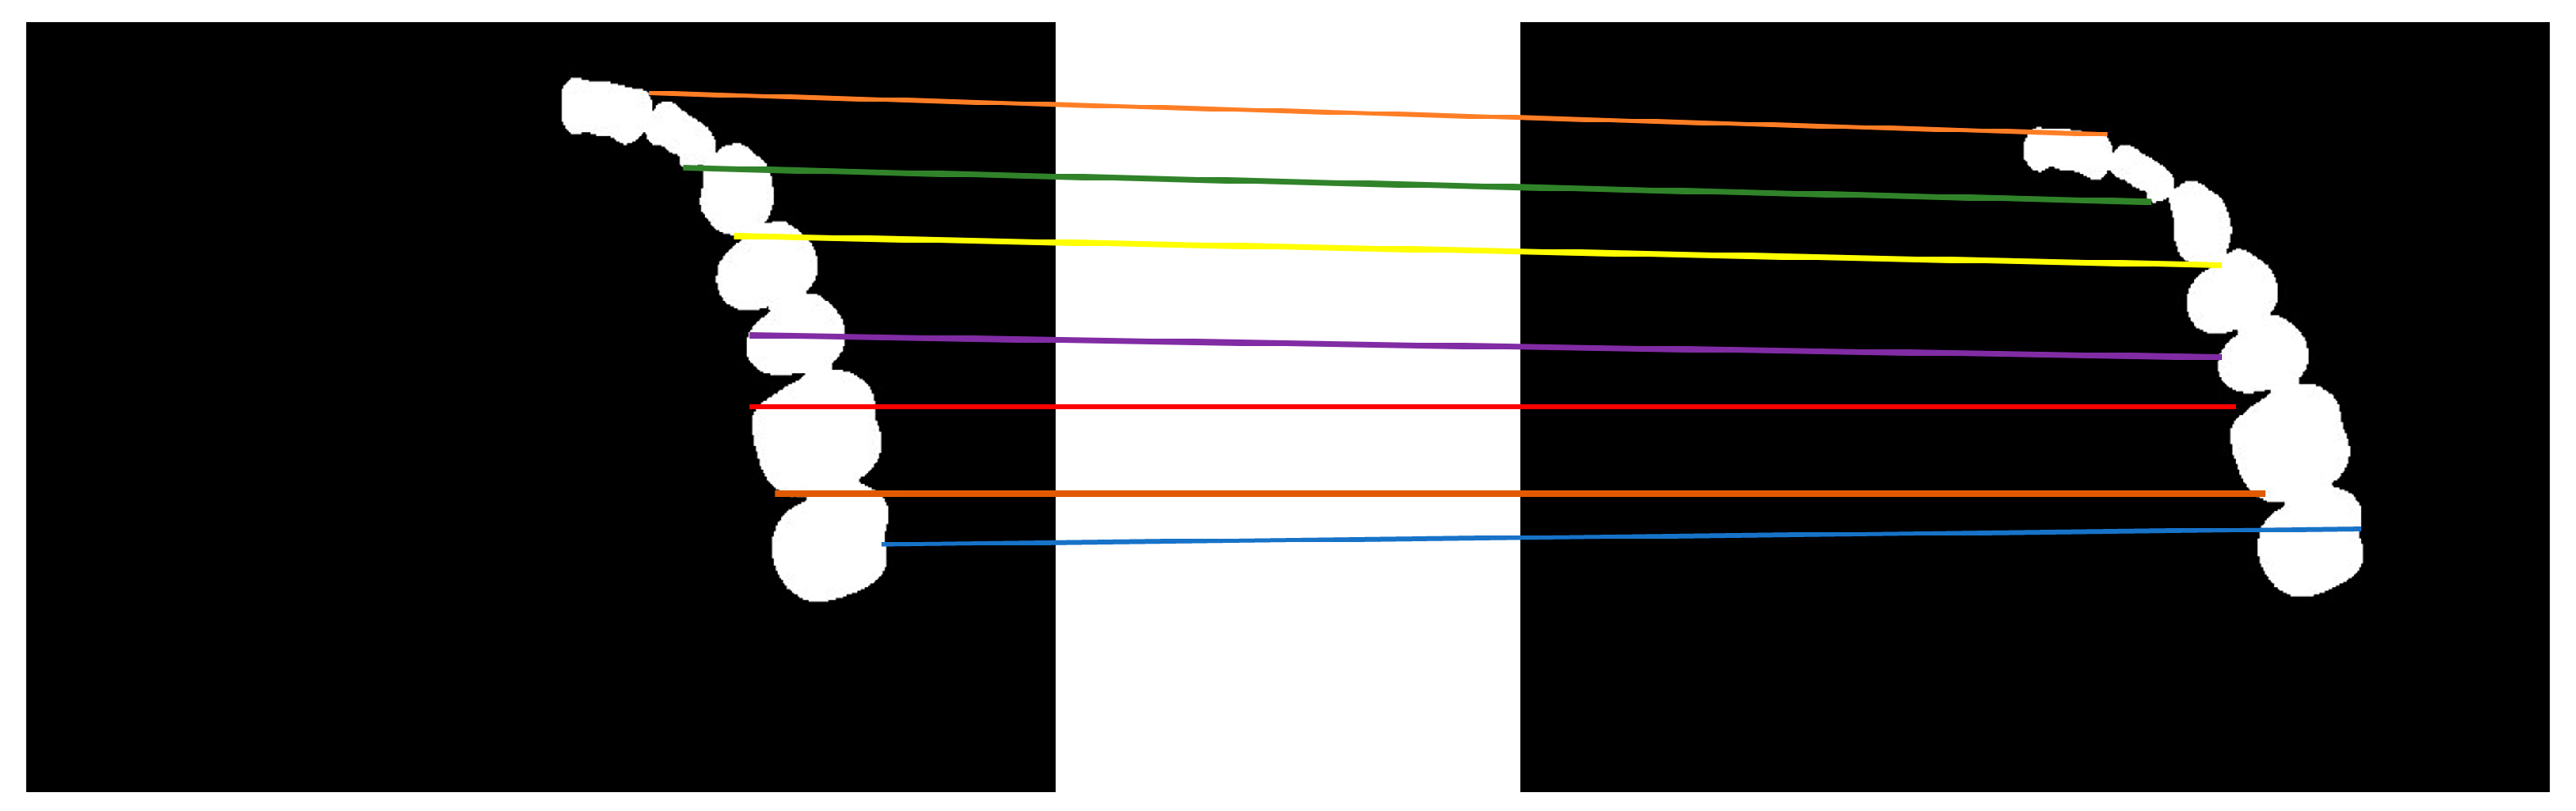
2. Materials and Methods
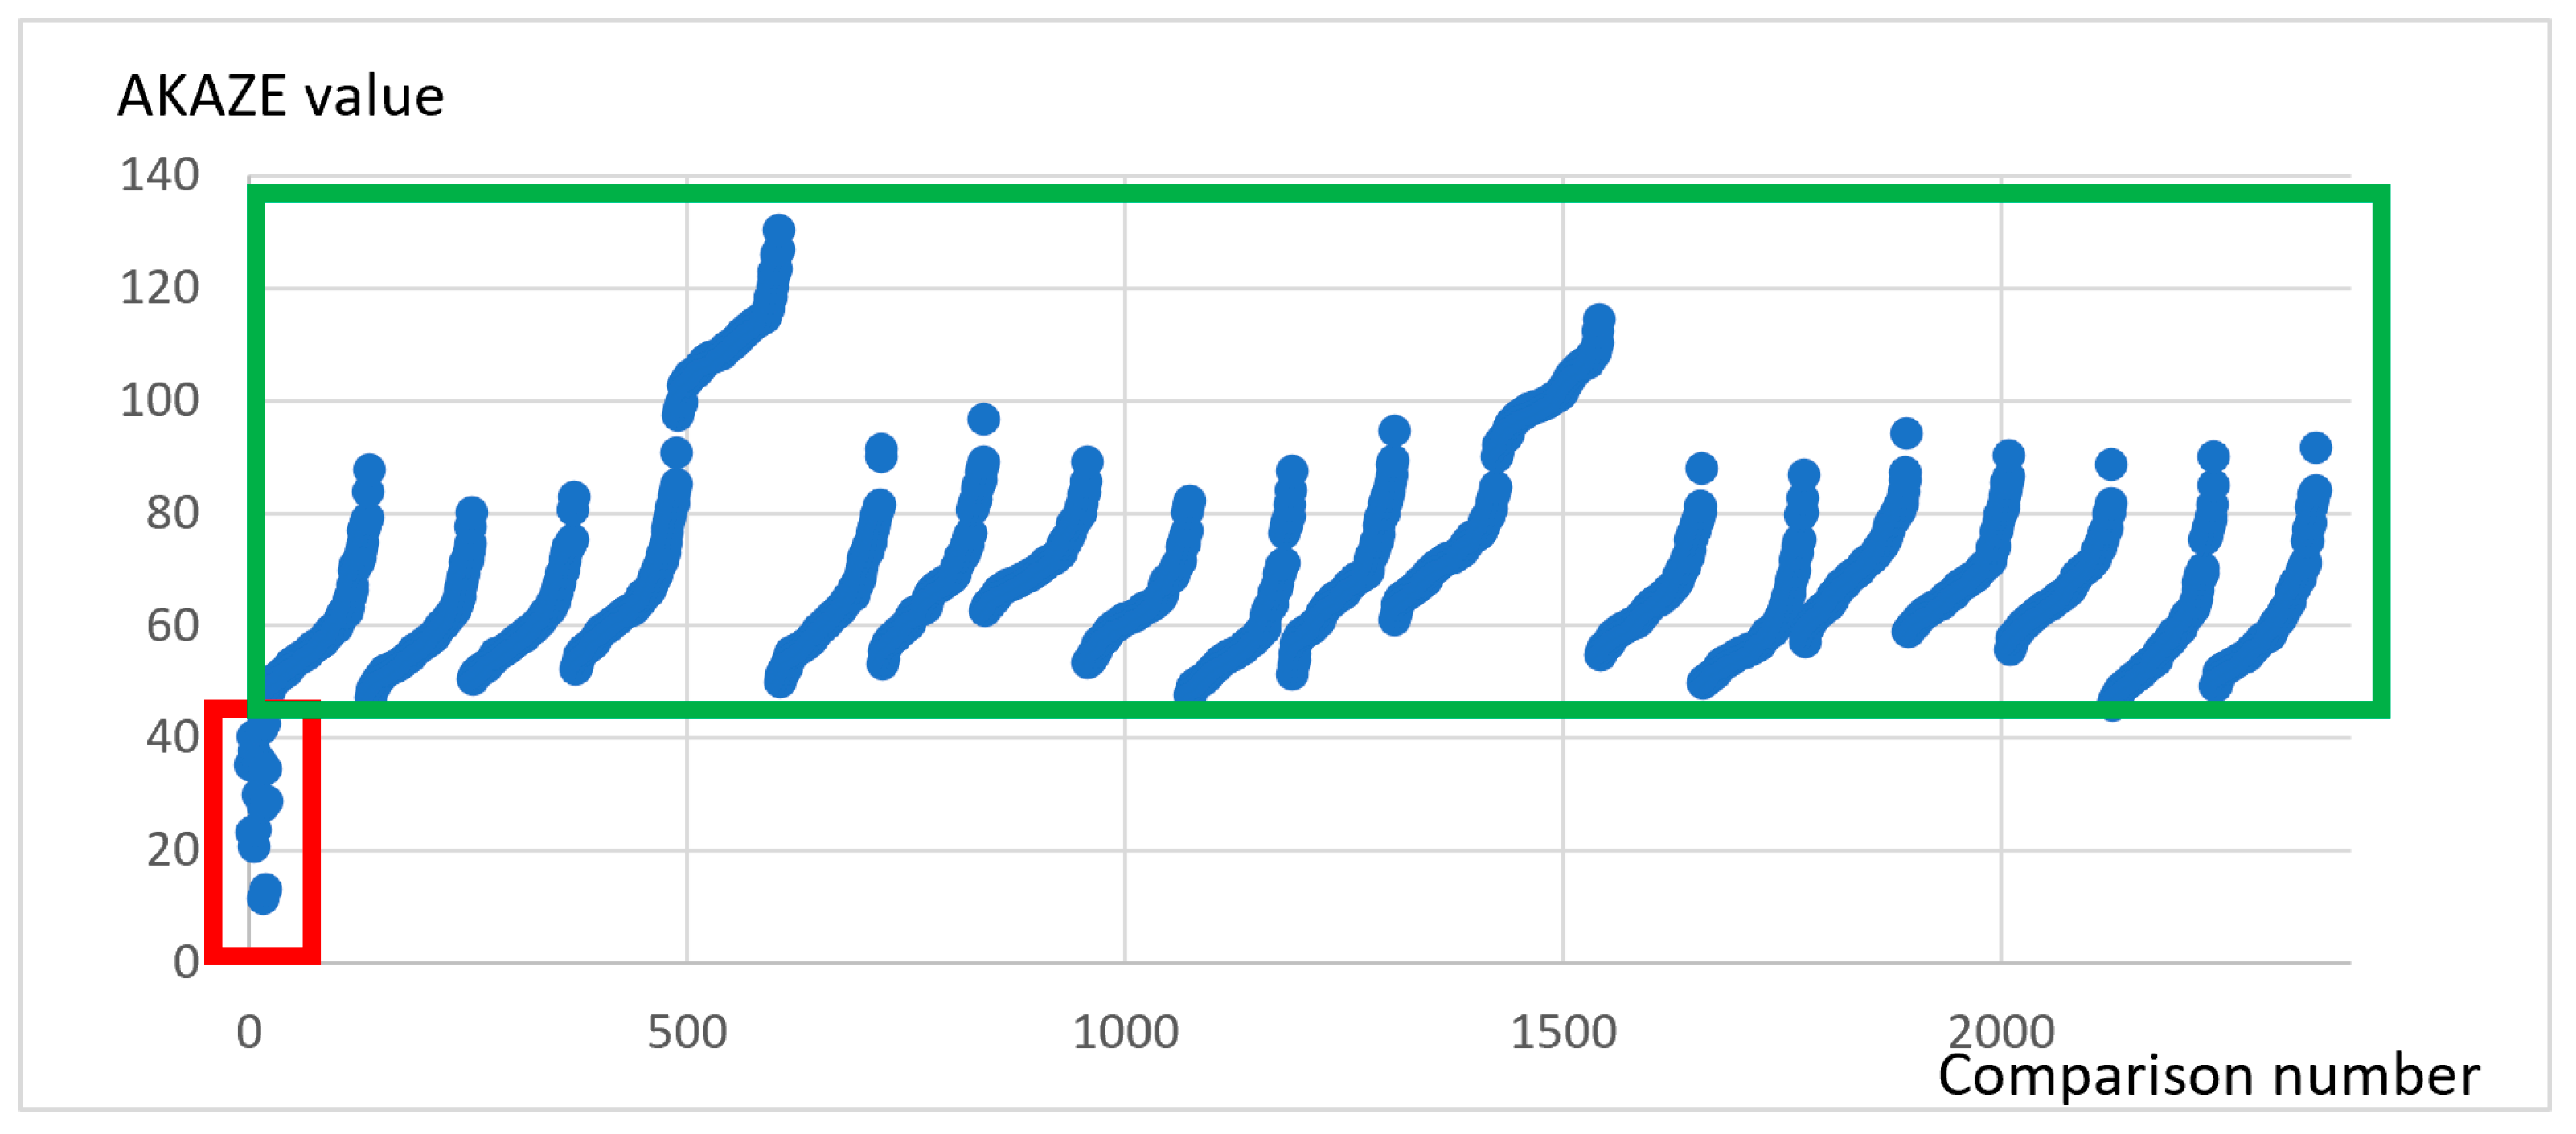
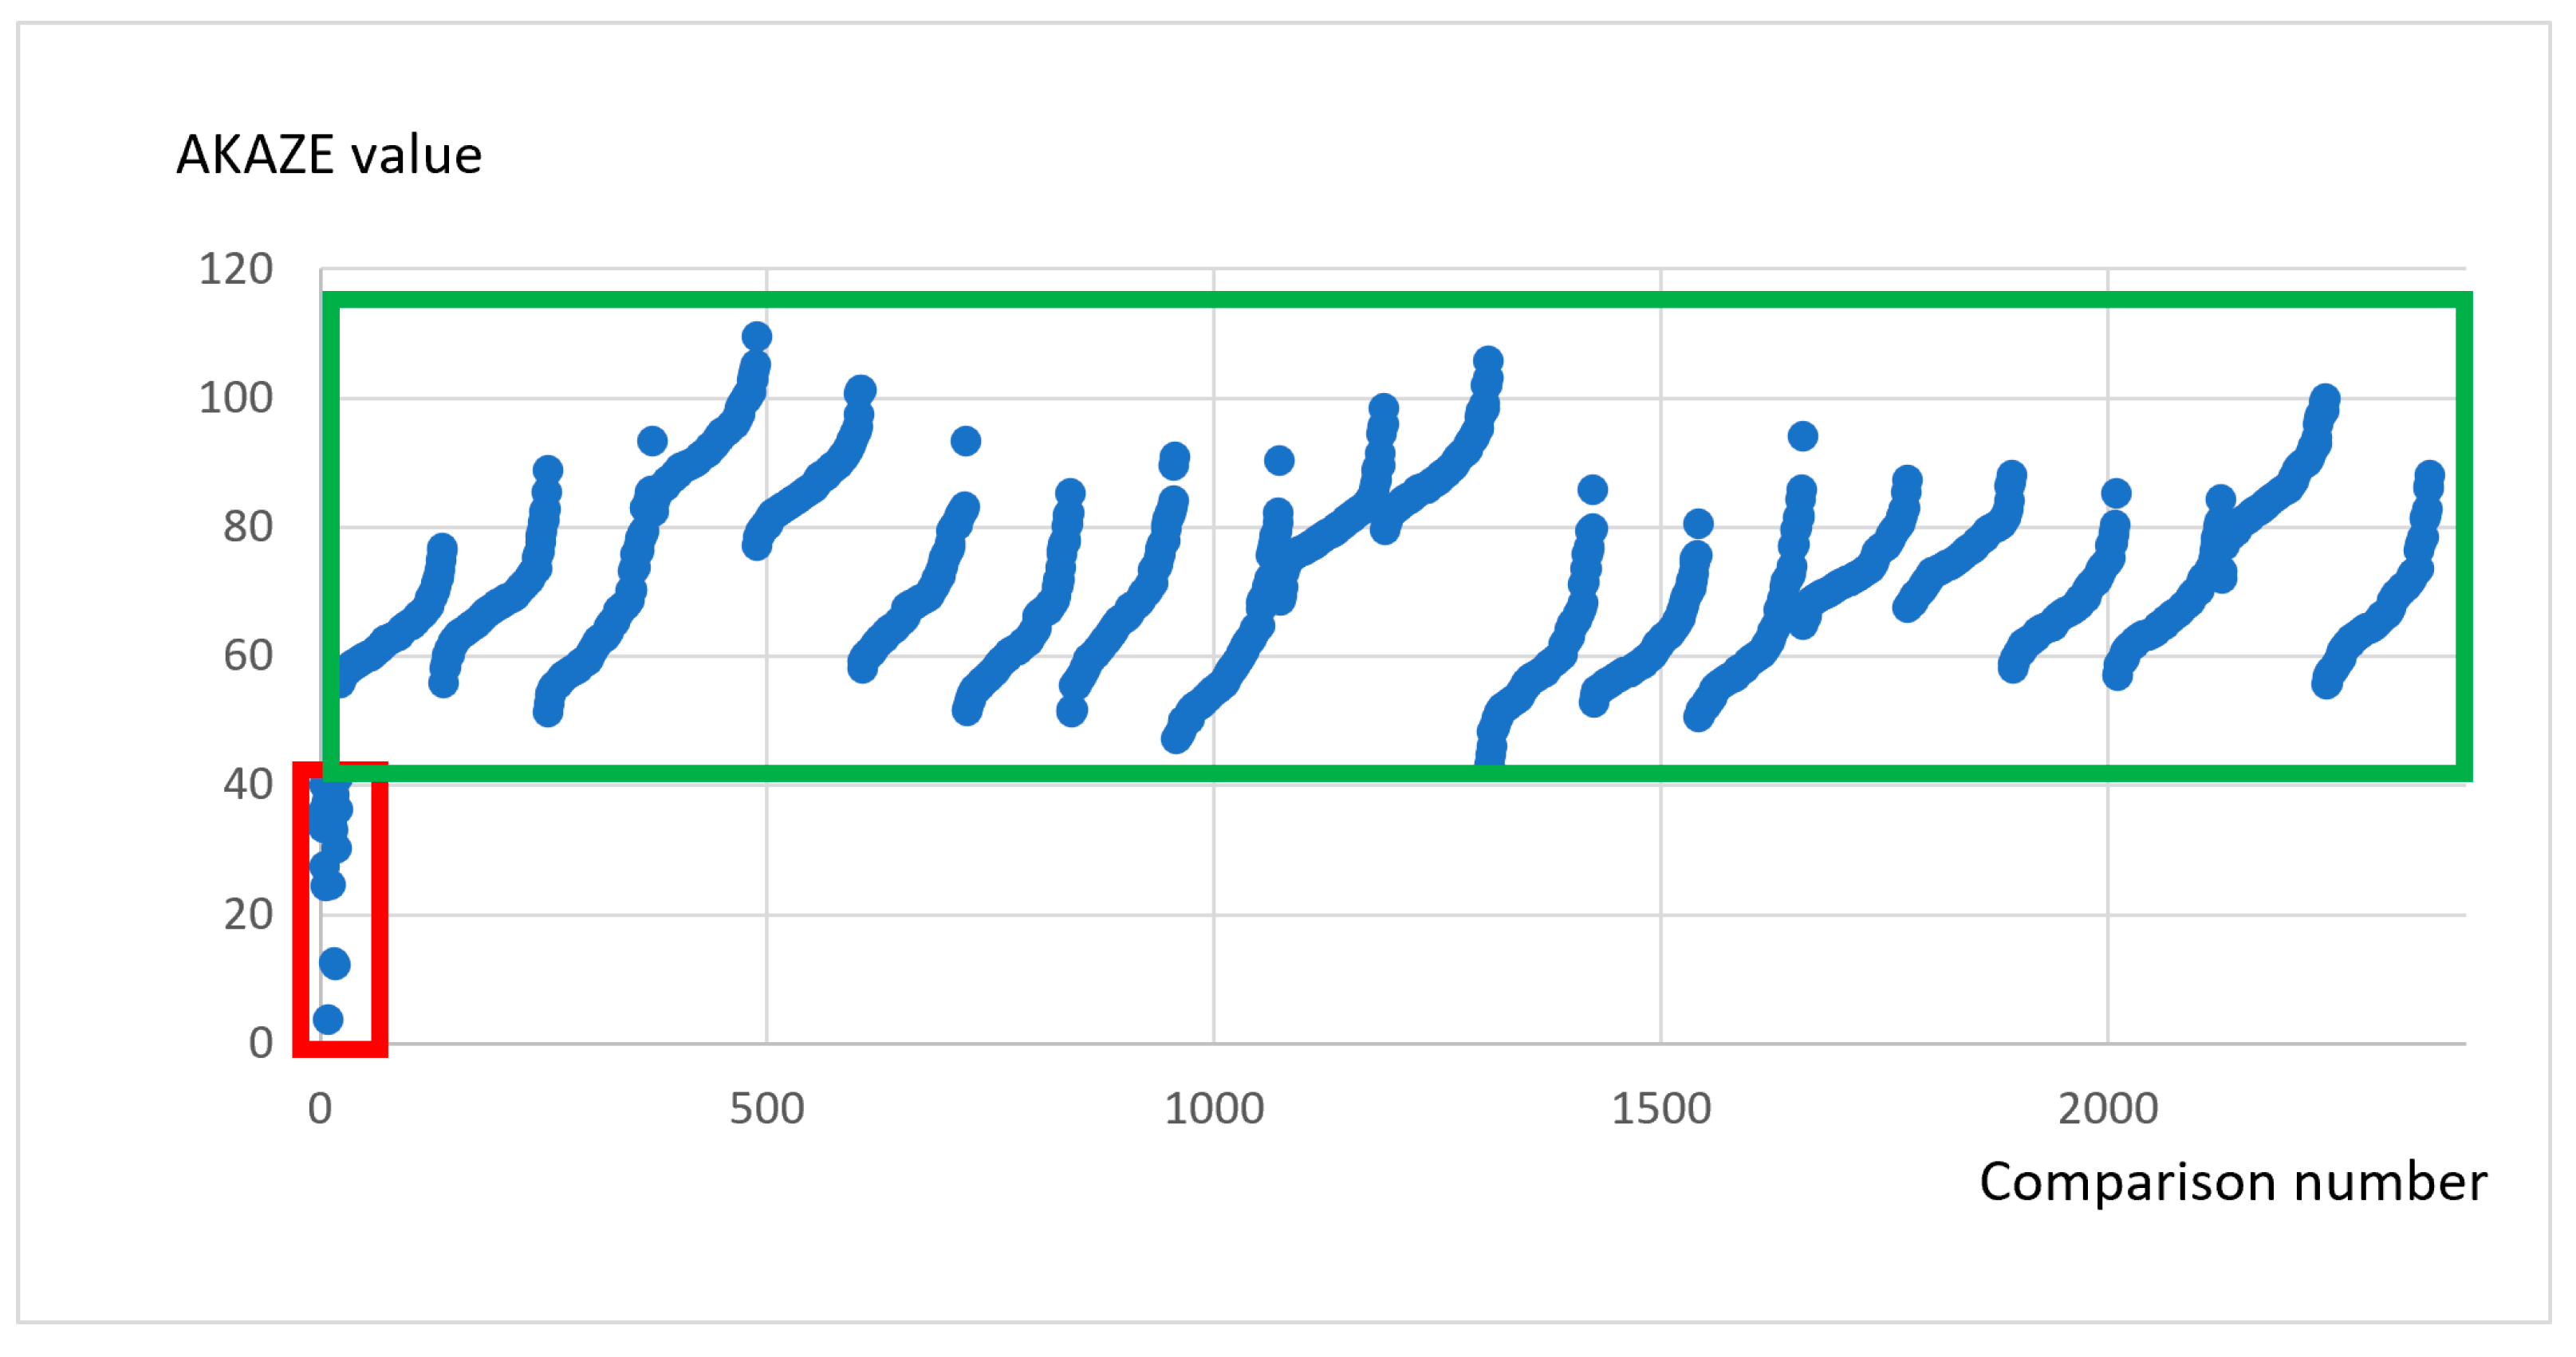
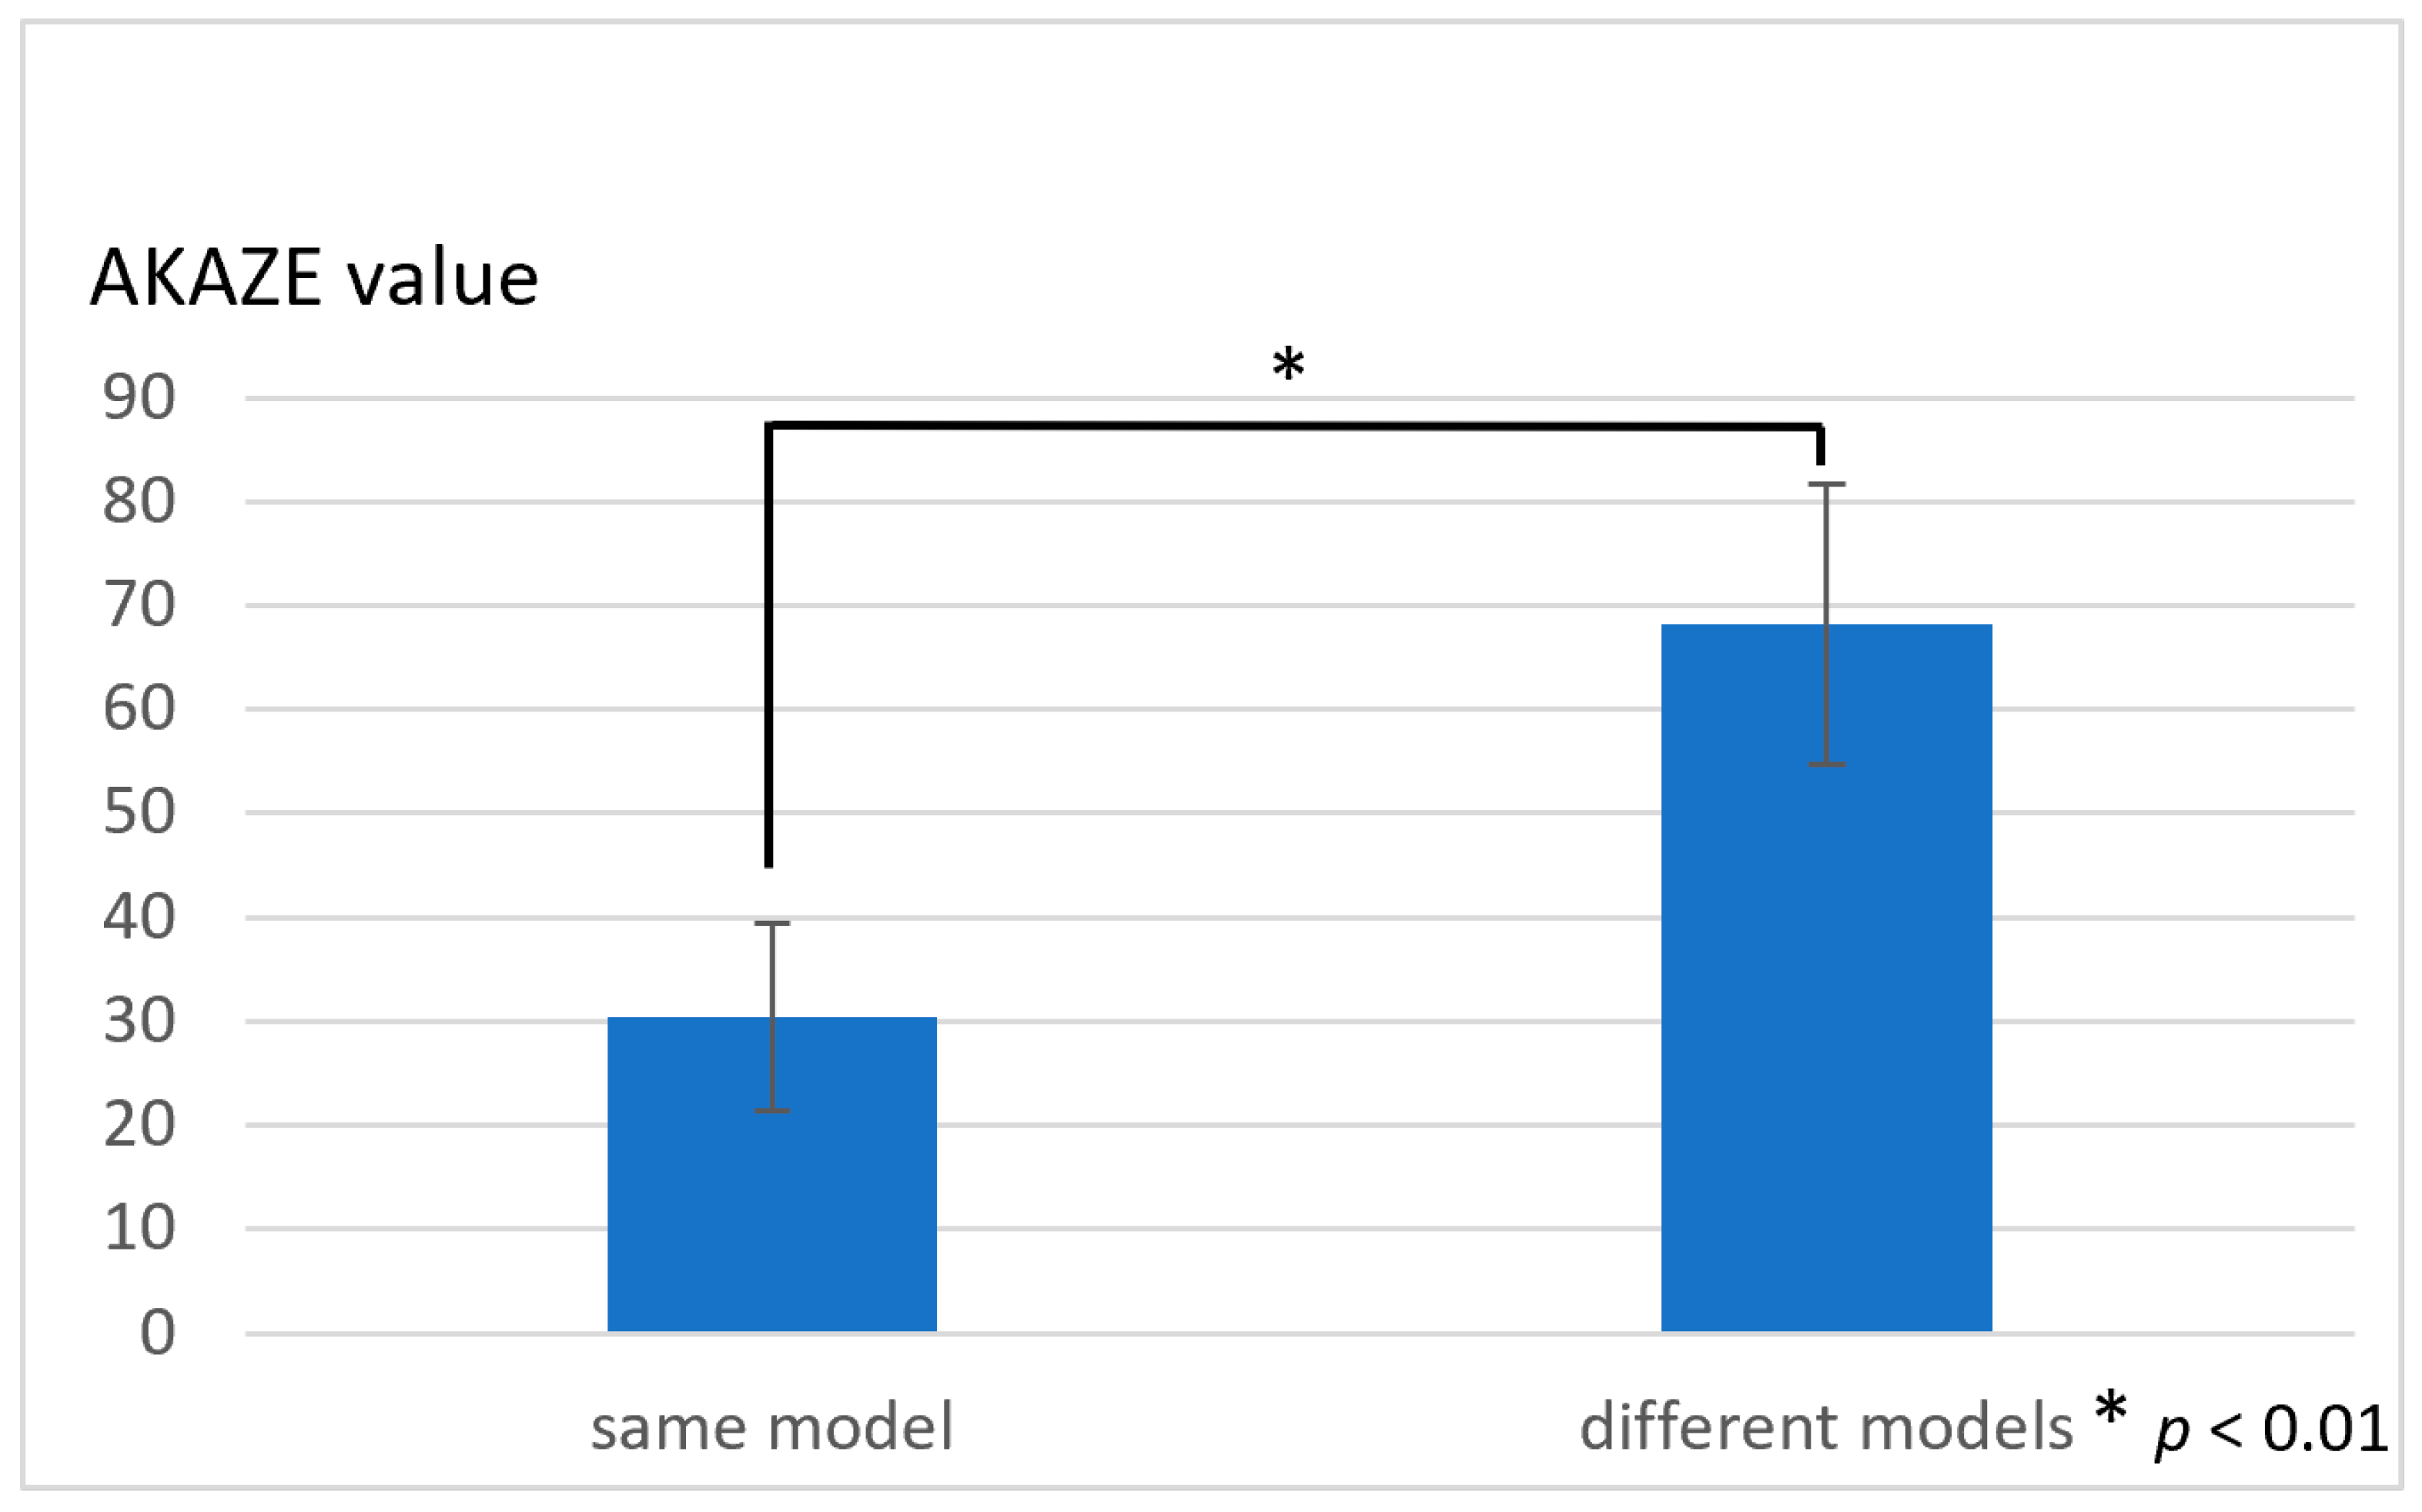
3. Results
4. Discussion
5. Conclusions
Author Contributions
Funding
Institutional Review Board Statement
Informed Consent Statement
Data Availability Statement
Conflicts of Interest
References
- Aoki, T.; Ito, K.; Aoyama, S.; Kosuge, E. Disaster victim identification using dental records—Experience of the Great East Japan Earthquake. In Proceedings of the 2013 IEEE Region 10 Humanitarian Technology Conference, Sendai, Japan, 26–29 August 2013; pp. 57–62. [Google Scholar] [CrossRef]
- National Police Agency. Special Feature I. The Great East Japan Earthquake and Police Activities. Available online: https://www.npa.go.jp/hakusyo/h23/youyakuban/youyakubann.pdf (accessed on 1 April 2023).
- Japan Dental Association. Identification Manual. Available online: https://www.jda.or.jp/dentist/disaster/pdf/identity-manual.pdf (accessed on 1 April 2023).
- National Police Agency. Special-5: Status of Identification of Bodies in the Great East Japan Earthquake (as of 11 May 2012), 2012 National Police Agency, White Paper on Police Statistics, National Police Agency. 2012. Available online: https://www.npa.go.jp (accessed on 1 April 2023).
- Sakuma, A.; Saitoh, H.; Katsumura, S.; Kumagai, A.; Oka, H.; Motomura, A.; Iwase, H. Study on the factors hindering improvement in the success rate of dental identification in disasters in Japan. Jpn. J. Disaster Med. 2021, 26, 1–10. [Google Scholar] [CrossRef]
- Kumagai, A. Factors Associated with the Difficulty of Identifying Some Victims of the Great East Japan Earthquake. Kanagawa Shigaku 2015, 50, 96–102. [Google Scholar]
- Miyazawa, T.; Ueno, M.; Okayama, K.; Yamamoto, M.; Takahashi, T.; Komuro, T.; Takei, T. The examination about agreement or disagreement among the dental findings—On personal identification. Jpn. J. Leg. Med. 1988, 42, 529–538. [Google Scholar]
- Ueno, M. The examination about agreement or disagreement among the dental findings on personal identification (Part 2)—Especially about aging factors. Jpn. J. Leg. Med. 1989, 43, 478–489. [Google Scholar]
- Dental Server. 2016. Available online: https://dental-server.jp/ (accessed on 1 April 2023).
- Alonso, A.; Martín, P.; Albarrán, C.; García, P.; Fernández de Simón, L.; Iturralde, M.J.; Fernández-Rodríguez, A.; Atienza, I.; Capilla, J.; García-Hirschfeld, J.; et al. Challenges of DNA Profiling in Mass Disaster Investigations. Croat. Med. J. 2005, 46, 540–548. [Google Scholar]
- Girish, K.L.; Rahman, F.S.; Tippu, S.R. Dental DNA Fingerprinting in Identification of Human Remains. J. Forensic Dent. Sci. 2010, 2, 63–68. [Google Scholar] [CrossRef] [Green Version]
- Hartman, D.; Drummer, O.; Eckhoff, C.; Scheffer, J.W.; Stringer, P. The Contribution of DNA to the Disaster Victim Identification (DVI) Effort. Forensic Sci. Int. 2011, 205, 52–58. [Google Scholar] [CrossRef]
- Ziętkiewicz, E.; Witt, M.; Daca, P.; Żebracka-Gala, J.; Goniewicz, M.; Jarząb, B.; Witt, M. Current genetic methodologies in the identification of disaster victims and in forensic analysis. J. Appl. Genet. 2012, 53, 41–60. [Google Scholar] [CrossRef] [Green Version]
- Bhange, G.S.; Hiray, S.R. Dental Patient Records Maintenance on Cloud Computing Using Data Protection Model. In Proceedings of the CUBE International Information Technology Conference, Pune, India, 3–5 October 2012; pp. 526–531. [Google Scholar]
- Cappella, A.; Gibelli, D.; Cellina, M.; Mazzarelli, D.; Oliva, A.G.; De Angelis, D.; Sforza, C.; Cattaneo, C. Three-dimensional analysis of sphenoid sinus uniqueness for assessing personal identification: A novel method based on 3D-3D superimposition. Int. J. Leg. Med. 2019, 133, 1895–1901. [Google Scholar] [CrossRef]
- Gibelli, D.; Cellina, M.; Cappella, A.; Gibelli, S.; Panzeri, M.; Oliva, A.; Termine, G.; De Angelis, D.; Cattaneo, C.; Sforza, C. An innovative 3D-3D superimposition for assessing anatomical uniqueness of frontal sinuses through segmentation on CT scans. Int. J. Leg. Med. 2019, 133, 1159–1165. [Google Scholar] [CrossRef]
- Beaini, T.L.; Duailibineto, E.F.; Chilvarquer, I.; Melani, R.F.H. Human identification through frontal sinus 3D superimposition: Pilot study with cone beam computer tomography. J. Forensic Leg. Med. 2015, 36, 63–69. [Google Scholar] [CrossRef]
- Gibelli, D.; Angelis, D.D.; Pucciarelli, V.; Riboli, F.; Ferrario, V.F.; Dolci, C.; Sforza, C.; Cattaneo, C. Application of 3D models of palatal rugae to personal identification: Hints at identification from 3D-3D superimposition techniques. Int. J. Leg. Med. 2018, 132, 1241–1245. [Google Scholar] [CrossRef]
- Gibelli, D.; Angelis, D.D.; Riboli, F.; Dolci, C.; Cattaneo, C.; Sforza, C. Quantification of odontological differences of the upper first and second molar by 3D-3D superimposition: A novel method to assess anatomical matches. Forensic Sci. Med. Pathol. 2019, 15, 570–573. [Google Scholar] [CrossRef]
- Franco, A.; Willems, G.; Souza, P.H.C.; Coucke, W.; Thevissen, P. Uniqueness of the anterior dentition three-dimensionally assessed for forensic bitemark analysis. J. Forensic Leg. Med. 2017, 46, 58–65. [Google Scholar] [CrossRef]
- Chong, G.; Forgie, A. A pilot study to analyze the uniqueness of anterior teeth using a novel three-dimensional approach. J. Forensic Identif. 2017, 67, 381–398. [Google Scholar]
- Reesu, G.V.; Woodsend, B.; Manica, S.; Revie, G.F.; Brown, N.L.; Mossey, P.A. Automated Identification from Dental Data [AutoIDD]: A new development in digital forensics. Forensic Sci. Int. 2020, 309, 110218. [Google Scholar] [CrossRef]
- Abduo, J.; Bennamoun, M. Three-dimensional image registration as a tool for forensic odontology: A preliminary investigation. Am. J. Forensic Med. Pathol. 2013, 34, 260–266. [Google Scholar] [CrossRef]
- Sato, K.; Sakata, M.; Kashima, M.; Watanabe, M. The Research on the Identification System Based on the Dentition Image Analysis. J. Inst. Image Electron. Eng. Jpn. 2014, 43, 79–84. [Google Scholar]
- Lowe, D.G. Distinctive Image Features from Scale-Invariant Keypoints. Int. J. Comput. Vis. 2004, 60, 91–110. [Google Scholar] [CrossRef]
- Alcantarilla, P.F.; Nuevo, J.; Bartoli, A. Fast Explicit Diffusion for Accelerated Features in Nonlinear Scale Spaces. In Proceedings of the British Machine Vision Conference (BMVC), Bristol, UK, 9–13 September 2013. [Google Scholar]
- Nakashima, S.; Morio, T.; Mu, S. AKAZE-Based Visual Odometry from Floor Images Supported by Acceleration Models. IEEE Access 2019, 7, 31103–31109. [Google Scholar] [CrossRef]
- Nabiyev, V.V.; Yılmaz, S.; Günay, A.; Muzaffer, G.; Ulutaş, G. Shredded banknotes reconstruction using AKAZE points. Forensic Sci. Int. 2017, 278, 280–290. [Google Scholar] [CrossRef]
- Khan Tareen, S.A.; Saleem, Z. A Comparative Analysis of SIFT, SURF, KAZE, AKAZE, ORB, and BRISK. In Proceedings of the IEEE Conference on Technologies for Practical Robot Applications (TePRA), Sukkur, Pakistan, 3–4 March 2018. [Google Scholar]
- Bay, H.; Tuytelaars, T.; Gool, V.L. SURF: Speeded Up Robust Features. In Proceedings of the 9th European Conference on Computer Vision, Marseille, France, 12–18 October 2008; Springer: Berlin/Heidelberg, Germany, 2008; pp. 346–359. [Google Scholar]
- Kanda, Y. Investigation of the freely available easy-to-use software ‘EZR’ for medical statistics. Bone Marrow Transpl. 2013, 48, 452–458. [Google Scholar] [CrossRef] [Green Version]
- Pinchi, V.; Norelli, G.A.; Caputi, F.; Fassina, G.; Pradella, F.; Vincenti, C. Dental identification by comparison of antemortem and postmortem dental radiographs: Influence of operator qualifications and cognitive bias. Forensic Sci. Int. 2012, 222, 252–255. [Google Scholar] [CrossRef]
- Woofter, C. The Prevalence and Etiology of Gingival Recession. Periodontal Abstr. 1969, 27, 41–45. [Google Scholar]
- Tugnait, A.; Clerehugh, V. Gingival Recession—Its Significance and Management. J. Dent. 2001, 29, 381–394. [Google Scholar] [CrossRef]
- Krishan, K.; Kanchan, T.; Garg, A.K. Dental Evidence in Forensic Identification—An Overview, Methodology and Present Status. Open Dent. J. 2015, 9, 250–256. [Google Scholar] [CrossRef] [Green Version]


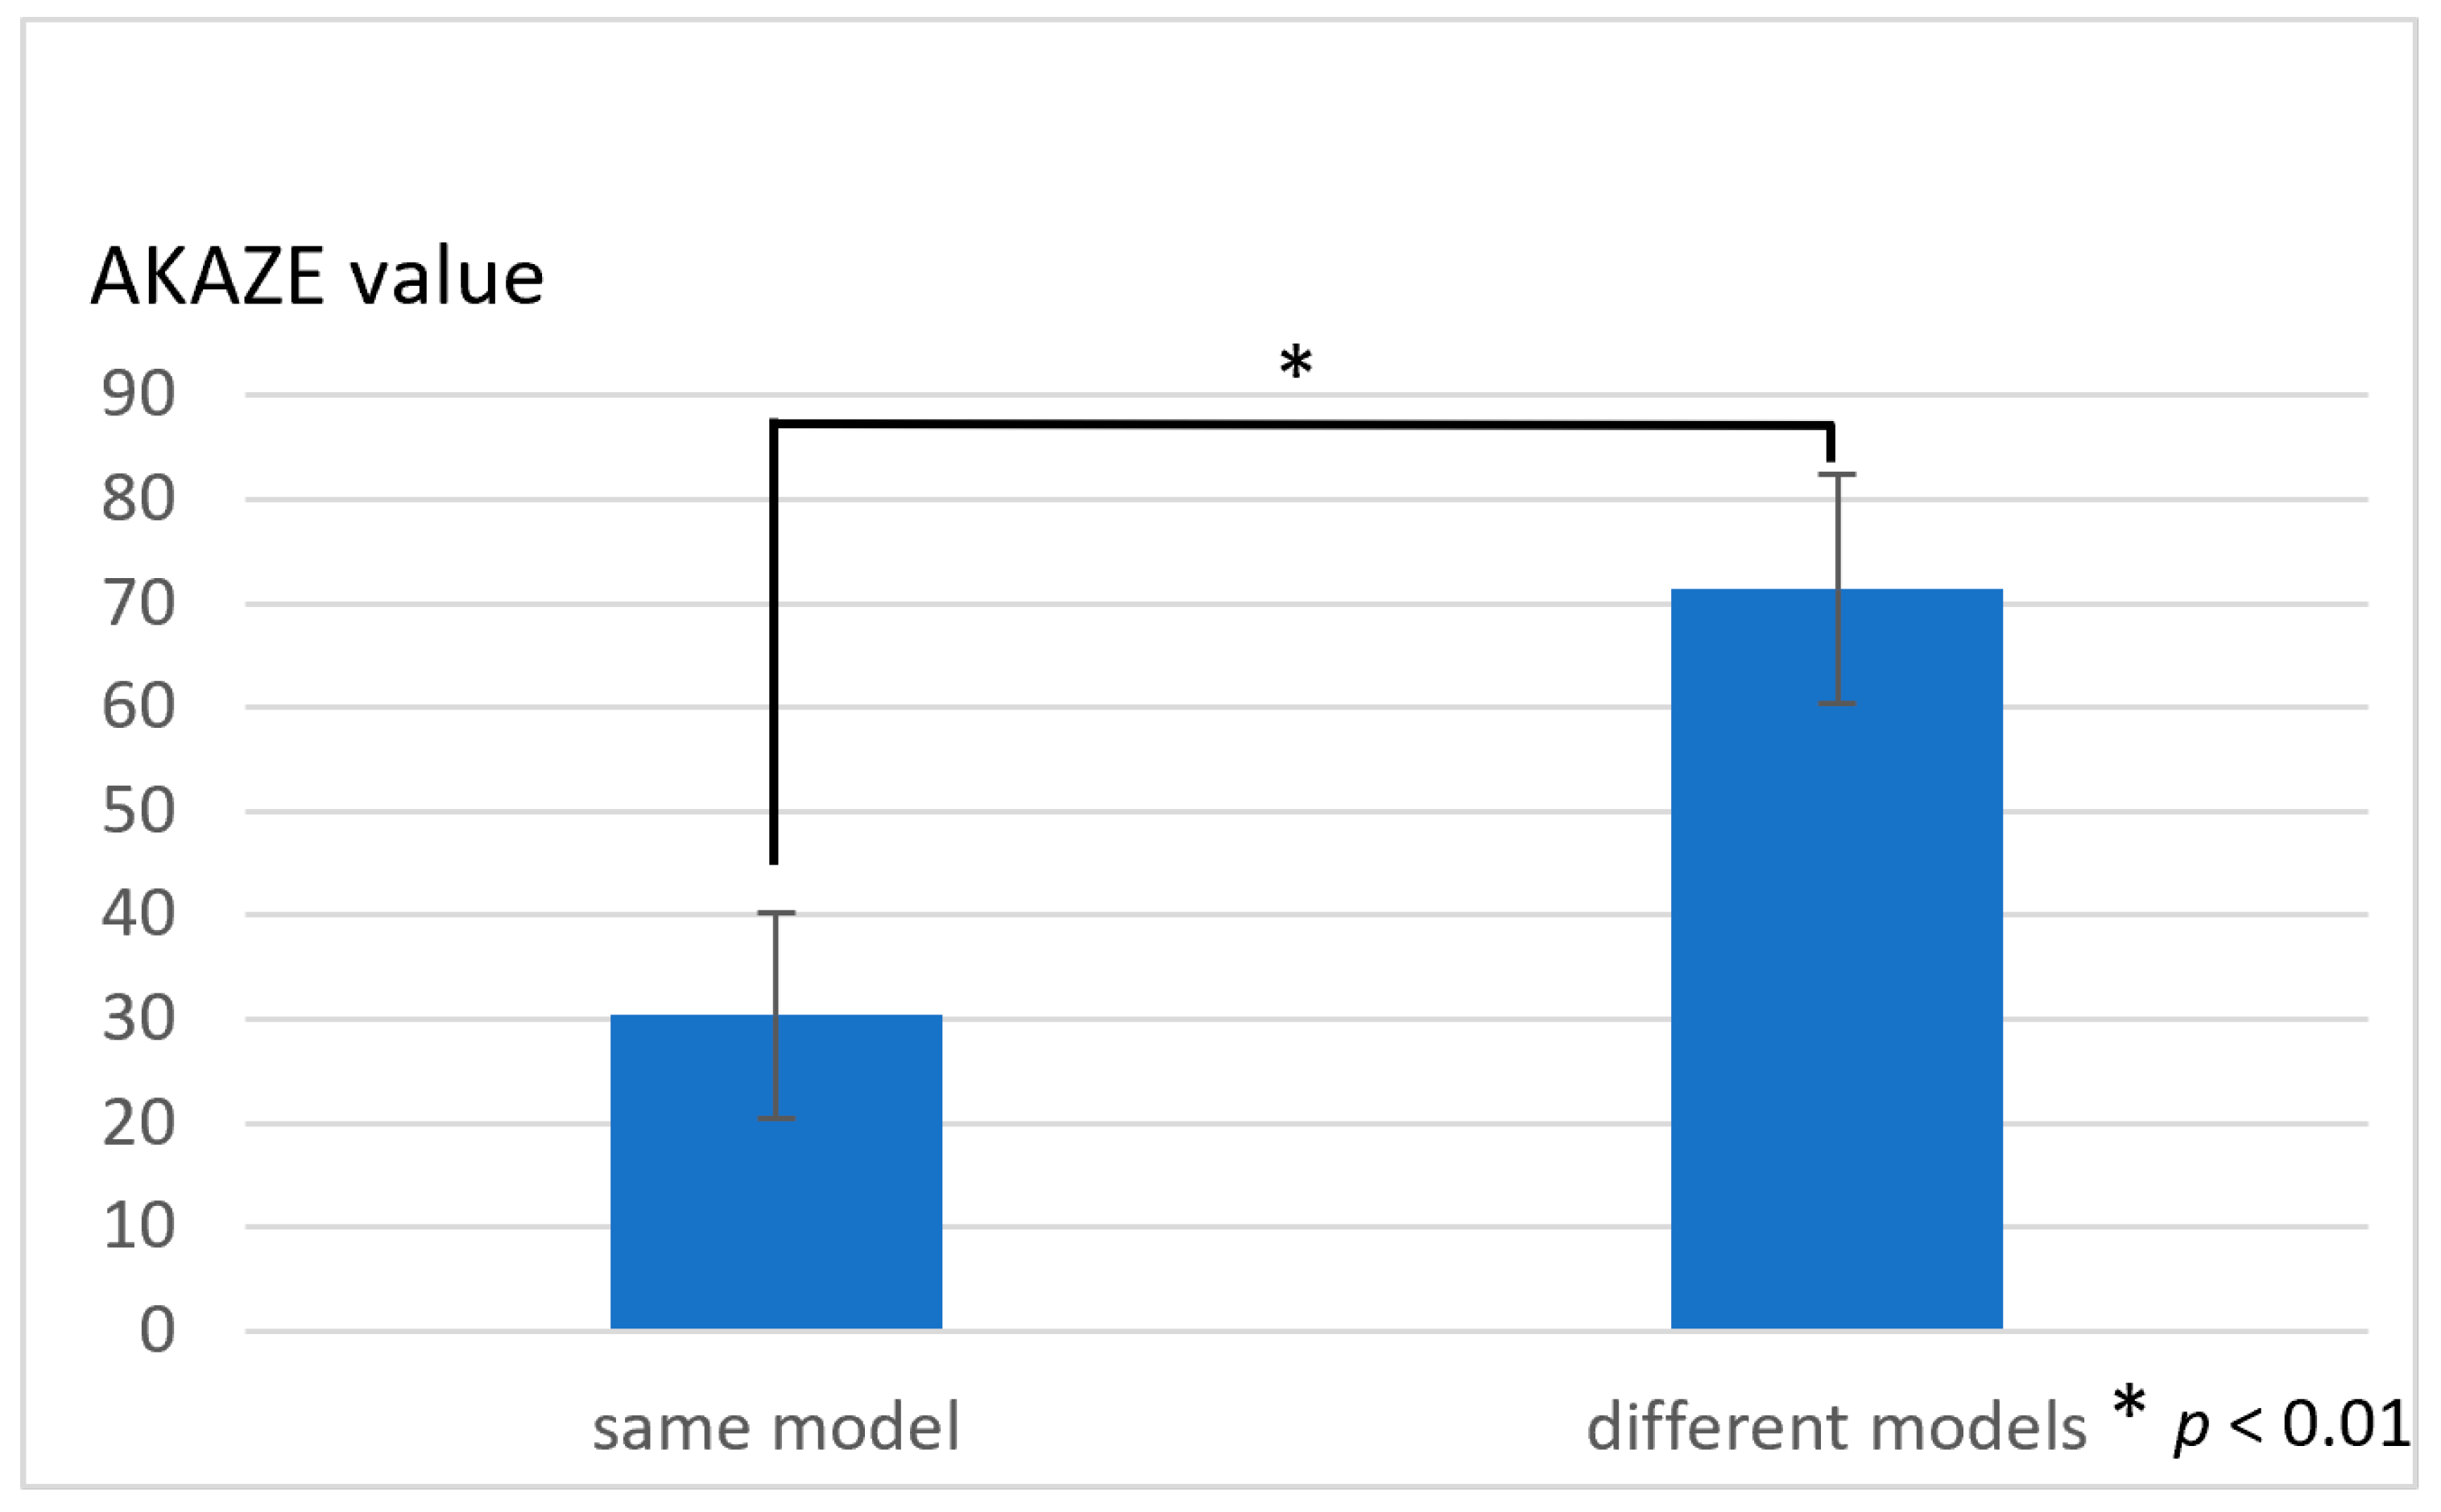
| Mean | SD | p-Value | |
|---|---|---|---|
| Same model | 31.7 | 9.06 | - |
| 1st model | 56.8 | 13.3 | <0.01 * (difference from same model) |
| 2nd model | 57.4 | 13.5 | >0.1 (difference from 1st model) |
| 3rd model | 57.8 | 13.4 | >0.1 (difference from 2nd model) |
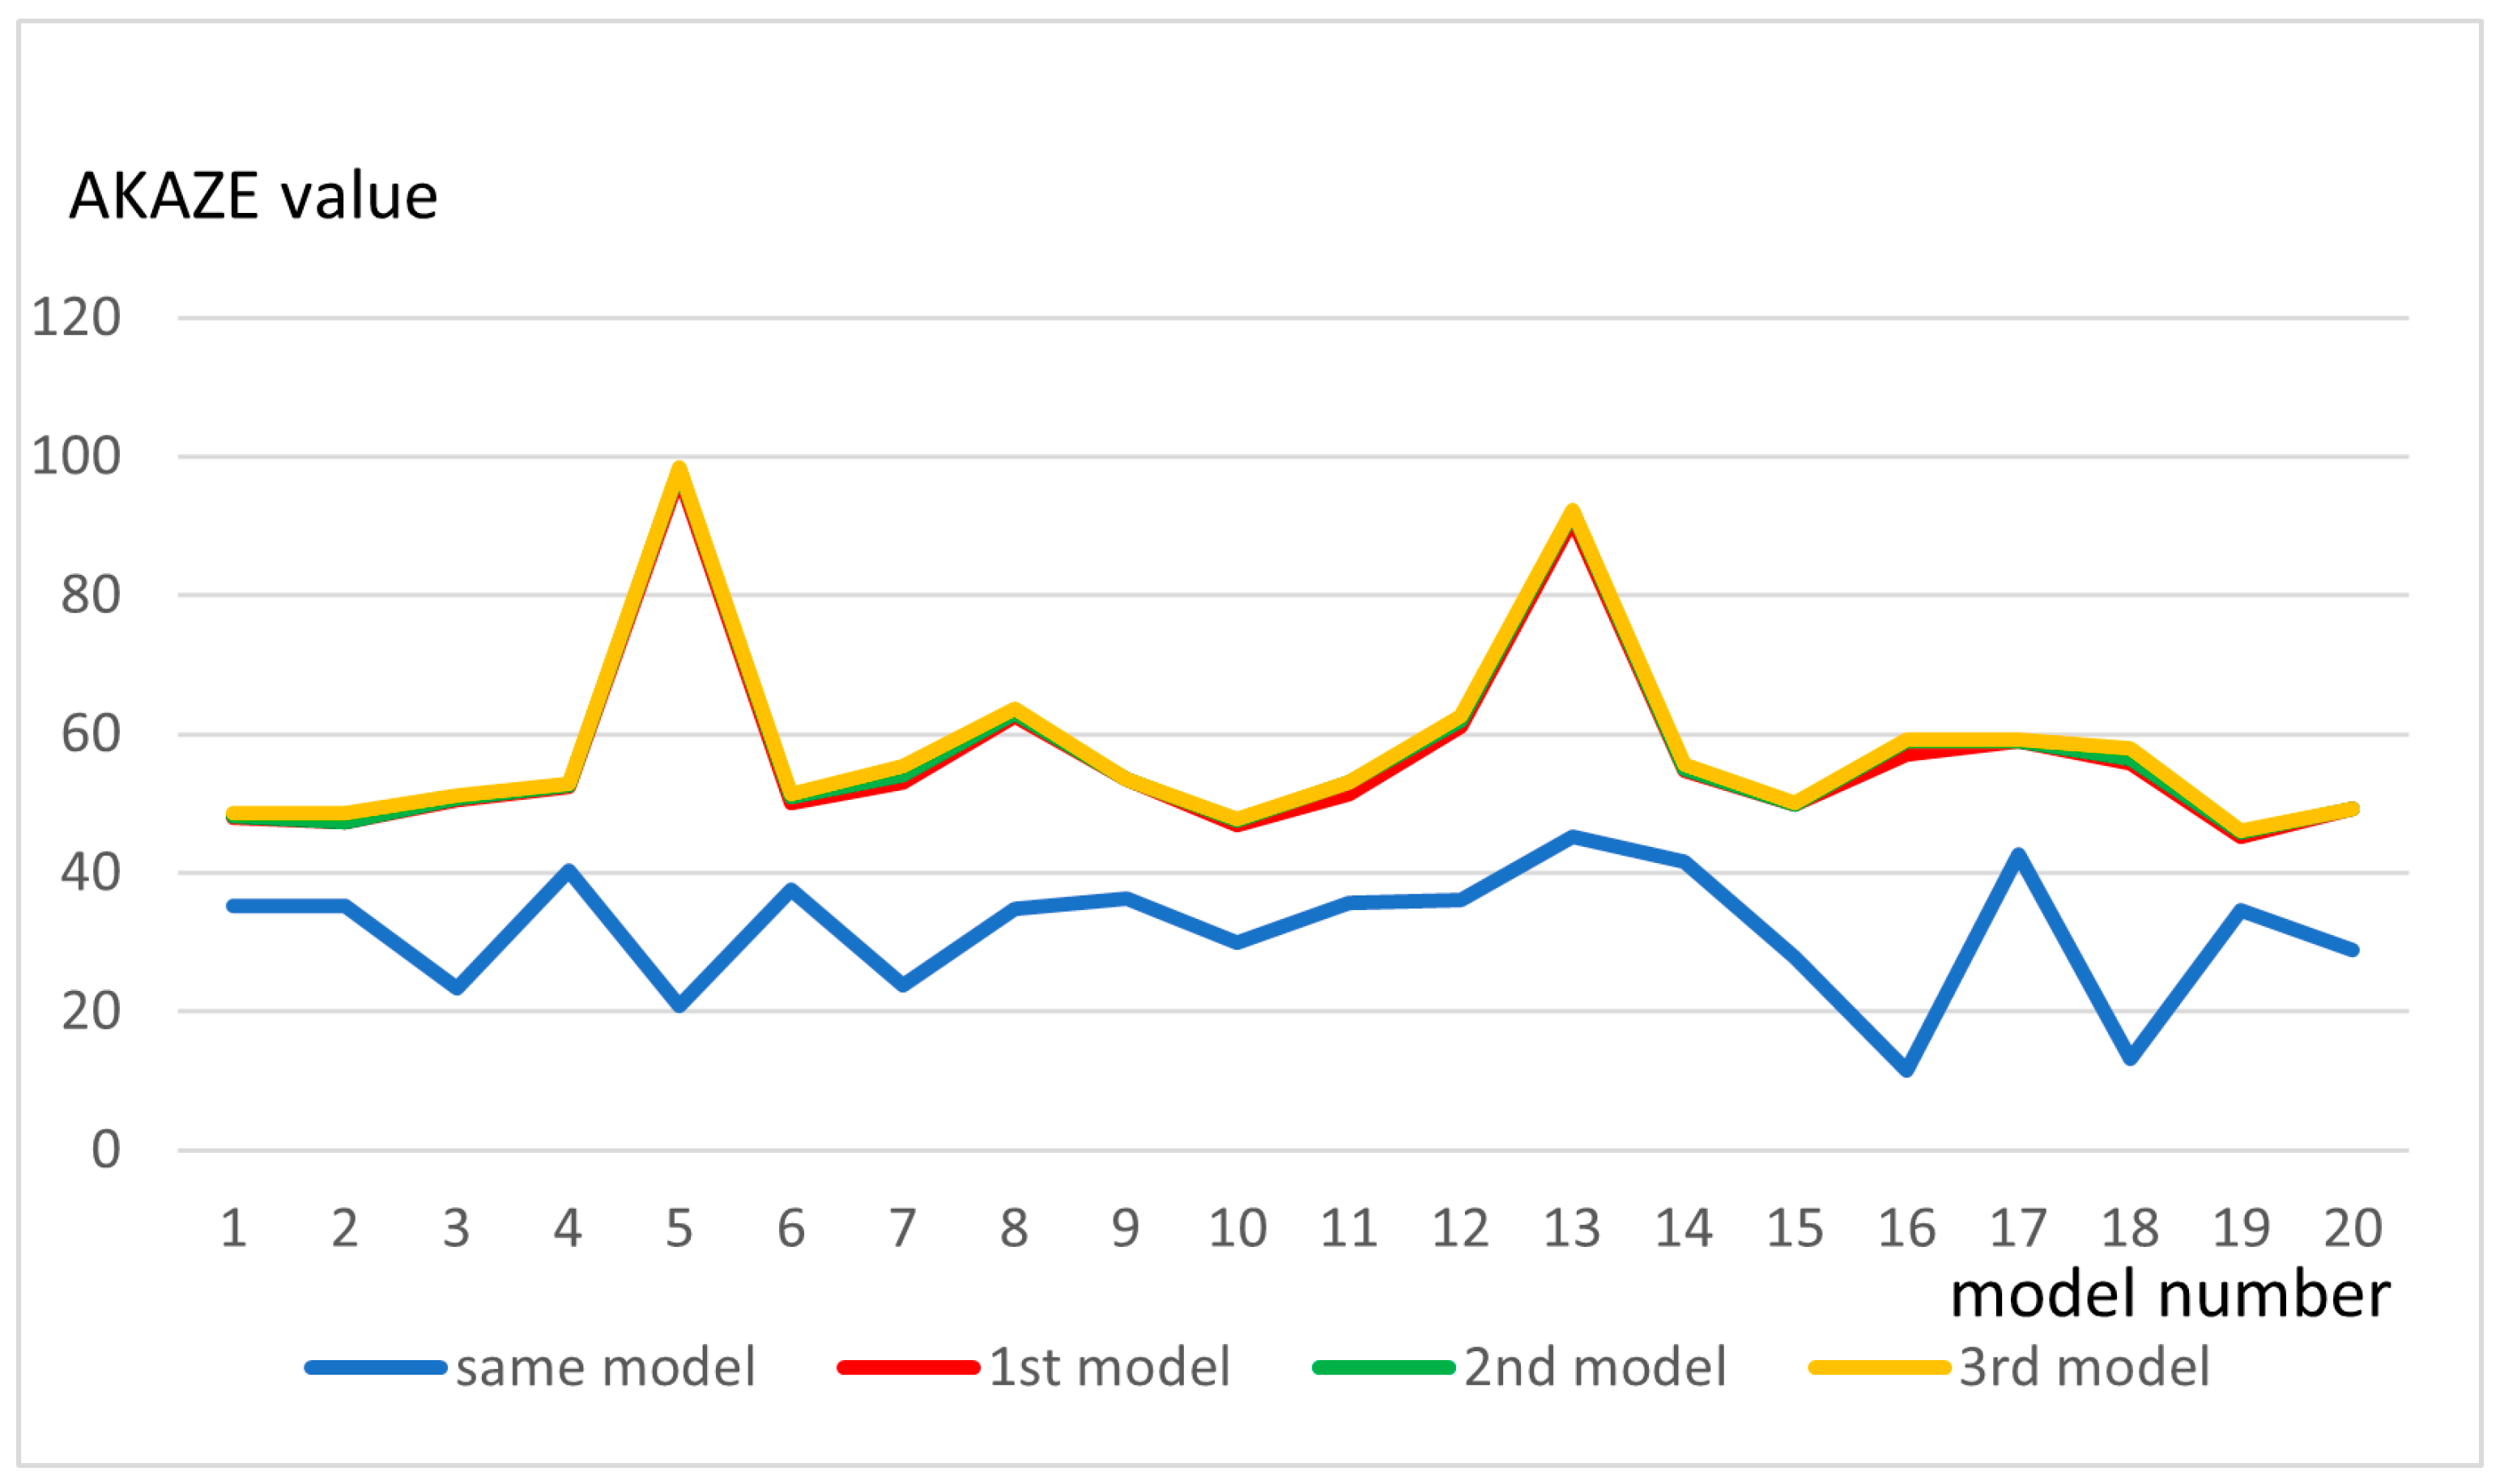
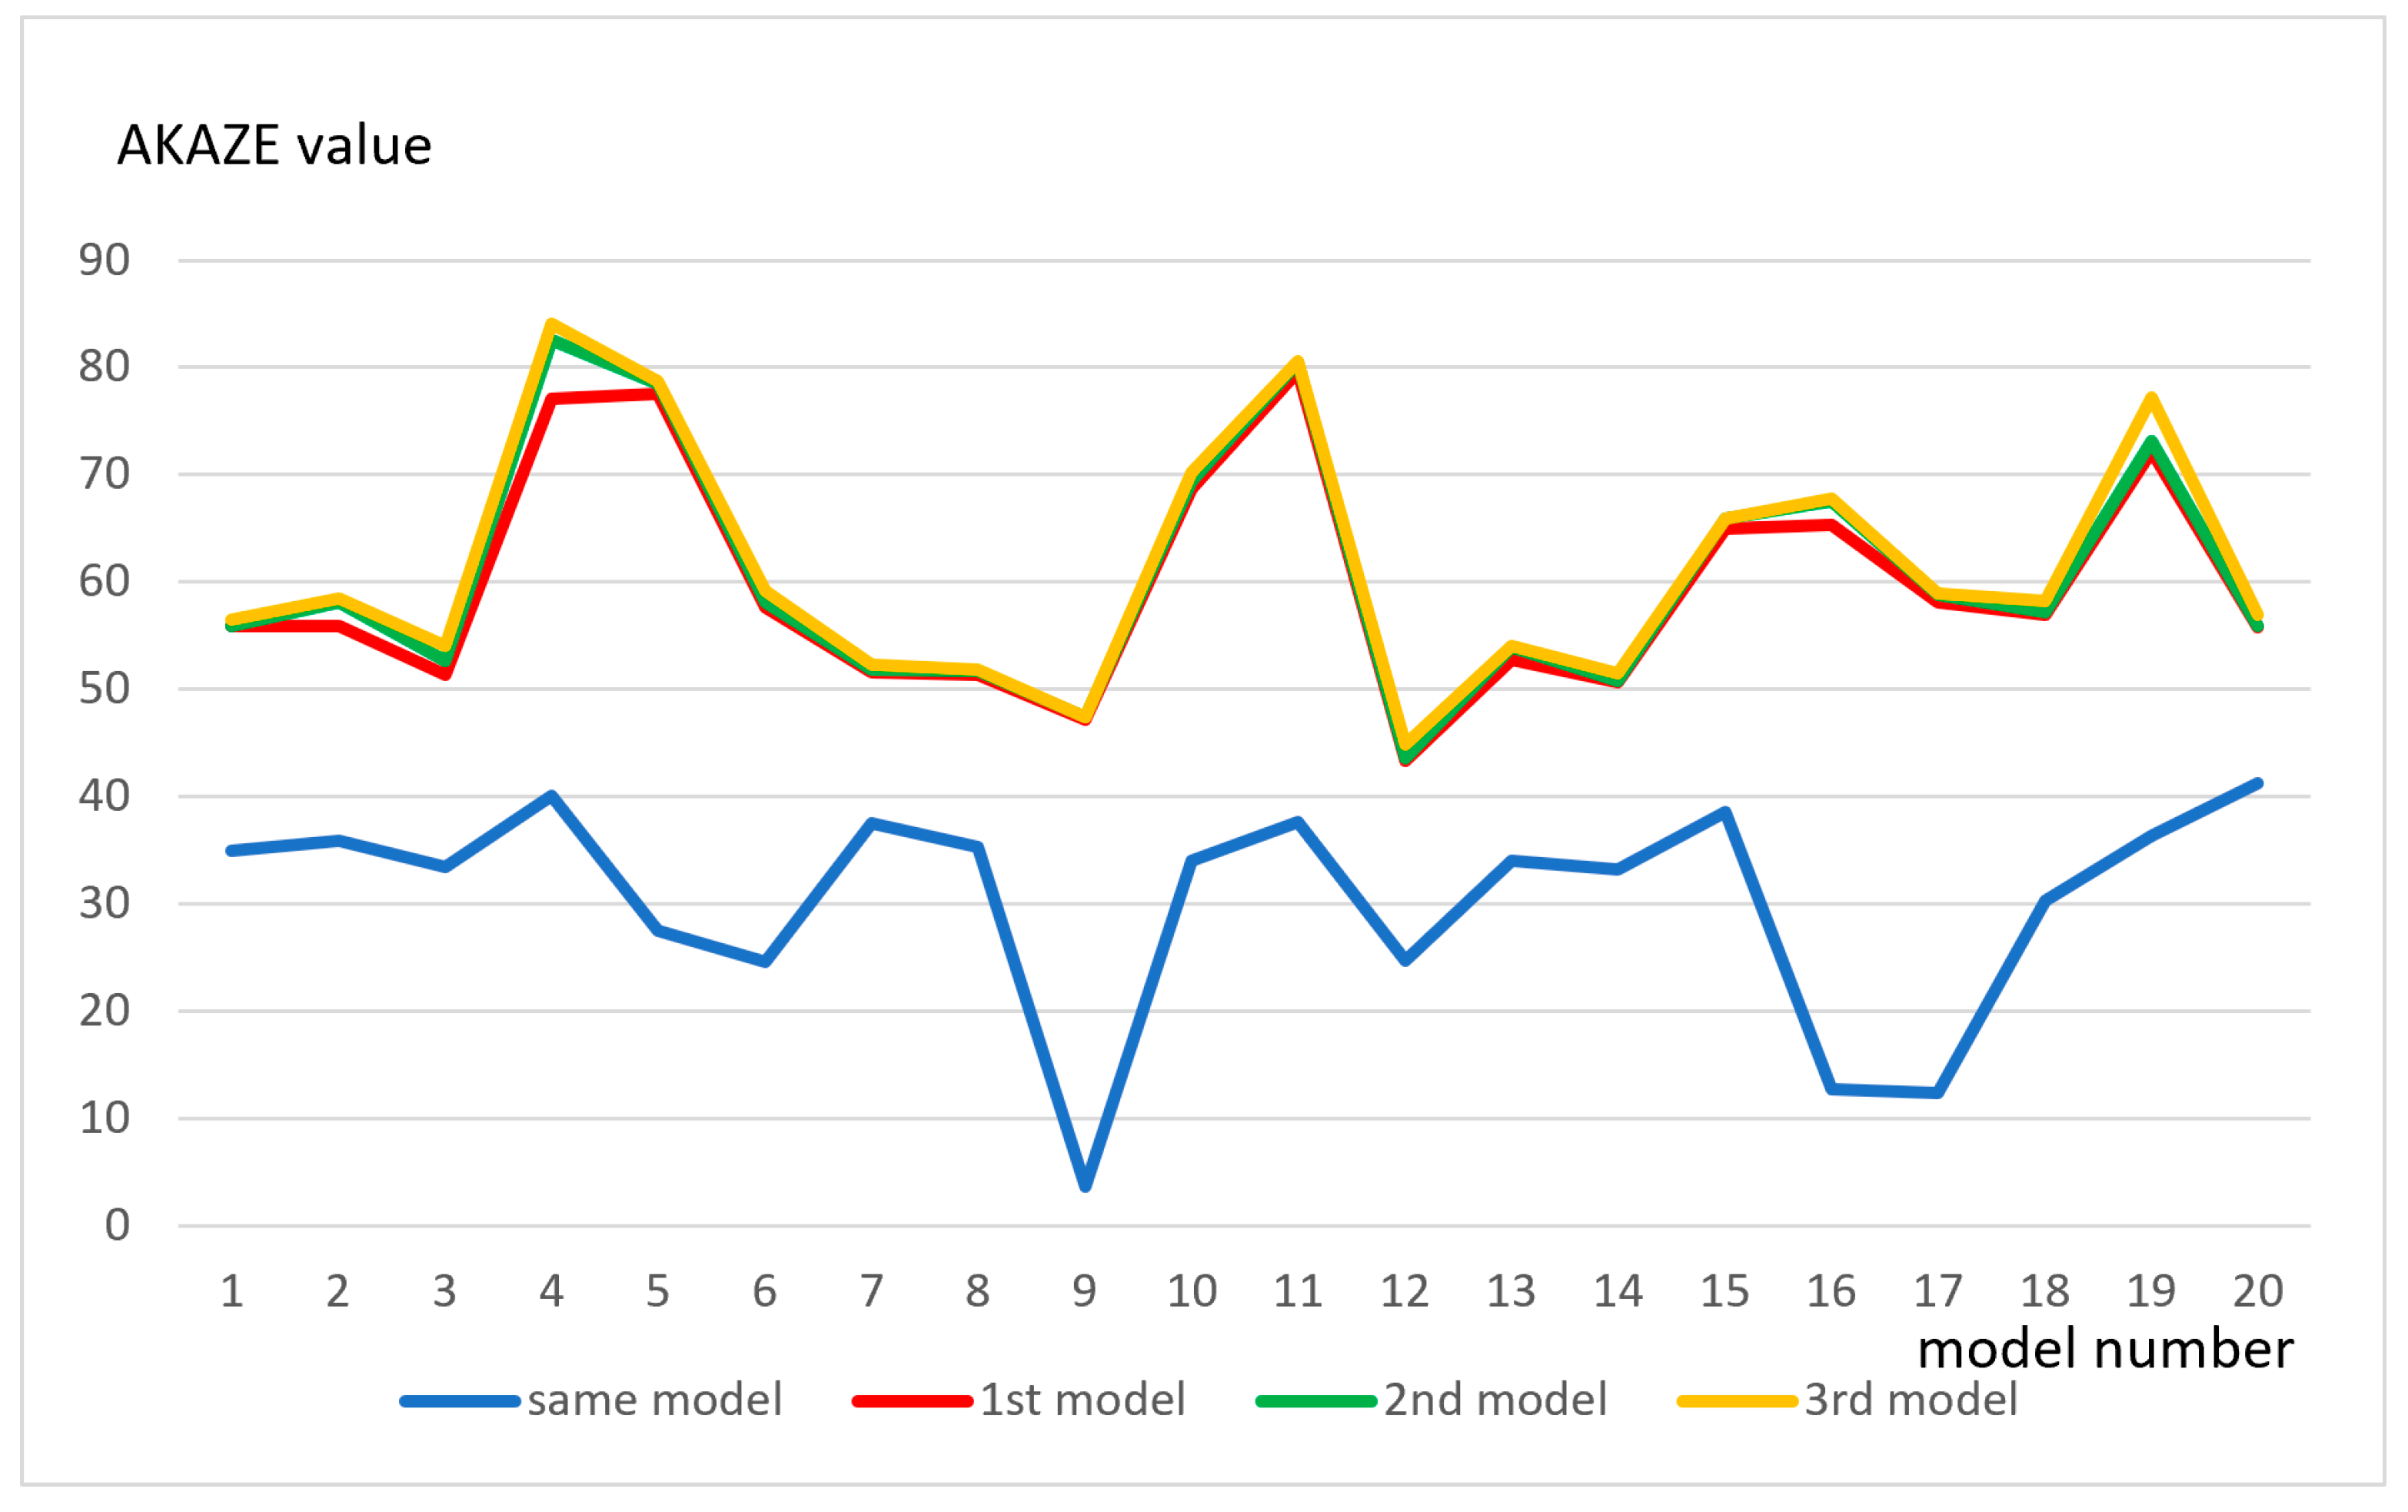
| Mean | SD | p-Value | |
|---|---|---|---|
| Same model | 30.8 | 10.3 | - |
| 1st model | 59.7 | 10.3 | <0.01 * (difference from same model) |
| 2nd model | 60.7 | 11.0 | >0.1 (difference from 1st model) |
| 3rd model | 61.4 | 11.2 | >0.1 (difference from 2nd model) |
| Practitioner | Mean | SD | p-Value |
|---|---|---|---|
| A | 34.2 | 3.23 | >0.1 (difference from B to C) |
| B | 35.0 | 2.49 | >0.1 (difference from A to C) |
| C | 35.0 | 3.77 | >0.1 (difference from B to C) |
Disclaimer/Publisher’s Note: The statements, opinions and data contained in all publications are solely those of the individual author(s) and contributor(s) and not of MDPI and/or the editor(s). MDPI and/or the editor(s) disclaim responsibility for any injury to people or property resulting from any ideas, methods, instructions or products referred to in the content. |
© 2023 by the authors. Licensee MDPI, Basel, Switzerland. This article is an open access article distributed under the terms and conditions of the Creative Commons Attribution (CC BY) license (https://creativecommons.org/licenses/by/4.0/).
Share and Cite
Kubo, D.; Itamiya, T.; Kawanishi, N.; Hoshi, N.; Kimoto, K. The Use of a 3D Image Comparison Program for Dental Identification. Appl. Sci. 2023, 13, 7517. https://doi.org/10.3390/app13137517
Kubo D, Itamiya T, Kawanishi N, Hoshi N, Kimoto K. The Use of a 3D Image Comparison Program for Dental Identification. Applied Sciences. 2023; 13(13):7517. https://doi.org/10.3390/app13137517
Chicago/Turabian StyleKubo, Daijiro, Tomoki Itamiya, Norishige Kawanishi, Noriyuki Hoshi, and Katsuhiko Kimoto. 2023. "The Use of a 3D Image Comparison Program for Dental Identification" Applied Sciences 13, no. 13: 7517. https://doi.org/10.3390/app13137517
APA StyleKubo, D., Itamiya, T., Kawanishi, N., Hoshi, N., & Kimoto, K. (2023). The Use of a 3D Image Comparison Program for Dental Identification. Applied Sciences, 13(13), 7517. https://doi.org/10.3390/app13137517