Abstract
Background and Objectives: The burst of high-throughput omics technologies has given rise to a new era in systems biology, offering an unprecedented scenario for deriving meaningful biological knowledge through the integration of different layers of information. Methods: We have developed a new software tool, MOMIC, that guides the user through the application of different analysis on a wide range of omic data, from the independent single-omics analysis to the combination of heterogeneous data at different molecular levels. Results: The proposed pipeline is developed as a collection of Jupyter notebooks, easily editable, reproducible and well documented. It can be modified to accommodate new analysis workflows and data types. It is accessible via momic.us.es, and as a docker project available at github that can be locally installed. Conclusions: MOMIC offers a complete analysis environment for analysing and integrating multi-omics data in a single, easy-to-use platform.
1. Introduction
Recent technological advances have allowed the generation of vast amounts of data from different omics layers, offering information from diverse aspects of cell biology ranging from genetic variation to the quantification of the proteins encoded by these genes [1]. This fact has given rise to a new era in systems biology, generating the need of integrating different data types. However, the methodological spectrum for the analysis of biological data, and the theoretical framework required to interpret the obtained information is lagging behind [2], and consequently, few standardized workflows for integrative data analyses have been proposed.
Integrative methods can collectively mine multiple types of biological data and provide richer insights. A variety of software applications and analytical frameworks [3,4] are already available for handling diverse type of data. However, the lack of a central repository which catalogs, links, rates and summarizes these tools is one of the factors limiting their use by the research community. Furthermore, some of these resources present notable inconveniences: difficult installation, moderate learning curve, limited customisation or paid license. Increasing researcher awareness and accessibility to tools will improve their use and uptake [5].
This article presents MOMIC, a comprehensive pipeline capable of analyzing and summarising single-omics data by means of meta-analysis, as well as performing integrative analysis of different molecular levels. Enrichment analysis and visualization methods have also been implemented to aid data interpretation. The tool comprises a set of Jupyter notebooks [6] designed for each molecular level, based on publications and best practices available in the literature. An important aspect of MOMIC is its reproducibility; all steps are kept in the same notebook, including commands that are traditionally executed in a terminal, so the user can always see past outputs and exact parameters. It is presented as a web tool and as a Docker project to be installed locally.
The article is structured as follows: Section 2 presents the materials and methods used in this work, detailing all the protocols applied. Section 3 explores existing alternatives and compares them to MOMIC. In Section 4 the authors show diverse analysis outcomes on synthetic and public datasets and how MOMIC has been successfully used in the data analysis required for the ADAPTED IMI project [7]. Finally, Section 6 presents the final conclusions and remarks related to this work.
2. Materials and Methods
MOMIC currently compiles protocols for whole genome SNP data (GWAS), mRNA expression (both from arrays and RNAseq experiments) and protein data. Along with enrichment analysis and methods for combining distinct data.
The data analysis workflows starts with the pre-processing and quality control of the individual datasets. Each of the datasets are then independently analyzed following different protocols designed for each type of data. To consolidate these independent results for the same omic, a meta-analysis can be performed, generating single lists of SNPs or genes. After this, one can take a step forward and combine diverse omic results, along with functional genomics analysis, and try to elucidate the potential causative changes that lead to disease. With this integrative approach the user can get a single ranked list of candidate genes summarising the heterogeneous data at different molecular levels. Finally, visualization and pathway analysis tools are available to further explore analysis results. This whole procedure has been summarized in Figure 1.
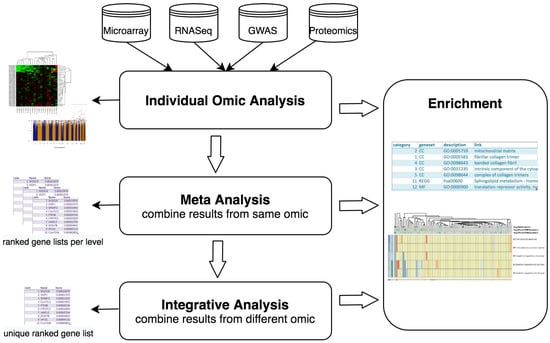
Figure 1.
MOMIC pipeline steps.
2.1. Core Software
MOMIC is presented as a collection of Jupyter notebooks using JupyterLab and JupyterHub on top, written mainly in R language and containerized in docker [8]. JupyterLab is an open-source web-based interactive development environment that allows users to create and share documents, called notebooks, that contain live code, equations, visualizations and narrative text. JupyterHub brings the power of notebooks to multiple users.
MOMIC is distributed as a docker-compose project that contains the instructions needed to automatically create a fully working pipeline server with JupyterLab. These instructions assemble commands that enable convenient extensions in JupyterLab, like git for notebook version controlling and table of content, set up docker volumes for data persistence, arrange the pipeline source code and all the necessary libraries and third-party software. An alternative to a local installation is to use the pipeline hosted at momic.us.es. Note this alternative is intended for light analysis or quick testing. Login details are specified in the user manual and upon request.
The collection of notebooks are provided as read-only, serving as templates. The user can replicate the same analysis duplicating the template and modifying it according to his needs. Notebooks can be downloaded as ipython notebooks, HTML, PDF or scripts. The later exports the notebook in scripting language that can be reused at the user convenience.
2.2. Implemented Protocols
We describe below the protocols developed. These are executed on publicly available datasets and synthetic data related to Alzheimer Disease and serves as an illustrative example of how to use the pipeline to carry out customised analysis.
Figure S1–S4 from the Supplementary Material precisely describe the collection of notebooks designed for each protocol, defining the individual tasks, the flow of information and expected inputs and outputs. The user manual and the jupyter notebooks contain more detailed explanations and documented source code.
Genome Wide Expression Studies (GWES) from microarrays. RNA microarrays can simultaneously measure the expression level of thousands of genes within a particular mRNA sample [9]. This can be used to compare the level of gene transcription in clinical or biological conditions in order to find differences in expression levels between predefined groups of samples. This pipeline starts from raw expression data and ends with a set of differentially expressed genes, as shown in Figure 2. In order to capture these significant genes, the standard protocol to follow comprises data pre-processing, differential expression analysis (DE) and annotation steps. Pre-processing involves transforming raw data into a matrix of normalized intensities, using the RMA [10], limma [11] or preprocessCore [12] R packages depending on the data platform. Batch effect removal is also available through the combat function of the sva package [13]. DE is performed with limma, an R package based on linear models for microarray data, including optional correction for covariates, followed by annotation to translate probes to genes, using Entrez and Human Genome Nomenclature Committee (HGNC) identifiers. Additionally, heatmaps, PCA and volcano plots can be easily generated to assist the interpretation of results.
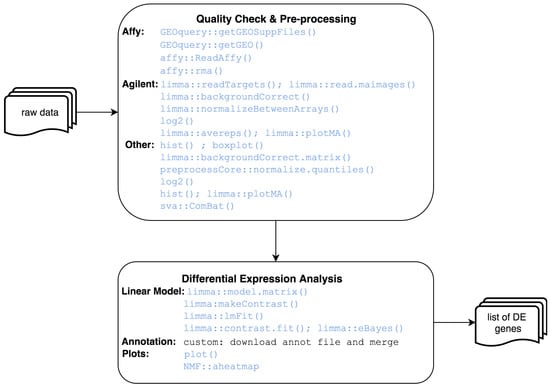
Figure 2.
Microarray analysis workflow.
Genome Wide Expression Studies (GWES) from RNASeq. RNA-Seq is a particular technology-based sequencing technique which uses next-generation sequencing (NGS) to reveal the presence and quantity of RNA in a biological sample at a given moment. This pipeline starts from raw sequence reads, and ends with a set of differentially expressed genes (see Figure 3). The steps to complete this analysis are: quality check of the raw reads using fastqc [14], alignment of reads against the reference genome using STAR [15], quality control of aligned reads (by inspection of QC plots) and reads quantification with STAR. Differential expression can be then performed using DESeq2 [16], an R package based on a model using the negative binomial distribution, followed by annotation with biomaRt library [17]. As for microarrays, plots like MA, heatmap and PCA can be easily obtained.
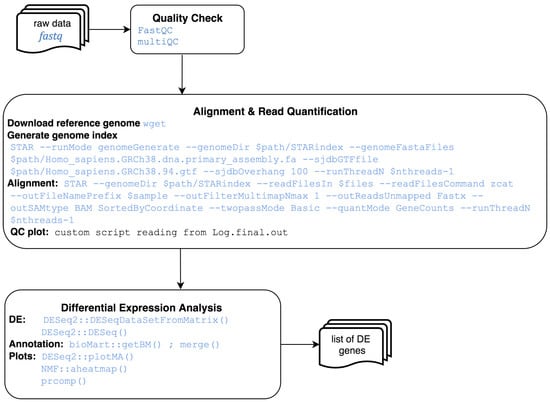
Figure 3.
RNA-Seq analysis workflow.
Genome Wide Association Studies (GWAS): GWAS is an observational study of a genome-wide set of genetic variants in different individuals to examine if any variant is associated with a trait. The GWAS protocol is available for genome builds GRCh37/hg19 and GRCh38/hg38, including the UCSC liftOver tools for updating genetic positions. This pipeline starts from genomic data in PLINK format, and ends with Single Nucleotide Polymorphisms (SNPs) annotated for surrounding genes and rs identifiers (dbSNP v150 for the GRCh37 pipeline and dbSNP v151 for the GRCh38 pipeline), which are then aggregated to the level of whole genes, testing the joint association of all markers in the gene with the phenotype, as depicted in Figure 4. Procedure followed here is a composition from Anderson et al. protocol [18] and AT Marees et al. [19]. Steps are: initial quality control excluding bad quality individuals and SNPs, genotype imputation using the Michigan [20] or TopMed [21] imputation servers, case control association study using PLINK [22] and gene-wise statistics computed using MAGMA [23]. SNP level data can be visualised with Manhattan and QQ plots [24].
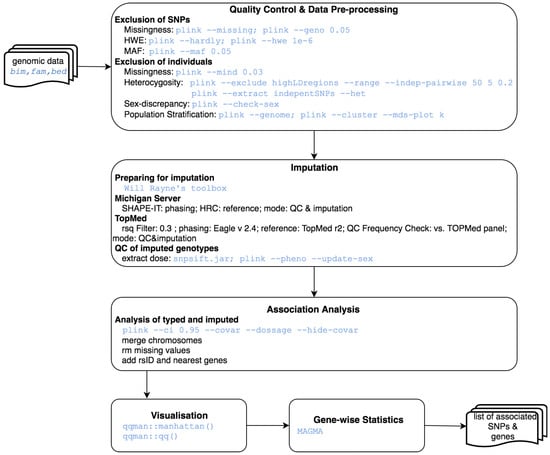
Figure 4.
GWAS analysis workflow.
Proteomics: Differential expression between samples can be also explored in MOMIC at the protein level. This pipeline starts from an intensity matrix, generated by specific software such as MaxQuant/Perseus, and ends with a set of differentially expressed proteins (see Figure 5). The first step is data processing, which includes removing decoy matches and matches to contaminant, extracting the LFQ intensities columns, filtering on missing values, log transformation, normalisation, unique peptide counting and visualisation. Differential expression is performed similarly to microarray DE analysis using DEqMS R package [25], which is built on top of limma and accounts for variance dependence on the number of quantified peptides. Heatmap and volcano plots are also generated to assist the interpretation of results.
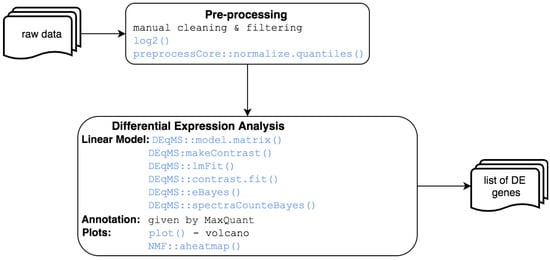
Figure 5.
Proteomics analysis workflow.
Meta-analysis: Meta-analysis is the statistical procedure for synthesising data across studies addressing the same question at the same molecular level. Two different one-step protocols are provided here, one for combining multiple GWAS results using the software METAL [26] and another for transcriptomics and proteomics results utilising MetaDE R library [27]. The former starts from SNP level GWAS results and ends with a single list of SNPs and associated summary statistics. The later starts from the results of the DE analysis of various studies, and ends with an unified list of differentially expressed genes or proteins across studies with their correspondent average effect sizes and p-values.
Integrative analysis: Integrative analysis aims at consolidating heterogeneous data at different omics levels to understand their interrelation and combined influence on the disease processes. This one-step protocol starts from the results of the meta-analysis from different studies, and ends with a unified ranked list of differentially expressed genes. It is performed using the Robust Rank Aggregation method [28]. It detects genes that are ranked consistently better than expected under the null hypothesis of uncorrelated inputs and assigns a significance score for each gene.
Enrichment: Enrichment analysis can identify gene onthology (GO) terms and pathways which are statistically over or under-represented within the list of interest, by systematically mapping genes and proteins to their associated biological annotations. The enrichment is performed using WebGestalt [29] in R and the visualization with GOplot [30] and pheatmap from R CRAN.
2.3. Availability and Requirements
MOMIC is free to use and it is distributed under the MIT License. It is hosted at the University of Seville data center at momic.us.es. Sources, documentation and guides for users and administrators are available on GitHub:
- MOMIC server: https://github.com/laumadmar/MOMIC_server.git (accessed on 10 January 2022)
- Collection of notebooks: https://github.com/laumadmar/MOMIC_notebooks.git (accessed on 10 January 2022)
- Documentation: https://laumadmar.github.io/MOMIC_server (accessed on 10 January 2022)
If hosting MOMIC locally, the minimum recommendation is 15 GB of RAM which may need to be increased with large datasets, specially for some processes during an RNASeq Analysis or GWAS. The most computationally intensive tasks are: the preparation of the 1 KG [31] data prior the population stratification on a GWAS analysis, which takes up to 8 GB of virtual memory and takes 26 min to complete, and a GWAS association analysis taking up to 45 MB and 45 min. Disk space can vary depending on the size of the user data, 260 GB is the actual size of the data volume for momic.us.es. Suplementary Table S1 summarises the data types used as inputs and their sizes.
MOMIC has been tested on Ubuntu 18.04, CentOS 8, Rocky Linux 8.5, Windows 10 and macOS High Sierra.
3. Motivation and Existing Alternatives
MOMIC emerged out of the necessity of exploring data at different molecular levels as part of the ADAPTED project, reviewed in the Results section. The main requirements regarding the bioinformatics analysis were to perform them in a comprehensive way, easy to share and fully reproducible while keeping good evidence of the work done.
After examining existing tools none of them quite suited the above requirements and therefore MOMIC was developed. Table 1 shows some of these tools and the main differences with MOMIC, being Galaxy and GenePattern the ones that serve similar functionality. Despite Galaxy being a powerful and useful tool, it has some limitations compared to MOMIC in terms of accessibility to the source code and ease of data manipulation and customisation of modules. GenePattern is a great tool for users with no programming experience but not that well suited for those who need full control over the source code and straight forward customisation. It offers a good variety of analysis and modules but lacks GWAS and integration of different omics.

Table 1.
Comparison of existing tools for omic analyses.
4. Results
This section shows the different outputs that can be obtained by MOMIC analysis pipelines. Different sources of data have been used to illustrate its functionality, including synthetic data, therefore the lists of significant genes obtained from this type of data are not evaluated here. The subsection below, Use cases: Application on real projects, briefly describe two successful published studies carried out using MOMIC and a gene priorization project, serving as a good validation of this tool.
GWES from Microarrays. This protocol makes use of Gene Expression Omnibus (GEO) [32] datasets GSE48350, which contains brain expression data from normal controls and AD cases, and GSE11882/GSE15222 datasets, also a brain transcriptomic study on normal controls and AD cases. Figure 6a illustrates the results provided by MOMIC in tabular format for the differential expression analysis, including information such as log2 fold changes (logFC), lower and upper confidence intervals (CI.L, CI.U), p-value, FDR adjusted p-value and Entrez Gene IDs (Supplementary Data Tables S1 and S2). Graphical outputs include Volcano (Figure 6b) and Heatmap (Figure 6c) plots, enabling quick visual identification of the most biologically relevant genes. To illustrate the meta-analysis protocol, the results from these two analyses are combined in MOMIC (Supplementary Data Table S1 and S2).
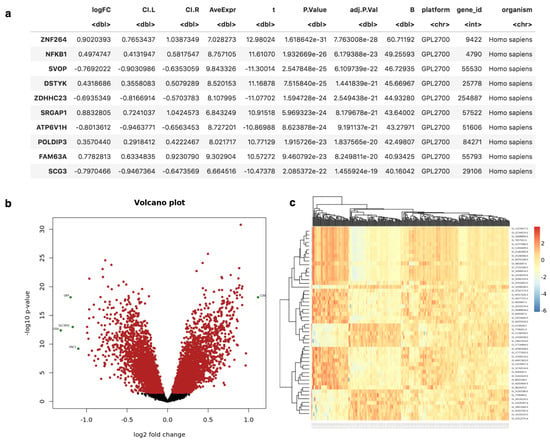
Figure 6.
Results obtained from Microarray DE analysis. (a) candidate genes in tabular format. (b,c) Volcano and Heatmap plots highlighting top DE genes.
GWES from RNAseq. Synthetic data from astrocytes with fake genotype and phenotype have been created to depict the RNAseq pipeline. The various outputs obtained from this pipeline comprises summary statistics about number and quality of reads (Figure 7a,b), tabular data with log2 fold changes, p values and adjusted p values, and Volcano and Heatmap plots for the visualisation of the differential expression results.
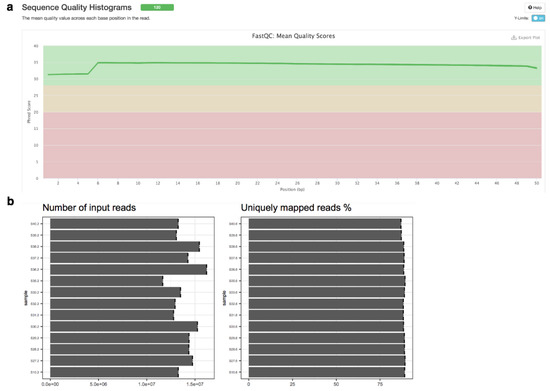
Figure 7.
NGS quality plots generated by MultiQC integrated in MOMIC. (a) Sequence Quality Histograms, (b) number of reads.
GWAS. Given the restrictions applying to raw genotypic data, which is needed to illustrate the GWAS protocol, we used whole genome genotypes from the 1000 Genomes (1 KG) project [31], adding a simulated dichotomic case status for running the association analysis. The 1KG project ran between 2008 and 2015, creating the largest public catalogue of human variation and genotype data. Figure 8 lists the top 6 annotated SNPs obtained, along with chromosome and allele information, and statistics like p-value, standard error (ES) and Estimated odds ratio (OR). Figure 8b shows an example of PCA plot generated by MOMIC, showing PC means and suggestive thresholds for the Caucasian population represented by red and blue dotted lines. Manhattan and QQ plots graphically summarizes the results from individual association studies (Figure 8c,d).
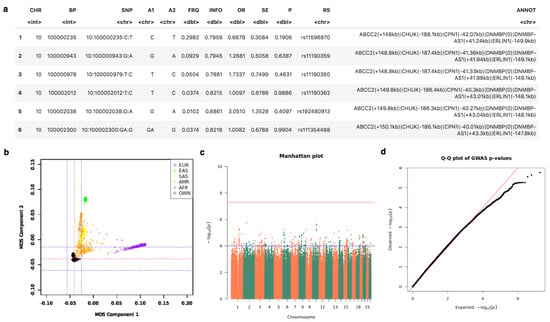
Figure 8.
Tabular and graphical outputs from GWAS. (a) top annotated SNPs. (b) Multidimensional Scaling plot for population stratification. (c,d) Manhattan and QQ plots.
Proteomics. Proteomics data from postmortem brain tissue collected through The National Institute on Aging’s Baltimore Longitudinal Study of Aging (BLSA) [33] were obtained from Synapse (10.7303/syn3606086). Differential expression is explored similarly to GWES Microarray on both graphical and tabular fashion (Supplementary Data Table S3) as depicted in Figure 6a–c.
Integrative Analysis. Integrative analysis using the RRA approach was applied to the output gene lists obtained from the above analysis. RRA output includes exact and adjusted p-values (data not shown). As mentioned earlier, this analysis is not expected to have biological significance. Another application of this integrative analysis is gene priorization, which is mentioned below.
Enrichment Analysis. Given a list of candidates genes generated by MAGMA, DE meta-analysis or integrative analysis, it can be explored for identifying relevant gene functions. Figure 9 shows a graphical representation of the enrichment analysis carried out on integrative results.
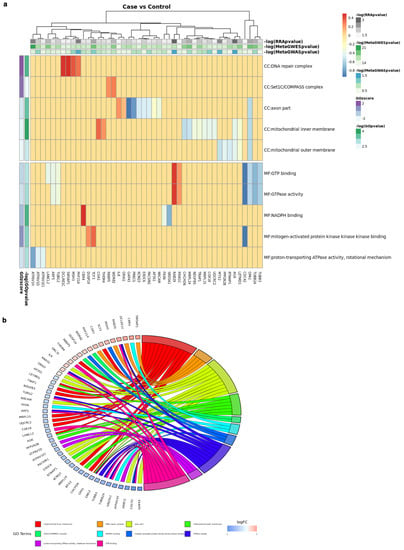
Figure 9.
Functional analysis of results: over-representation pathway analysis. (a) case vs. control (b) Go Terms.
Use Cases: Application on Real Projects
This tool has been successfully used in the data analysis required for the Innovative Medicines Initiative (IMI) funded ADAPTED project [7], an international consortium aimed at a better understanding of APOE-specific effects, a well-known risk factor for developing AD. Within this project, data of multiple OMICS technologies, including GWAS data from more than 50,000 subjects, mRNA and protein expression data from both plasma and brain, as well as single-nuclei brain transcriptomics, has been analyzed and integrated.
Plasma biomarkers for AD discussed on the article Integrated Genomic, Transcriptomic and Proteomic Analysis for Identifying Markers of Alzheimer’s Disease [34], have been explored entirely in MOMIC using GWAS summary statistics, transcriptomic and proteomic data from brain and blood.
In favour of providing another example of how MOMIC can be applied to current medical and biological research, we have performed priorization of association signals arising from GWAS. We collected published gene level summary statistics [35], including 115 genes significantly associated with AD, and three meta-analysis results at the plasma, cortex and hippocampus levels generated with MOMIC for the two projects mentioned above. We then applied the RRA algorithm for combining the four datasets, and compared generated ranks with those provided by OpenTargets [36], a popular tool for gene priorization based on precomputed scores by disease (Supplementary Data Table S4 and Figure S1).
5. Discussion
MOMIC is designed to be an intuitive and easy-to-use tool to perform a good variety of omic analysis, enabling the visualization and integration of data at different molecular levels in a single framework. It is presented as a collection of Jupyter notebooks, and it is also conveniently packaged as a Docker application so that the user can have within minutes a complete bioinformatics suit with predefined pipelines without the burdens of creating the infrastructure and installing the packages and tools broadly used in omic analysis. It has been thoroughly tested, well documented and with clear guidelines and citations that explain each type of analysis. MOMIC provides fully open source code that allows the end user to make any modification to adequate the analyses to his needs.
The usage of MOMIC has been demonstrated by analysing AD data from synthetic and publicly available data, as well as two published articles related to this disease that used MOMIC to make some interesting discoveries. We presented a third validation project consisting on signal priorization, where we see the gene RELB ranked first by MOMIC, a gene involved in immunity and inflammation producing amyloidosis in KO mutant mice, ranked 6 according to GWAS results. Similarly, the first ranked gene according to de Rojas results, PVRL2 (NECTIN2), a glycoprotein linked to T-cell differentiation, ranked fourth after MOMIC integrative analysis. None of them were included among AD genes in OpenTargets, and therefore, excluded from the rank generated by this tool. In fact, OpenTargets only included 54 of the 115 significant genes reported by de Rojas et al.
This shows that MOMIC can be easily used to incorporate summary statistics to previously generated meta-analysis results and ranked gene lists, through the METAL, metaDE and RRA algorithms for GWAS, expression (transcriptomics and proteomics) and miscellaneous data respectively. The ranking algorithm doesn’t either require that the same entities are measured in all the experiments to be combined in contrast with tools based on clustering such as mixOmics. Finally, its advantage for gene priorization over other popular resources is that it does not rely on previous knowledge, but on observed altered expression in target tissues in an standardized manner.
6. Conclusions and Future Work
This work represents an effort for putting together protocols and best practises available in the literature into a practical, extensible and platform-independent single framework. By providing theoretical background and hands-on experience, we aim at making the omics science more accessible and effortless to researchers with and without formal training in the field.
The kind of integrative approach that MOMIC implements helps in assessing the flow of information from one omics level to the other and thus helps in bringing the gap between genotype to phenotype, improving prognostics and predictive accuracy of disease phenotypes eventually aiding in better treatment and prevention.
Future Work
MOMIC scalability depends on computing power and the ability to perform new bioinformatics analysis. The former requires the replication of MOMIC in a local server, as the version hosted at momic.us.es is not capable of storing data for multiple users and the actual RAM limits some analyses on large datasets, specially for performing a GWAS analysis. The later can be achieved simply by adding new Jupyter notebooks with appropriate source code and libraries. The user manual explains in great detail how to accomplish both.
A piece of work that could be done to boost MOMIC is to implement it using an orchestrator engine and a cloud service provider to get a robust cloud computing pipeline in a distributed, secure, scalable and reproducible environment. Jupyter notebooks can be exported as R scripts to assist the translation between MOMIC source code and the language used by the workflow engine.
Supplementary Materials
The following are available at https://www.mdpi.com/article/10.3390/app12083987/s1, https://github.com/laumadmar/MOMIC_server.git (accessed 1 April 2022); https://github.com/laumadmar/MOMIC_notebooks.git (accessed 1 April 2022); https://laumadmar.github.io/MOMIC_server (accessed 1 April 2022) [37,38].
Author Contributions
Conceptualization, L.M.-M., A.G.-P. and M.E.S.; methodology, L.M.-M., A.G.-P. and M.E.S.; software, L.M.-M.; validation, L.M.-M., C.R.-E. and B.P.; formal analysis, L.M.-M. and M.E.S.; investigation, L.M.-M., C.R.-E. and B.P.; resources, L.M.-M.; data curation, L.M.-M.; writing—original draft preparation, L.M.-M., M.E.S. and C.R.-E.; writing—review and editing, L.M.-M., M.E.S., C.R.-E., J.C.R. and B.P.; visualization, L.M.-M.; supervision, A.G.-P. and M.E.S.; project administration, C.R.-E. and B.P.; funding acquisition, C.R.-E., A.G.-P. and M.E.S. All authors have read and agreed to the published version of the manuscript.
Funding
This work has been supported by the ADAPTED consortium, which has received funding from the Innovative Medicines Initiative 2 Joint Undertaking under grant agreement No 115975. This Joint Undertaking receives support from the European Union’s Horizon 2020 research and innovation program and the European Federation of Pharmaceutical Industries and Associations. https://www.imi.europa.eu/projects-results/project-factsheets/adapted (accessed on 10 January 2022). The authors also want to thank the financial support given by the Spanish Ministry of Economy and Competitivity TIN2017-88209-C2-2-R, the Junta de Andalucía Project P18-RT-2778, the University of Sevilla project US-1263341 and the FEDER funds IPT-2011-0952-900000. We thank the International Genomics of Alzheimer’s Project (IGAP) for providing summary results data for these analyses. The investigators within IGAP contributed to the design and implementation of IGAP and/or provided data but did not participate in analysis or writing of this report. IGAP was made possible by the generous participation of the control subjects, the patients, and their families. The i–Select chips was funded by the French National Foundation on Alzheimer’s disease and related disorders. EADI was supported by the LABEX (laboratory of excellence program investment for the future) DISTALZ grant, Inserm, Institut Pasteur de Lille, Université de Lille 2 and the Lille University Hospital. GERAD was supported by the Medical Research Council (Grant No. 503480), Alzheimer’s Research UK (Grant No. 503176), the Wellcome Trust (Grant No. 082604/2/07/Z) and German Federal Ministry of Education and Research (BMBF): Competence Network Dementia (CND) grant No. 01GI0102, 01GI0711, 01GI0420. CHARGE was partly supported by the NIH/NIA grant R01 AG033193 and the NIA AG081220 and AGES contract N01-AG-12100, the NHLBI grant R01 HL105756, the Icelandic Heart Association, and the Erasmus Medical Center and Erasmus University. ADGC was supported by the NIH/NIA grants: U01 AG032984, U24 AG021886, U01 AG016976, and the Alzheimer’s Association grant ADGC-10-196728.
Data Availability Statement
Data is available under some circumstances upon request to lmadrid@caebi.es. The Baltimore Longitudinal Study on Aging (BLSA) study data were generated from postmortem brain tissue collected through the The National Institute on Aging’s Baltimore Longitudinal Study of Aging and provided by Levey from Emory University. This study was downloaded from Synapse (10.7303/syn3606086).
Conflicts of Interest
The authors declare no conflict of interest.The funders had no role in the design of the study; in the collection, analyses, or interpretation of data; in the writing of the manuscript, or in the decision to publish the results.
References
- Gligorijević, V.; Pržulj, N. Methods for biological data integration: Perspectives and challenges. J. R. Soc. Interface 2015, 12, 20150571. [Google Scholar] [CrossRef] [PubMed]
- Haas, R.; Zelezniak, A.; Iacovacci, J.; Kamrad, S.; Townsend, S.; Ralser, M. Designing and interpreting ‘multi-omic’experiments that may change our understanding of biology. Curr. Opin. Syst. Biol. 2017, 6, 37–45. [Google Scholar] [CrossRef] [PubMed]
- Afgan, E.; Baker, D.; Batut, B.; van den Beek, M.; Bouvier, D.; Čech, M.; Chilton, J.; Clements, D.; Coraor, N.; Grüning, B.A.; et al. The Galaxy platform for accessible, reproducible and collaborative biomedical analyses: 2018 update. Nucleic Acids Res. 2018, 46, W537–W544. [Google Scholar] [CrossRef] [PubMed] [Green Version]
- Subramanian, I.; Verma, S.; Kumar, S.; Jere, A.; Anamika, K. Multi-omics Data Integration, Interpretation, and Its Application. Bioinform. Biol. Insights 2020, 14, 1177932219899051. [Google Scholar] [CrossRef] [Green Version]
- Pinu, F.R.; Beale, D.J.; Paten, A.M.; Kouremenos, K.; Swarup, S.; Schirra, H.J.; Wishart, D. Systems biology and multi-omics integration: Viewpoints from the metabolomics research community. Metabolites 2019, 9, 76. [Google Scholar] [CrossRef] [Green Version]
- Kluyver, T.; Ragan-Kelley, B.; Pérez, F.; Granger, B.; Bussonnier, M.; Frederic, J.; Kelley, K.; Hamrick, J.; Grout, J.; Corlay, S.; et al. Jupyter Notebooks—A publishing format for reproducible computational workflows. In Positioning and Power in Academic Publishing: Players, Agents and Agendas; Loizides, F., Schmidt, B., Eds.; IOS Press: Amsterdam, The Netherlands, 2016; pp. 87–90. [Google Scholar]
- Madrid, L.; Moreno-Grau, S.; Ahmad, S.; González-Pérez, A.; de Rojas, I.; Xia, R.; Adami, P.V.M.; García-González, P.; Kleineidam, L.; Yang, Q.; et al. Multiomics integrative analysis identifies APOE allele-specific blood biomarkers associated to Alzheimer’s disease etiopathogenesis. Aging 2021, 13, 9277. [Google Scholar] [CrossRef]
- Merkel, D. Docker: Lightweight linux containers for consistent development and deployment. Linux J. 2014, 2014, 2. [Google Scholar]
- Baldi, P.; Hatfield, G.W. DNA Microarrays and Gene Expression: From Experiments to Data Analysis and Modeling; Cambridge University Press: Cambridge, MA, USA, 2011. [Google Scholar]
- Gautier, L.; Cope, L.; Bolstad, B.M.; Irizarry, R.A. affy—Analysis of Affymetrix GeneChip data at the probe level. Bioinformatics 2004, 20, 307–315. [Google Scholar] [CrossRef]
- Smyth, G.K. Limma: Linear models for microarray data. In Bioinformatics and Computational Biology Solutions Using R and Bioconductor; Gentleman, R., Carey, V.J., Huber, W., Irizarry, R.A., Dudoit, S., Eds.; Springer: New York, NY, USA, 2005; pp. 397–420. [Google Scholar]
- Bolstad, B. preprocessCore: A Collection of Pre-Processing Functions; R Package Version 1.50.0; Bioconductor: Santo Domingo, Dominican Republic, 2020. [Google Scholar]
- Leek, J.T.; Johnson, W.E.; Parker, H.S.; Jaffe, A.E.; Storey, J.D. The Sva Package for Removing Batch Effects and Other Unwanted Variation in High-Throughput Experiments. Bioinformatics 2012, 28, 882–883. [Google Scholar] [CrossRef]
- Andrews, S.; Krueger, F.; Segonds-Pichon, A.; Biggins, L.; Krueger, C.; Wingett, S. FastQC; Babraham Institute: Babraham, UK, 2010. [Google Scholar]
- Dobin, A.; Davis, C.A.; Schlesinger, F.; Drenkow, J.; Zaleski, C.; Jha, S.; Batut, P.; Chaisson, M.; Gingeras, T.R. STAR: Ultrafast universal RNA-seq aligner. Bioinformatics 2013, 29, 15–21. [Google Scholar] [CrossRef]
- Love, M.I.; Huber, W.; Anders, S. Moderated estimation of fold change and dispersion for RNA-seq data with DESeq2. Genome Biol. 2014, 15, 550. [Google Scholar] [CrossRef] [PubMed] [Green Version]
- Durinck, S.; Spellman, P.T.; Birney, E.; Huber, W. Mapping identifiers for the integration of genomic datasets with the R/Bioconductor package biomaRt. Nat. Protoc. 2009, 4, 1184–1191. [Google Scholar] [CrossRef] [PubMed] [Green Version]
- Anderson, C.A.; Pettersson, F.H.; Clarke, G.M.; Cardon, L.R.; Morris, A.P.; Zondervan, K.T. Data quality control in genetic case-control association studies. Nat. Protoc. 2010, 5, 1564–1573. [Google Scholar] [CrossRef] [PubMed] [Green Version]
- Marees, A.T.; de Kluiver, H.; Stringer, S.; Vorspan, F.; Curis, E.; Marie-Claire, C.; Derks, E.M. A tutorial on conducting genome-wide association studies: Quality control and statistical analysis. Int. J. Methods Psychiatr. Res. 2018, 27, e1608. [Google Scholar] [CrossRef] [PubMed]
- Das, S.; Forer, L.; Schönherr, S.; Sidore, C.; Locke, A.E.; Kwong, A.; Vrieze, S.I.; Chew, E.Y.; Levy, S.; McGue, M.; et al. Next-generation genotype imputation service and methods. Nat. Genet. 2016, 48, 1284–1287. [Google Scholar] [CrossRef] [PubMed] [Green Version]
- Taliun, D.; Harris, D.N.; Kessler, M.D.; Carlson, J.; Szpiech, Z.A.; Torres, R.; Taliun, S.A.G.; Corvelo, A.; Gogarten, S.M.; Kang, H.M.; et al. Sequencing of 53,831 diverse genomes from the NHLBI TOPMed Program. Nature 2021, 590, 290–299. [Google Scholar] [CrossRef]
- Purcell, S.; Neale, B.; Todd-Brown, K.; Thomas, L.; Ferreira, M.A.; Bender, D.; Maller, J.; Sklar, P.; De Bakker, P.I.; Daly, M.J.; et al. PLINK: A tool set for whole-genome association and population-based linkage analyses. Am. J. Hum. Genet. 2007, 81, 559–575. [Google Scholar] [CrossRef] [Green Version]
- de Leeuw, C.A.; Mooij, J.M.; Heskes, T.; Posthuma, D. MAGMA: Generalized gene-set analysis of GWAS data. PLoS Comput. Biol. 2015, 11, e1004219. [Google Scholar] [CrossRef]
- Turner, S.D. qqman: An R package for visualizing GWAS results using QQ and manhattan plots. Biorxiv 2014, 005165. [Google Scholar] [CrossRef]
- Zhu, Y. Bioconductor-DEqMS: A Tool to Perform Statistical Analysis of Differential Protein Expression for Quantitative Proteomics Data. R Package Version 2019, 1, 10-18129. [Google Scholar]
- Willer, C.J.; Li, Y.; Abecasis, G.R. METAL: Fast and efficient meta-analysis of genomewide association scans. Bioinformatics 2010, 26, 2190–2191. [Google Scholar] [CrossRef] [PubMed]
- Wang, X.; Kang, D.D.; Shen, K.; Song, C.; Lu, S.; Chang, L.C.; Liao, S.G.; Huo, Z.; Tang, S.; Ding, Y.; et al. An R package suite for microarray meta-analysis in quality control, differentially expressed gene analysis and pathway enrichment detection. Bioinformatics 2012, 28, 2534–2536. [Google Scholar] [CrossRef] [PubMed]
- Kolde, R.; Laur, S.; Adler, P.; Vilo, J. Robust rank aggregation for gene list integration and meta-analysis. Bioinformatics 2012, 28, 573–580. [Google Scholar] [CrossRef] [PubMed] [Green Version]
- Zhang, B.; Kirov, S.; Snoddy, J. WebGestalt: An integrated system for exploring gene sets in various biological contexts. Nucleic Acids Res. 2005, 33, W741–W748. [Google Scholar] [CrossRef]
- Walter, W.; Sánchez-Cabo, F.; Ricote, M. GOplot: An R package for visually combining expression data with functional analysis. Bioinformatics 2015, 31, 2912–2914. [Google Scholar] [CrossRef]
- The 1000 Genomes Project Consortium. A global reference for human genetic variation. Nature 2015, 526, 68–74. [Google Scholar] [CrossRef] [Green Version]
- Clough, E.; Barrett, T. The gene expression omnibus database. In Statistical Genomics; Springer: Berlin/Heidelberg, Germany, 2016; pp. 93–110. [Google Scholar]
- Shock, N.W. Normal human aging: The Baltimore longitudinal study of aging. JAMA 1986, 255, 960. [Google Scholar]
- Madrid, L.E.A. Integrated Genomic, Transcriptomic and Proteomic Analysis for Identifying Markers of Alzheimer’s Disease. Diagnosticsl 2021, 11, 2303. [Google Scholar] [CrossRef]
- de Rojas, I.; Moreno-Grau, S.; Tesi, N.; Grenier-Boley, B.; Andrade, V.; Jansen, I.E.; Pedersen, N.L.; Stringa, N.; Zettergren, A.; Hernández, I.; et al. Common variants in Alzheimer’s disease and risk stratification by polygenic risk scores. Nat. Commun. 2021, 12, 3417. [Google Scholar] [CrossRef]
- Ochoa, D.E.A. Open Targets Platform: Supporting systematic drug–target identification and prioritisation. Nucleic Acids Res. 2021, 49, D1302–D1310. [Google Scholar] [CrossRef]
- Lambert, J.C.; Ibrahim-Verbaas, C.A.; Harold, D.; Naj, A.C.; Sims, R.; Bellenguez, C.; Jun, G.; DeStefano, A.L.; Bis, J.C.; Beecham, G.W.; et al. Meta-analysis of 74,046 individuals identifies 11 new susceptibility loci for Alzheimer’s disease. Nat. Genet. 2013, 45, 1452–1458. [Google Scholar] [CrossRef] [PubMed] [Green Version]
- Gibbs, R.A.; Belmont, J.W.; Hardenbol, P.; Willis, T.D.; Yu, F.L.; Yang, H.M.; Ch’ang, L.Y.; Huang, W.; Liu, B.; Shen, Y.; et al. The International Hapmap Project; Nature Publishing Group: London, UK, 2003. [Google Scholar]
Publisher’s Note: MDPI stays neutral with regard to jurisdictional claims in published maps and institutional affiliations. |
© 2022 by the authors. Licensee MDPI, Basel, Switzerland. This article is an open access article distributed under the terms and conditions of the Creative Commons Attribution (CC BY) license (https://creativecommons.org/licenses/by/4.0/).