
Rehabilitation of Patients with Moderate Knee Osteoarthritis Using Hyaluronic Acid Viscosupplementation and Physiotherapy

 ,
,  ,
,  , and
, and
Abstract
:1. Introduction
2. Materials and Methods
2.1. Trial Procedure
2.2. Patients and Demographics
2.3. HA Injections
2.4. Procedure Steps (PS)
2.5. Study Design
2.6. Physiotherapy Treatment
2.7. Assessment Tests and Outcomes
Statistical Approach
3. Results
3.1. Patient Groups’ Descriptive Statistical Results
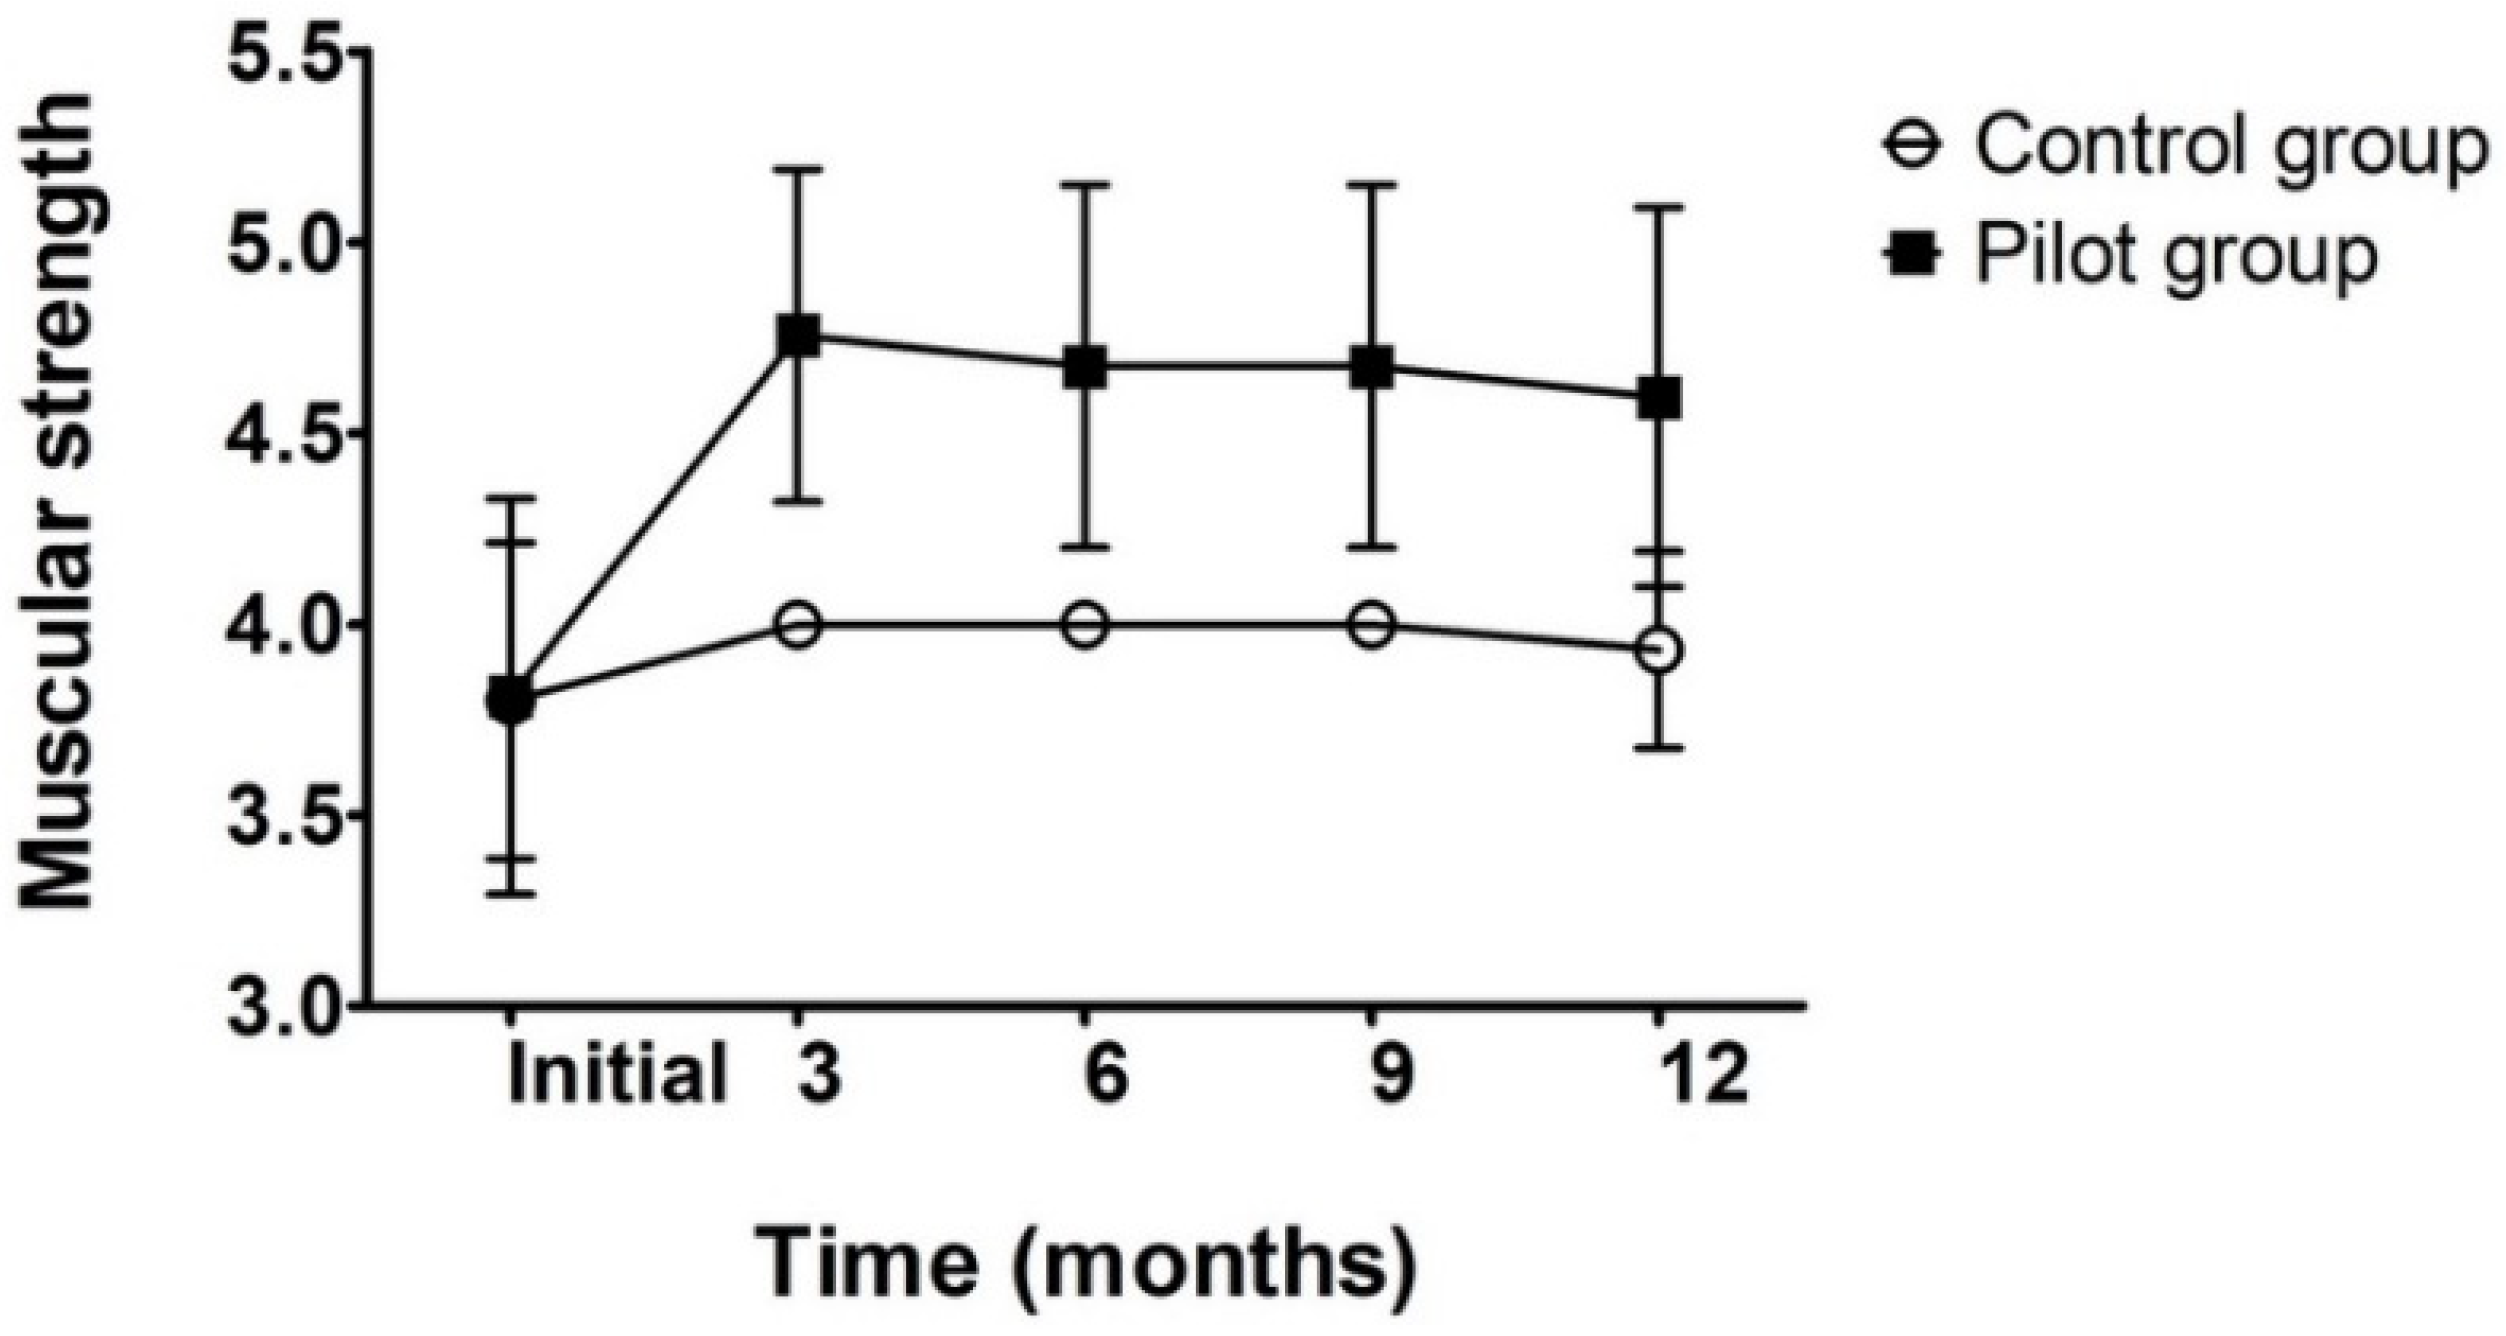
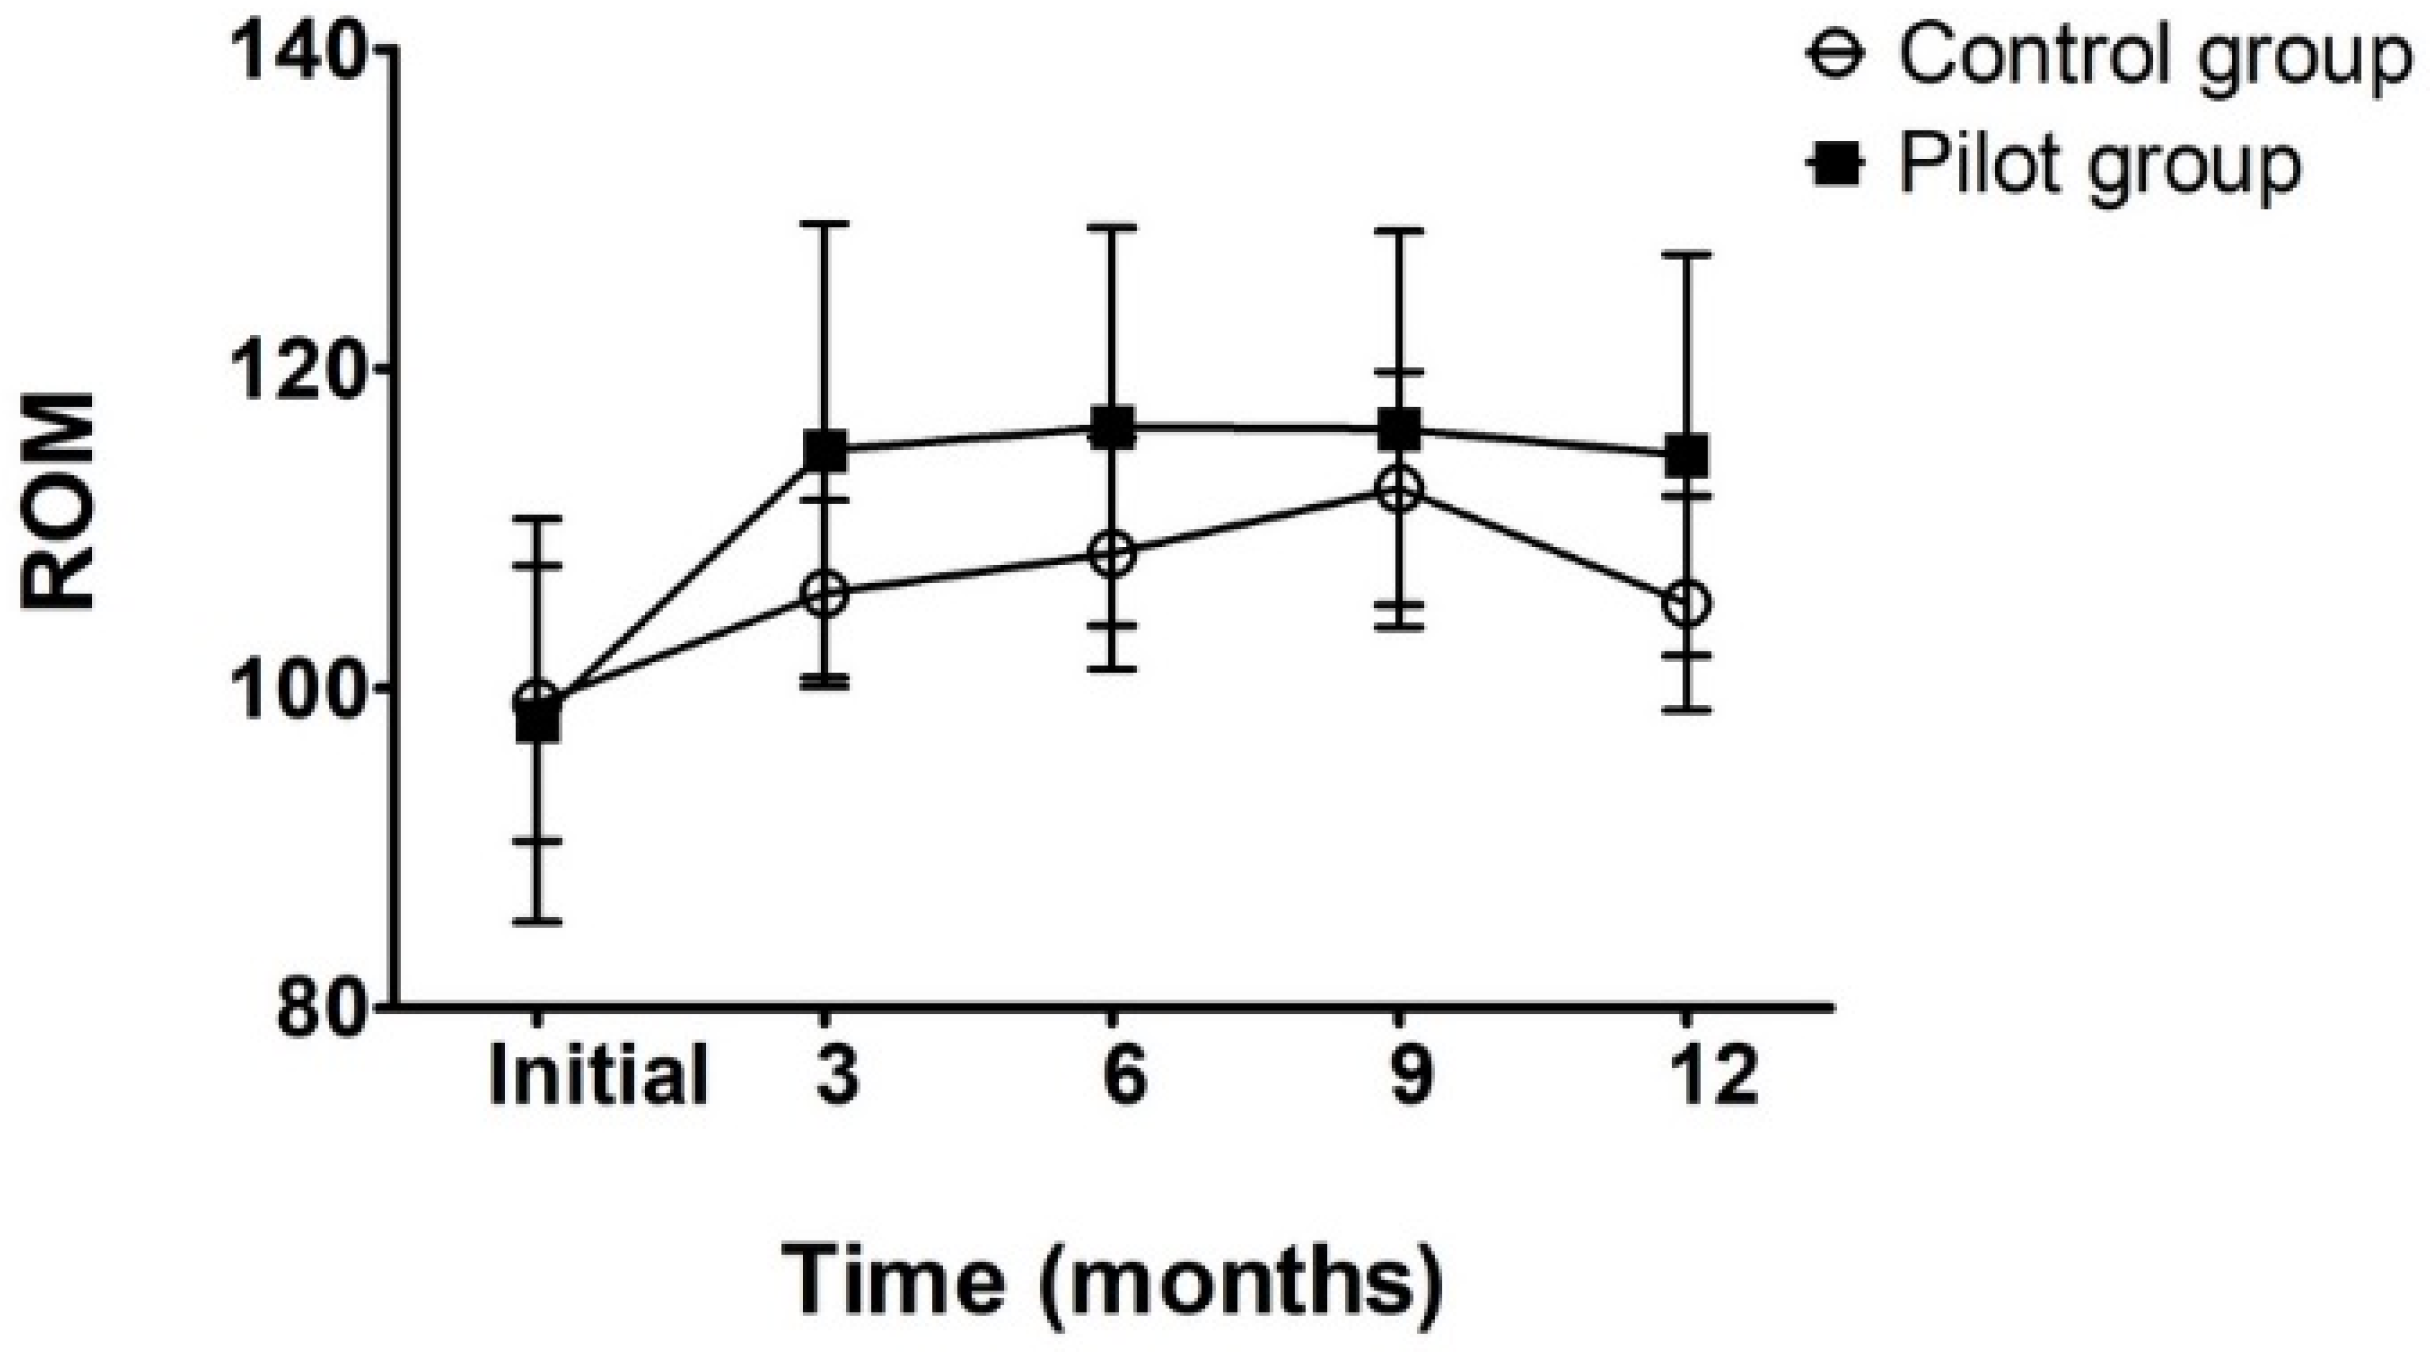
3.2. Patient Results Description
3.3. Descriptive Statistics
3.4. Statistical Difference Analysis
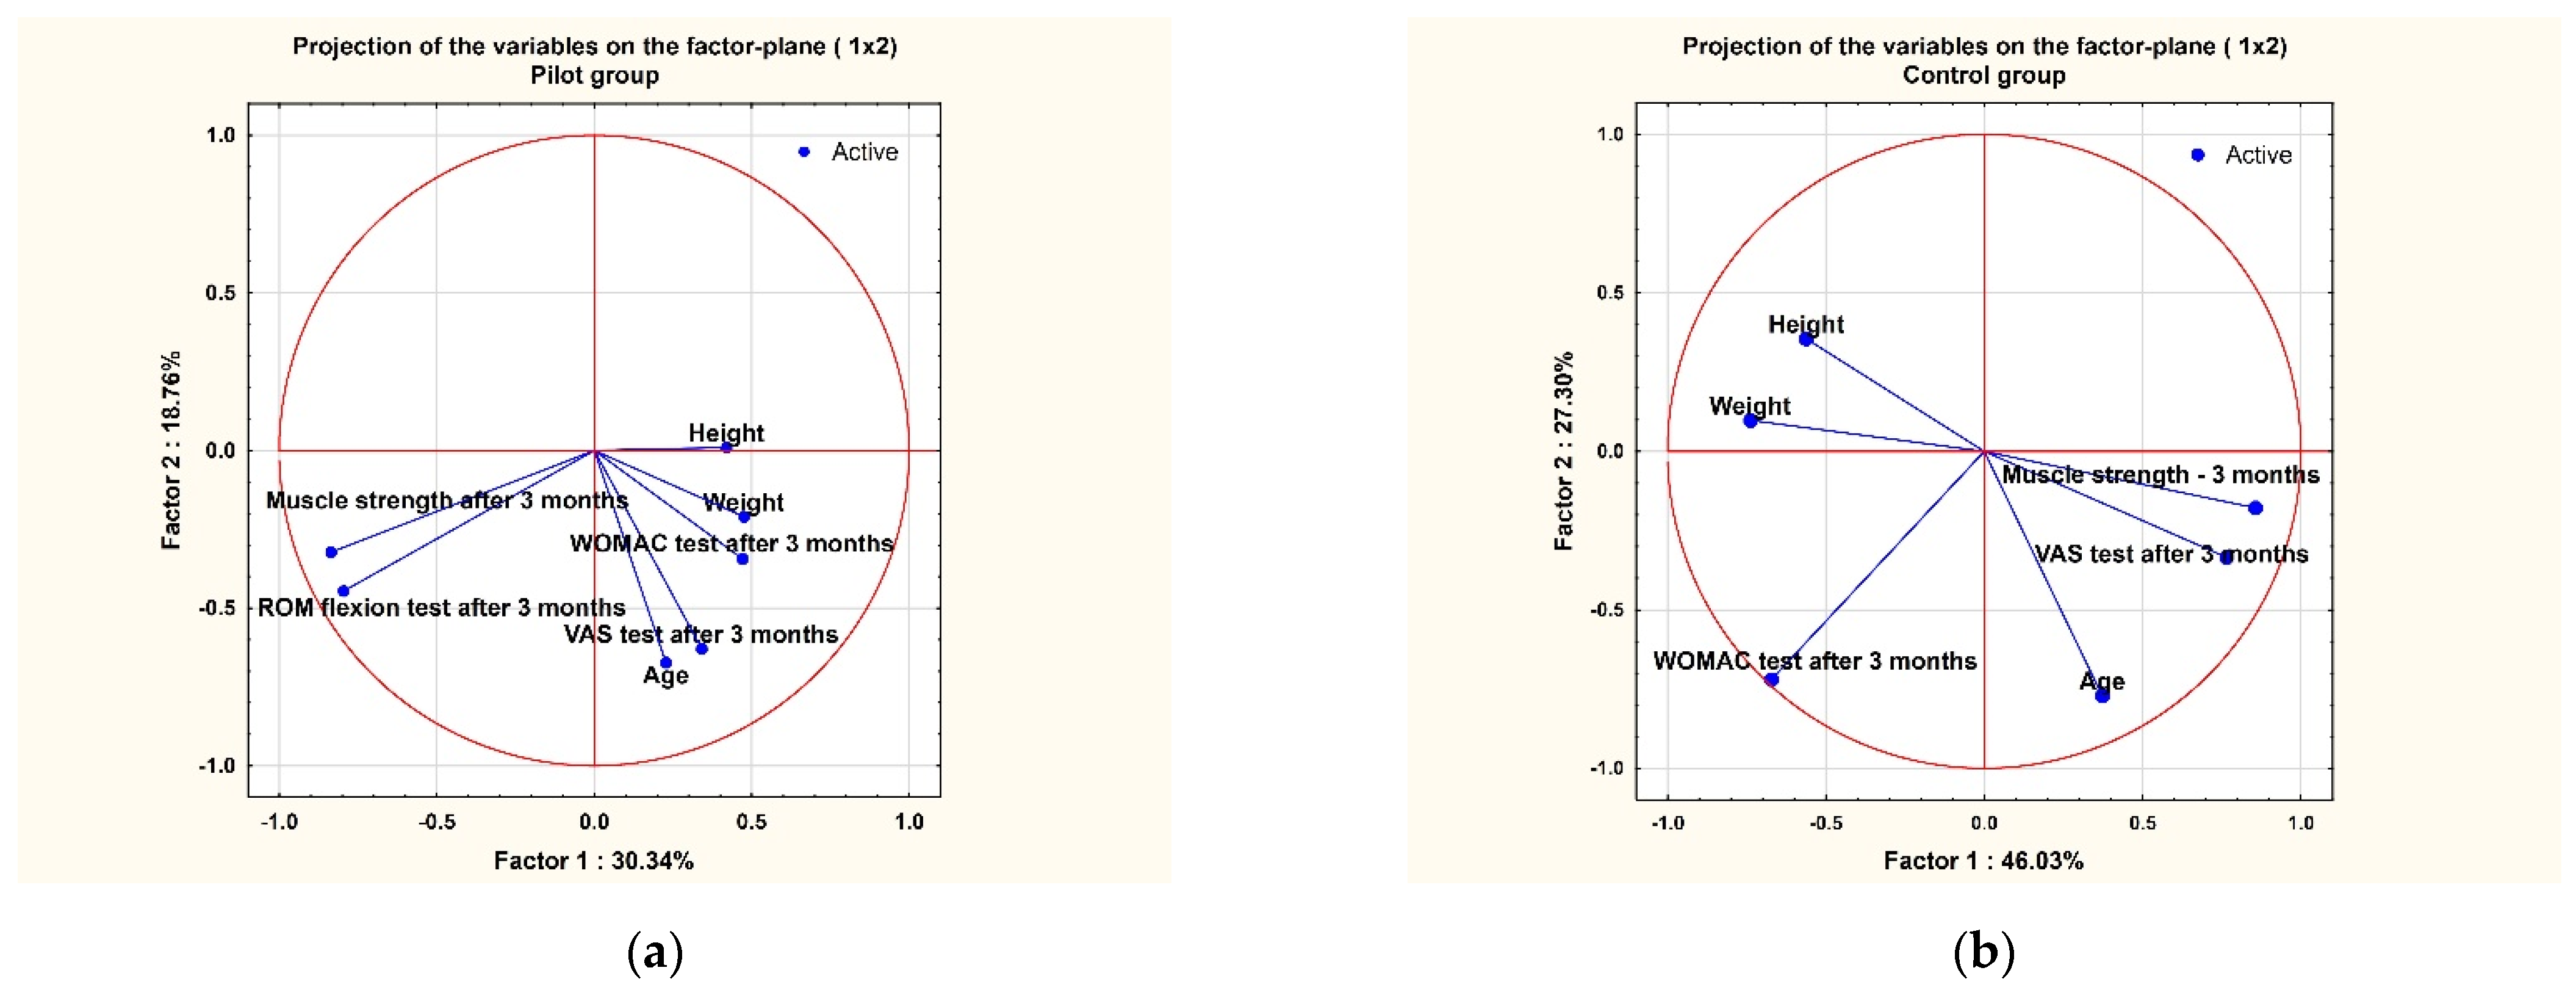
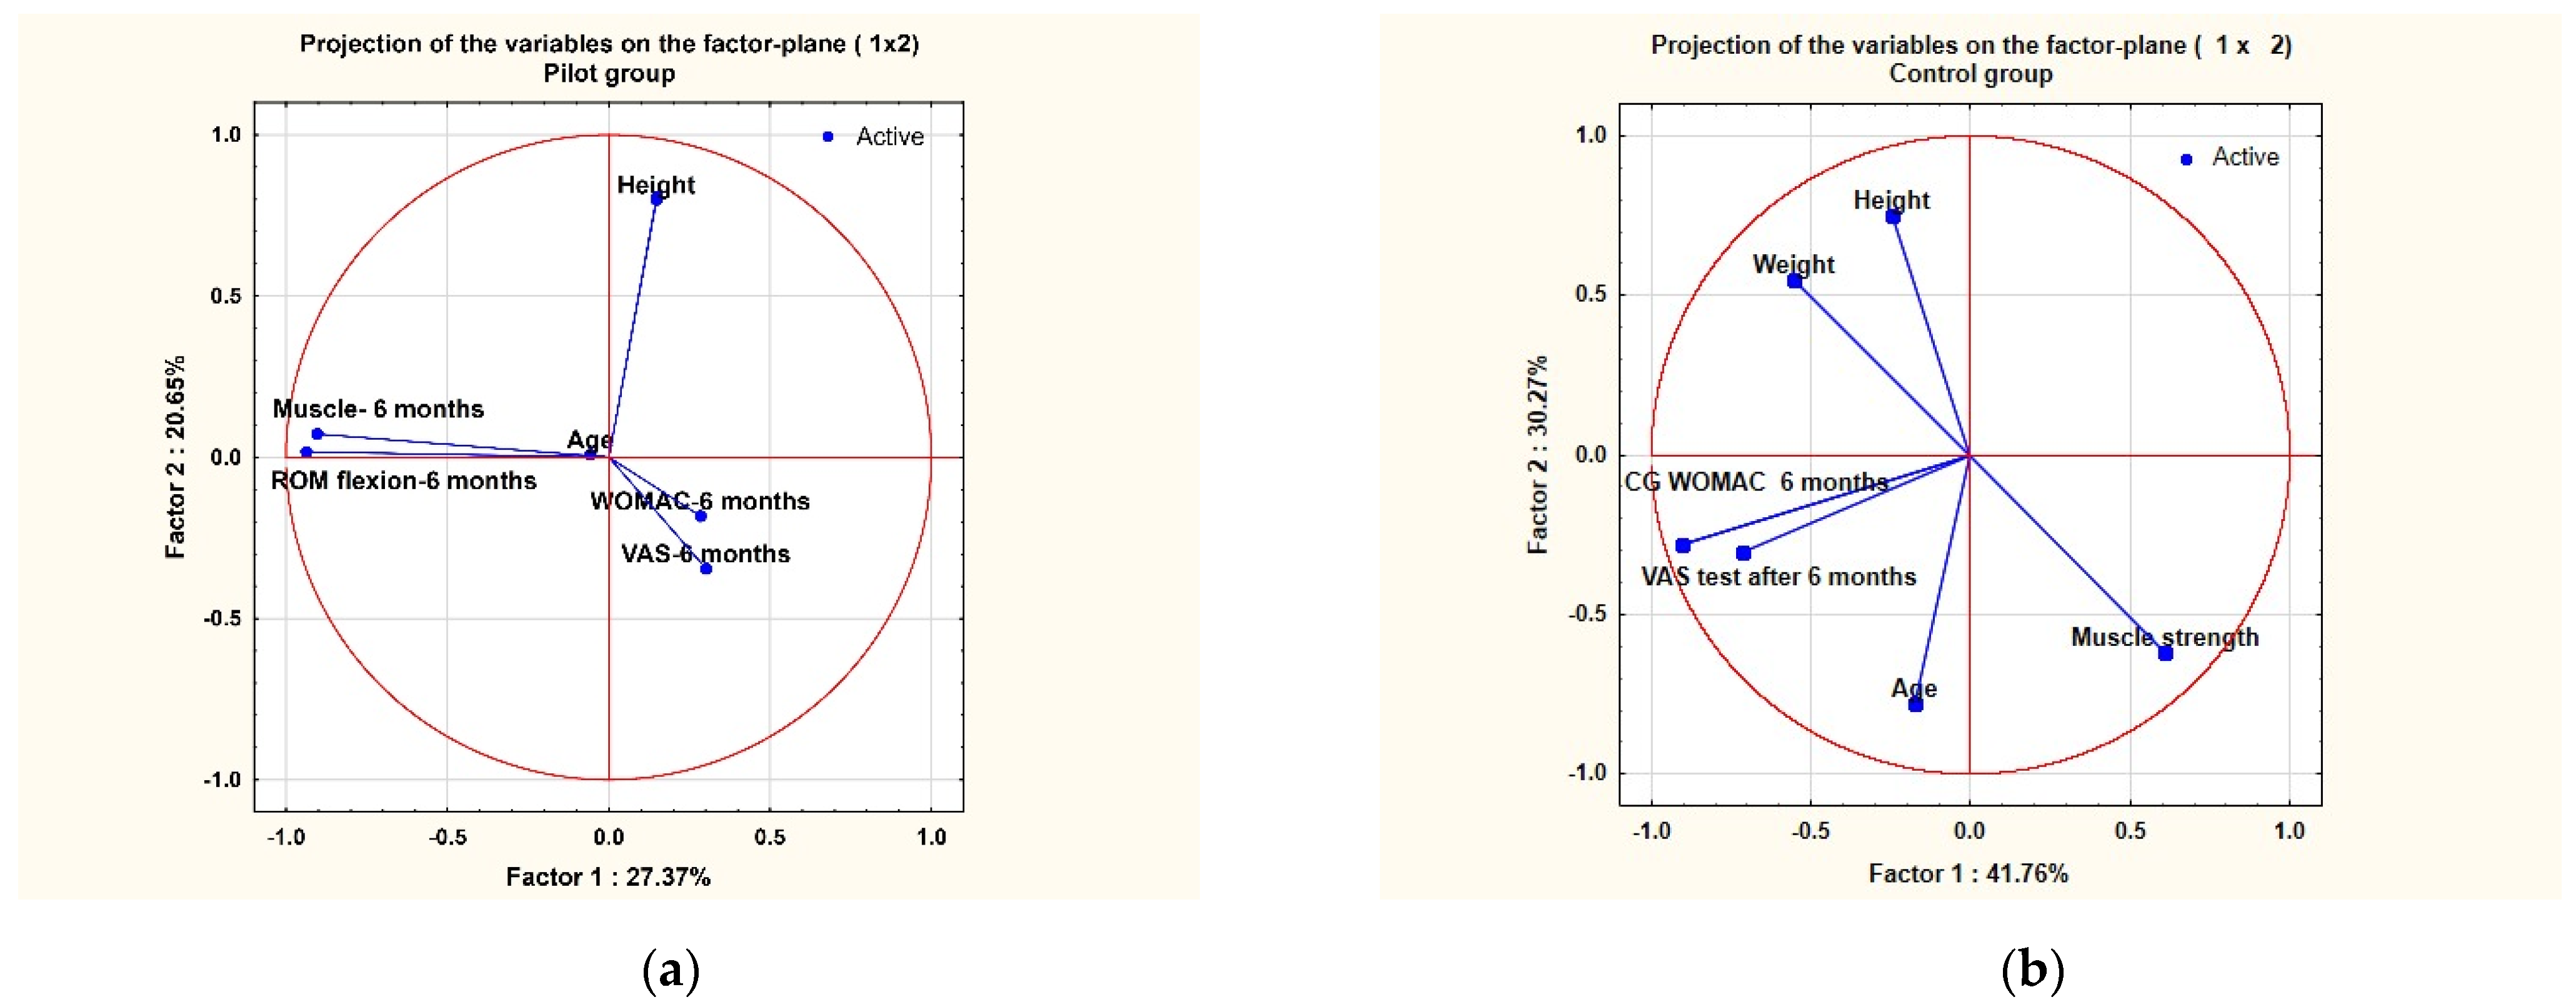
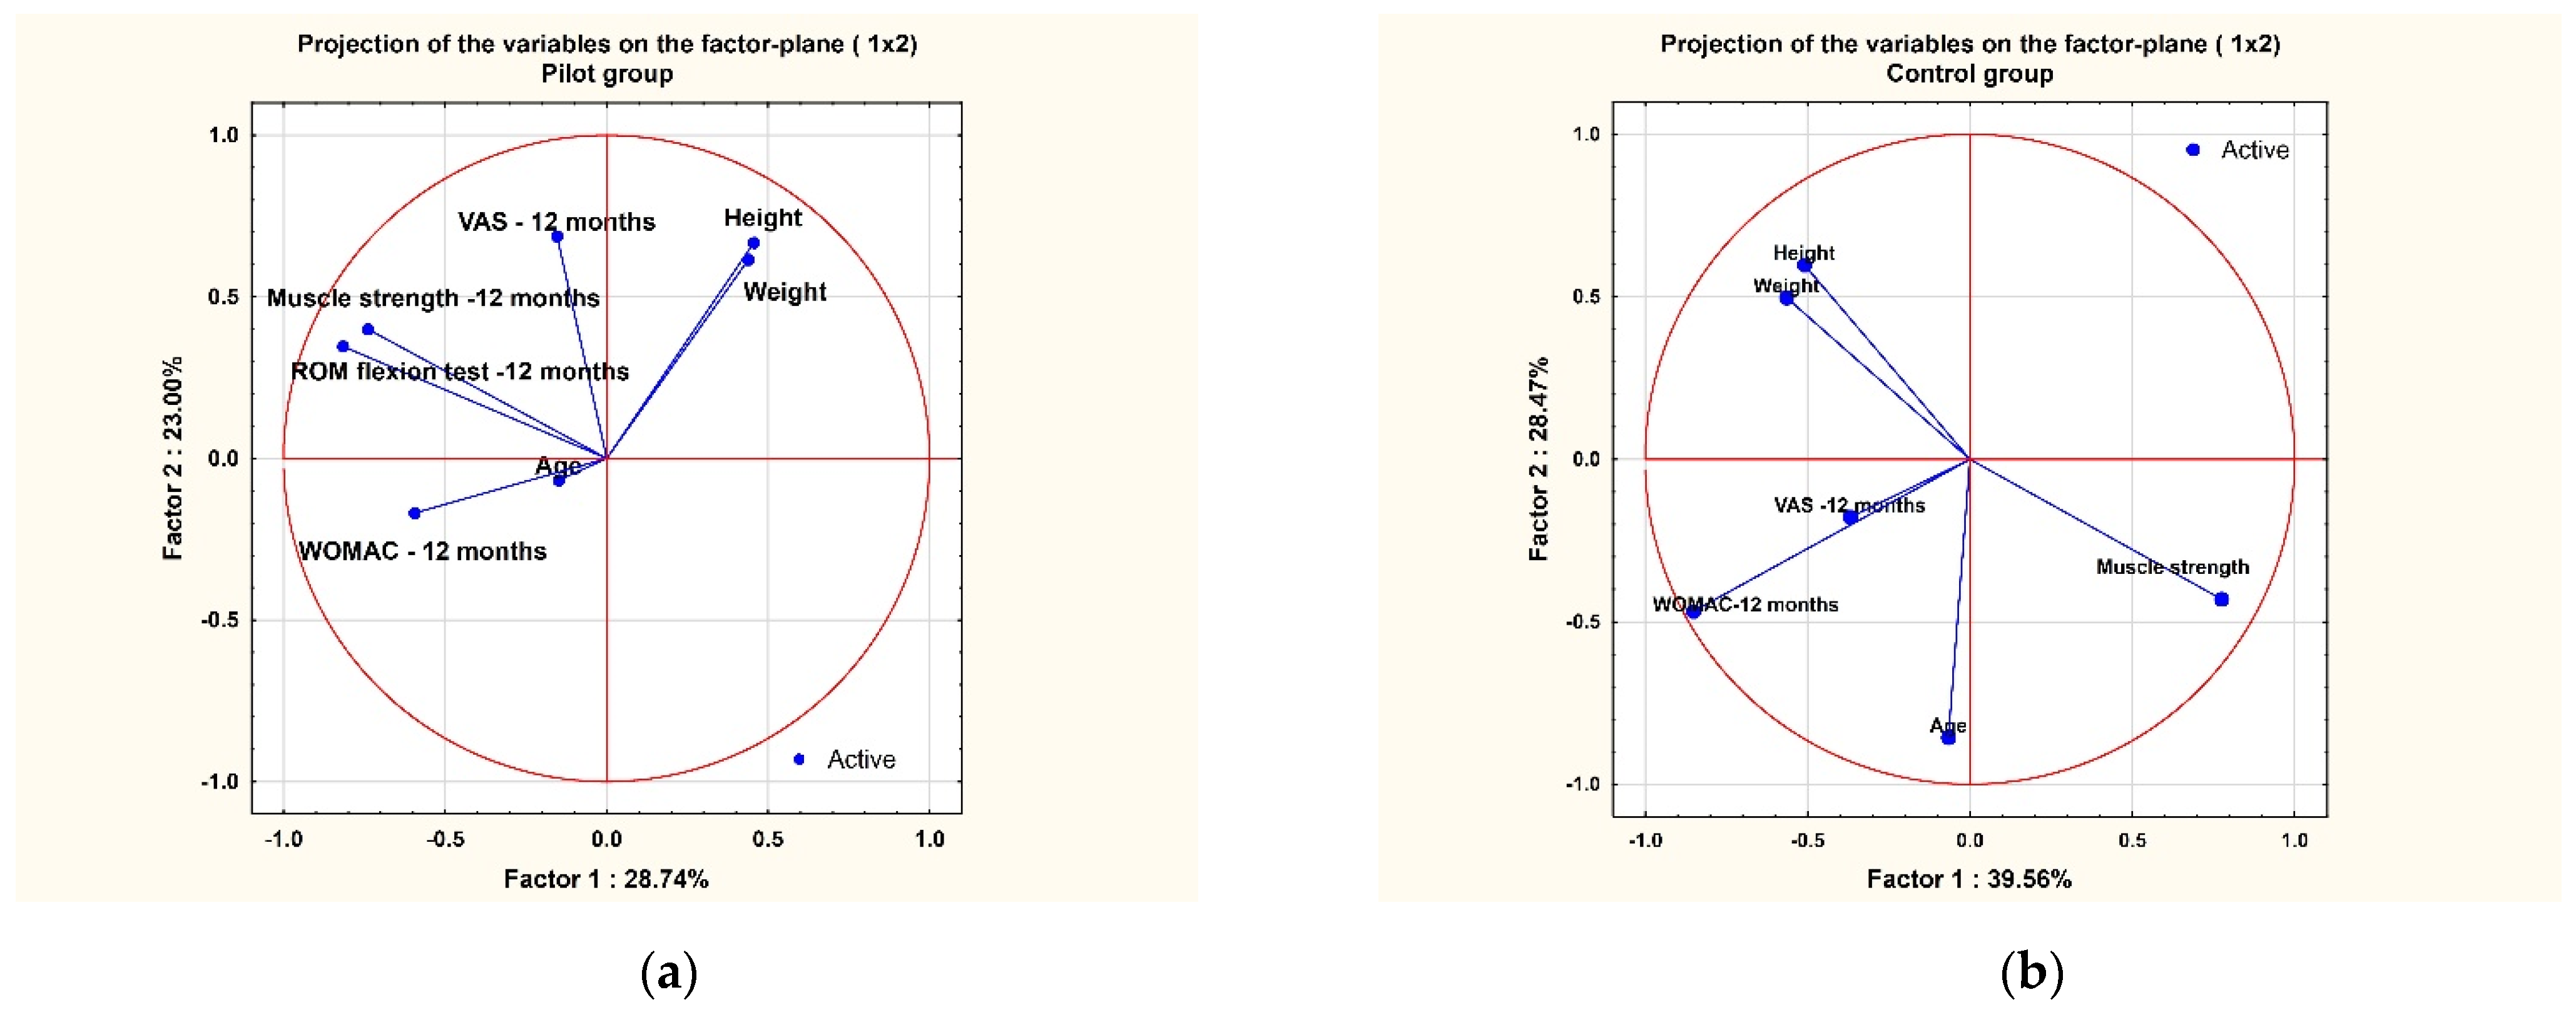
3.5. PCA Analysis
4. Discussion
5. Conclusions
Author Contributions
Funding
Institutional Review Board Statement
Informed Consent Statement
Data Availability Statement
Acknowledgments
Conflicts of Interest
References
- Hootman, J.M.; Helmick, C.G.; Barbour, K.E.; Theis, K.A.; Boring, M.A. Updated Projected Prevalence of Self-Reported Doctor-Diagnosed Arthritis and Arthritis-Attributable Activity Limitation Among US Adults, 2015–2040. Arthritis Rheumatol. 2016, 68, 1582–1587. [Google Scholar] [CrossRef]
- Hamood, R.; Tirosh, M.; Fallach, N.; Chodick, G.; Eisenberg, E.; Lubovsky, O. Prevalence and Incidence of Osteoarthritis: A Population-Based Retrospective Cohort Study. J. Clin. Med. 2021, 10, 4282. [Google Scholar] [CrossRef] [PubMed]
- Berenbaum, F. Osteoarthritis as an Inflammatory Disease (Osteoarthritis Is Not Osteoarthrosis!). Osteoarthr. Cartil. 2013, 21, 16–21. [Google Scholar] [CrossRef] [Green Version]
- Altman, R.D.; Bedi, A.; Karlsson, J.; Sancheti, P.; Schemitsch, E. Product Differences in Intra-Articular Hyaluronic Acids for Osteoarthritis of the Knee. Am. J. Sports Med. 2016, 44, 2158–2165. [Google Scholar] [CrossRef] [PubMed]
- Dahl, L.B.; Dahl, I.M.; Engström-Laurent, A.; Granath, K. Concentration and molecular weight of sodium hyaluronate in synovial fluid from patients with rheumatoid arthritis and other arthropathies. Ann. Rheum. Dis. 1985, 44, 817–822. [Google Scholar] [CrossRef] [Green Version]
- Smith, M.D.; Triantafillou, S.; Parker, A.; Youssef, P.P.; Coleman, M. Synovial membrane inflammation and cytokine production in patients with early osteoarthritis. J. Rheumatol. 1997, 24, 365–371. [Google Scholar] [PubMed]
- Yatabe, T.; Mochizuki, S.; Takizawa, M.; Chijiiwa, M.; Okada, A.; Kimura, T.; Fujita, Y.; Matsumoto, H.; Toyama, Y.; Okada, Y. Hyaluronan Inhibits Expression of ADAMTS4 (Aggrecanase-1) in Human Osteoarthritic Chondrocytes. Ann. Rheum. Dis. 2009, 68, 1051–1058. [Google Scholar] [CrossRef]
- Karna, E.; Miltyk, W.; Pałka, J.A.; Jarzabek, K.; Wołczyński, S. Hyaluronic Acid Counteracts Interleukin-1-Induced Inhibition of Collagen Biosynthesis in Cultured Human Chondrocytes. Pharmacol. Res. 2006, 54, 275–281. [Google Scholar] [CrossRef]
- Yasuda, T. Progress of research in osteoarthritis. Pharmacological effects of hyaluronan. Clin. Calcium 2009, 19, 1644–1652. [Google Scholar] [PubMed]
- Gupta, R.C.; Lall, R.; Srivastava, A.; Sinha, A. Hyaluronic Acid: Molecular Mechanisms and Therapeutic Trajectory. Front. Veter. Sci. 2019, 6, 192. [Google Scholar] [CrossRef] [Green Version]
- Zhang, W.; Moskowitz, R.W.; Nuki, G.; Abramson, S.; Altman, R.D.; Arden, N.; Bierma-Zeinstra, S.; Brandt, K.D.; Croft, P.; Doherty, M.; et al. OARSI Recommendations for the Management of Hip and Knee Osteoarthritis, Part II: OARSI Evidence-Based, Expert Consensus Guidelines. Osteoarthr. Cartil. 2008, 16, 137–162. [Google Scholar] [CrossRef] [PubMed] [Green Version]
- de Rezende, M.U.; de Campos, G.C. Viscosupplementation. Rev. Bras. Ortop. 2012, 47, 160–164. [Google Scholar] [CrossRef]
- Webb, D.; Naidoo, P. Viscosupplementation for Knee Osteoarthritis: A Focus on Hylan G-F 20. Orthop. Res. Rev. 2018, 10, 73–81. [Google Scholar] [CrossRef] [PubMed] [Green Version]
- Boutefnouchet, T.; Puranik, G.; Holmes, E.; Bell, K.M. Hylan GF-20 Viscosupplementation in the Treatment of Symptomatic Osteoarthritis of the Knee: Clinical Effect Survivorship at 5 Years. Knee Surg. Relat. Res. 2017, 29, 129–136. [Google Scholar] [CrossRef] [PubMed] [Green Version]
- Hsieh, Y.-S.; Yang, S.-F.; Lue, K.-H.; Chu, S.-C.; Lu, K.-H. Effects of Different Molecular Weight Hyaluronan Products on the Expression of Urokinase Plasminogen Activator and Inhibitor and Gelatinases during the Early Stage of Osteoarthritis. J. Orthop. Res. 2008, 26, 475–484. [Google Scholar] [CrossRef]
- Liang, J.; Jiang, D.; Noble, P.W. Hyaluronan as a Therapeutic Target in Human Diseases. Adv. Drug Deliv. Rev. 2016, 97, 186–203. [Google Scholar] [CrossRef] [PubMed] [Green Version]
- Ghosh, P.; Guidolin, D. Potential Mechanism of Action of Intra-Articular Hyaluronan Therapy in Osteoarthritis: Are the Effects Molecular Weight Dependent? Semin. Arthritis Rheum. 2002, 32, 10–37. [Google Scholar] [CrossRef] [PubMed]
- Bowman, S.; Awad, M.E.; Hamrick, M.W.; Hunter, M.; Fulzele, S. Recent advances in hyaluronic acid based therapy for osteoarthritis. Clin. Transl. Med. 2018, 7, 6. [Google Scholar] [CrossRef] [Green Version]
- Brandt, K.D.; Block, J.A.; Michalski, J.P.; Moreland, L.W.; Caldwell, J.R.; Lavin, P.T. Efficacy and Safety of Intraarticular Sodium Hyaluronate in Knee Osteoarthritis. ORTHOVISC Study Group. Clin. Orthop. Relat. Res. 2001, 385, 130–143. [Google Scholar] [CrossRef] [PubMed]
- Hunter, D.J. Viscosupplementation for Osteoarthritis of the Knee. N. Engl. J. Med. 2015, 372, 1040–1047. [Google Scholar] [CrossRef] [PubMed]
- Iijima, H.; Eguchi, R.; Shimoura, K.; Yamada, K.; Aoyama, T.; Takahashi, M. Transcutaneous Electrical Nerve Stimulation Improves Stair Climbing Capacity in People with Knee Osteoarthritis. Sci. Rep. 2020, 10, 7294. [Google Scholar] [CrossRef] [PubMed]
- Mota, R.E.M.; Tarricone, R.; Ciani, O.; Bridges, J.F.P.; Drummond, M. Determinants of Demand for Total Hip and Knee Arthroplasty: A Systematic Literature Review. BMC Health Serv. Res. 2012, 12, 225. [Google Scholar] [CrossRef] [Green Version]
- Cherian, J.J.; Harrison, P.E.; Benjamin, S.A.; Bhave, A.; Harwin, S.F.; Mont, M.A. Do the Effects of Transcutaneous Electrical Nerve Stimulation on Knee Osteoarthritis Pain and Function Last? J. Knee Surg. 2016, 29, 497–501. [Google Scholar] [CrossRef] [PubMed]
- Do Carmo Almeida, T.C.; Dos Santos Figueiredo, F.W.; Barbosa Filho, V.C.; de Abreu, L.C.; Fonseca, F.L.A.; Adami, F. Effects of Transcutaneous Electrical Nerve Stimulation on Proinflammatory Cytokines: Systematic Review and Meta-Analysis. Mediat. Inflamm. 2018, 2018, 1094352. [Google Scholar] [CrossRef] [PubMed] [Green Version]
- Tumilty, S.; Munn, J.; McDonough, S.; Hurley, D.A.; Basford, J.R.; Baxter, G.D. Low Level Laser Treatment of Tendinopathy: A Systematic Review with Meta-analysis. Photomed. Laser Surg. 2010, 28, 3–16. [Google Scholar] [CrossRef] [PubMed]
- Smoot, B.; Chiavola-Larson, L.; Lee, J.; Manibusan, H.; Allen, D.D. Effect of Low-Level Laser Therapy on Pain and Swelling in Women with Breast Cancer-Related Lymphedema: A Systematic Review and Meta-Analysis. J. Cancer Surviv. 2015, 9, 287–304. [Google Scholar] [CrossRef] [PubMed]
- Hegedus, B.; Viharos, L.; Gervain, M.; Gálfi, M. The Effect of Low-Level Laser in Knee Osteoarthritis: A Double-Blind, Randomized, Placebo-Controlled Trial. Photomed. Laser Surg. 2009, 27, 577–584. [Google Scholar] [CrossRef] [PubMed] [Green Version]
- Rothenberg, J.B.; Jayaram, P.; Naqvi, U.; Gober, J.; Malanga, G.A. The Role of Low-Intensity Pulsed Ultrasound on Cartilage Healing in Knee Osteoarthritis: A Review. PM&R 2017, 9, 1268–1277. [Google Scholar] [CrossRef]
- Paliwal, S.; Mitragotri, S. Therapeutic Opportunities in Biological Responses of Ultrasound. Ultrasonics 2008, 48, 271–278. [Google Scholar] [CrossRef]
- Schumann, D.; Kujat, R.; Zellner, J.; Angele, M.K.; Nerlich, M.; Mayr, E.; Angele, P. Treatment of Human Mesenchymal Stem Cells with Pulsed Low Intensity Ultrasound Enhances the Chondrogenic Phenotype In Vitro. Biorheology 2006, 43, 431–443. [Google Scholar] [PubMed]
- Zhang, C.; Xie, Y.; Luo, X.; Ji, Q.; Lu, C.; He, C.; Wang, P. Effects of Therapeutic Ultrasound on Pain, Physical Functions and Safety Outcomes in Patients with Knee Osteoarthritis: A Systematic Review and Meta-Analysis. Clin. Rehabilit. 2016, 30, 960–971. [Google Scholar] [CrossRef]
- De Oliveira Perrucini, P.D.; Poli-Frederico, R.C.; de Almeida Pires-Oliveira, D.A.; Dragonetti Bertin, L.; Beltrão Pires, F.; Shimoya-Bittencourt, W.; Martins Santos, V.; Medeiros Coelho, J.; Franco de Oliveira, R. Anti-Inflammatory and Healing Effects of Pulsed Ultrasound Therapy on Fibroblasts. Am. J. Phys. Med. Rehabilit. 2019, 99, 19–25. [Google Scholar] [CrossRef] [PubMed]
- Dantas, L.O.; Moreira, R.D.F.C.; Norde, F.M.; Serrão, P.R.; Alburquerque-Sendín, F.; Salvini, T.F. The Effects of Cryotherapy on Pain and Function in Individuals with Knee Osteoarthritis: A Systematic Review of Randomized Controlled Trials. Clin. Rehabilit. 2019, 33, 1310–1319. [Google Scholar] [CrossRef]
- Barbosa, G.M.; Cunha, J.E.; Cunha, T.M.; Martinho, L.B.; Castro, P.A.T.S.; Oliveira, F.F.B.; Cunha, F.Q.; Ramalho, F.S.; Salvini, T.F. Clinical-like Cryotherapy Improves Footprint Patterns and Reduces Synovial Inflammation in a Rat Model of Post-Traumatic Knee Osteoarthritis. Sci. Rep. 2019, 9, 14518. [Google Scholar] [CrossRef] [PubMed] [Green Version]
- Dantas, L.O.; Jorge, A.E.; Regina Mendes da Silva Serrão, P.; Aburquerque-Sendín, F.; de Fatima Salvini, T. Cryotherapy Associated with Tailored Land-Based Exercises for Knee Osteoarthritis: A Protocol for a Double-Blind Sham-Controlled Randomised Trial. BMJ Open 2020, 10, e035610. [Google Scholar] [CrossRef]
- Hou, Y.; Yang, Z.; Lin, J.; Chen, Y.; Xing, D.; Wang, B. Systematic Review of Clinical Practice Guidelines on Exercise Therapy for Knee Osteoarthritis and Critical Appraisal Using AGREEII Instrument. Osteoarthr. Cartil. 2018, 26, S324–S325. [Google Scholar] [CrossRef] [Green Version]
- Song, Q.; Shen, P.; Mao, M.; Sun, W.; Zhang, C.; Li, L. Proprioceptive neuromuscular facilitation improves pain and descending mechanics among elderly with knee osteoarthritis. Scand. J. Med. Sci. Sports 2020, 30, 1655–1663. [Google Scholar] [CrossRef] [PubMed]
- Noyes, F. Noyes’ Knee Disorders: Surgery, Rehabilitation, Clinical Outcomes, 1st ed.; Saunders: Philadelphia, PA, USA, 2009; ISBN 978-1-4377-2118-8. [Google Scholar]
- Schulz, K.F.; Altman, D.G.; Moher, D. CONSORT 2010 statement: Updated guidelines for reporting parallel group randomized trials. BMC Med. 2010, 8, 18. [Google Scholar] [CrossRef] [PubMed] [Green Version]
- Faiz, K.W. VAS—Visual Analog Scale. Tidsskr. Nor. Laegeforen 2014, 134, 323. [Google Scholar] [CrossRef] [PubMed]
- Alghadir, A.H.; Anwer, S.; Iqbal, A.; Iqbal, Z.A. Test-Retest Reliability, Validity, and Minimum Detectable Change of Visual Analog, Numerical Rating, and Verbal Rating Scales for Measurement of Osteoarthritic Knee Pain. J. Pain Res. 2018, 11, 851–856. [Google Scholar] [CrossRef] [Green Version]
- Silman, A.; Smolen, J.; Weinblatt, M.; Weisman, M.; Hochberg, M.; Gravallese, E. Rheumatology, 2-Volume Set, 7th ed.; Elsevier: Amsterdam, The Netherlands, 2018; ISBN 978-0-7020-7306-9. [Google Scholar]
- Brown, M.; Avers, D. Daniels and Worthingham’s Muscle Testing, 10th ed.Saunders: Philadelphia, PA, USA, 2018; ISBN 978-0-323-56956-9. [Google Scholar]
- Rice, D.A.; McNair, P.J. Quadriceps Arthrogenic Muscle Inhibition: Neural Mechanisms and Treatment Perspectives. Semin. Arthritis Rheum. 2010, 40, 250–266. [Google Scholar] [CrossRef] [PubMed]
- Becker, R.; Berth, A.; Nehring, M.; Awiszus, F. Neuromuscular quadriceps dysfunction prior to osteoarthritis of the knee. J. Orthop. Res. 2004, 22, 768–773. [Google Scholar] [CrossRef] [PubMed]
- Norkin, C.C.; White, D.J. Measurement of Joint Motion: A Guide to Goniometry; FA Davis: New York, NY, USA, 2009; ISBN 978-0-8036-2347-7. [Google Scholar]
- Benner, R.W.; Shelbourne, K.D.; Bauman, S.N.; Norris, A.; Gray, T. Knee Osteoarthritis: Alternative Range of Motion Treatment. Orthop. Clin. N. Am. 2019, 50, 425–432. [Google Scholar] [CrossRef] [PubMed]
- Murariu, G.; Popa, P.; Timofti, M.; Georgescu, L.P. Multivariate statistical analyses of Danube river water quality at Galati, Romania. Environ. Eng. Manag. J. 2018, 17, 1249–1266. [Google Scholar] [CrossRef]
- Kyu, H.H.; Abate, D.; Abate, K.H.; Abay, S.M.; Abbafati, C.; Abbasi, N.; Abbastabar, H.; Abd-Allah, F.; Abdela, J.; Abdelalim, A.; et al. Global, regional, and national disability-adjusted life-years (DALYs) for 359 diseases and injuries and healthy life expectancy (HALE) for 195 countries and territories, 1990–2017: A systematic analysis for the Global Burden of Disease Study 2017. Lancet 2018, 392, 1859–1922. [Google Scholar] [CrossRef] [Green Version]
- March, L.; Cross, M.; Lo, C.; Arden, N.; Gates, L.; Leyland, K.; Hawker, G.; King, L. Osteoarthritis: A Serious Disease. OARSI org. 2016, pp. 1–103. Available online: https://oarsi.org/sites/default/files/docs/2016/oarsi_white_paper_oa_serious_disease_121416_1.pdf (accessed on 1 March 2022).
- Cross, M.; Smith, E.; Hoy, D.; Nolte, S.; Ackerman, I.; Fransen, M.; Bridgett, L.; Williams, S.; Guillemin, F.; Hill, C.L.; et al. The global burden of hip and knee osteoarthritis: Estimates from the Global Burden of Disease 2010 study. Ann. Rheum. Dis. 2014, 73, 1323–1330. [Google Scholar] [CrossRef] [PubMed]
- Chae, K.J.; Choi, M.J.; Kim, K.Y.; Ajayi, F.F.; Chang, I.S.; Kim, I.S. Osteoarthritis: Careand Management: Clinical Guideline; National Institute for Health and Care, 2014; Available online: https://www.nice.org (accessed on 1 March 2022).
- Bannuru, R.R.; Osani, M.C.; Vaysbrot, E.E.; Arden, N.K.; Bennell, K.; Bierma-Zeinstra, S.M.A.; Kraus, V.B.; Lohmander, L.S.; Abbott, J.H.; Bhandari, M.; et al. OARSI guidelines for the non-surgical management of knee, hip, and polyarticular osteoarthritis. Osteoarthr. Cartil. 2019, 27, 1578–1589. [Google Scholar] [CrossRef] [PubMed] [Green Version]
- Rozental, T.D.; Sculco, T.P. Intra-articular corticosteroids: An updated overview. Am. J. Orthop. 2000, 29, 18–23. [Google Scholar]
- Pourcho, A.M.; Smith, J.; Wisniewski, S.J.; Sellon, J.L. Intraarticular platelet-rich plasma injection in the treatment of knee osteoarthritis: Review and recommendations. Am. J. Phys. Med. Rehabilit. 2014, 93, S108–S121. [Google Scholar] [CrossRef]


| Characteristic | Total Cohort (n = 52) | Pilot Group (HA Injection + PT) (n = 37) | Control Group (HA Injection) (n = 15) |
|---|---|---|---|
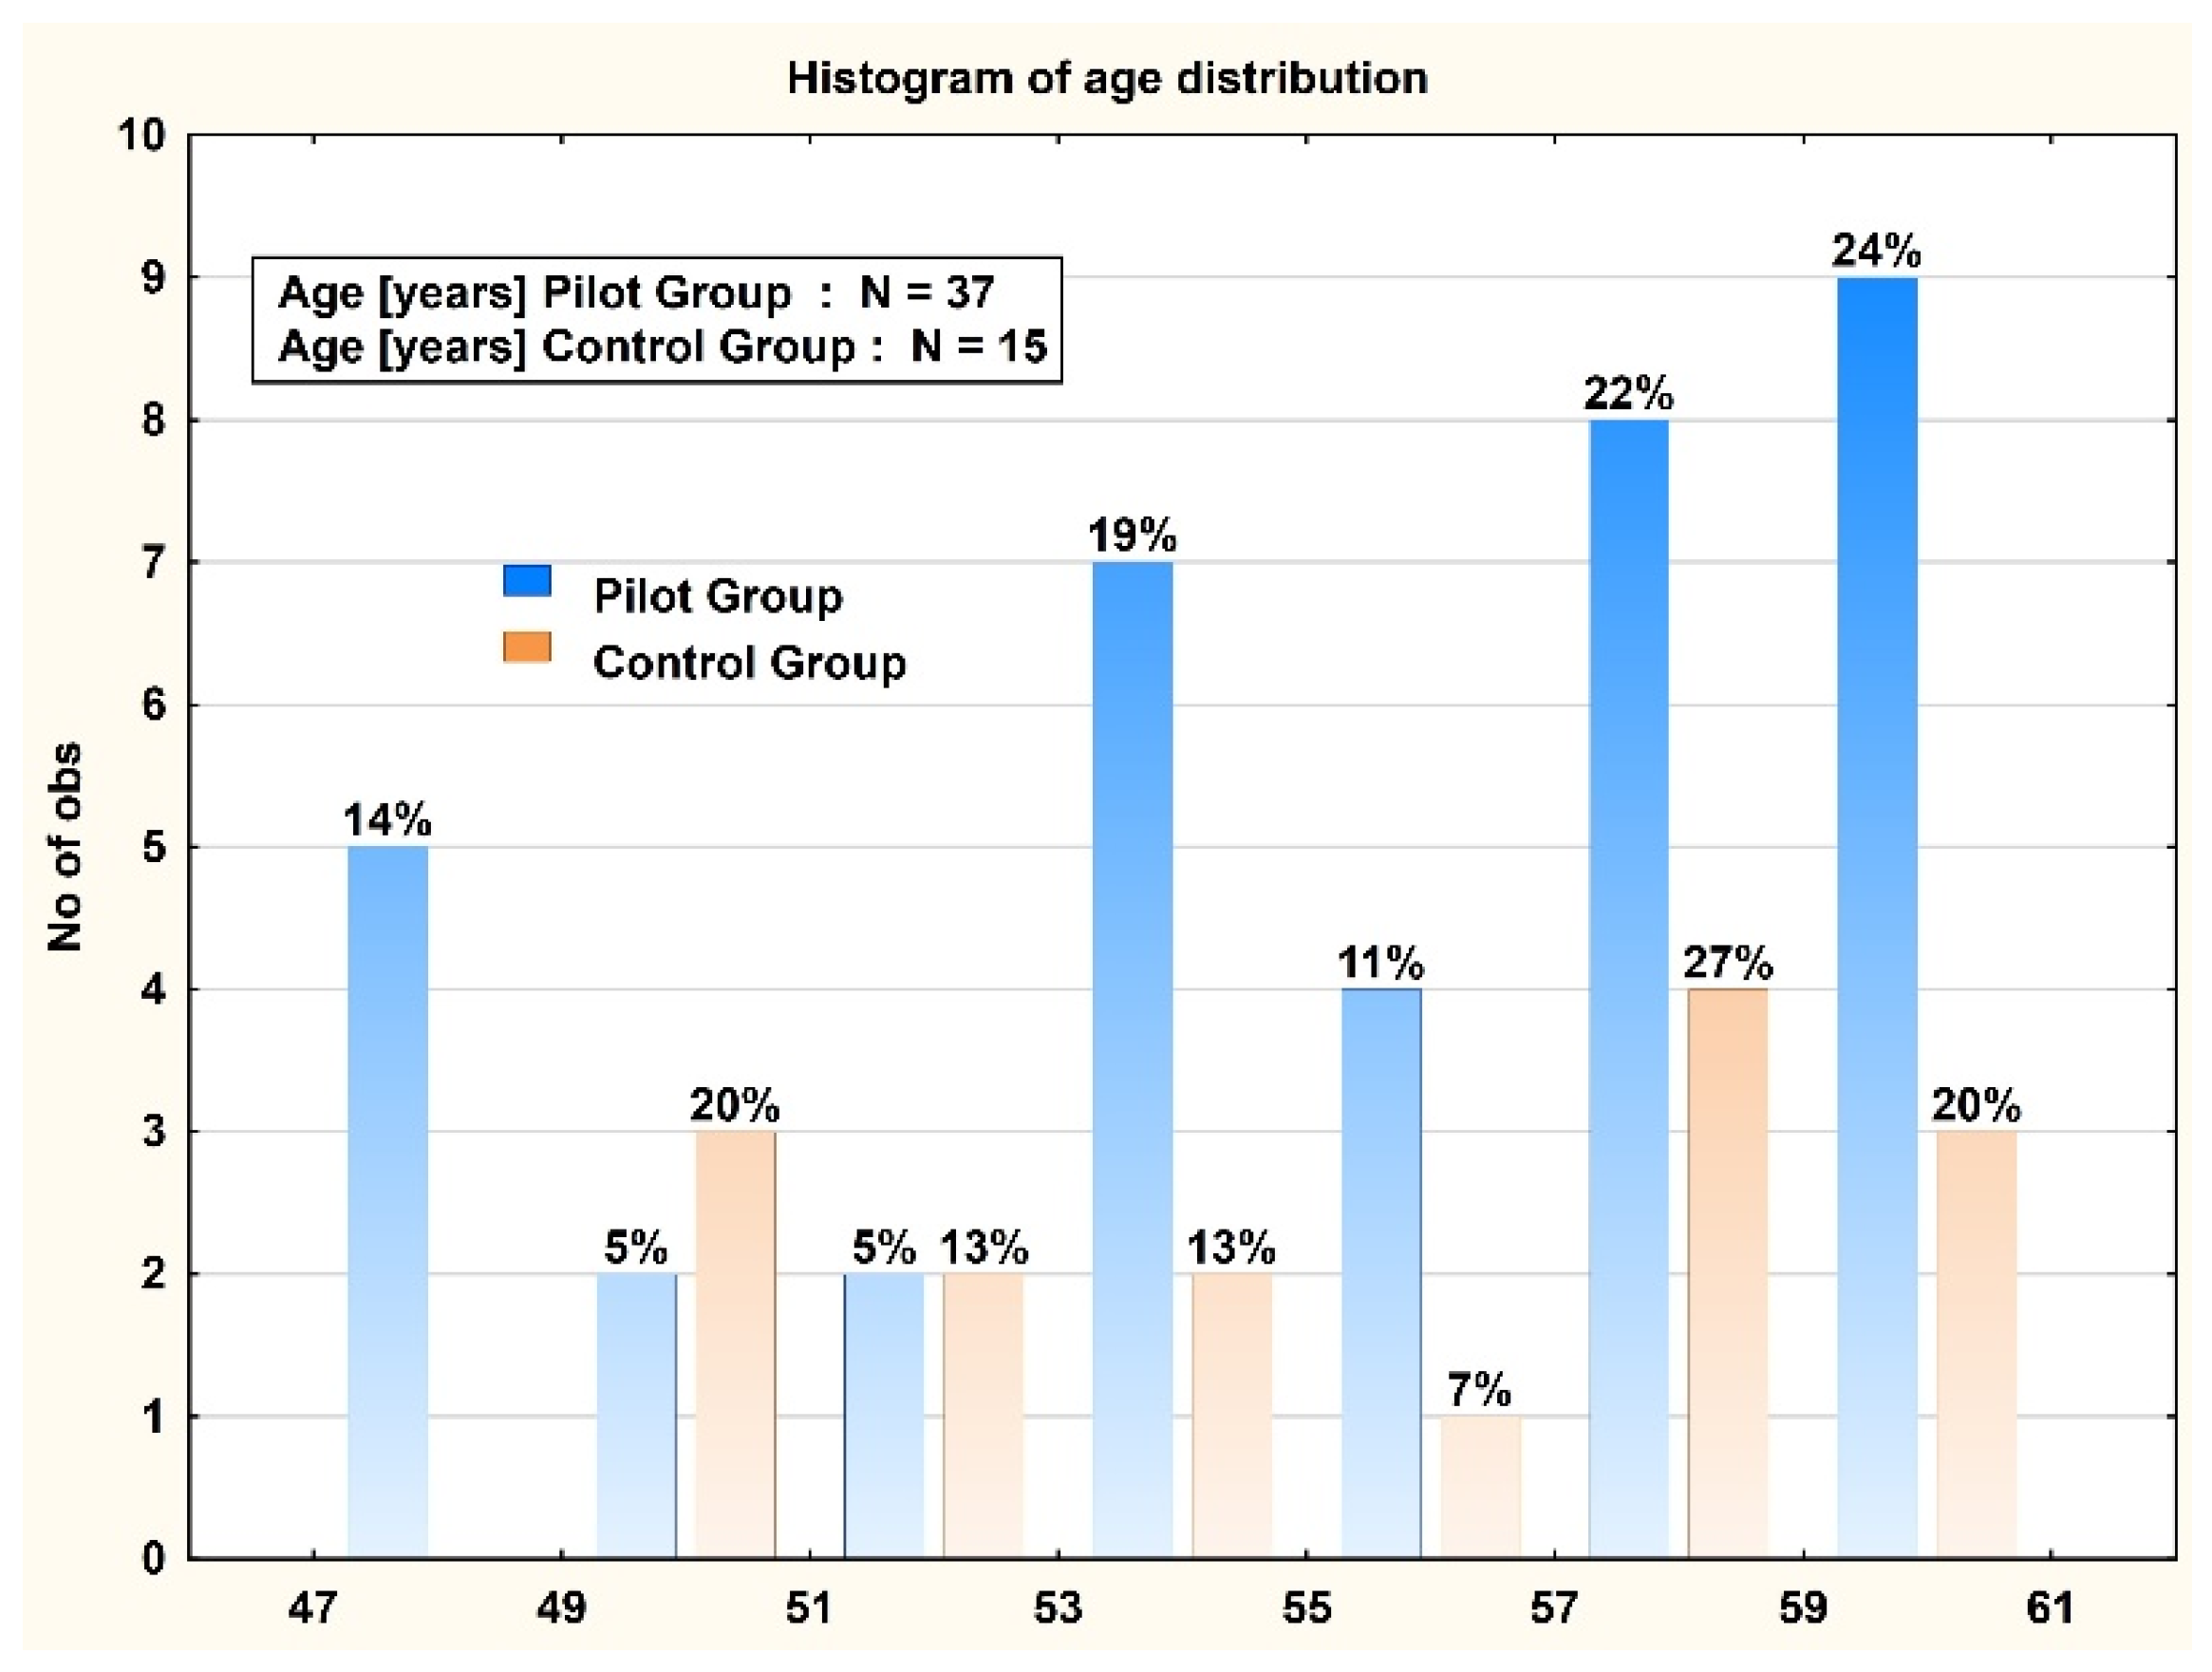
| Age (years) | 55.9 ± 4.1 | 55.8 ± 4.2 | 56.1 ± 4.0 |
| Female gender—no. (%) | 26 (13.5) | 16 (5.9) | 10 (1.6) |
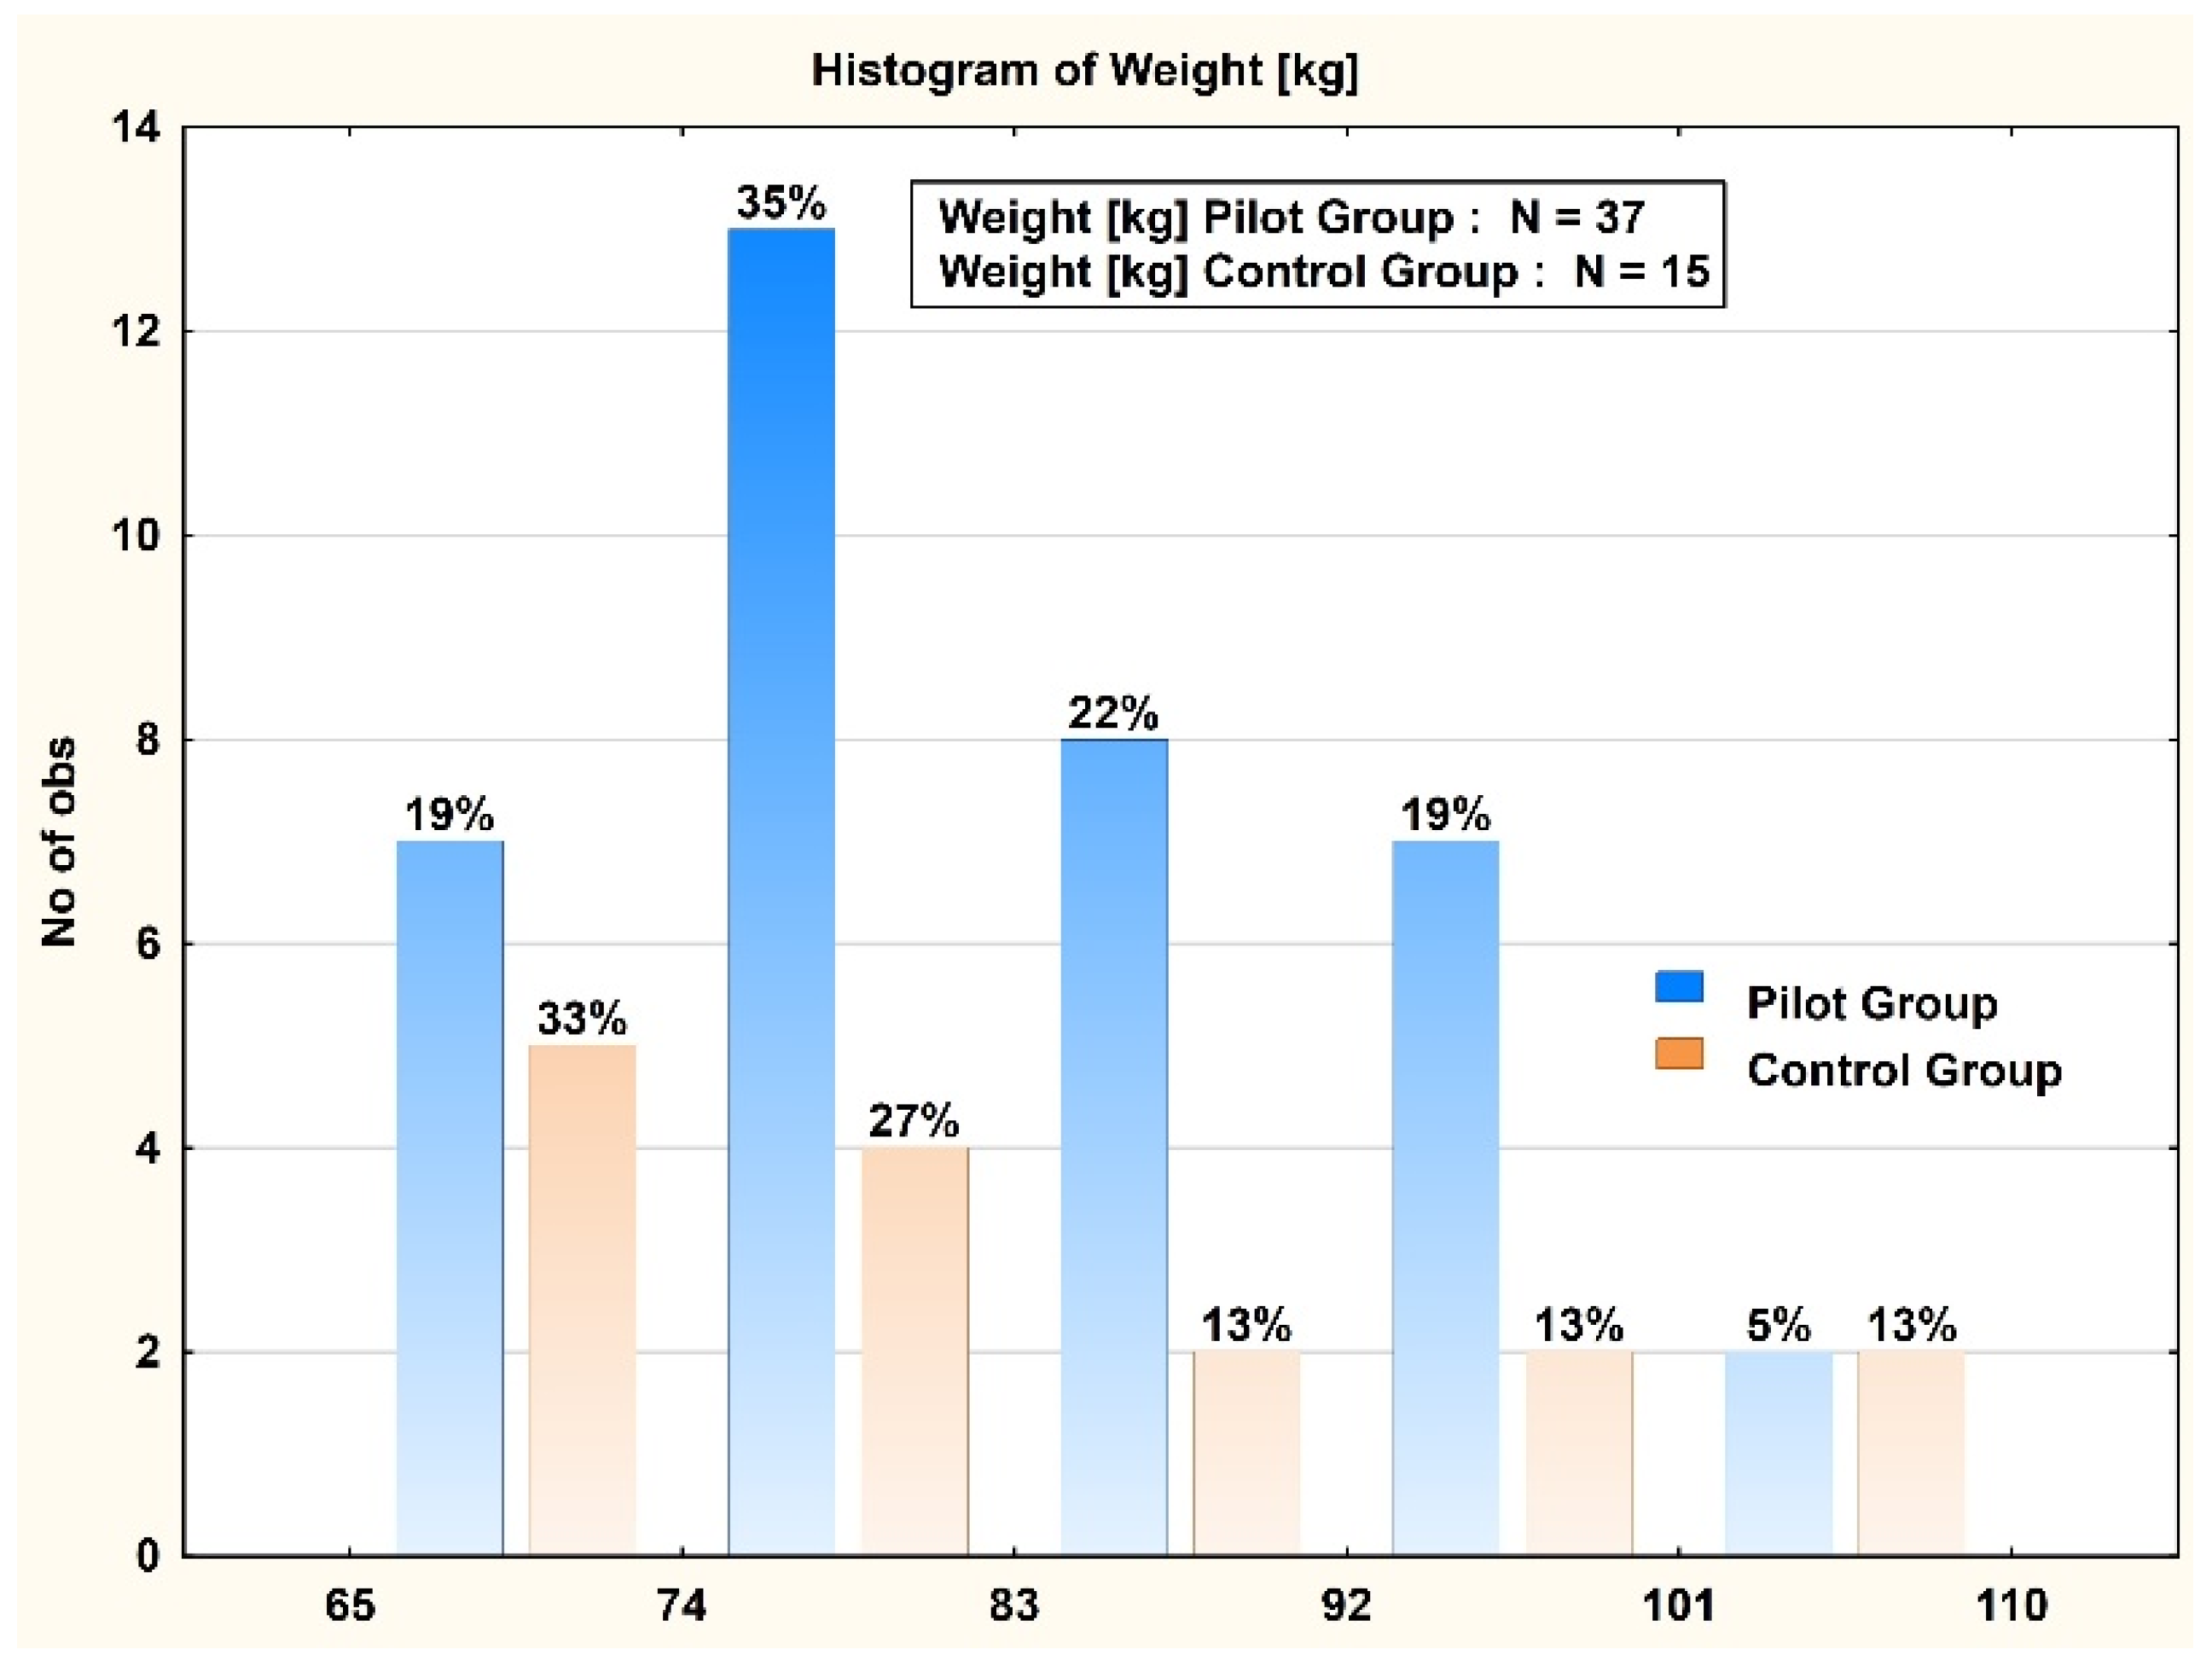
| Body mass index | 30.0 ± 7.8 | 29.0 ± 3.5 | 32.3 ± 13.3 |
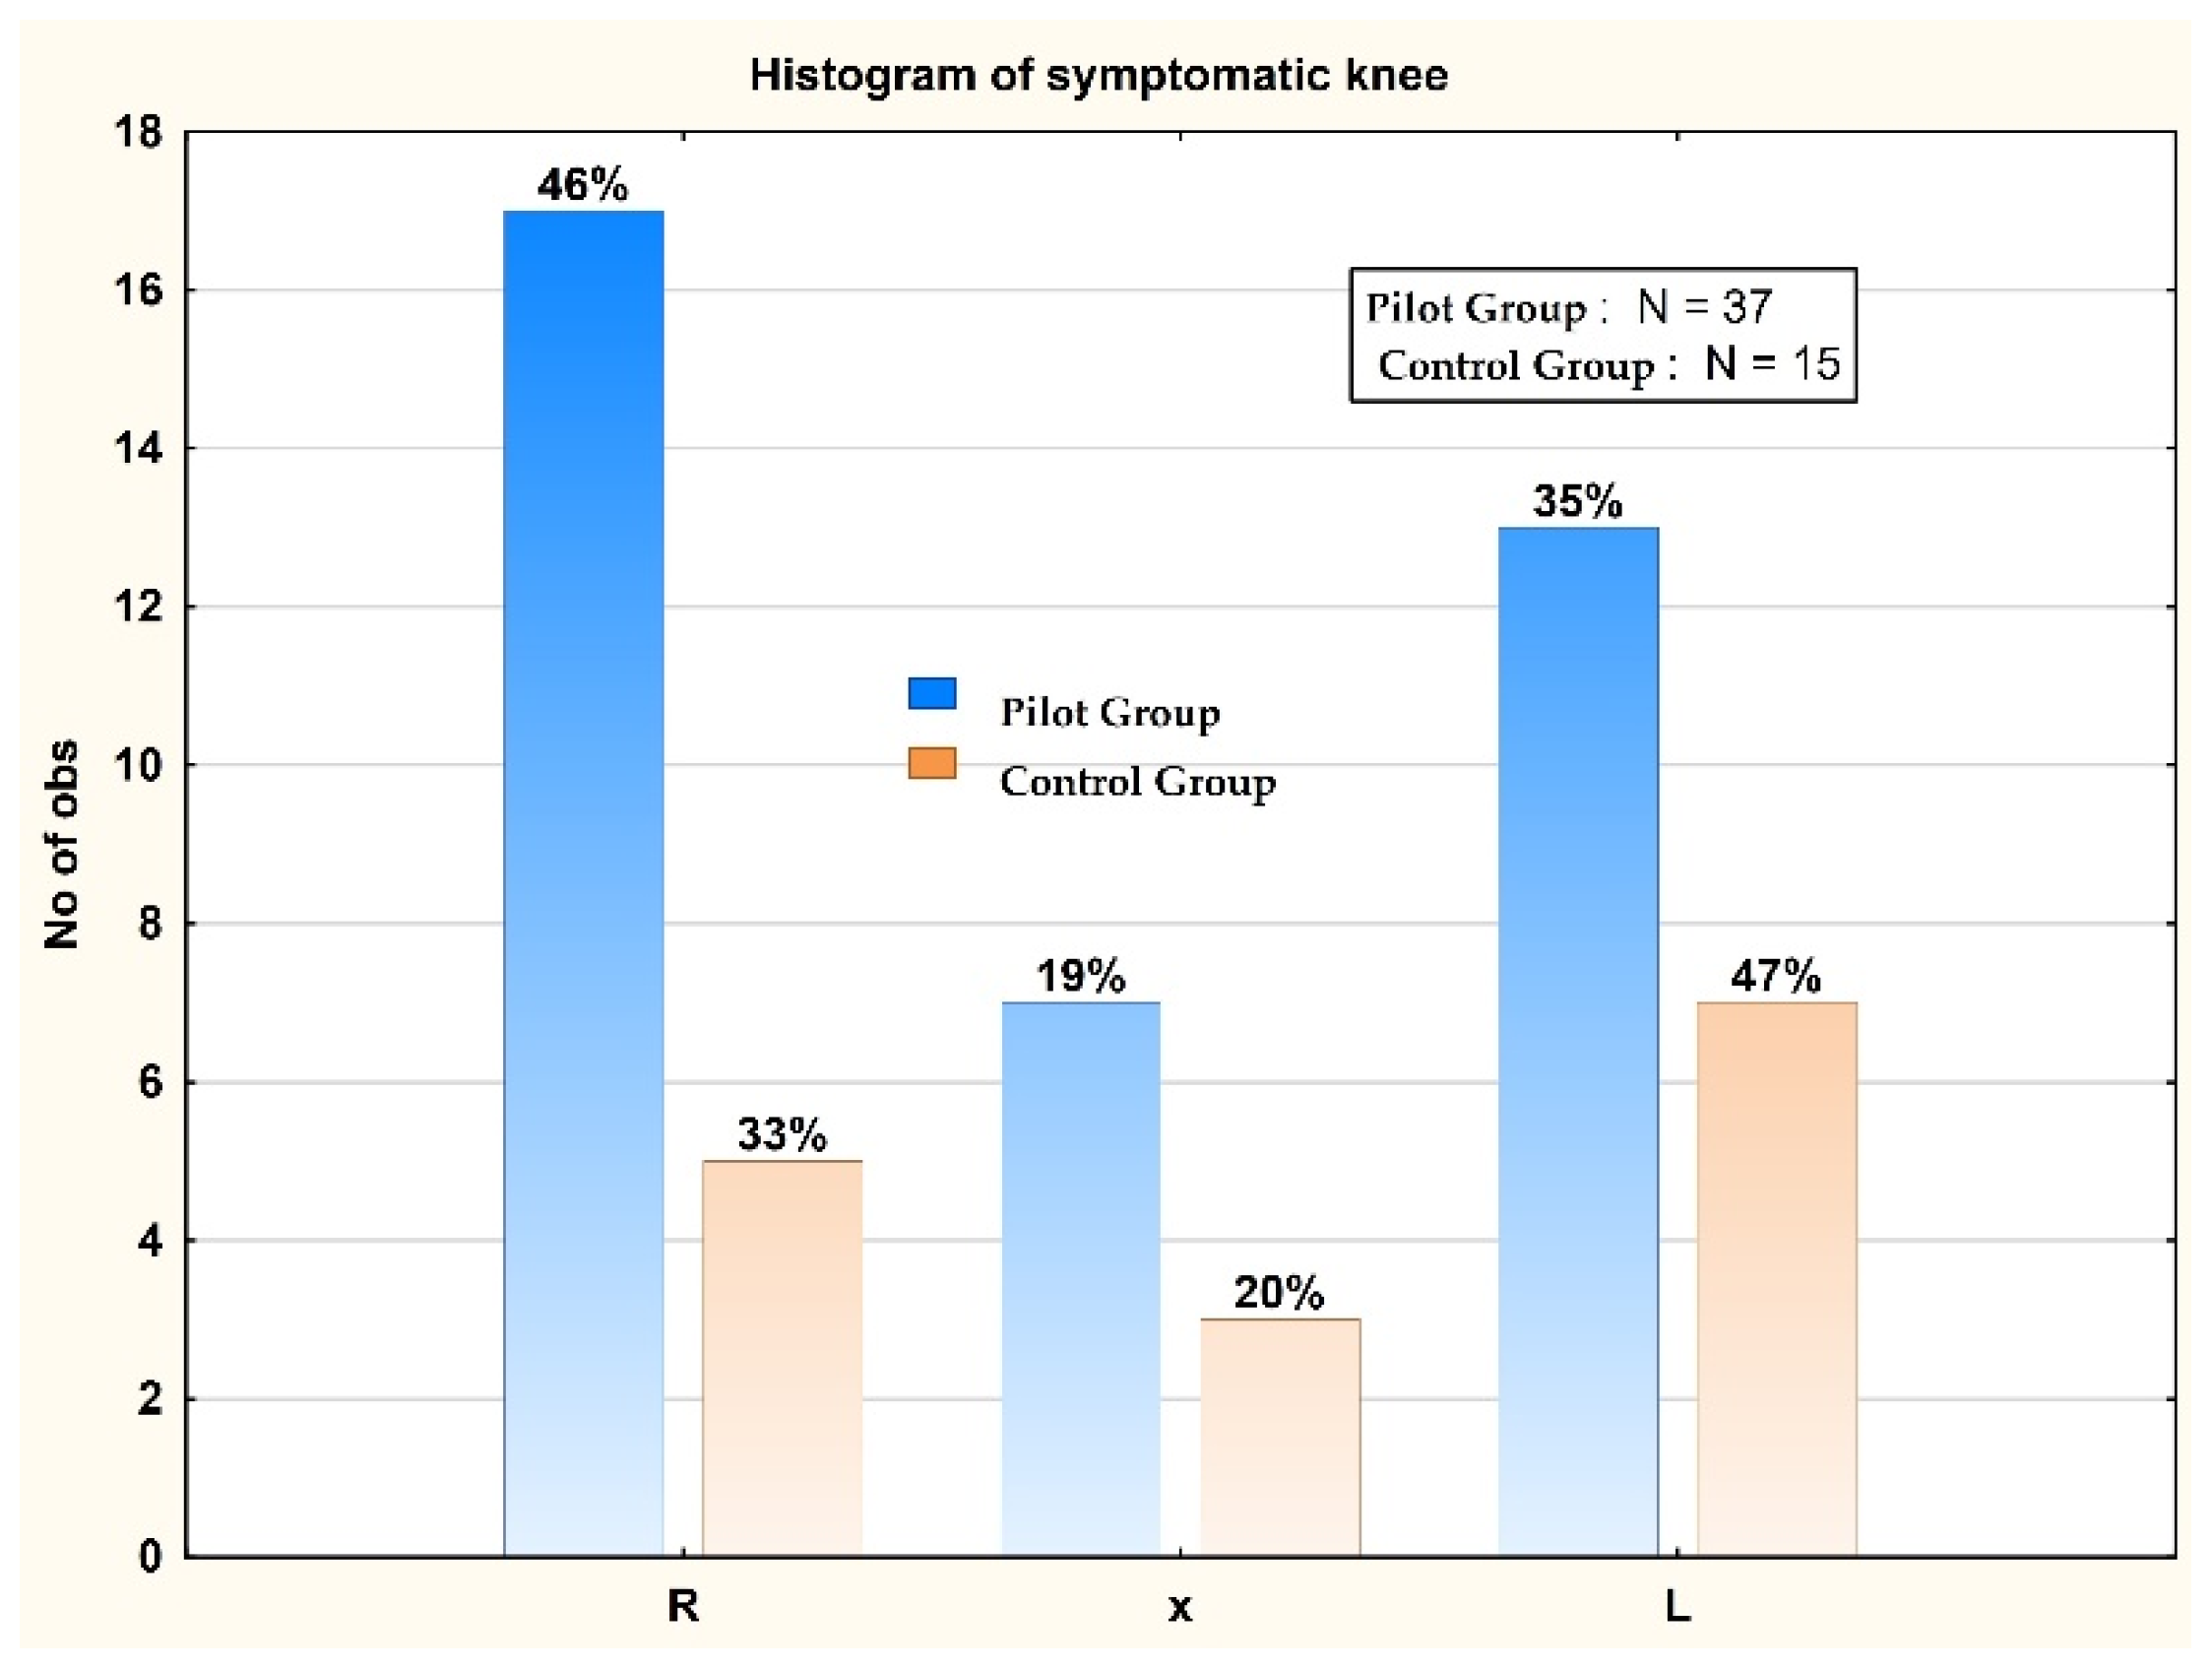
| Symptomatic knee—no. (%) | |||
| Right knee | 19 (9.9) | 17 (6.3) | 2 (0.3) |
| Left knee | 24 (12.5) | 13 (4.8) | 11 (1.8) |
| Both knees | 10 (5.2) | 7 (2.6) | 3 (0.5) |
| Baseline measures | |||
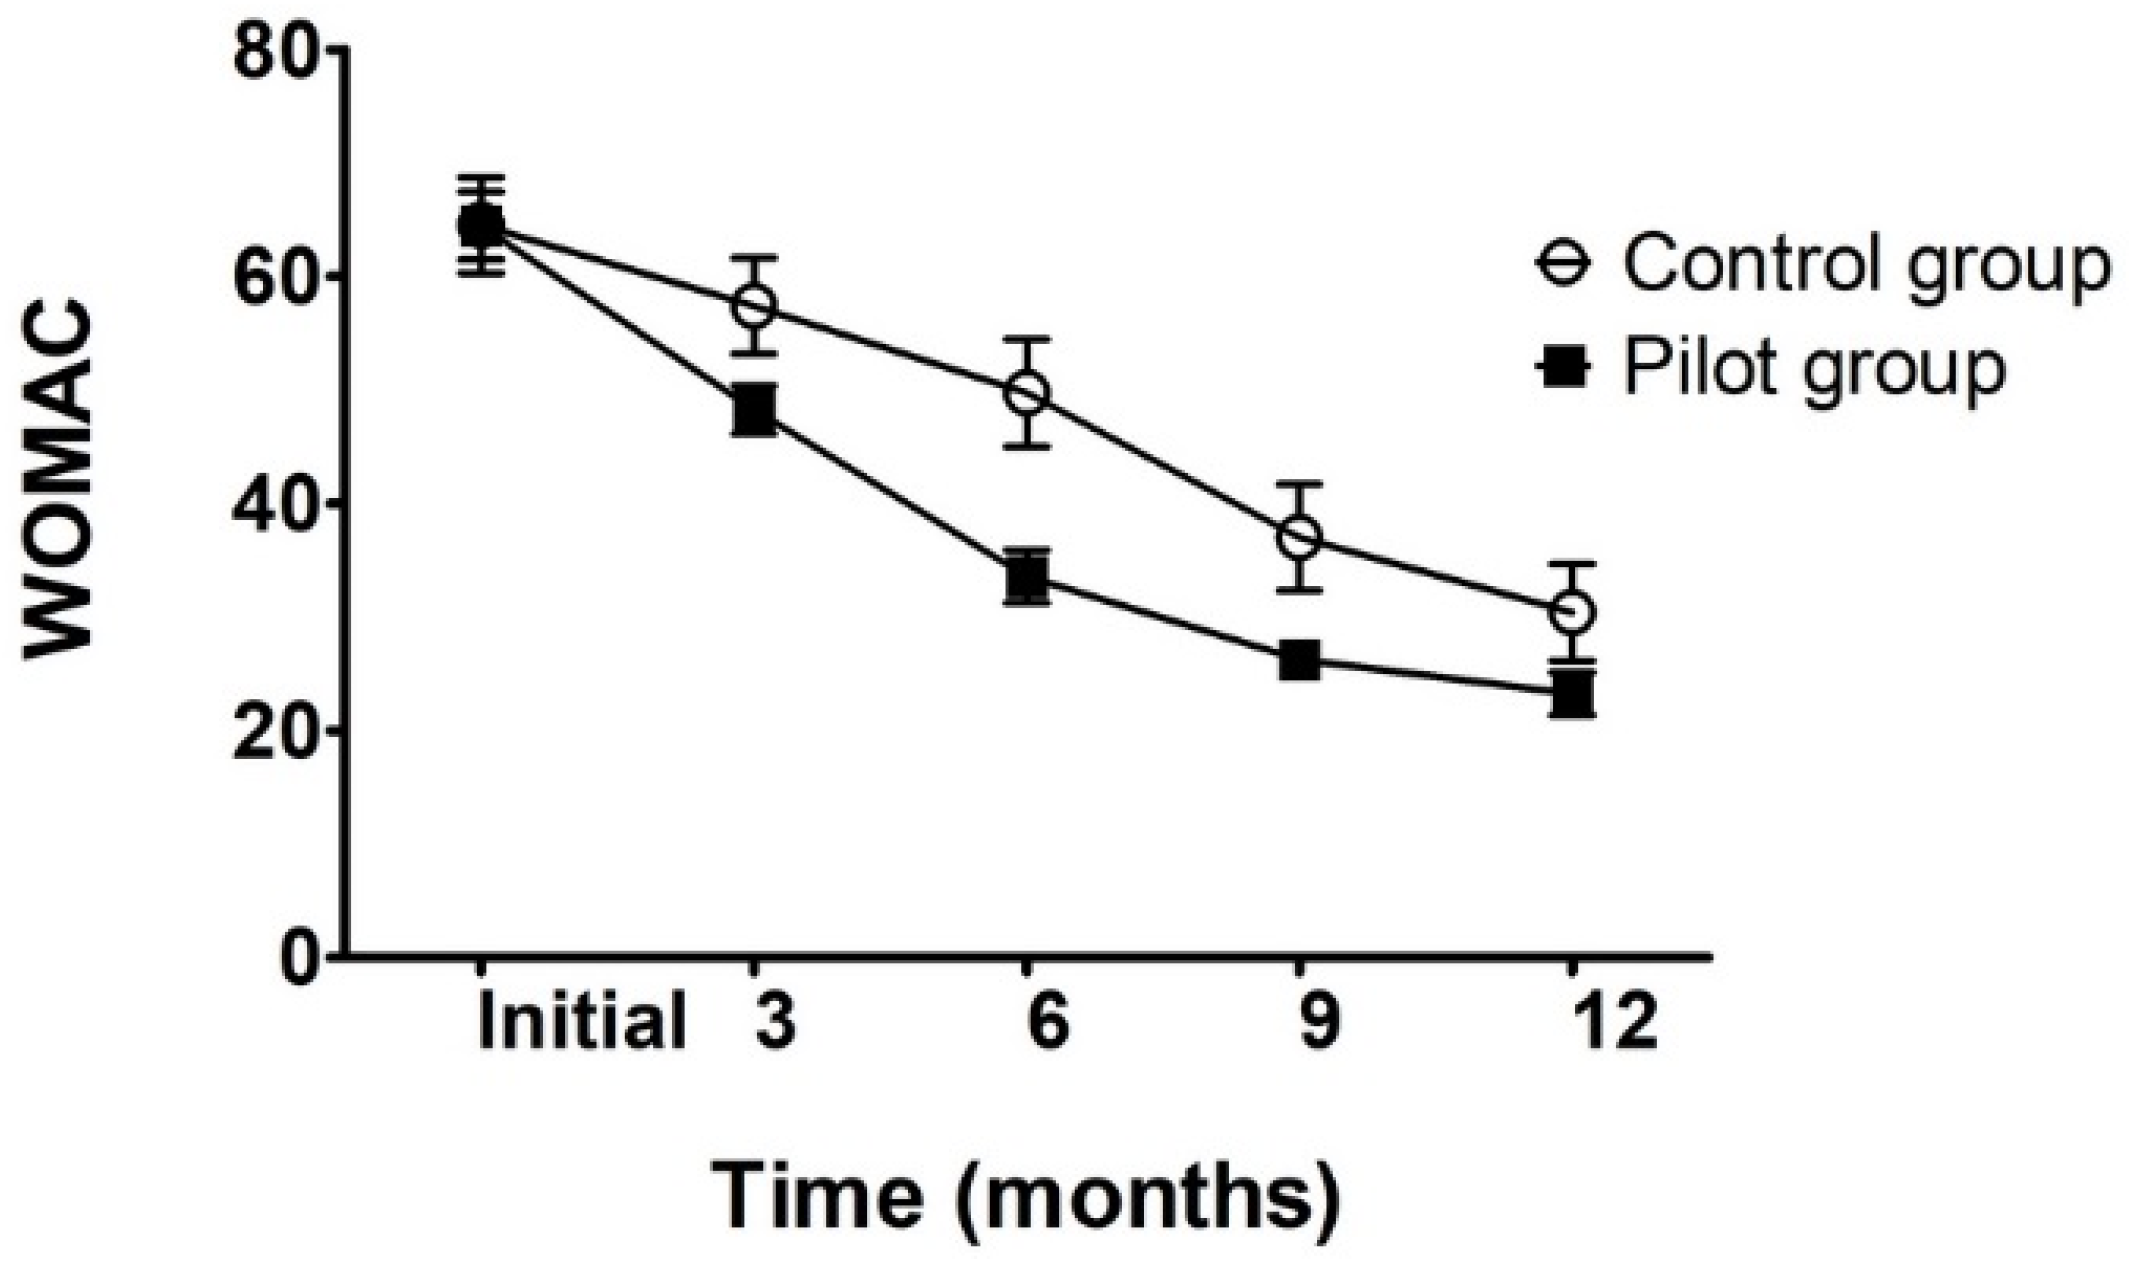
| WOMAC total score | 64.5 ± 3.3 | 64.5 ± 2.99 | 64.6 ± 4.1 |
| VAS scale | 5.7 ± 0.5 | 5.7 ± 0.5 | 5.6 ± 0.5 |
| ROM (degrees) | 98.4 ± 11.4 | 98.1 ± 12.5 | 99.1 ± 8.6 |
| Muscle strength testing (Oxford scale) | 3.8 ± 0.5 | 3.8 ± 0.5 | 3.8 ± 0.4 |
| C.G. vs. P.G. | Mean Group 1 CG | Mean Group 2 PG | t-Value | df | p | t Separ. Var. Est. | df | p 2-Sided | Std. Dev. Group 1 | Std. Dev. Group 2 |
|---|---|---|---|---|---|---|---|---|---|---|
| CG Age (years) vs. PG Age (years) | 55.86667 | 55.83784 | 0.022647 | 50 | 0.982022 | 0.022828 | 26.4375 | 0.981959 | 4.103425 | 4.180069 |
| CG vs. PG | Mean Group 1 | Mean Group 2 | t-Value | df | p | t Separ. Var. Est. | df | p 2-Sided | Std. Dev. Group 1 | Std. Dev. Group 2 |
|---|---|---|---|---|---|---|---|---|---|---|
| CG Weight (kg) vs. PG Weight (kg) | 83.4 | 83.89189 | −0.13462 | 50 | 0.893455 | −0.11851 | 20.50209 | 0.906819 | 14.54451 | 10.75429 |
| Variable for PG | Initial Muscle Strength | Muscle Strength after 3 Months | Muscle Strength after 6 Months | Muscle Strength after 12 Months | Muscle Strength after 9 Months | Initial ROM Flexion Test | ROM Flexion Test after 3 Months | ROM Flexion Test after 6 Months | ROM Flexion Test after 9 Months | ROM Flexion Test after 12 Months |
|---|---|---|---|---|---|---|---|---|---|---|
| Initial muscle strength | 1.0000 | 0.7757 | 0.4211 | 0.3404 | 0.4211 | 0.6834 | 0.6749 | 0.6431 | 0.6210 | 0.6497 |
| p = --- | p = 0.000 | p = 0.009 | p = 0.039 | p = 0.009 | p = 0.000 | p = 0.000 | p = 0.000 | p = 0.000 | p = 0.000 | |
| Muscle strength after 3 months | 0.7757 | 1.0000 | 0.5492 | 0.4300 | 0.5492 | 0.7180 | 0.8032 | 0.7804 | 0.7269 | 0.7703 |
| p = 0.000 | p = --- | p = 0.000 | p = 0.008 | p = 0.000 | p = 0.000 | p = 0.000 | p = 0.000 | p = 0.000 | p = 0.000 | |
| Muscle strength after 6 months | 0.4211 | 0.5492 | 1.0000 | 0.8390 | 1.0000 | 0.7923 | 0.8168 | 0.8283 | 0.8253 | 0.8169 |
| p = 0.009 | p = 0.000 | p = --- | p = 0.000 | p = --- | p = 0.000 | p = 0.000 | p = 0.000 | p = 0.000 | p = 0.000 | |
| Muscle strength after 12 months | 0.3404 | 0.4300 | 0.8390 | 1.0000 | 0.8390 | 0.7507 | 0.6987 | 0.6959 | 0.7132 | 0.6845 |
| p = 0.039 | p = 0.008 | p = 0.000 | p = --- | p = 0.000 | p = 0.000 | p = 0.000 | p = 0.000 | p = 0.000 | p = 0.000 | |
| Muscle strength after 9 months | 0.4211 | 0.5492 | 1.0000 | 0.8390 | 1.0000 | 0.7923 | 0.8168 | 0.8283 | 0.8253 | 0.8169 |
| p = 0.009 | p = 0.000 | p = --- | p = 0.000 | p = --- | p = 0.000 | p = 0.000 | p = 0.000 | p = 0.000 | p = 0.000 | |
| Initial ROM flexion test | 0.6834 | 0.7180 | 0.7923 | 0.7507 | 0.7923 | 1.0000 | 0.9128 | 0.8981 | 0.8969 | 0.8769 |
| p = 0.000 | p = 0.000 | p = 0.000 | p = 0.000 | p = 0.000 | p = --- | p = 0.000 | p = 0.000 | p = 0.000 | p = 0.000 | |
| ROM flexion test after 3 months | 0.6749 | 0.8032 | 0.8168 | 0.6987 | 0.8168 | 0.9128 | 1.0000 | 0.9858 | 0.9675 | 0.9730 |
| p = 0.000 | p = 0.000 | p = 0.000 | p = 0.000 | p = 0.000 | p = 0.000 | p = --- | p = 0.00 | p = 0.00 | p = 0.00 | |
| ROM flexion test after 6 months | 0.6431 | 0.7804 | 0.8283 | 0.6959 | 0.8283 | 0.8981 | 0.9858 | 1.0000 | 0.9888 | 0.9813 |
| p = 0.000 | p = 0.000 | p = 0.000 | p = 0.000 | p = 0.000 | p = 0.000 | p = 0.00 | p = --- | p = 0.00 | p = 0.00 | |
| ROM flexion test after 9 months | 0.6210 | 0.7269 | 0.8253 | 0.7132 | 0.8253 | 0.8969 | 0.9675 | 0.9888 | 1.0000 | 0.9775 |
| p = 0.000 | p = 0.000 | p = 0.000 | p = 0.000 | p = 0.000 | p = 0.000 | p = 0.00 | p = 0.00 | p = --- | p = 0.00 | |
| ROM flexion test after 12 months | 0.6497 | 0.7703 | 0.8169 | 0.6845 | 0.8169 | 0.8769 | 0.9730 | 0.9813 | 0.9775 | 1.0000 |
| p = 0.000 | p = 0.000 | p = 0.000 | p = 0.000 | p = 0.000 | p = 0.000 | p = 0.00 | p = 0.00 | p = 0.00 | p = --- |
| Variable for CG | Initial WOMAC Test | WOMAC Test after 3 Months | WOMAC Test after 6 Months | WOMAC Test after 9 Months | WOMAC Test after 12 Months | Initial VAS Test | VAS Test after 3 Months | VAS Test after 6 Months | VAS Test after 9 Months | VAS Test after 12 Months | Initial Muscle Strength |
|---|---|---|---|---|---|---|---|---|---|---|---|
| CG initial WOMAC test | 1 | 0.9405 | 0.8527 | 0.8501 | 0.8456 | −0.0934 | −0.2515 | 0.5589 | 0.3104 | 0.0032 | −0.4657 |
| p = --- | p = 0.000 | p = 0.000 | p = 0.000 | p = 0.000 | p = 0.741 | p = 0.366 | p = 0.030 | p = 0.260 | p = 0.991 | p = 0.080 | |
| CG WOMAC test after 3 months | 0.9405 | 1 | 0.8475 | 0.796 | 0.7774 | −0.0867 | −0.2788 | 0.6159 | 0.2942 | −0.1538 | −0.4413 |
| p = 0.000 | p = --- | p = 0.000 | p = 0.000 | p = 0.001 | p = 0.759 | p = 0.314 | p = 0.015 | p = 0.287 | p = 0.584 | p = 0.100 | |
| CG WOMAC test after 6 months | 0.8527 | 0.8475 | 1 | 0.9181 | 0.9044 | −0.0772 | −0.1555 | 0.5677 | 0.3346 | −0.1084 | −0.4292 |
| p = 0.000 | p = 0.000 | p = --- | p = 0.000 | p = 0.000 | p = 0.784 | p = 0.580 | p = 0.027 | p = 0.223 | p = 0.700 | p = 0.110 | |
| CG WOMAC test after 9 months | 0.8501 | 0.796 | 0.9181 | 1 | 0.9405 | −0.2109 | −0.2605 | 0.4734 | 0.1476 | 0.0868 | −0.4428 |
| p = 0.000 | p = 0.000 | p = 0.000 | p = --- | p = 0.000 | p = 0.451 | p = 0.348 | p = 0.075 | p = 0.600 | p = 0.758 | p = 0.098 | |
| CG WOMAC test after 12 months | 0.8456 | 0.7774 | 0.9044 | 0.9405 | 1 | −0.1191 | −0.2289 | 0.611 | 0.2513 | 0.2289 | −0.4783 |
| p = 0.000 | p = 0.001 | p = 0.000 | p = 0.000 | p = --- | p = 0.672 | p = 0.412 | p = 0.016 | p = 0.366 | p = 0.412 | p = 0.071 | |
| CG initial VAS test | −0.0934 | −0.0867 | −0.0772 | −0.2109 | −0.1191 | 1 | 0.7206 | 0.3273 | 0.6124 | −0.3203 | 0.6124 |
| p = 0.741 | p = 0.759 | p = 0.784 | p = 0.451 | p = 0.672 | p = --- | p = 0.002 | p = 0.234 | p = 0.015 | p = 0.245 | p = 0.015 | |
| CG VAS test after 3 months | −0.2515 | −0.2788 | −0.1555 | −0.2605 | −0.2289 | 0.7206 | 1 | −0.0262 | 0.1961 | −0.3269 | 0.6864 |
| p = 0.366 | p = 0.314 | p = 0.580 | p = 0.348 | p = 0.412 | p = 0.002 | p = --- | p = 0.926 | p = 0.484 | p = 0.234 | p = 0.005 | |
| CG VAS test after 6 months | 0.5589 | 0.6159 | 0.5677 | 0.4734 | 0.611 | 0.3273 | −0.0262 | 1 | 0.5345 | −0.1048 | −0.1336 |
| p = 0.030 | p = 0.015 | p = 0.027 | p = 0.075 | p = 0.016 | p = 0.234 | p = 0.926 | p = --- | p = 0.040 | p = 0.710 | p = 0.635 | |
| CG VAS test after 9 months | 0.3104 | 0.2942 | 0.3346 | 0.1476 | 0.2513 | 0.6124 | 0.1961 | 0.5345 | 1 | −0.1961 | 0.1667 |
| p = 0.260 | p = 0.287 | p = 0.223 | p = 0.600 | p = 0.366 | p = 0.015 | p = 0.484 | p = 0.040 | p = --- | p = 0.484 | p = 0.553 | |
| CG VAS test after 12 months | 0.0032 | −0.1538 | −0.1084 | 0.0868 | 0.2289 | −0.3203 | −0.3269 | −0.1048 | −0.1961 | 1 | −0.1961 |
| p = 0.991 | p = 0.584 | p = 0.700 | p = 0.758 | p = 0.412 | p = 0.245 | p = 0.234 | p = 0.710 | p = 0.484 | p = --- | p = 0.484 | |
| CG initial muscle strength | −0.4657 | −0.4413 | −0.4292 | −0.4428 | −0.4783 | 0.6124 | 0.6864 | −0.1336 | 0.1667 | −0.1961 | 1 |
| p = 0.080 | p = 0.100 | p = 0.110 | p = 0.098 | p = 0.071 | p = 0.015 | p = 0.005 | p = 0.635 | p = 0.553 | p = 0.484 | p = --- | |
| CG muscle strength after 3 months | -- | -- | -- | -- | -- | -- | -- | -- | -- | -- | -- |
| p = --- | p = --- | p = --- | p = --- | p = --- | p = --- | p = --- | p = --- | p = --- | p = --- | p = --- | |
| CG muscle strength after 6 months | -- | -- | -- | -- | -- | -- | -- | -- | -- | -- | -- |
| p = --- | p = --- | p = --- | p = --- | p = --- | p = --- | p = --- | p = --- | p = --- | p = --- | p = --- | |
| CG muscle Strength after 9 months | -- | -- | -- | -- | -- | -- | -- | -- | -- | -- | -- |
| p = --- | p = --- | p = --- | p = --- | p = --- | p = --- | p = --- | p = --- | p = --- | p = --- | p = --- | |
| CG muscle strength after 12 months | −0.2271 | −0.1703 | −0.1322 | −0.1775 | −0.169 | 0.3273 | 0.3669 | −0.0714 | −0.1336 | −0.1048 | 0.5345 |
| p = 0.416 | p = 0.544 | p = 0.639 | p = 0.527 | p = 0.547 | p = 0.234 | p = 0.179 | p = 0.800 | p = 0.635 | p = 0.710 | p = 0.040 |
| CG Grouped by Measurement Set vs. CG Grouped by Measurement Set | t-Value | df | p | t Separ. Var. Est. | df | p 2-Sided | Std. Dev. Group 1 | Std. Dev. Group 2 |
|---|---|---|---|---|---|---|---|---|
| CG initial muscle strength vs. CG muscle strength after 3 months | −1.87083 | 28 | 0.071854 | −1.87083 | 14 | 0.082418 | 0.414039 | 0 |
| CG muscle strength after 3 months vs. CG muscle strength after 6 months | 28 | - | 0 | 0 | ||||
| CG muscle strength after 6 months vs. CG muscle strength after 9 months | 28 | - | 0 | 0 | ||||
| CG muscle strength after 9 months vs. CG muscle strength after 12 months | 1 | 28 | 0.325875 | 1 | 14 | 0.334282 | 0 | 0.258199 |
| CG initial muscle strength vs. CG muscle strength after 6 months | −1.87083 | 28 | 0.071854 | −1.87083 | 14 | 0.082418 | 0.414039 | 0 |
| CG initial muscle strength vs. CG muscle strength after 9 months | −1.87083 | 28 | 0.071854 | −1.87083 | 14 | 0.082418 | 0.414039 | 0 |
| CG muscle strength after 12 months vs. CG initial muscle strength | 1.0583 | 28 | 0.298964 | 1.0583 | 23.45845 | 0.300695 | 0.258199 | 0.414039 |
| PG Grouped by Measurement Set vs. PG Grouped by Measurement Set | t-Value | df | p | t Separ. Var. Est. | df | p 2-Sided | Std. Dev. Group 1 | Std. Dev. Group 2 |
|---|---|---|---|---|---|---|---|---|
| PG initial muscle strength vs. PG muscle strength after 3 months | −8.5027 | 72 | 0 | −8.5027 | 69.8896 | 0 | 0.518429 | 0.43496 |
| PG initial muscle strength vs. PG muscle strength after 6 months | −7.4849 | 72 | 0 | −7.4849 | 71.44489 | 0 | 0.518429 | 0.47458 |
| PG initial muscle strength vs. PG muscle strength after 9 months | −7.4849 | 72 | 0 | −7.4849 | 71.44489 | 0 | 0.518429 | 0.47458 |
| PG initial muscle strength vs. PG muscle strength after 12 months | −6.6337 | 72 | 0 | −6.6337 | 71.88094 | 0 | 0.518429 | 0.49774 |
| PG muscle strength after 3 months vs. PG muscle strength after 6 months | 0.7661 | 72 | 0.446103 | 0.7661 | 71.45966 | 0.446122 | 0.434959 | 0.47458 |
| PG muscle strength after 3 months vs. PG muscle strength after 9 months | 0.7661 | 72 | 0.446103 | 0.7661 | 71.45966 | 0.446122 | 0.434959 | 0.47458 |
| PG muscle strength after 3 months vs. PG muscle strength after 12 months | 1.4922 | 72 | 0.140003 | 1.4922 | 70.72959 | 0.140081 | 0.434959 | 0.49774 |
| PG muscle strength after 6 months vs. PG muscle strength after 9 months | 0 | 72 | 1 | 0 | 72 | 1 | 0.474579 | 0.47458 |
| PG muscle strength after 6 months vs. PG muscle strength after 12 months | 0.7171 | 72 | 0.47561 | 0.7171 | 71.8371 | 0.475615 | 0.474579 | 0.49774 |
| PG muscle strength after 9 months vs. PG initial muscle strength | 7.4849 | 72 | 0 | 7.4849 | 71.44489 | 0 | 0.474579 | 0.51843 |
| PG muscle strength after 9 months vs. PG muscle strength after 12 months | 0.7171 | 72 | 0.47561 | 0.7171 | 71.8371 | 0.475615 | 0.474579 | 0.49774 |
| PG muscle strength after 12 months vs. PG initial muscle strength | 6.6337 | 72 | 0 | 6.6337 | 71.88094 | 0 | 0.497743 | 0.51843 |
| PG muscle strength after 12 months vs. PG muscle strength after 9 months | −0.7171 | 72 | 0.47561 | −0.7171 | 71.8371 | 0.475615 | 0.497743 | 0.47458 |
| Variable | Factor 1 | Factor 2 | Factor 3 | Factor 4 | Factor 5 | Factor 6 |
|---|---|---|---|---|---|---|
| Age (years) | −0.17544 | −0.12843 | 0.800838 | −0.40152 | 0.372737 | −0.10588 |
| Weight (kg) | −0.38716 | 0.763855 | 0.261097 | −0.09065 | −0.16274 | 0.38502 |
| Height (cm) | −0.47821 | 0.638149 | −0.0947 | 0.355641 | 0.32781 | −0.34755 |
| Initial WOMAC test | −0.42858 | −0.06762 | −0.64829 | −0.42846 | 0.422578 | 0.161166 |
| Initial VAS test | 0.512754 | 0.487966 | −0.17507 | −0.56843 | −0.24671 | −0.2804 |
| Initial muscle strength | 0.876851 | 0.101257 | −0.01479 | 0.093 | 0.219449 | −0.0209 |
| Initial ROM flexion test | 0.802037 | 0.262331 | 0.026423 | 0.113245 | 0.342044 | 0.243706 |
| Variable | Factor 1 | Factor 2 | Factor 3 | Factor 4 | Factor 5 | Factor 6 |
|---|---|---|---|---|---|---|
| Age (years) | −0.40854 | −0.77165 | 0.248408 | −0.09066 | −0.40941 | −0.01051 |
| Weight (kg) | 0.64822 | 0.150963 | 0.508954 | −0.54186 | 0.048725 | −0.04472 |
| Height (cm) | 0.583746 | 0.23023 | 0.660958 | 0.366693 | −0.06892 | 0.173656 |
| Initial WOMAC test | 0.639288 | −0.74257 | −0.15343 | 0.015238 | 0.10918 | 0.064899 |
| Initial VAS test | −0.60224 | −0.47681 | 0.526263 | 0.156451 | 0.263397 | −0.19787 |
| Initial muscle strength | −0.90239 | −0.12719 | 0.112096 | −0.19381 | 0.15468 | 0.308977 |
| CG initial WOMAC | 0.639288 | −0.74257 | −0.15343 | 0.015238 | 0.10918 | 0.064899 |
| Variable | Factor 1 | Factor 2 | Factor 3 | Factor 4 | Factor 5 | Factor 6 |
|---|---|---|---|---|---|---|
| Age | 0.227779 | −0.672723 | 0.236629 | 0.539305 | 0.271364 | −0.269485 |
| Weight | 0.474756 | −0.210575 | −0.668359 | 0.184855 | 0.167216 | 0.465744 |
| Height | 0.419664 | 0.009419 | −0.742912 | −0.060786 | −0.227288 | −0.463873 |
| WOMAC test after 3 months | 0.470012 | −0.343063 | 0.100854 | −0.681551 | 0.427492 | −0.055478 |
| VAS test after 3 months | 0.340695 | −0.629027 | 0.242235 | −0.153364 | −0.619587 | 0.148715 |
| Muscle strength after 3 months | −0.836608 | −0.323219 | −0.253536 | −0.227014 | −0.022256 | −0.069839 |
| ROM flexion test after 3 months | −0.795795 | −0.445332 | −0.292966 | 0.003051 | 0.068194 | 0.060417 |
| Variable | Factor 1 | Factor 2 | Factor 3 | Factor 4 | Factor 5 | Factor 6 |
|---|---|---|---|---|---|---|
| Age | 0.372638 | −0.770865 | 0.351498 | −0.004635 | −0.376629 | −0.038537 |
| Weight | −0.739012 | 0.097571 | 0.392983 | 0.516199 | 0.042614 | −0.147063 |
| Height | −0.562548 | 0.355252 | 0.666723 | −0.284778 | 0.011011 | 0.177754 |
| WOMAC test after 3 months | −0.671922 | −0.720087 | −0.100533 | −0.036668 | 0.120227 | 0.063944 |
| VAS test after 3 months | 0.764624 | −0.334418 | 0.375759 | −0.175039 | 0.311154 | −0.186721 |
| ROM flexion test after 3 months | −0.671922 | −0.720087 | −0.100533 | −0.036668 | 0.120227 | 0.063944 |
| Initial muscle strength | 0.856078 | −0.178459 | 0.13093 | 0.359274 | 0.118778 | 0.273779 |
| Variable | Factor 1 | Factor 2 | Factor 3 | Factor 4 | Factor 5 | Factor 6 |
|---|---|---|---|---|---|---|
| Age | −0.057318 | 0.008466 | −0.638977 | −0.689853 | 0.248303 | 0.225369 |
| Weight | 0.149165 | 0.80625 | −0.236736 | −0.067622 | 0.126056 | −0.501077 |
| Height | 0.146953 | 0.798468 | −0.108744 | 0.317836 | −0.052394 | 0.472586 |
| WOMAC test after 6 months | 0.284124 | −0.182385 | −0.719375 | 0.11887 | −0.590437 | −0.075881 |
| VAS test after 6 months | 0.301459 | −0.344811 | −0.498948 | 0.545593 | 0.4917 | −0.030827 |
| Muscle strength after 6 months | −0.904867 | 0.072547 | −0.240087 | 0.203629 | 0.006427 | 0.020377 |
| ROM flexion test after 6 months | −0.937252 | 0.016756 | −0.162417 | 0.096187 | −0.03038 | −0.072024 |
| Variable | Factor 1 | Factor 2 | Factor 3 | Factor 4 | Factor 5 | Factor 6 |
|---|---|---|---|---|---|---|
| Age | −0.173219 | −0.781599 | −0.42766 | 0.359204 | −0.106859 | −0.189099 |
| Weight | −0.552026 | 0.550402 | −0.411497 | −0.330655 | −0.32422 | −0.092426 |
| Height | −0.246372 | 0.752784 | −0.393773 | 0.432213 | 0.043256 | 0.169942 |
| WOMAC test after 6 months | −0.906747 | −0.284033 | 0.265738 | 0.058011 | −0.117826 | 0.096282 |
| VAS test after 6 months | −0.716628 | −0.302249 | −0.411121 | −0.254999 | 0.399897 | 0.033566 |
| ROM flexion test after 6 months | −0.906747 | −0.284033 | 0.265738 | 0.058011 | −0.117826 | 0.096282 |
| Initial muscle strength | 0.608334 | −0.621005 | −0.34678 | −0.150183 | −0.187282 | 0.257677 |
| Variable | Factor 1 | Factor 2 | Factor 3 | Factor 4 | Factor 5 | Factor 6 |
|---|---|---|---|---|---|---|
| Age | −0.163722 | −0.129883 | −0.817701 | −0.38458 | −0.303894 | −0.217337 |
| Weight | 0.421275 | −0.681319 | −0.180406 | −0.202216 | 0.047842 | 0.531264 |
| Height | 0.398624 | −0.639181 | 0.118911 | −0.191559 | 0.463704 | −0.407028 |
| WOMAC test after 9 months | −0.477327 | 0.33645 | −0.454268 | 0.040244 | 0.655758 | 0.132361 |
| VAS test after 9 months | 0.255099 | −0.347793 | −0.393474 | 0.805155 | −0.057139 | −0.083135 |
| Muscle strength after 9 months | −0.780641 | −0.517856 | 0.201877 | −0.006728 | −0.099046 | −0.054374 |
| ROM flexion test after 9 months | −0.848415 | −0.430933 | 0.075602 | 0.109443 | 0.005286 | 0.065062 |
| Variable | Factor 1 | Factor 2 | Factor 3 | Factor 4 | Factor 5 | Factor 6 |
|---|---|---|---|---|---|---|
| Age | 0.149027 | −0.778052 | −0.281976 | 0.458076 | 0.206861 | −0.200724 |
| Weight | −0.648258 | 0.371211 | −0.321741 | 0.340358 | −0.468873 | −0.052548 |
| Height | −0.513533 | 0.544514 | −0.499268 | 0.108515 | 0.394234 | 0.152721 |
| WOMAC test after 9 months | −0.767118 | −0.606757 | 0.177542 | 0.010254 | −0.001097 | 0.108391 |
| VAS test after 9 months | 0.088746 | −0.550926 | −0.642614 | −0.506753 | −0.137218 | 0.004974 |
| ROM flexion test after 9 months | −0.767118 | −0.606757 | 0.177542 | 0.010254 | −0.001097 | 0.108391 |
| Muscle strength | 0.830623 | −0.295921 | −0.112589 | 0.323617 | −0.146676 | 0.289099 |
| Variable | Factor 1 | Factor 2 | Factor 3 | Factor 4 | Factor 5 | Factor 6 |
|---|---|---|---|---|---|---|
| Age | −0.148961 | −0.067687 | 0.927 | −0.096863 | 0.06868 | −0.313573 |
| Weight | 0.438348 | 0.615282 | 0.381684 | −0.025543 | 0.228492 | 0.480341 |
| Height | 0.455133 | 0.667716 | 0.046186 | −0.045912 | −0.561316 | −0.155468 |
| WOMAC test after 12 months | −0.594652 | −0.168703 | 0.257435 | 0.615788 | −0.314365 | 0.270036 |
| VAS test after 12 months | −0.153677 | 0.687375 | −0.173122 | 0.544848 | 0.294779 | −0.295345 |
| Muscle strength after 12 months | −0.739748 | 0.399993 | −0.094774 | −0.376964 | −0.077168 | 0.06215 |
| ROM flexion test after 12 months | −0.816146 | 0.346115 | −0.007506 | −0.231227 | 0.04065 | 0.031053 |
| Variable | Factor 1 | Factor 2 | Factor 3 | Factor 4 | Factor 5 | Factor 6 |
|---|---|---|---|---|---|---|
| Age | −0.066009 | −0.856533 | 0.12279 | −0.443203 | 0.111468 | 0.195097 |
| Weight | −0.564898 | 0.497323 | −0.098491 | −0.494398 | −0.423191 | 0.018414 |
| Height | −0.509841 | 0.59758 | 0.248188 | −0.342513 | 0.446991 | −0.065168 |
| Initial muscle strength | 0.774789 | −0.430082 | 0.069126 | −0.38836 | −0.052896 | −0.237342 |
| WOMAC test after 12 months | −0.851222 | −0.46791 | −0.205264 | 0.070895 | 0.016589 | −0.095119 |
| VAS test after 12 months | −0.368794 | −0.178153 | 0.878551 | 0.166963 | −0.177382 | −0.032566 |
| ROM flexion test after 12 months | −0.851222 | −0.46791 | −0.205264 | 0.070895 | 0.016589 | −0.095119 |
Publisher’s Note: MDPI stays neutral with regard to jurisdictional claims in published maps and institutional affiliations. |
© 2022 by the authors. Licensee MDPI, Basel, Switzerland. This article is an open access article distributed under the terms and conditions of the Creative Commons Attribution (CC BY) license (https://creativecommons.org/licenses/by/4.0/).
Share and Cite
Onu, I.; Matei, D.; Sardaru, D.-P.; Cascaval, D.; Onu, A.; Gherghel, R.; Serban, I.L.; Mocanu, G.D.; Iordan, D.A.; Murariu, G.; et al. Rehabilitation of Patients with Moderate Knee Osteoarthritis Using Hyaluronic Acid Viscosupplementation and Physiotherapy. Appl. Sci. 2022, 12, 3165. https://doi.org/10.3390/app12063165
Onu I, Matei D, Sardaru D-P, Cascaval D, Onu A, Gherghel R, Serban IL, Mocanu GD, Iordan DA, Murariu G, et al. Rehabilitation of Patients with Moderate Knee Osteoarthritis Using Hyaluronic Acid Viscosupplementation and Physiotherapy. Applied Sciences. 2022; 12(6):3165. https://doi.org/10.3390/app12063165
Chicago/Turabian StyleOnu, Ilie, Daniela Matei, Dragos-Petrica Sardaru, Dan Cascaval, Ana Onu, Robert Gherghel, Ionela Lacramioara Serban, George Danut Mocanu, Daniel Andrei Iordan, Gabriel Murariu, and et al. 2022. "Rehabilitation of Patients with Moderate Knee Osteoarthritis Using Hyaluronic Acid Viscosupplementation and Physiotherapy" Applied Sciences 12, no. 6: 3165. https://doi.org/10.3390/app12063165