
Evaluation of the Effect of Passive Cooling Techniques on Thermal Comfort Using Test Cells in the Northern Region of Brazil


1
Construct-LFC, Faculty of Engineering (FEUP), University of Porto, Rua Dr. Roberto Frias s/n, 4200-465 Porto, Portugal
2
Department of Civil Engineering, School of Technology and Management, Polytechnic Institute of Viseu, Campus Politécnico de Repeses, 3504-510 Viseu, Portugal
*
Author to whom correspondence should be addressed.
Appl. Sci. 2022, 12(3), 1546; https://doi.org/10.3390/app12031546
Submission received: 20 December 2021
/
Revised: 20 January 2022
/
Accepted: 26 January 2022
/
Published: 31 January 2022
(This article belongs to the Special Issue Thermal Comfort: Challenges, Analysis and Applications)
Abstract
:The high consumption of electricity in Palmas, Brazil is a direct consequence of the high temperatures identified throughout the year. Therefore, it is necessary to search for sustainable technologies that contribute to comfort through passive cooling, thus reducing the energy consumption. This work presents the results of an experimental campaign of 11 months, in which the effects of shading devices, the use of a low-emissivity reflective film, the implementation of natural ventilation and the application of reflective painting are evaluated, when applied individually and combined. The results show that when applied individually, natural cross ventilation was the most effective at night, while reflective painting showed better performance during the day. Regarding the combinations of techniques, the best combination occurred when reflective painting was used together with natural ventilation, and the result was a relevant improvement in the performance, ensuring high temperature reductions when compared to the control.
1. Introduction
The city of Palmas, capital of the state of Tocantins, located in the center of Brazil (Figure 1), has as its most relevant climatic characteristic its high temperature throughout the year. The search for passive cooling techniques, which can be associated with active techniques, will allow a reduction in energy consumption, especially since it is a dry and hot climate.
Passive cooling is a sustainable way of ensuring adequate temperatures for the well-being of people, achieving greater thermal comfort in buildings through the control of energy flows by radiation, convection or conduction [1], preventing overheating. Passive cooling can be achieved using techniques for solar and heat control, heat amortization and heat dissipation [2]. These techniques can be related to performance in terms of thermal mass, thermal insulation, shading of glazed openings, control of solar radiation, surface thermal properties or air infiltration [3,4,5].
Passive cooling techniques are sustainable alternatives for reducing both the needs of electricity and the emission of gases that contribute to the greenhouse effect. However, they must be implemented according to the type of building and the climate in which it is located [6].
The importance of the climatic diversity is highlighted in the research carried out by Kambadkone and Jain [7], in which the comfort potential of different passive heating and cooling strategies in three Indian cities was evaluated. Their results show that natural comfort potential can vary between 25% and 46% of the total time of a year depending on the location.
Several studies have been carried out with the objective of evaluating the impact of thermal mass on controlling temperature fluctuations inside buildings and, consequently, on minimizing overheating periods. Kumar et al. [8] assessed the applicability of thermal mass as a passive design strategy in naturally ventilated office spaces in a composite climate of India, concluding that it can contribute to a reduction of 40% in the discomfort time in summer. Recently, the importance of thermal inertia has been reinforced, through the comparison of the thermal performance of different construction systems, either using test cells [9,10] or through numerical simulation [11]. Based on in-situ measurement data, Kumar et al. [12] proposed mathematical correlations to predict the indoor temperature of high mass buildings.
The joint use of thermal inertia and other techniques has also been studied by several authors. Based on data from monitoring, Givoni [13] analyzed the combined use of thermal mass and night ventilation to lower indoor daytime temperatures, concluding that night ventilation is more effective in high mass constructions. Cheng et al. [14] used a test facility to study the effect of various building design features on indoor temperatures, especially envelope color and thermal mass. Their results pointed to the combination of lighter surface colors and high thermal mass to reduce maximum indoor temperatures.
Natural ventilation can also be an effective technique, dependent on climatic conditions, microclimate and construction characteristics. Artmann et al. [15] analyzed, through test cells, the effects of night ventilation associated with the thermally insulated building roof and verified a significant reduction in the interior temperature.
Radiation cooling occurs when the radiation emitted by the sun is reflected, thus reducing heat gains inside the building. Romeo et al. [16] tested a radiation cooling system by painting the roofs with a reflective paint to obtain cold roofs. According to the authors’ analysis, the temperature of the coated surface lowered 20 °C and the internal temperature of the building decreased by 2.3 °C, when compared to the temperature obtained without any treatment. These differences resulted in savings in the electrical energy consumption for cooling by 54%.
In terms of the impact of passive measures in the cooling demand, Imessad et al. [17] analyzed the influence of some passive cooling techniques on the use of electricity in homes in a city with a Mediterranean climate. The study included monitoring and numerical simulation. The results showed that the combination of natural ventilation with horizontal shading devices was able to ensure the thermal comfort of the occupants and also minimize the consumption of electrical energy that was previously used for cooling.
Al-Obaidi et al. [18] examined the efficiency of passive cooling techniques with reflective materials in buildings in the Southeast of Asia, in a hot and humid climate. The evaluation was mainly focused on the heat dissipation by the roofs, as the authors considered that 70% of the total heat gain in a building was due to them. It was concluded that the implementation of reflective passive cooling approaches in roofs allowed the improvement of the buildings capacity to dissipate heat, reducing the effect of solar radiation in the internal gains. However, the authors warned that in order to achieve the effectiveness of the techniques, some factors should be considered, such as the type of building, its occupancy patterns and the climatic conditions. For this reason, an inadequate selection of the passive cooling technique could lead to a degradation of the quality of the indoor environment due to thermal discomfort.
Regarding the Brazilian case, some recent studies were carried out on the use of passive cooling techniques, such as Eli et al. [19], Veiga [20] and Buonocore [21], who analyzed the effect of natural ventilation, and Schabbach et al. [22] and Michels [23], who evaluated the impact of using reflective paint on the roof of buildings.
The literature review showed that the use of passive cooling techniques is a strategy with high potential in hot climates. Additionally, it was found that these techniques are normally associated with buildings with high thermal inertia where mass also plays an important role in temperature stabilization. However, there is a current trend in several regions towards an increase in less massive construction, with possible consequences for the efficiency of passive cooling strategies. Thus, evaluating the impact of passive cooling strategies on low thermal inertia buildings is important and constitutes an innovative contribution to the technical and scientific community.
This paper aims to evaluate, in a region with a dry and hot climate, the efficiency of passive cooling techniques such as: shading of glazed openings, application of a low-emissivity reflective film, natural cross ventilation and painting of opaque elements with reflective paint. The effect of the combination of some of the above techniques was also evaluated; namely, reflective painting associated with natural cross ventilation, reflective painting associated with natural cross ventilation only at night and reflective painting associated with natural ventilation by chimney effect. The impact on the indoor temperature is analyzed and paves the way for a discussion regarding the contribution of these techniques for the energy efficiency of buildings in terms of cooling demand.
2. Materials and Methods
2.1. Framework
In this study, different passive cooling techniques were evaluated, individually and combined. The techniques were implemented in a test cell, located in the city of Palmas, Tocantins, Brazil, and the thermal conditions inside it were measured over time using temperature sensors. The effectiveness of each technique, applied individually or combined, was evaluated by comparing the temperature variations inside the cell where they were implemented, with the temperatures inside another geometrically identical cell, used a control. The external climate was characterized using data from the Palmas Meteorological Station [24]. The climate of Palmas-TO is labeled as Aw according to Köppen-Geiger classification. Figure 2 shows the typical annual ambient conditions of Palmas, Brazil.
2.2. Test Cells
To carry out this study, it was necessary to build two test cells, measuring 2.4 × 2.4 × 2.4 m3 each. For the walls and ceiling of the cells, 9.5 mm OSB panels were used, internally insolated with 20 mm of glass wool. The double pitched roof faced north and south with a 10% slope, and was covered with thermo-acoustic tiles (metal sheet with a 30 mm EPS core). The window applied to each cell, measuring 0.6 × 0.6 m2, was made of aluminum frames with simple glass, positioned at a height of 1.5 m from the ground, on the north façade. The door was made of OSB board, measuring 0.8 × 2.10 m2, and was located on the west façade. Table 1 presents the thermal properties of the test cells.
The passive cooling techniques were implemented in cell C1 and cell C2 remained unchanged, to be used as a control (Figure 3). The test cells present low thermal inertia, not allowing, therefore, an assessment of the impact of the mass in the stabilization of the temperature. On the other hand, they correspond to a growing trend of construction in the Palmas, Brazil, thus increasing the practical interest of the study.
2.3. Equipment Used
For this study, four temperature sensors (two in each cell) were used. They were positioned in the center of the cells, one meter above the floor. The equipment has an accuracy of ±0.35 °C for temperature and ±2.5% for relative humidity [25]. Records were recorded every 10 min (Figure 4A).
The ventilation flow rate in each cell was determined by the Tracer Gas Method and the Decay Technique, using carbon dioxide (CO2) as tracer gas. Four CO2 concentration meters were used, two in each cell. The equipment has an accuracy of ±50 ppm or ±3% of the measured value and a resolution of 1 ppm. A portable CO2 extinguisher was used to release carbon dioxide inside the cells and fans were activated to facilitate the distribution of tracer gas in the environments (Figure 4B). The experimental procedure was established according to ISO 12569 [26] and ASTM E741-00 standards [27].
To assess possible radiative effects inside the test cells that could bias the results, two black globe thermometers of 15 cm in diameter were used for punctual measurements of the mean radiant temperature. The mean radiant temperature can be estimated from the globe temperature, taking into account the recommendations available in the literature [28,29]. The response time of the equipment varies between 20 and 30 min and the operating temperature is between −10 °C to 50 °C, with an accuracy of ±0.5 °C [20]. The equipment was installed in the center of each cell for one day, and four measurements were carried out, with an interval of two hours between them (Figure 4C). The mean radiant temperature (tr) was obtained by applying Equations (1) and (2) [30].
In which:
- tr is the mean radiant temperature [K];
- tg is the globe temperature [K];
- ta is the air temperature [K];
- hcg is the convective heat transfer coefficient at the globe level [W/m2.K];
- εg is the emissivity of the black globe;
- Σ is the Stefan–Boltzan constant [5.67 × 10⁻⁸ W/m2.K4];
- D is the globe diameter (0.15 m).
The outdoor climate was characterized through the automatic meteorological station (EMA) of Palmas, Brazil (Latitude: −10.190744° and Longitude: −48.301811°), administered by the National Institute of Meteorology—INMET, Brazil [24]. The station collects data every minute, providing temperature, relative humidity, atmospheric pressure, precipitation, wind direction and speed and solar radiation (Figure 4D).
2.4. Implemented Passive Cooling Techniques
In the experimental campaign carried out, four passive cooling techniques were applied in cell C1, individually (Phase I) and in three different combinations (Phase II). Cell C2 was kept unchanged, so that it could serve as a control in evaluating the effectiveness of each technique. Campaigns 1 to 4 were part of Phase I and campaigns 5 to 7 were part of Phase II.
In campaign 1, the shading of the glazed opening was implemented through a shutter-type aluminum frame (0.8 × 0.8 m2), painted with white paint and fixed on the window of cell C1 (Figure 5A). In campaign 2, a low-emissivity reflective film was applied between the OSB ceiling and the thermo-acoustic tile covering of cell C1 (Figure 5B). In campaign 3, natural cross ventilation was ensured, due to the effect of the wind. For this purpose, two openings were made in cell C1, measuring 20 cm × 20 cm each, one of them being located in the lower part of the east façade and the other in the upper part of the west façade, to guarantee their orientation to the prevailing winds (Figure 5C). In campaign 4, white reflective paint was applied on the outer faces of the four walls and on the roof. The application was carried out with three coats, according to the manufacturer’s instructions (Figure 5D).
Campaign 5 consisted of the simultaneous application of reflective paint on the opaque envelope of cell C1 and cross ventilation by the action of the wind, which was guaranteed 24 h a day. Campaign 6 was similar to campaign 5, although natural cross ventilation by wind action only occurred at night (between 18 h and 8 h). There was a 7th campaign, in which, associated with painting the opaque envelope with reflective paint, there was natural ventilation 24 h a day by the chimney effect, with three openings of 20 cm × 20 cm each, two located at the bottom of cell C1, on the west and east walls, and the third on the cell ceiling in its central part (Figure 5E). During all tests, the cell door and window remained closed, guaranteeing natural ventilation to occur only through the openings. The measurements (Phase I and Phase II) lasted 11 months, between June and April, according to the schedule presented in Table 2.
3. Preliminary Results
Before the beginning of the experimental campaigns, a relative measurement of the four temperature sensors was carried out. For this purpose, they were placed inside a climatic chamber during a 24 h cycle, with the temperature varying between 10 °C and 35 °C and the relative humidity between 50% and 80%. The results obtained by the four devices were similar.
Subsequently, an evaluation of the behavior of the test cells was carried out without any passive cooling measures having been implemented. Air temperature, radiant temperature and air infiltration were measured. Figure 6 shows the results of the temperature measurements taken between 15th May and 4th June, inside the two test cells and outside. The temperature inside of the two cells was very similar, showing that they were under similar conditions. Indoor temperature is always higher than outdoor temperature, both during day and night.
Figure 7 shows the mean radiant temperature and the temperature of dry bulb. It was found that, for each of the cells, there are no relevant differences between those values, proving that the impact of the radiation emitted by the interior surfaces is not meaningful. Thus, an identical performance in both was proven.
Figure 8 shows the air change rate per hour (RPH) in cells C1 and C2 resulting from performing 11 and 14 measurements, respectively. The results show some variability, not only when comparing the punctual values obtained for the different measurements, but also when evaluating the mean values for the two cells (2.29 h−1 for C1 and 2.42 h−1 for C2). However, the variability obtained was expected, since measurements carried out by other authors, using the same technique and CO2 as the tracer gas, point in the same direction [21]. For the reasons previously presented, it was considered that the obtained differences were acceptable. The very high values obtained in this test suggest the existence of significant infiltrations in the cells, probably due to the lack of sealing of the connecting joints between the walls and the ceiling.
4. Results
4.1. Outdoor Climate
Figure 9 shows the variation of outdoor temperature and relative humidity during the experimental campaign. The average outdoor temperature was 27.2 °C, with a maximum of 39.5 °C and a minimum of 17.1 °C, as shown in Figure 9A. The relative humidity shown in Figure 9B ranged between 13% and 95%, with an average of 65.3%. Radiation reached a maximum amount of 1081 W/m2 (Figure 10B) and wind speed reached a maximum value of 9.1 m/s, with an average value of 1.29 m/s (Figure 10C). As for the wind direction, it was mostly oriented to East-Northeast, followed by the East, Northeast and North-Northeast, corresponding those directions to 40.0% of the measurement period (Figure 10A). The lack of values in Figure 9 and Figure 10 resulted from failures in measurements by the meteorological station’s sensors.
4.2. Phase I
The temperatures measured inside the cells when the shading of the glazed opening in cell C1 was on are shown in Figure 11, with the highest value occurring in the control cell C2 (40.4 °C). Cell C2 had a mean temperature higher by 0.2 °C when compared to cell C1, and both cells had maximum, mean and minimum temperature values higher than the external temperature. In cell C1 a small gain in cooling was obtained, as there was a decrease in maximum daily temperatures. This result is not very expressive due to the small glazed area. However, with the use of this technique in larger glazed areas and on different facades, it is believed that its effect would be enhanced, as also shown by other authors [31,32].
Figure 12 shows the temperature variation when the low-emissivity reflective film was applied in the attic of cell C1. Comparing the results obtained in the two cells, cell C1 presented the maximum value of the temperature measured inside (40.4 °C), on average higher by 0.2 °C than the average temperature value in cell C2 (control cell). In view of these results, it is demonstrated that this technique, as implemented (film on the horizontal plane of the attic, which was covered with a roof with low-slope, resulting in smaller ventilation gaps) was ineffective as no cooling was guaranteed.
Figure 13 shows the temperature variation in cell C1, with natural cross ventilation by wind action, and in cell C2, without any modification, during campaign 3. This campaign took place during a period of very high outside temperatures. The maximum value of the interior temperature occurred in cell C2 and the minimum in cell C1, where natural cross ventilation by wind action had been guaranteed 24 h a day. It was found that in cell C2 the value was on average 0.6 °C higher than in cell C1, this average being 0.8 °C at night and 0.5 °C during daytime. Thus, the effectiveness of this technique is proven, reaching a maximum difference between the cells of 2.0 °C of cooling. Air change rate per hour in cell C1 averaged 6.96 h−1, much higher than the values obtained without openings, allowing the decrease in temperature to be correlated with the increase in ventilation rate.
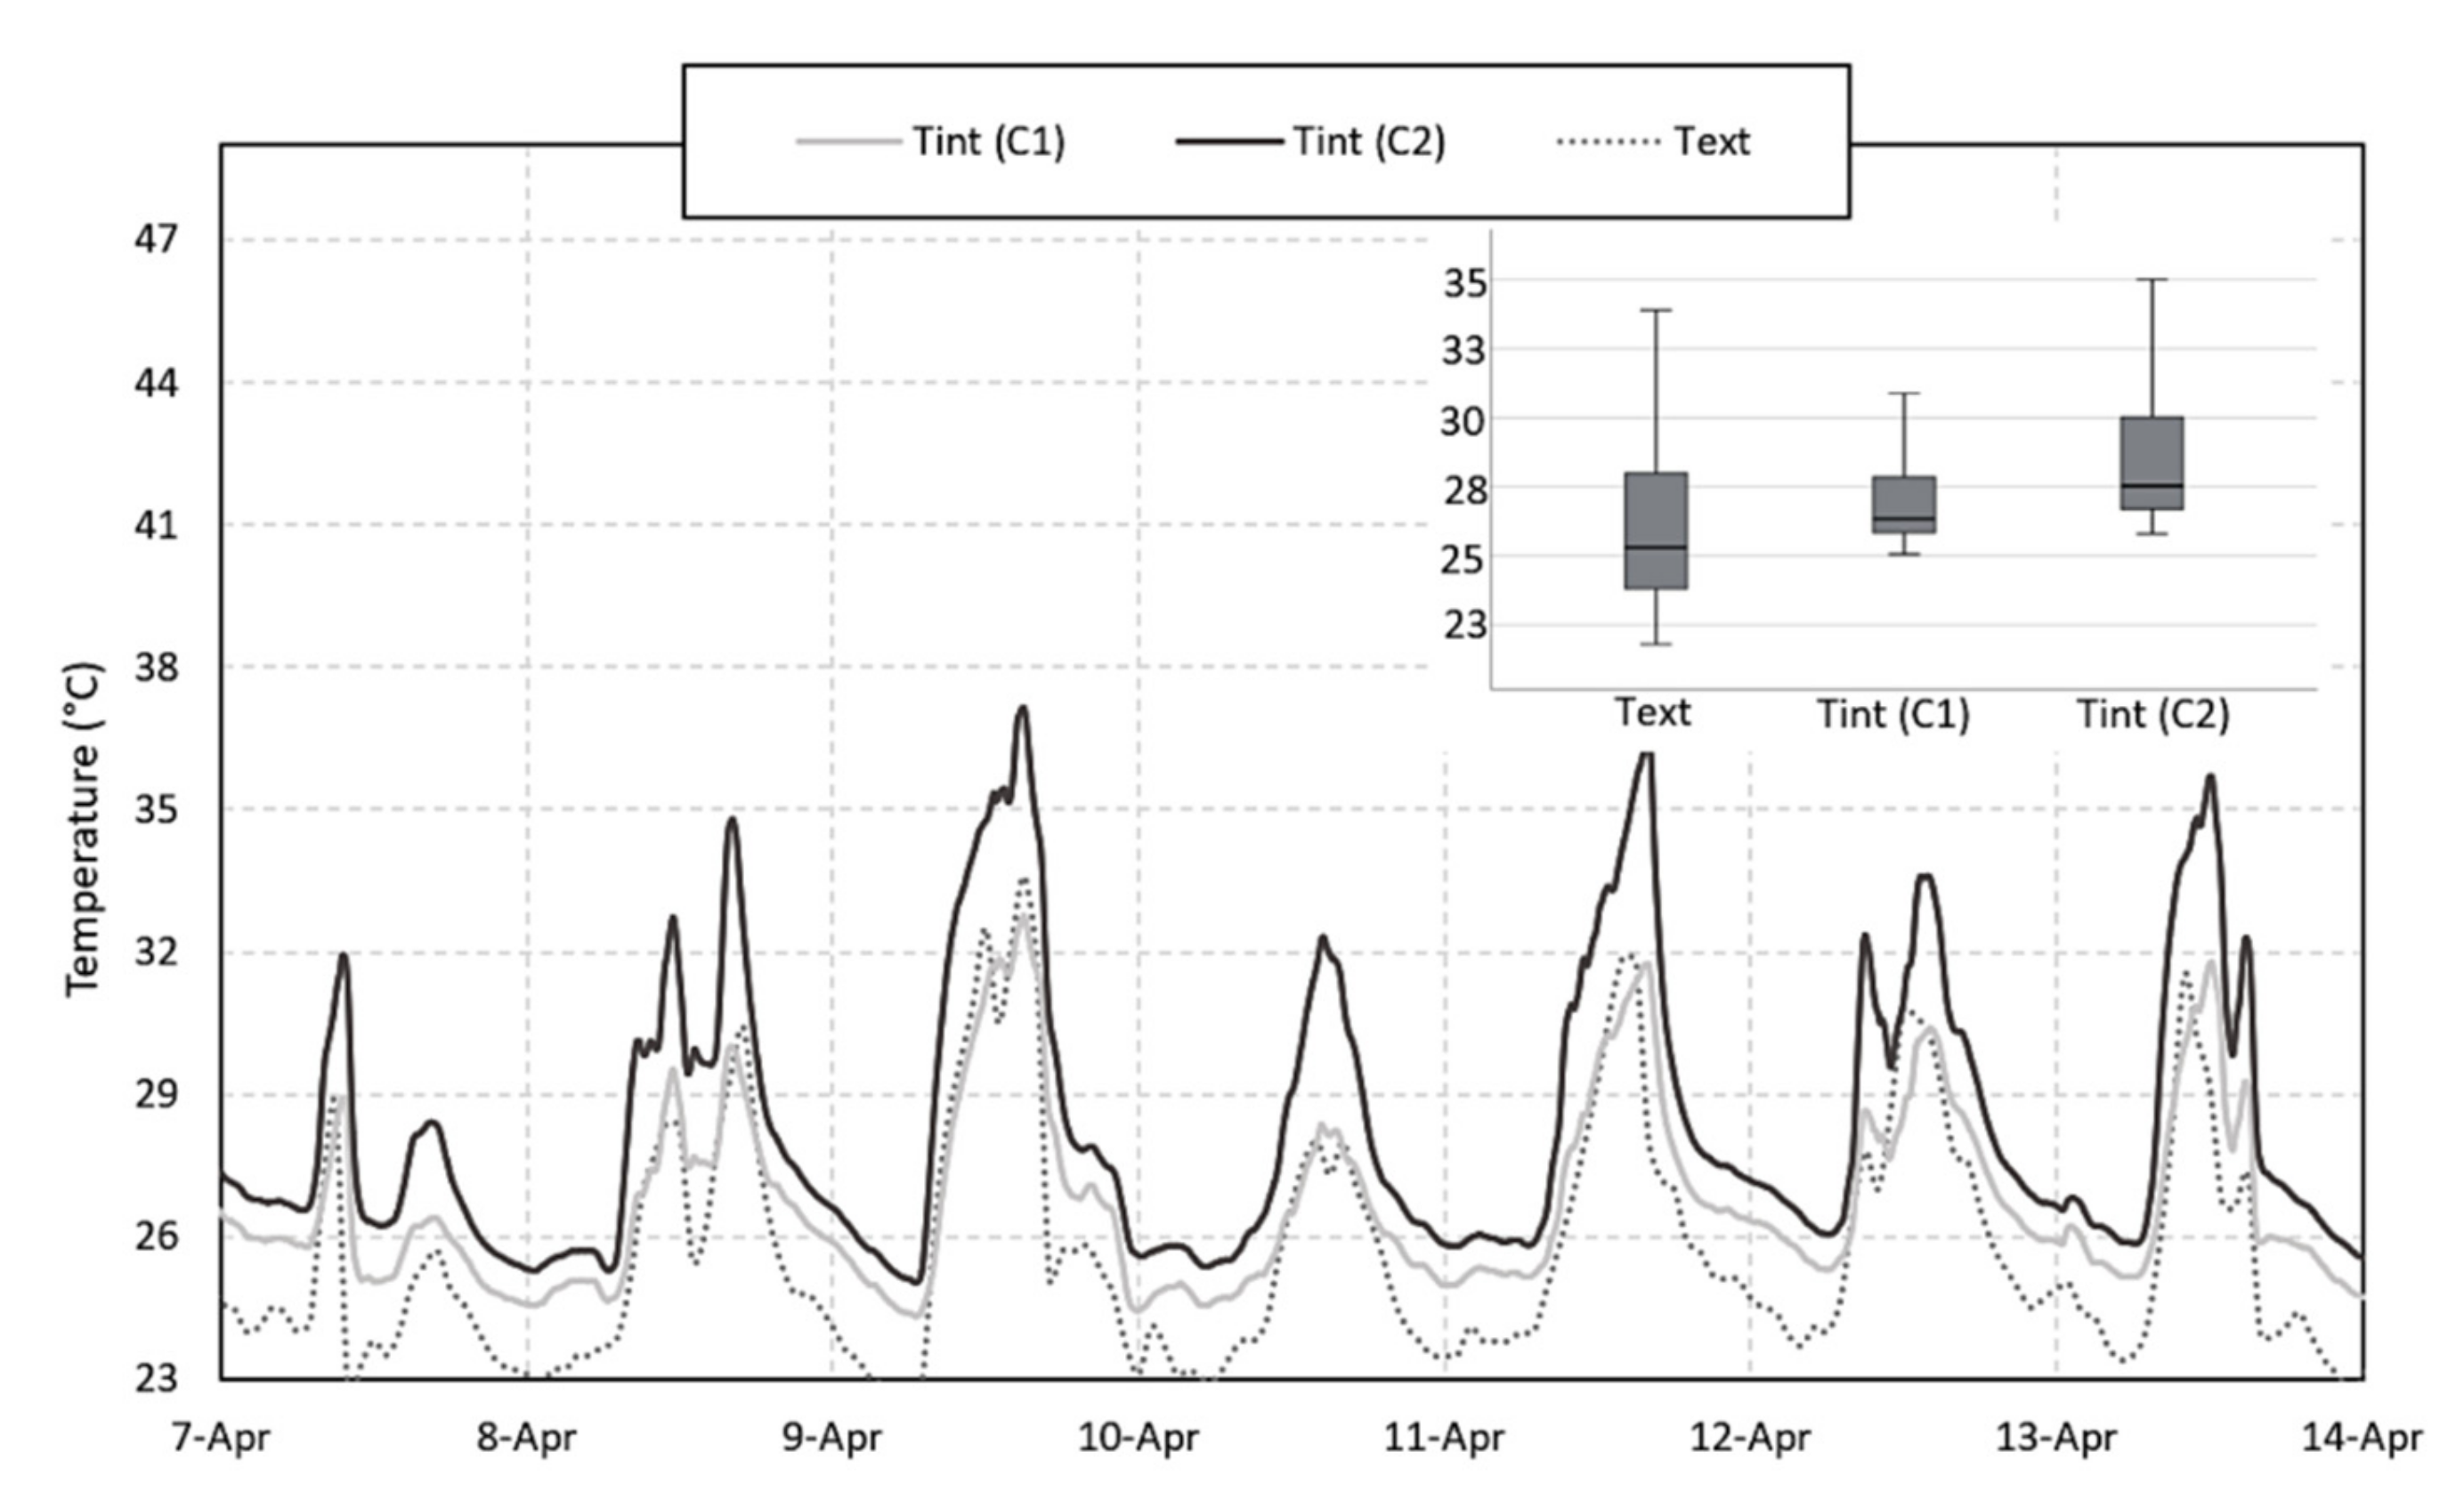
Figure 14 shows the results of campaign 4, in which the opaque envelope of cell C1 was painted with a reflective paint. After implementing this technique, a cooling peak of 3.8 °C in relation to C2 was reached. It appears that this technique was effective, as it allowed an average reduction in the interior temperature of cell C1, when compared to C2, of 1.1 °C. Comparing the results of campaign 3 with those of campaign 4, it was clear that the cross natural ventilation by the wind action had more impact at night and the painting with reflective paint was more efficient during the day, as the latter had 0.5 °C of daytime cooling and 1.7 °C of night cooling.
4.3. Phase II
The results of campaign 5 (painting of the opaque envelope with reflective paint and natural cross ventilation by wind action for 24 h) are shown in Figure 15. The highest temperatures always occurred in the cell without the passive cooling measures (cell C2). In the cell where cooling measures were applied (cell C1), 5.1 °C of cooling was obtained. The results also showed that the greatest temperature difference between the two cells occurred during the day, with an average of 2.5 °C. During the night, this difference did not reach 1.0 °C, thus presenting an average for the 24 h of the day of 1.7 °C of cooling.
When the opaque envelope painted with reflective coating was associated with natural cross ventilation by the wind action only at night (campaign 6), the results obtained did not differ significantly from those of campaign 5, with a mean difference between the two cells of 1.6 °C. It was also possible to verify that there was a slight increase in temperature differences during the day, with an average difference of 2.8 °C, since, with ventilation disabled when outside temperatures were higher, the entry of warmer air coming from outside was avoided. In this campaign, the maximum difference obtained between the two cells was 5.0 °C (Figure 16).
The association of the opaque envelope with reflective painting with natural ventilation by the chimney effect in cell C1 (campaign 7) also showed good results (Figure 17), since in cell C1 measured temperatures were, on average, 1.8 °C lower than in cell C2. These differences were very similar to those obtained in campaigns 5 and 6 for the night period (0.8 °C) and slightly higher for the day period (3.1 °C on average and 5.6 °C of maximum difference). These results demonstrate a greater effectiveness of natural ventilation by the chimney effect compared to cross ventilation by the wind action, since it occurs even when the wind speed is practically null.
Table 3 summarizes the results obtained in the seven experimental campaigns carried out. When applied individually, opaque envelope with reflective painting proved to be the most effective of the techniques. Cross ventilation by wind action for 24 h showed an average temperature difference of 0.6 °C between cell C1 (where the technique was implemented) and cell C2. However, its effectiveness is greater at night, with the average difference increasing to 0.8 °C. The results using the reflective painting showed an average temperature difference between the two cells (C1 against C2) of 1.1 °C, increasing to 1.5 °C if only the daytime period was considered. It was also verified that the shading of the glazed openings resulted in a slight temperature reduction inside cell C1 compared to cell C2, with better results obtained in the daytime, when there is solar radiation. Despite the low reduction in temperature in this case study, it is expected that shading of the glazed openings has a higher impact if the glazed area increases. With the application of the low-emissivity reflective film on the attic floor, there was no improvement in the performance, probably due to the ineffective ventilation of that space, resulting from the low slope of the roof.
It was found that the combination of techniques resulted in a greater temperature difference compared to the control cell than the implementation of each of them individually. In campaign 5 the greatest decrease in temperature between the cells was 5.1 °C, with an average of 2.7 °C in the daytime period. When natural cross ventilation by wind action only occurred at night (campaign 6) performance improved, since the maximum temperature difference between cell C1 and cell C2 was 5.0 °C and the average value during the daytime period was of 2.8 °C. This value increased to 3.1 °C when ventilation occurred due to the chimney effect during the 24 h of the day.
5. Conclusions
To assess the effectiveness of some passive cooling techniques, an experimental campaign was carried out. The following conclusions can be drawn:
- -
- the effectiveness of the shading of the glazed opening was not very evident, probably due to the specific characteristics of the opening used in the test cells, so it will be necessary to evaluate its effect with larger glazing areas;
- -
- the low-emissivity reflective film, considering the proposed roof model, was not efficient;
- -
- natural cross ventilation was the most effective at night, lowering the temperature compared to the control by 0.8 °C, and the reflective painting showed better performance during the day, ensuring a temperature decrease of 1.5 °C;
- -
- regarding the combined techniques, the results indicate that the last three campaigns were the most effective, that is, the combination of reflective painting with natural ventilation ensured greater decreases in temperature regarding the ones measured in the control cell;
- -
- globally, the differences obtained are insufficient to achieve adequate levels of thermal comfort without the support of air conditioning systems. However, the contribution of the passive techniques can be important in reducing the energy consumption associated with the HVAC systems.
It is important to emphasize that the methodological procedure shows important results that can support the decision-making process concerning the choice of passive cooling techniques. However, further research is required to include the perception and the adaptive behavior of users.
Author Contributions
Conceptualization, R.M.S.F.A. and E.B.; Formal analysis, M.M.; Investigation, M.M.; Methodology, M.M., R.M.S.F.A. and E.B.; Supervision, R.M.S.F.A. and E.B.; Writing—original draft, M.M.; Writing—review & editing, R.M.S.F.A. and E.B. All authors have read and agreed to the published version of the manuscript.
Funding
This research received no external funding.
Institutional Review Board Statement
Not applicable.
Informed Consent Statement
Not applicable.
Acknowledgments
This work was financially supported by Base Funding—UIDB/04708/2020 of the CONSTRUCT—Instituto de I&D em Estruturas e Construções, funded by national funds through the FCT/MCTES (PIDDAC).
Conflicts of Interest
The authors declare no conflict of interest.
References
- Kamal, M.A. An overview of passive cooling techniques in buildings: Design concepts and architectural interventions. Napoc. Civ. Eng. Archit. 2012, 55, 84–97. [Google Scholar]
- Santamouris, M.; Kolokotsa, D. Passive cooling dissipation techniques for buildings and other structures: The state of the art. Energy Build. 2013, 57, 74–94. [Google Scholar] [CrossRef]
- Santamouris, M.; Argiriou, A. Passive cooling of buildings—Results of the pascool program. Int. J. Sol. Energy 1997, 19, 3–19. [Google Scholar] [CrossRef]
- Darmanis, M.; Çakan, M.; Moustris, K.P.; Kavadias, K.A.; Nikas, K.-S.P. Utilisation of Mass and Night Ventilation in Decreasing Cooling Load Demand. Sustainability 2020, 12, 7826. [Google Scholar] [CrossRef]
- Mumovic, D.S. A Handbook of Sustainable Building Desing and Engineering: An Integrated Approach to Energy. Health and Operational Performance; Earthscan: London, UK, 2009. [Google Scholar]
- Givoni, B. Climate Considerations in Building and Urban Design; Wiley: Hoboken, NJ, USA, 1998. [Google Scholar]
- Khambadkone, N.K.; Jain, R. A Bioclimatic analysis tool for investigation of the potential of passive cooling and heating strategies in a composite Indian climate. Build. Environ. 2017, 123, 469–493. [Google Scholar] [CrossRef]
- Kumar, S.; Singh, M.K.; Mathur, A.; Mathur, S.; Mathur, J. Thermal performance and comfort potential estima-tion in low-rise high thermal mass naturally ventilated office buildings in India: An experimental study. J. Build. Eng. 2018, 20, 569–584. [Google Scholar] [CrossRef]
- Roque, E.; Vicente, R.; Almeida, R.M. Opportunities of Light Steel Framing towards thermal comfort in southern European climates: Long-term monitoring and comparison with the heavyweight construction. Build. Environ. 2021, 200, 107937. [Google Scholar] [CrossRef]
- Roque, E.; Oliveira, R.; Almeida, R.M.S.F.; Vicente, R.; Figueiredo, A. Lightweight and prefabricated construction as a path to energy efficient buildings: Thermal design and execution challenges. Int. J. Environ. Sustain. Dev. 2020, 19, 1–32. [Google Scholar] [CrossRef]
- Stazi, F.; Tomassoni, E.; Bonfigli, C.; DI Perna, C. Energy, comfort and environmental assessment of different building envelope techniques in a Mediterranean climate with a hot dry summer. Appl. Energy 2014, 134, 176–196. [Google Scholar] [CrossRef]
- Kumar, S.; Tewari, P.; Mathur, S.; Mathur, J. Development of mathematical correlations for indoor temperature from field observations of the performance of high thermal mass buildings in India. Build. Environ. 2017, 122, 324–342. [Google Scholar] [CrossRef]
- Givoni, B. Effectiveness of mass and night ventilation in lowering the indoor daytime temperatures. Part I: 1993 experimental periods. Energy Build. 1998, 28, 25–32. [Google Scholar] [CrossRef]
- Cheng, V.; Ng, E.Y.Y.; Givoni, B. Effect of envelope colour and thermal mass on indoor temperatures in hot humid climate. Sol. Energy 2005, 78, 528–534. [Google Scholar] [CrossRef]
- Artmann, N.; Manz, H.; Heiselberg, P. Parameter study on performance of building cooling by night-time ventilation. Renew. Energy 2008, 33, 2589–2598. [Google Scholar] [CrossRef]
- Romeo, C.; Zinzi, M. Impact of a cool roof application on the energy and comfort performance in an existing non-residential building. A Sicilian case study. Energy Build. 2013, 67, 647–657. [Google Scholar] [CrossRef]
- Imessad, K.; Derradji, L.; Messaoudene, N.A.; Mokhtari, F.; Chenak, A.; Kharchi, R. Impact of passive cooling techniques on energy demand for residential buildings in a Mediterranean climate. Renew. Energy 2014, 71, 589–597. [Google Scholar] [CrossRef]
- Al-Obaidi, K.M. Passive cooling techniques through reflective and radioative roofs in tropical houses in Southeast Asia: A literature review. Front. Archit. Research. 2014, 3, 183–297. [Google Scholar] [CrossRef] [Green Version]
- Eli, L.; Krelling, A.; Olinger, M.; Melo, A.; Lamberts, R. Thermal performance of residential building with mixed-mode and passive cooling strategies: The Brazilian context. Energy Build. 2021, 244, 111047. [Google Scholar] [CrossRef]
- Veiga, R.K. Metamodelo Para Estimar o Desempenho Térmico de Edificações Residenciais Multifamiliares Naturalmente Ventiladas. Master’s Thesis, Universidade Federal de Santa Catarina, Florianópolis, Brazil, 2021. (In Portuguese). [Google Scholar]
- Buonocore, C.O. Análise das Condições de Conforto Térmico no Clima Quente e Úmido de São Luís (MA): Estudos de Campo em Salas de Aula Naturalmente Ventiladas e Climatizadas. Master’s Thesis, Universidade Federal de Santa Catarina, Florianópolis, Brazil, 2018. (In Portuguese). [Google Scholar]
- Schabbach, L.M. Pigmented glazed ceramic roof tiles in Brazil: Thermal and optical properties related to solar reflectance index. Sol. Energy 2018, 159, 113–124. [Google Scholar] [CrossRef]
- Michels, C. Avaliação Experimental do Desempenho Térmico de Coberturas. Master’s Thesis, Universidade Federal de Santa Catarina, Florianópolis, Brazil, 2018. (In Portuguese). [Google Scholar]
- Brasil, Ministério Da Agricultura, Pecuária E Abastecimento: Instituto Nacional De Meteorologia. Rede de Estações Meteorológicas Automáticas do INMET; Nota Técnica nº 001/2011. 11; Ministério Da Agricultura, Pecuária E Abastecimento: Instituto Nacional De Meteorologia: Brasília, Brazil, 2011.
- Onset Computer Corporation. A Manual—U12011: Hobo U12 Temp/RH Data Logger Doc 13127; Onset Computer Corporation: Bourne, MA, USA, 2009. [Google Scholar]
- ISO 12569:2017 (EN). Thermal Performance of Buildings and Materials—Determination of Specific Airflow Rate in Buildings—Tracer Gas Dilution Method; ISO: Geneva, Switzerland, 2017. [Google Scholar]
- ASTM. E741-00 Standard Test Method for Determining Air Change in a Single Zone by Means of a Tracer Gas Dilution, American Society for Testing and Materials; ASTM: West Conshohocken, PA, USA, 2000. [Google Scholar]
- Oliveira, A.V.M.; Raimundo, A.M.; Gaspar, A.R.; Quintela, D.A. Globe Temperature and Its Measurement: Requirements and Limitations. Ann. Work. Expo. Health 2019, 63, 743–758. [Google Scholar] [CrossRef]
- Alfano, F.R.D.; Dell’Isola, M.; Ficco, G.; Palella, B.I.; Riccio, G. On the measurement of the mean radiant temperature by means of globes: An experimental investigation under black enclosure conditions. Build. Environ. 2021, 193, 107655. [Google Scholar] [CrossRef]
- ISO. 7726:1998 Ergonomics of the Thermal Environment—Instruments for Measuring Physical Quantities; ISO: Geneva, Switzerland, 1998. [Google Scholar]
- Stavrakakis, G.M.; Karadimou, D.P.; Zervas, P.L.; Sarimveis, H.; Markatos, N.C. Selection of window sizes for optimizing occupational comfort and hygiene based on computational fluid dynamics and neural networks. Build. Environ. 2011, 46, 298–314. [Google Scholar] [CrossRef]
- Stavrakakis, G.; Zervas, P.; Sarimveis, H.; Markatos, N. Optimization of window-openings design for thermal comfort in naturally ventilated buildings. Appl. Math. Model. 2012, 36, 193–211. [Google Scholar] [CrossRef]
Figure 1.
Geographic location of the state of Tocantins and the city of Palmas, in Brazil.
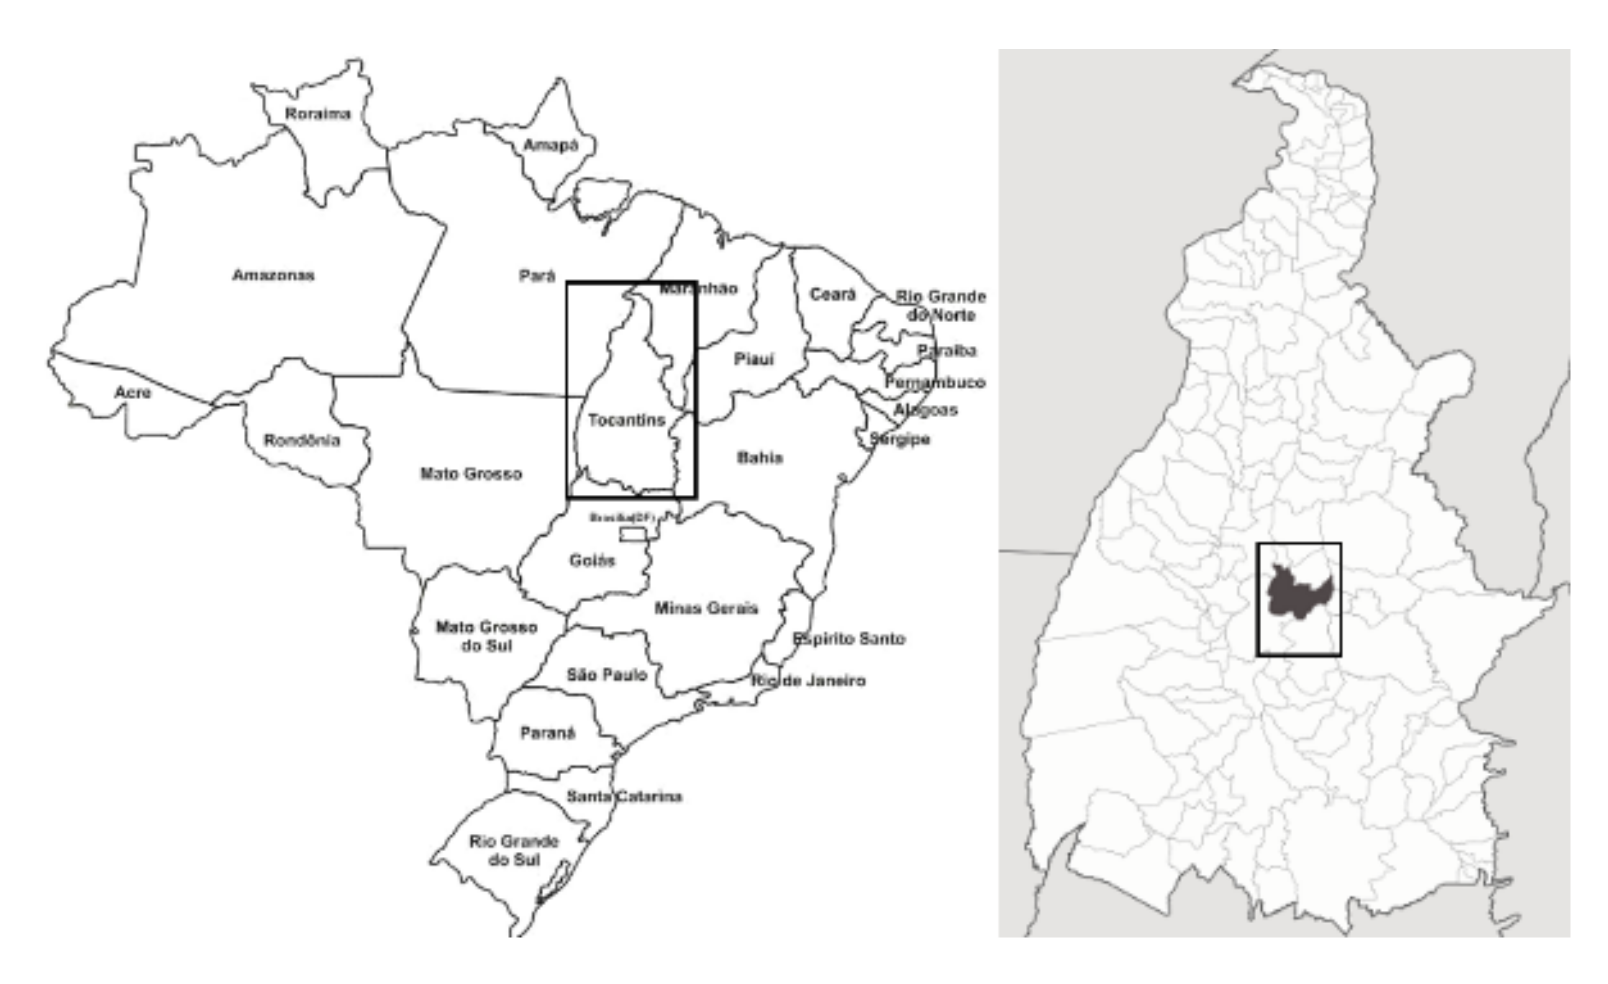
Figure 2.
The typical annual ambient conditions of Palmas, Brazil.
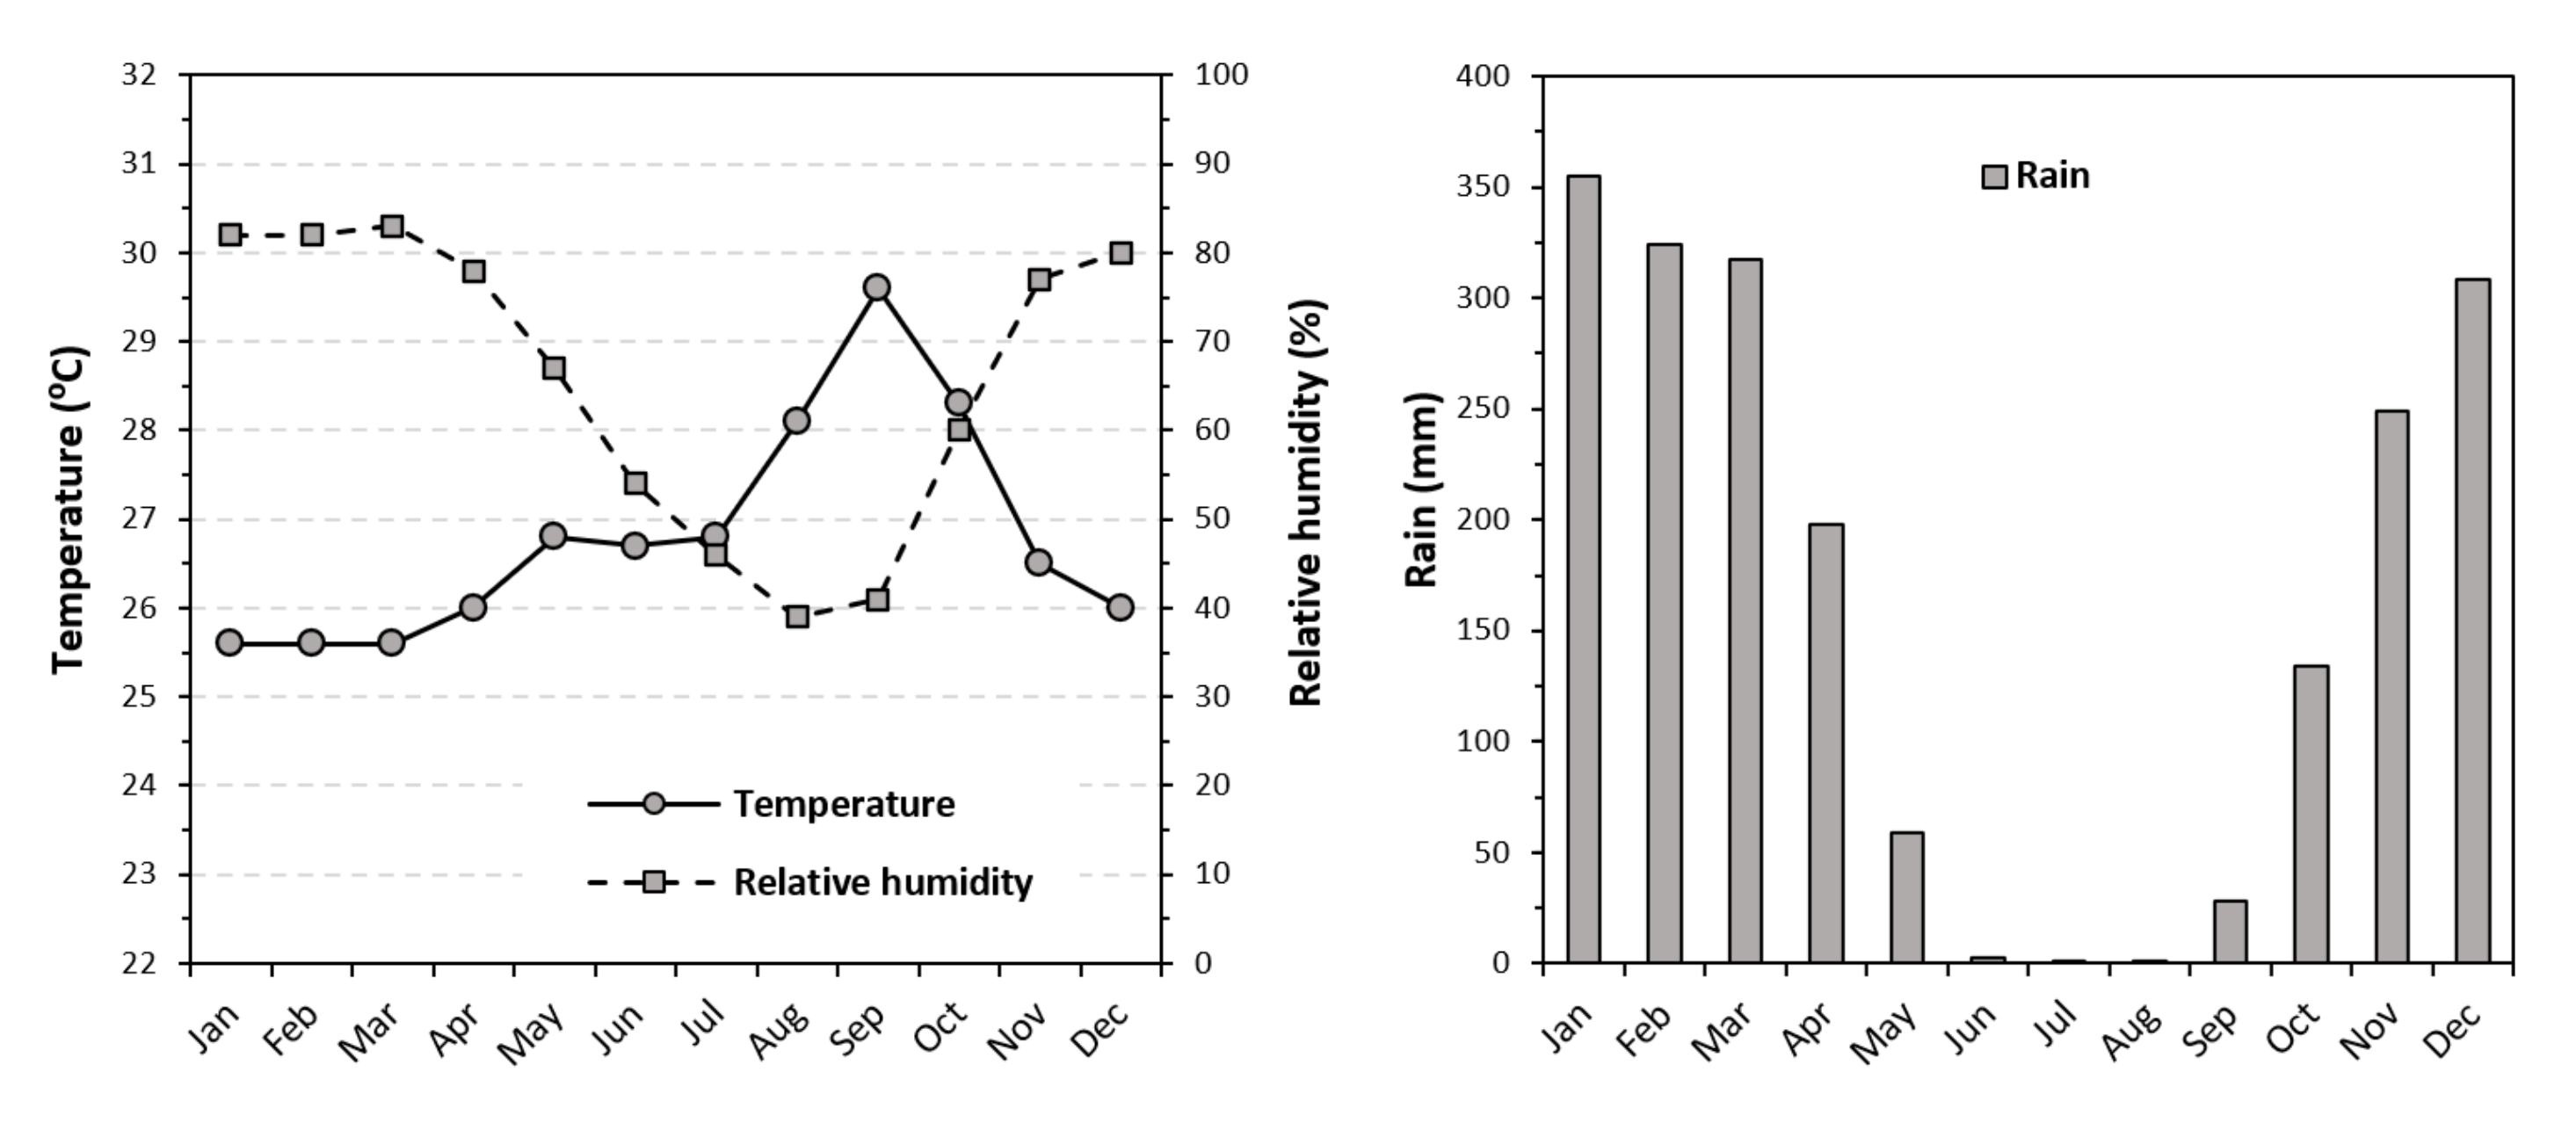
Figure 3.
Test cells: (A,B) Layout of the two test cells; (C) Photograph of the cells.
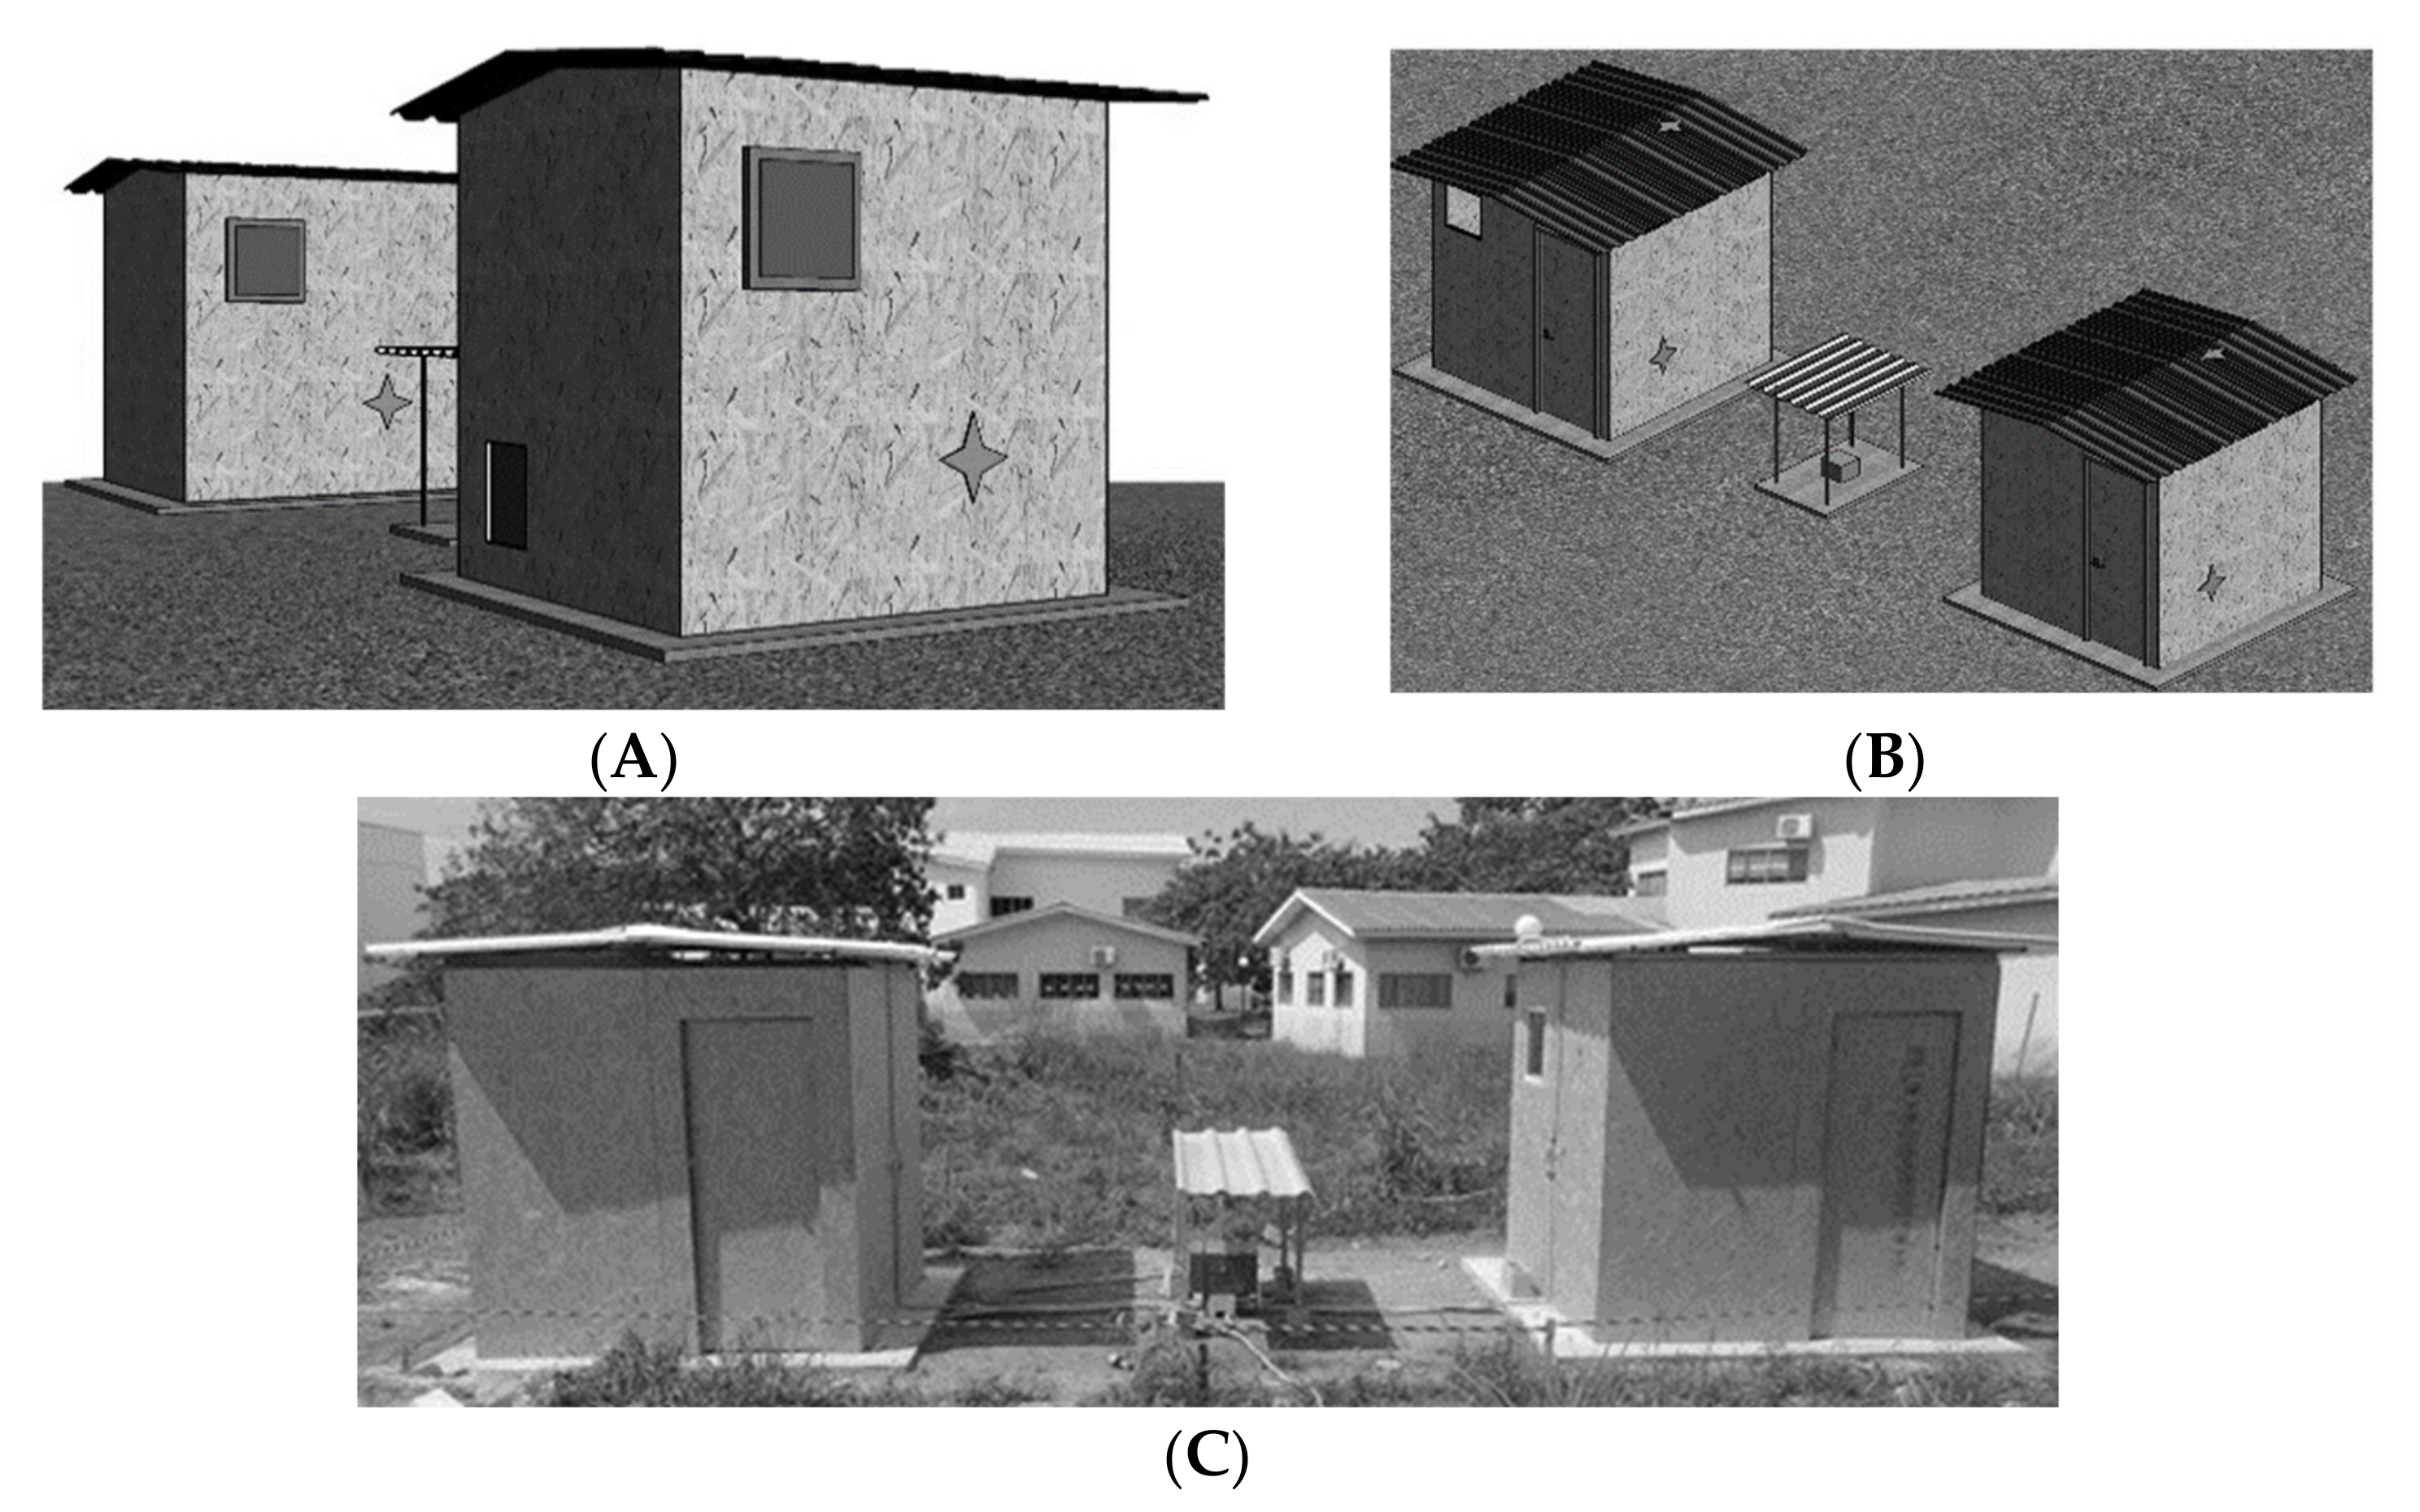
Figure 4.
Equipment used: (A) Temperature sensor; (B) CO2 concentration meter; (C) Black globe thermometer; (D) INMET Meteorological Station.
Figure 4.
Equipment used: (A) Temperature sensor; (B) CO2 concentration meter; (C) Black globe thermometer; (D) INMET Meteorological Station.
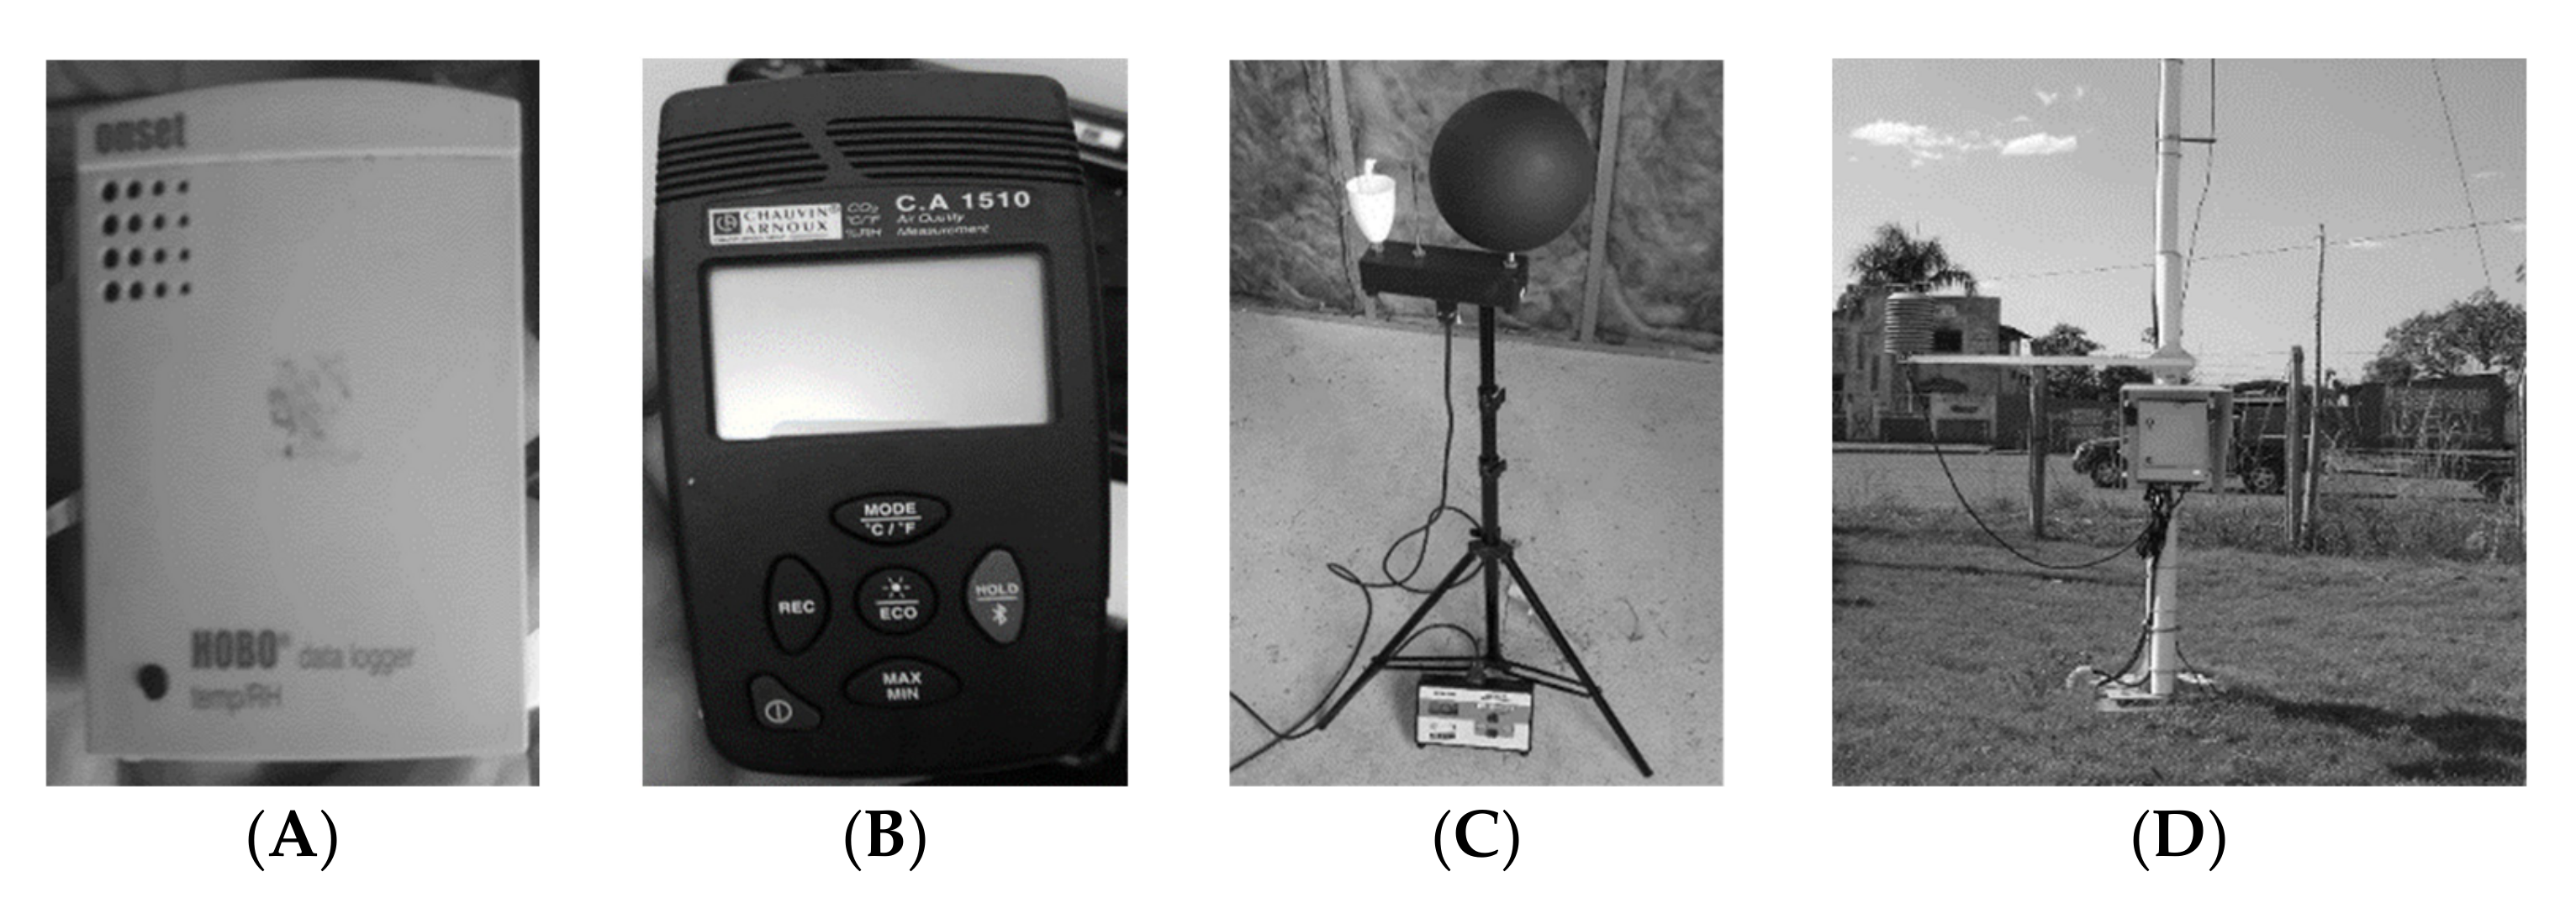
Figure 5.
Implemented passive cooling techniques: (A) Shading of the glazed openings; (B) Low-emissivity reflective film; (C) Natural cross ventilation, due to wind effect; (D) Painting with reflective paint on the walls and roof; (E) Natural ventilation, by chimney effect.
Figure 5.
Implemented passive cooling techniques: (A) Shading of the glazed openings; (B) Low-emissivity reflective film; (C) Natural cross ventilation, due to wind effect; (D) Painting with reflective paint on the walls and roof; (E) Natural ventilation, by chimney effect.
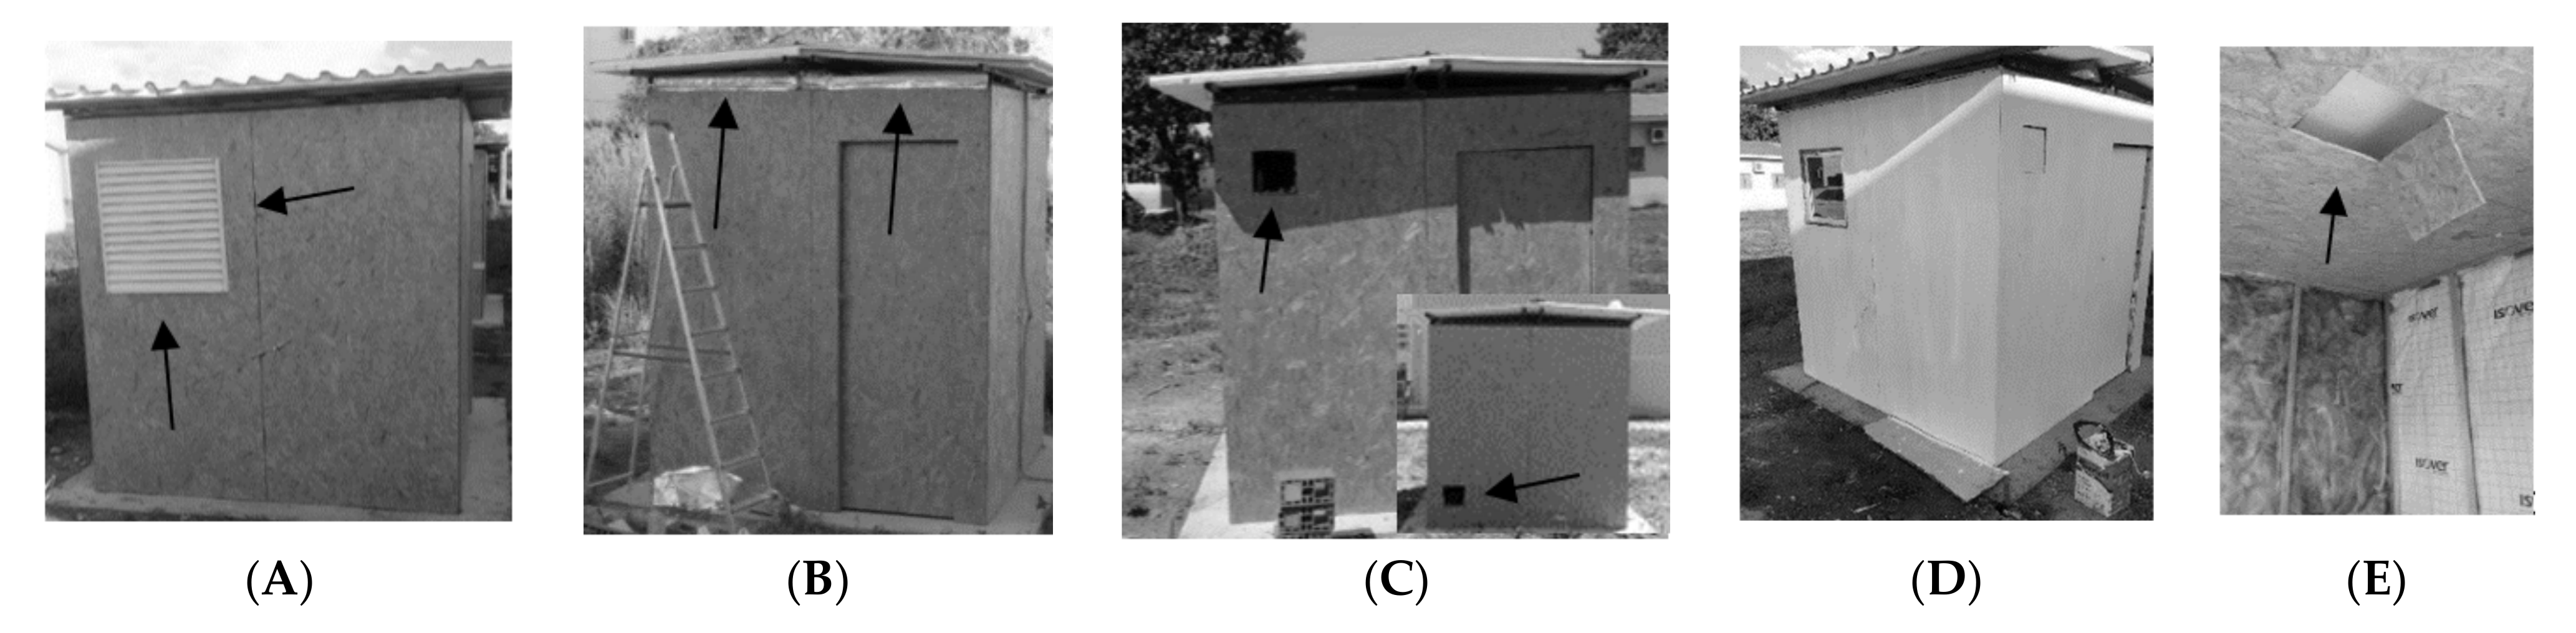
Figure 6.
Air temperature between 15th May and 4th June, inside the two test cells and outside: (A) Variation in time; (B) Box-plot representation.
Figure 6.
Air temperature between 15th May and 4th June, inside the two test cells and outside: (A) Variation in time; (B) Box-plot representation.
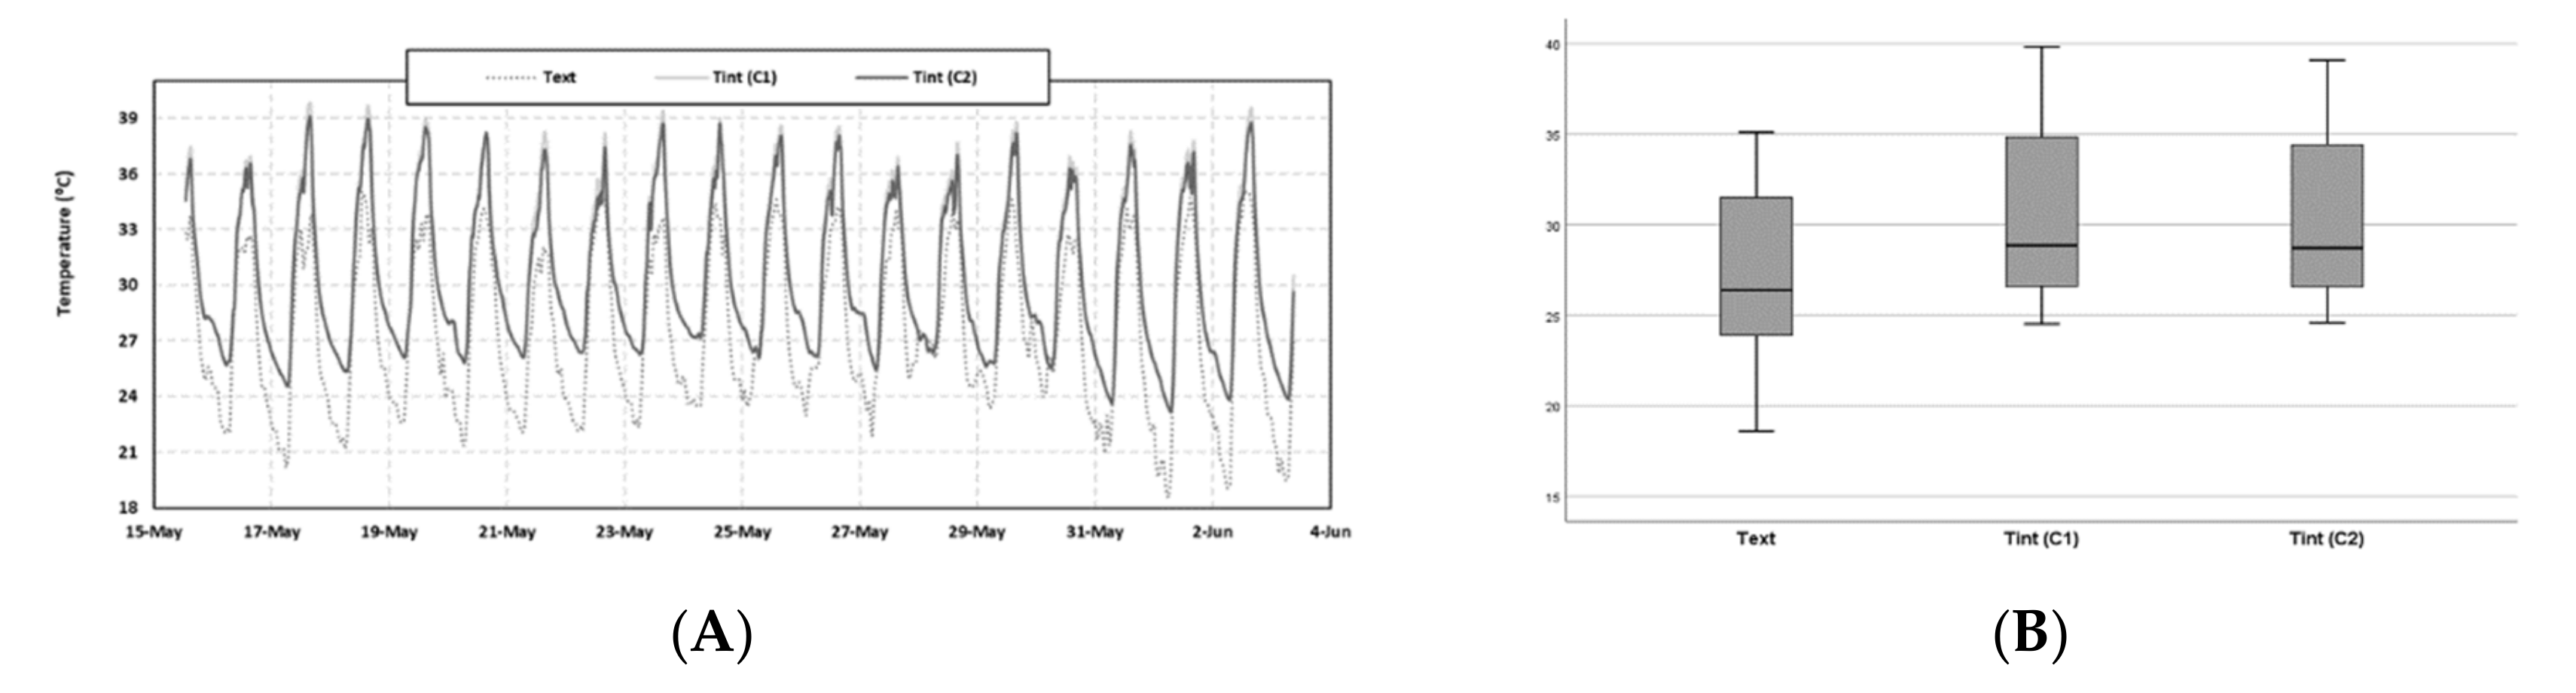
Figure 7.
Radiant temperature (tr) and dry bulb temperature (Tbs): (A) Cell C1; (B) Cell C2.
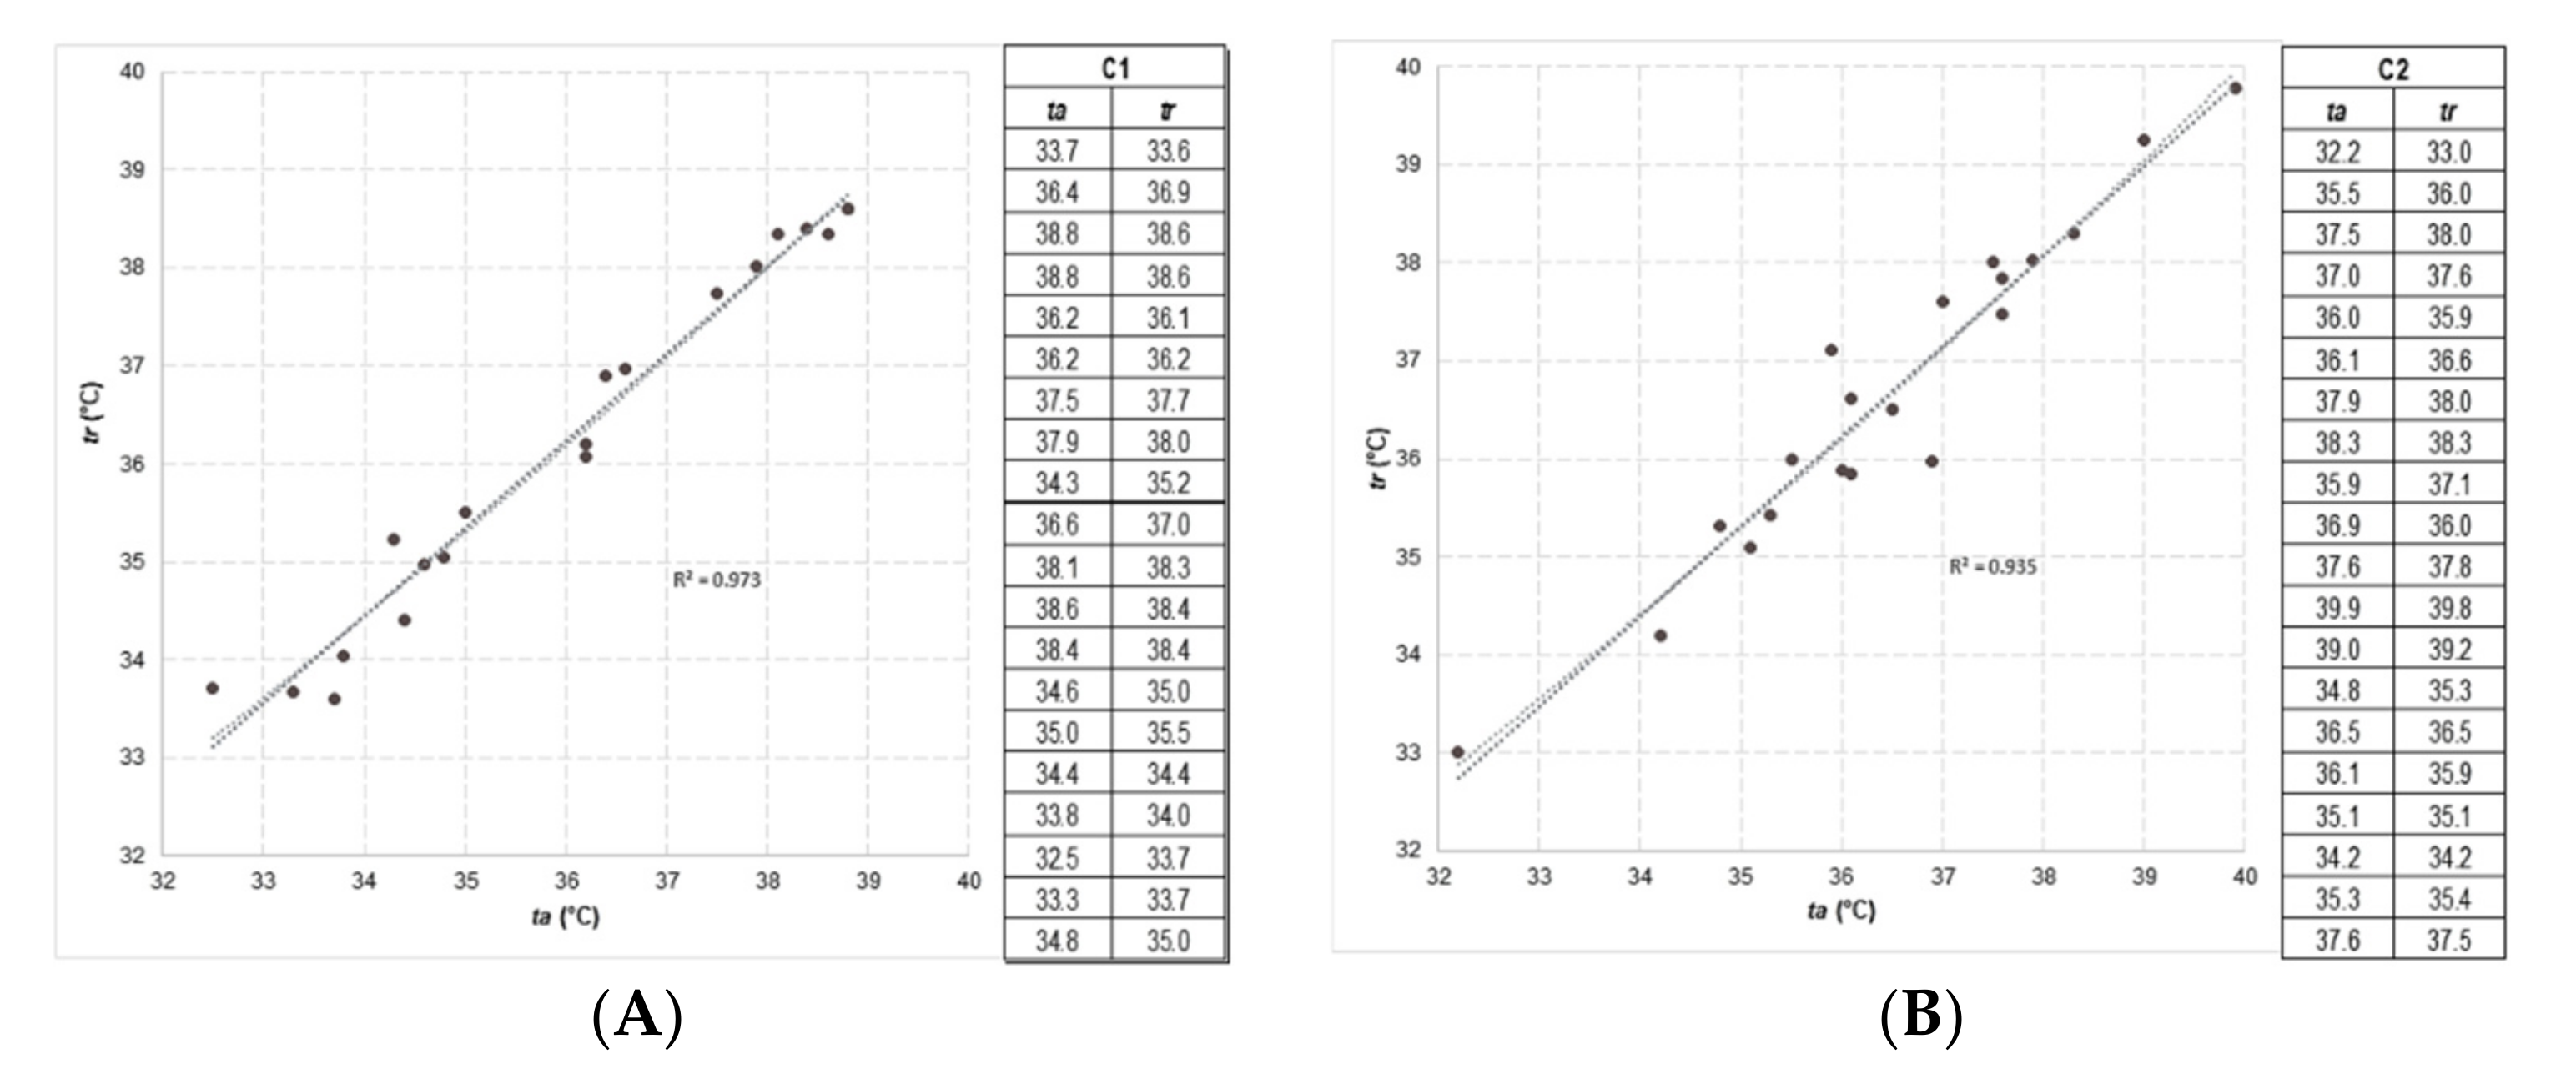
Figure 8.
Air change rate per hour (RPH) in cells C1 and C2.
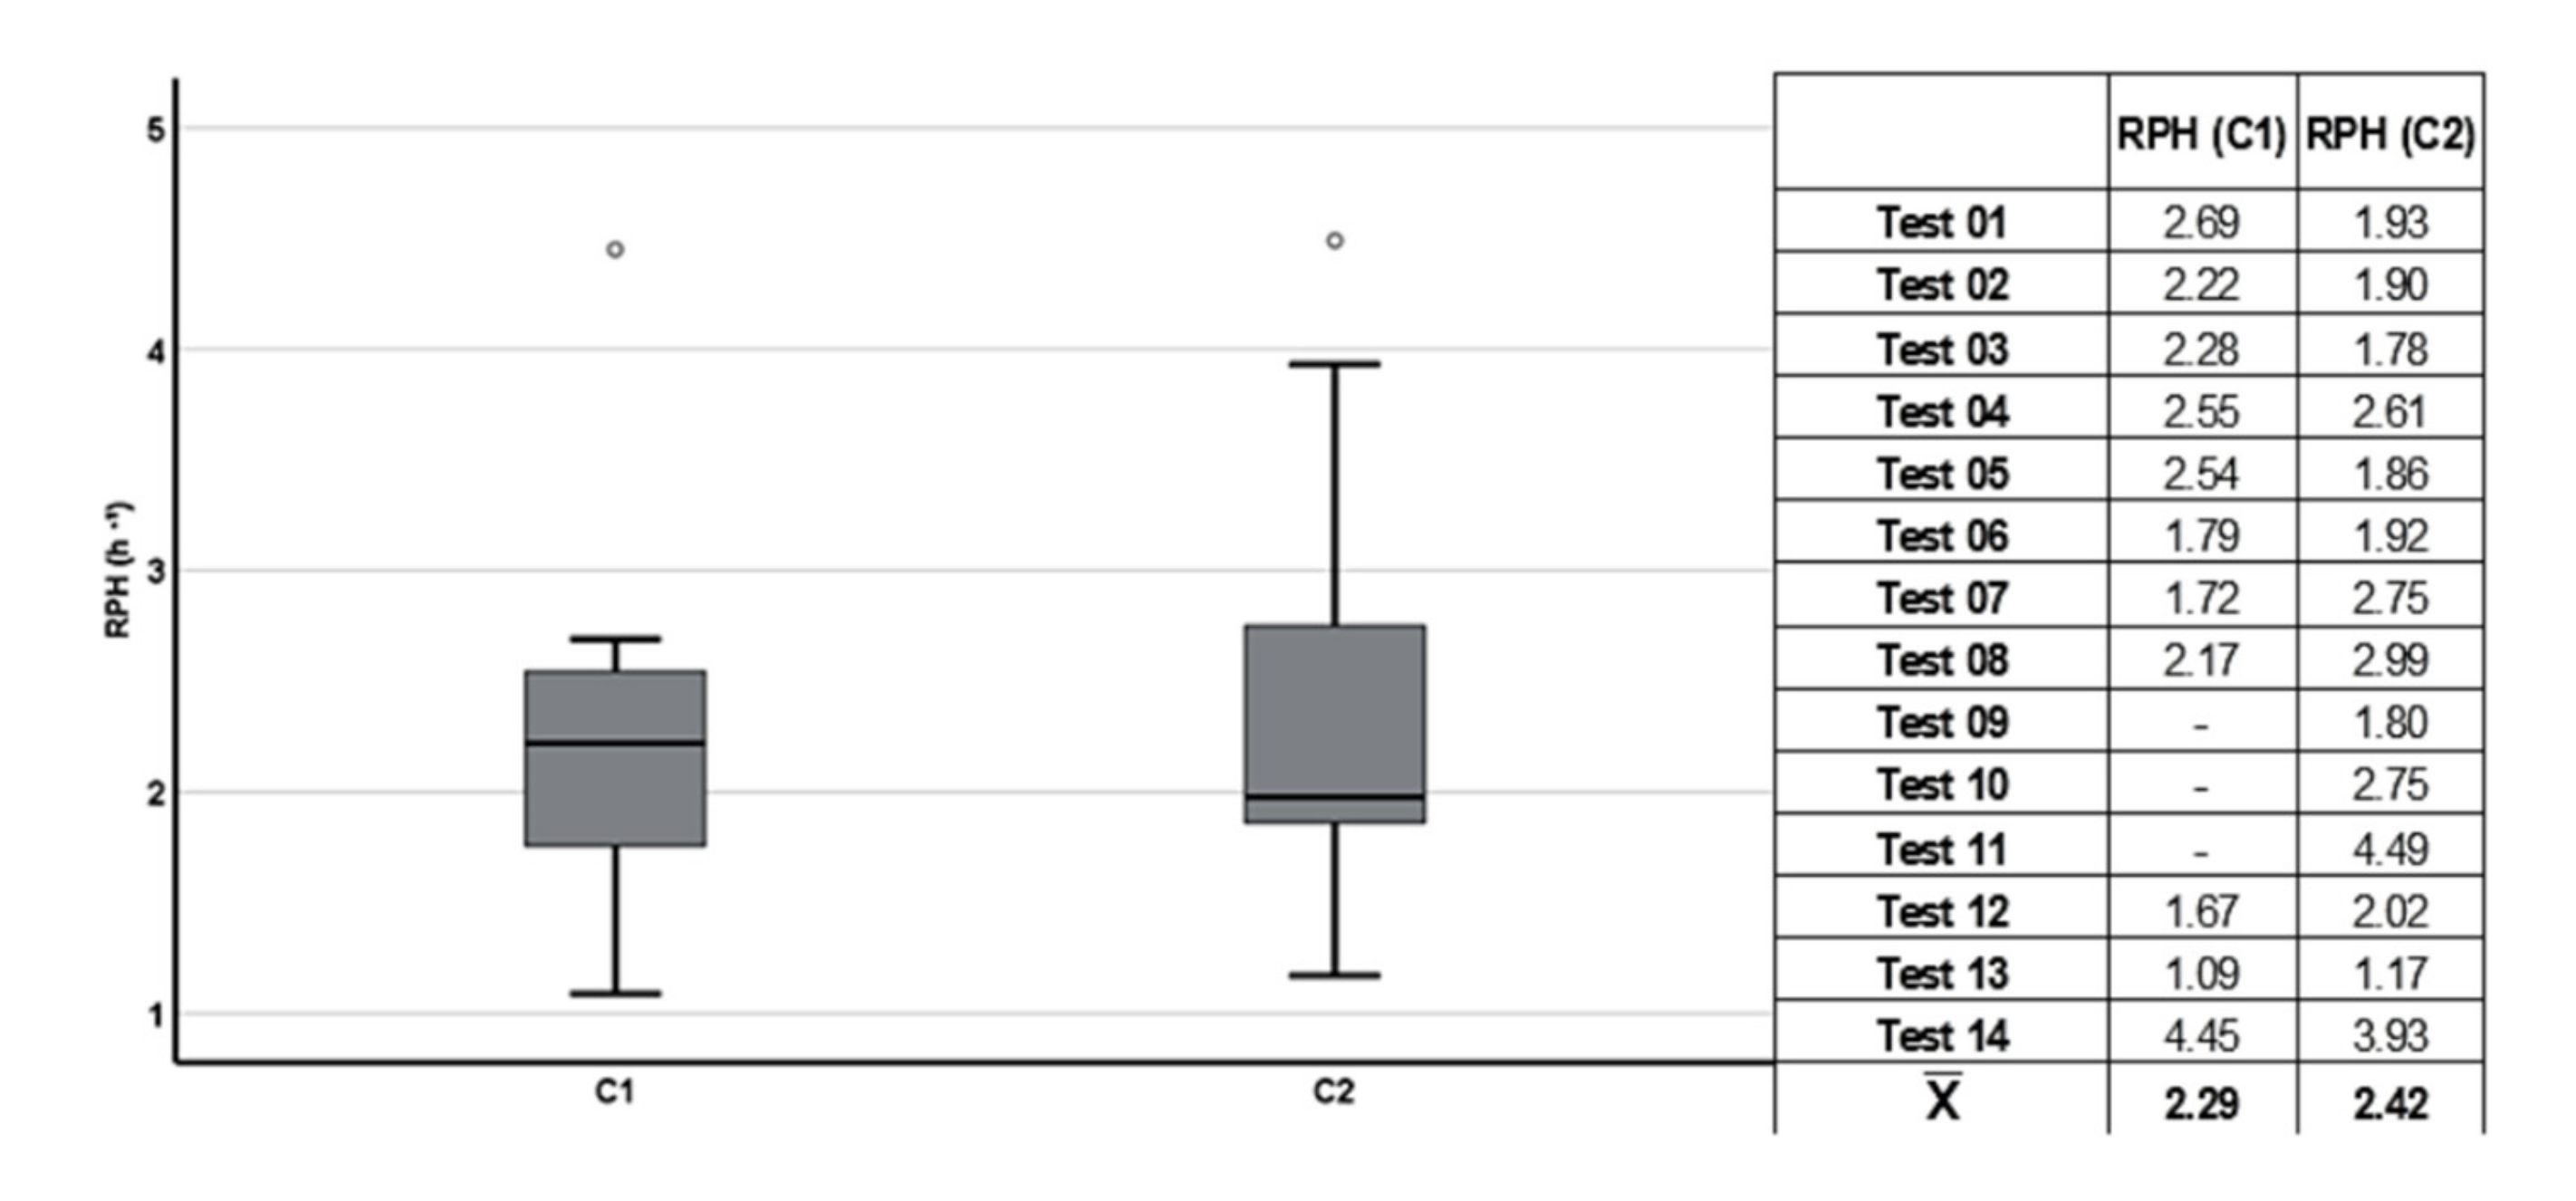
Figure 9.
Outdoor climate: (A) Temperature; (B) Relative Humidity.
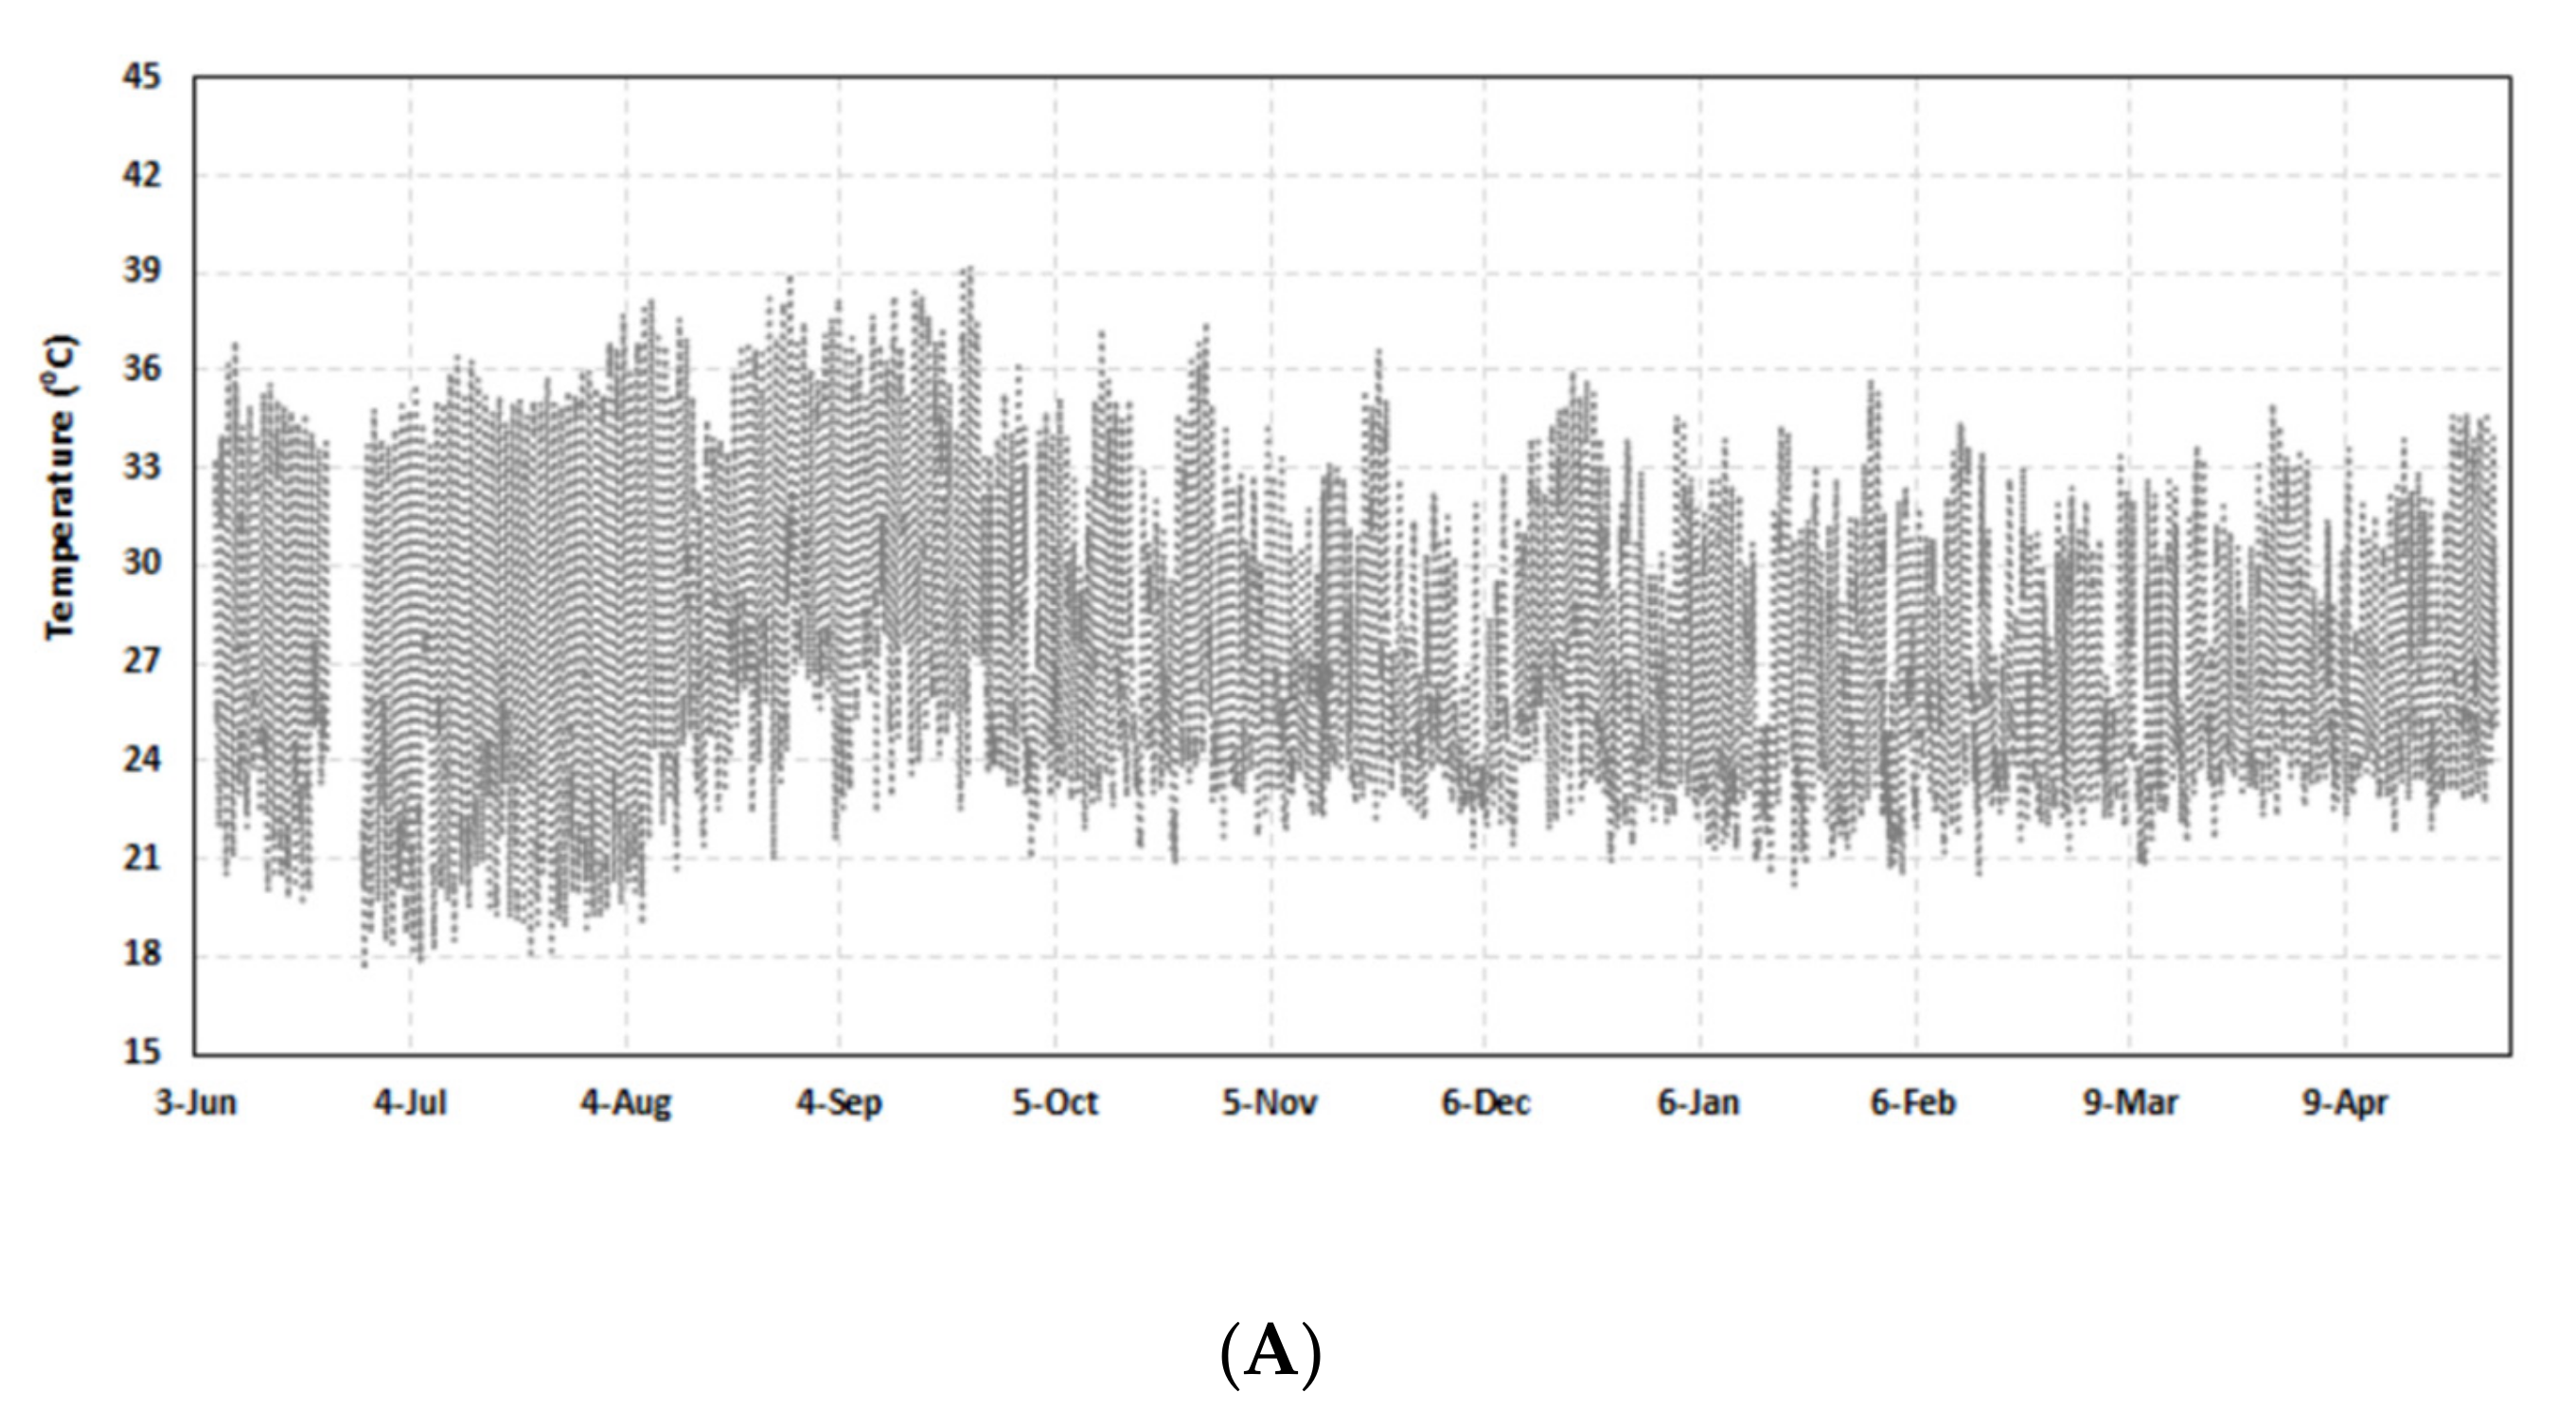

Figure 10.
Outdoor climate: (A) Wind direction; (B) Solar Radiation; (C) Wind Speed.
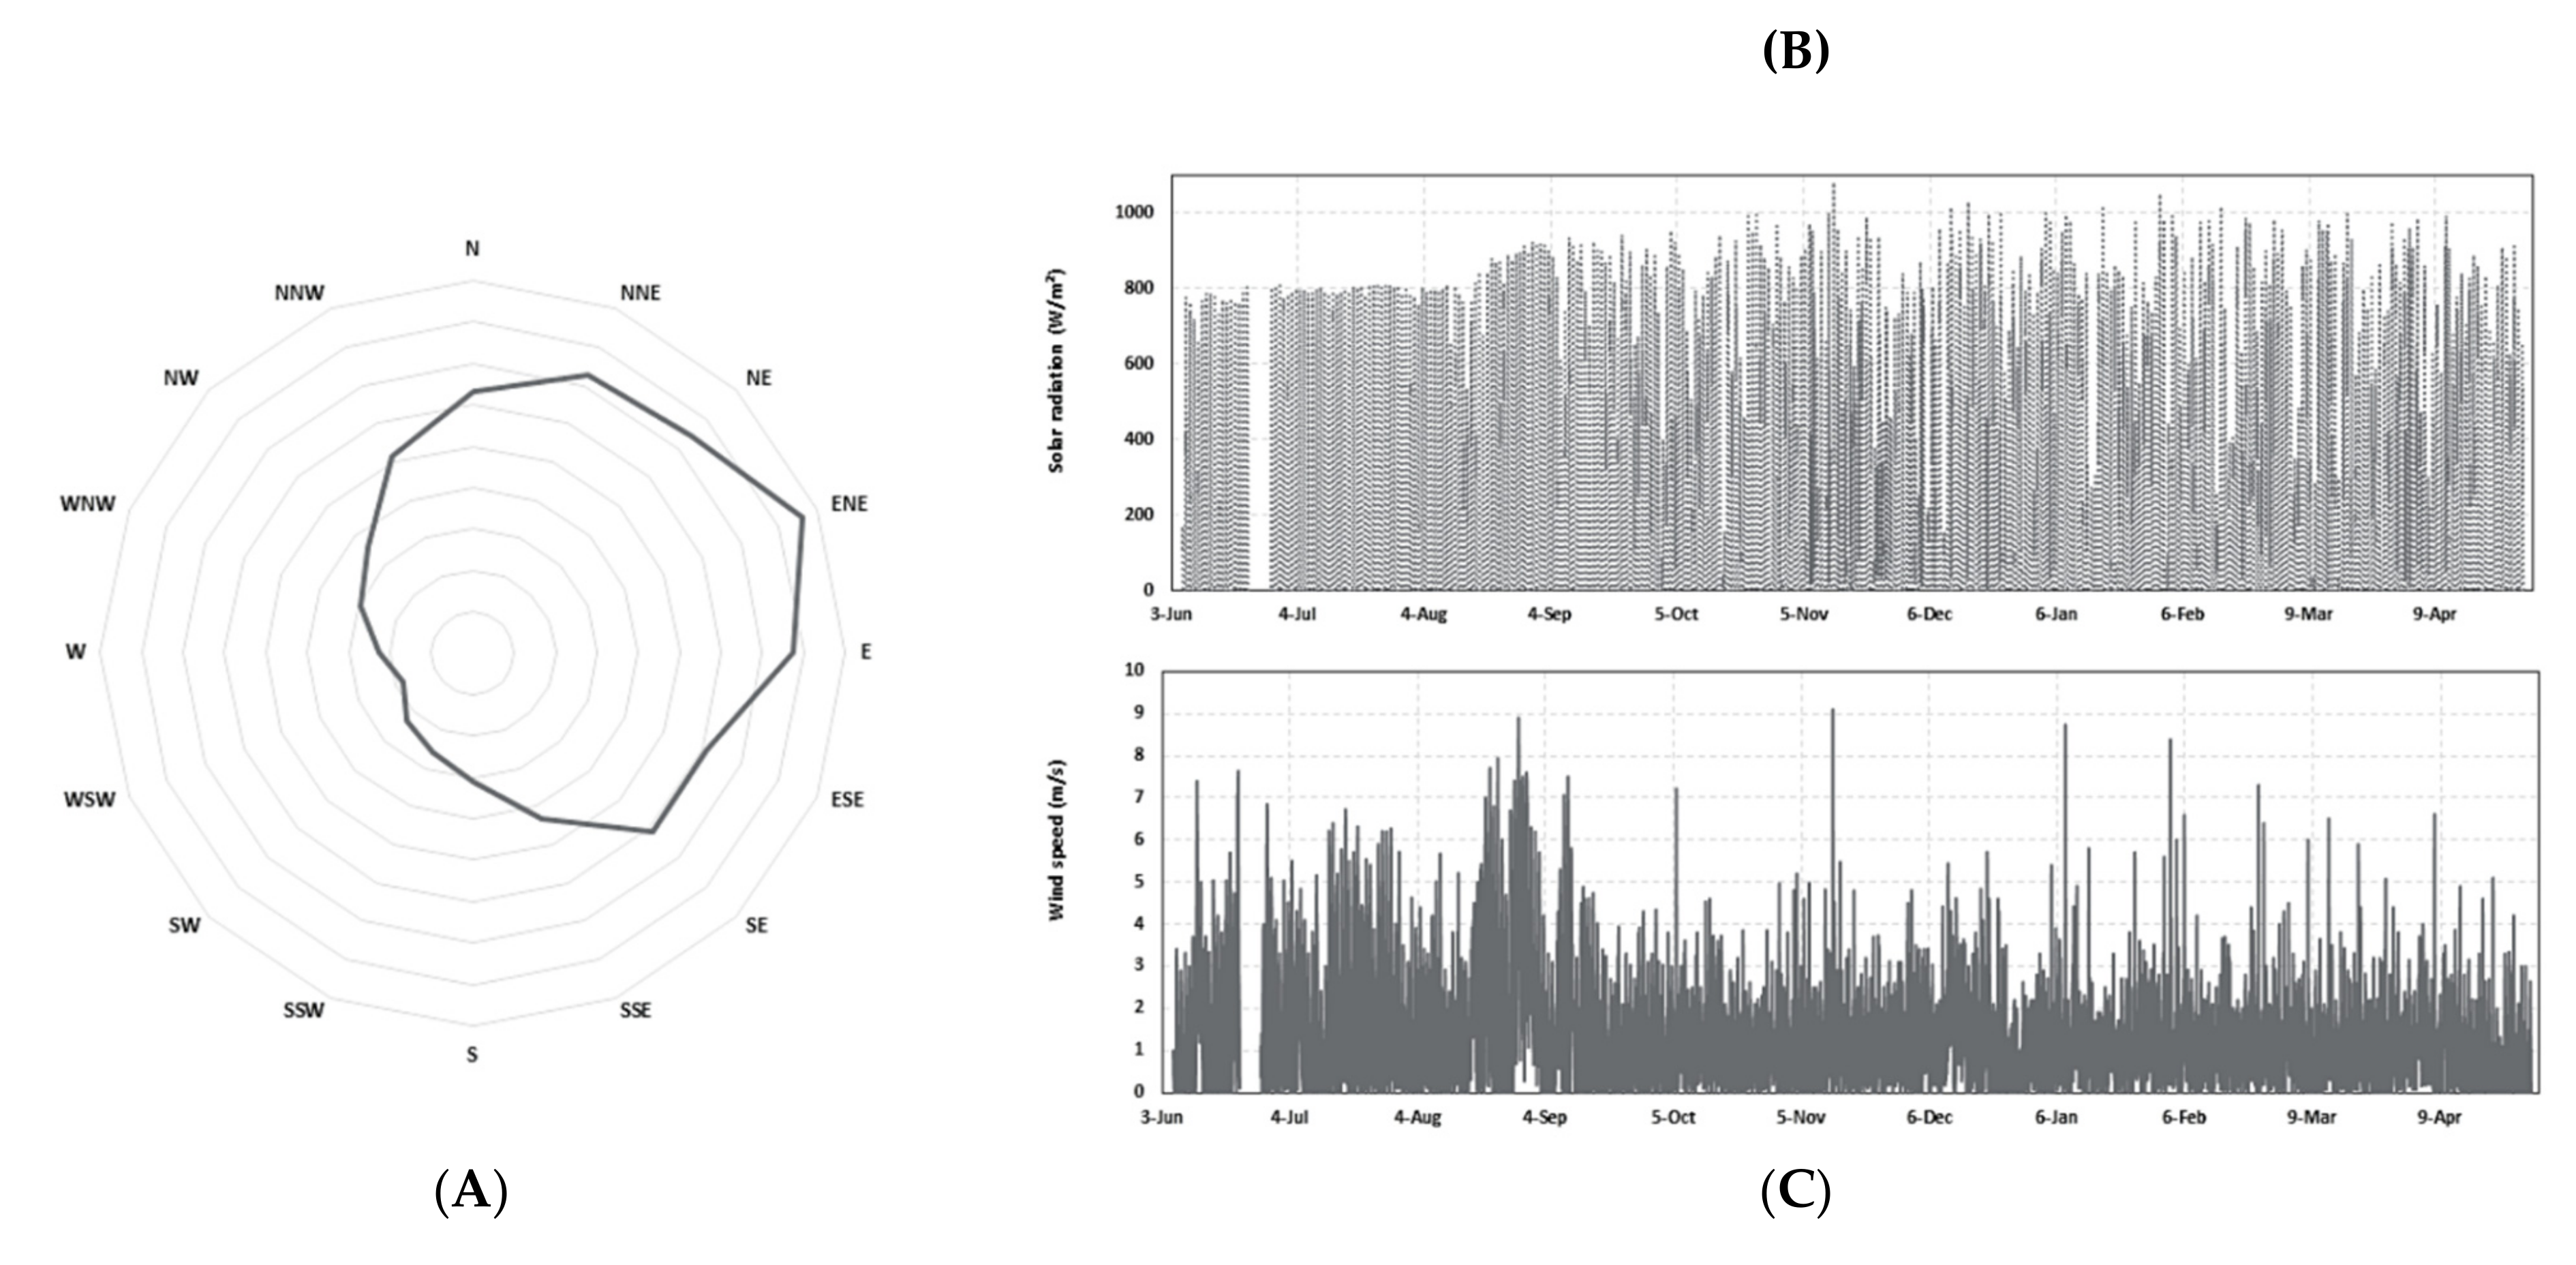
Figure 11.
Variation of external and internal temperature in cells C1 and C2 during one week of campaign 1 (shading of the glazed opening).
Figure 11.
Variation of external and internal temperature in cells C1 and C2 during one week of campaign 1 (shading of the glazed opening).
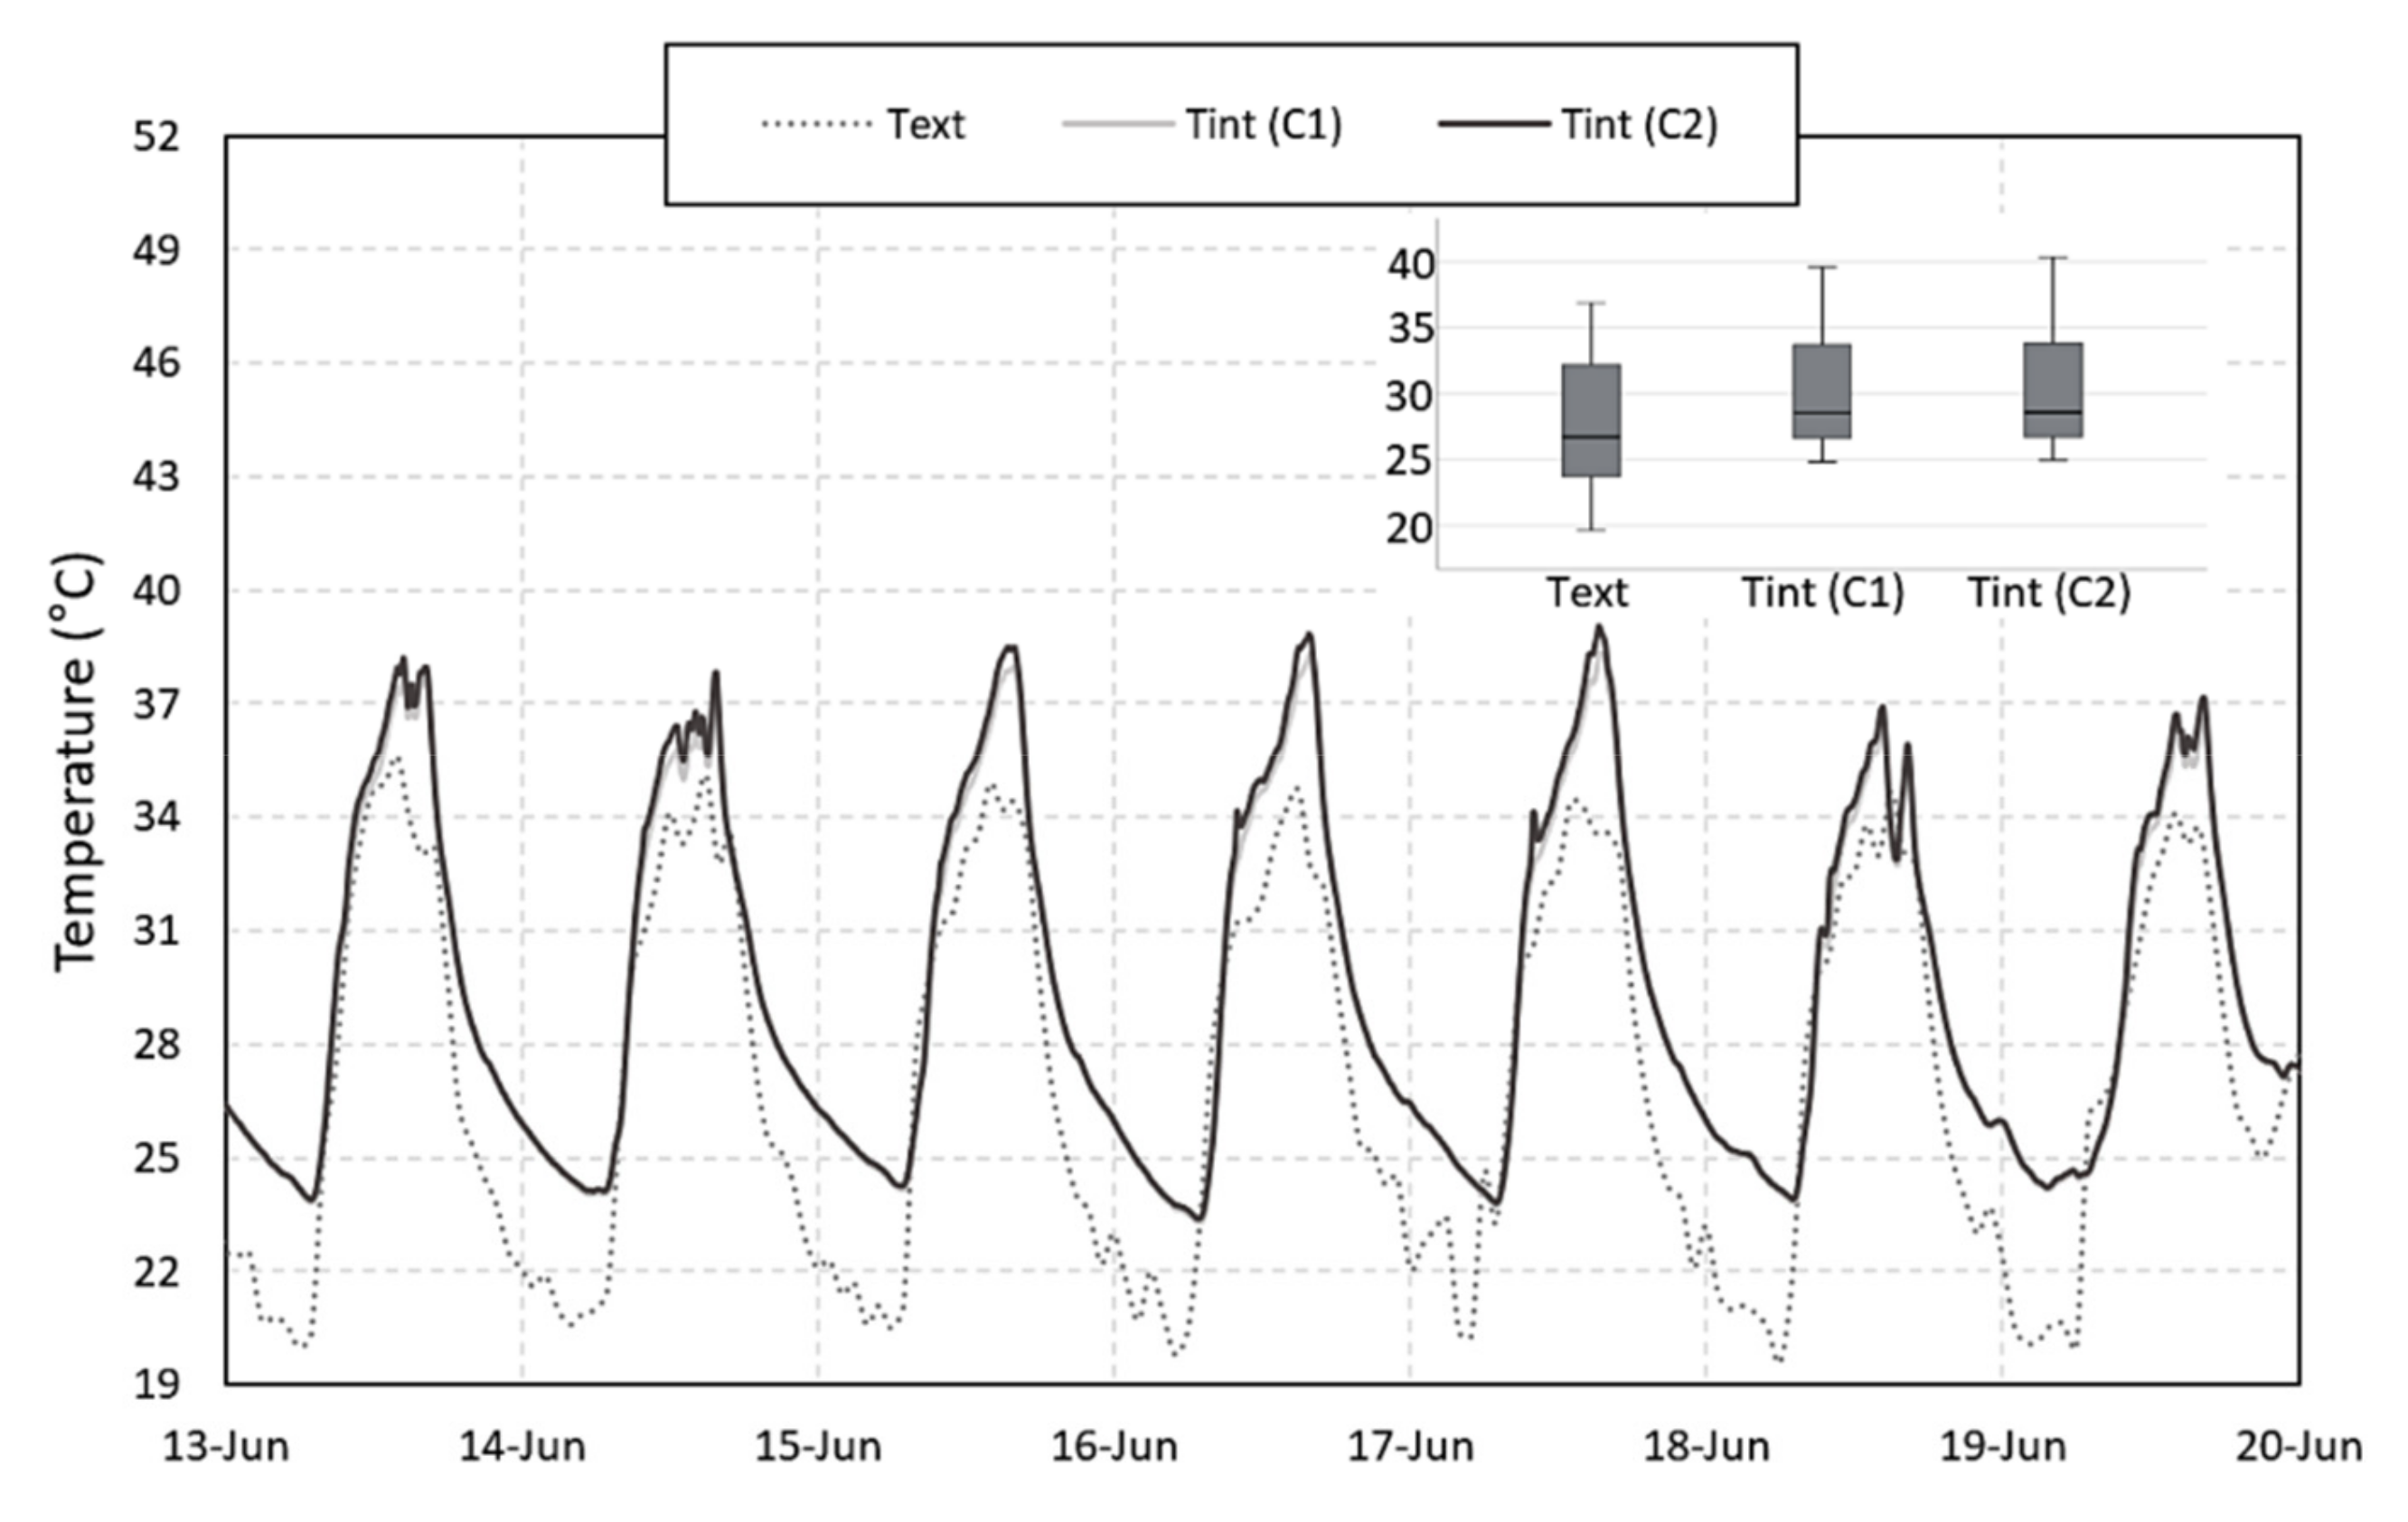
Figure 12.
Variation of external and internal temperature in cells C1 and C2 during one week of campaign 2 (application of a low-emissivity reflective film in the attic).
Figure 12.
Variation of external and internal temperature in cells C1 and C2 during one week of campaign 2 (application of a low-emissivity reflective film in the attic).

Figure 13.
Variation of external and internal temperature in cells C1 and C2 during one week of campaign 3 (natural cross ventilation by wind action).
Figure 13.
Variation of external and internal temperature in cells C1 and C2 during one week of campaign 3 (natural cross ventilation by wind action).
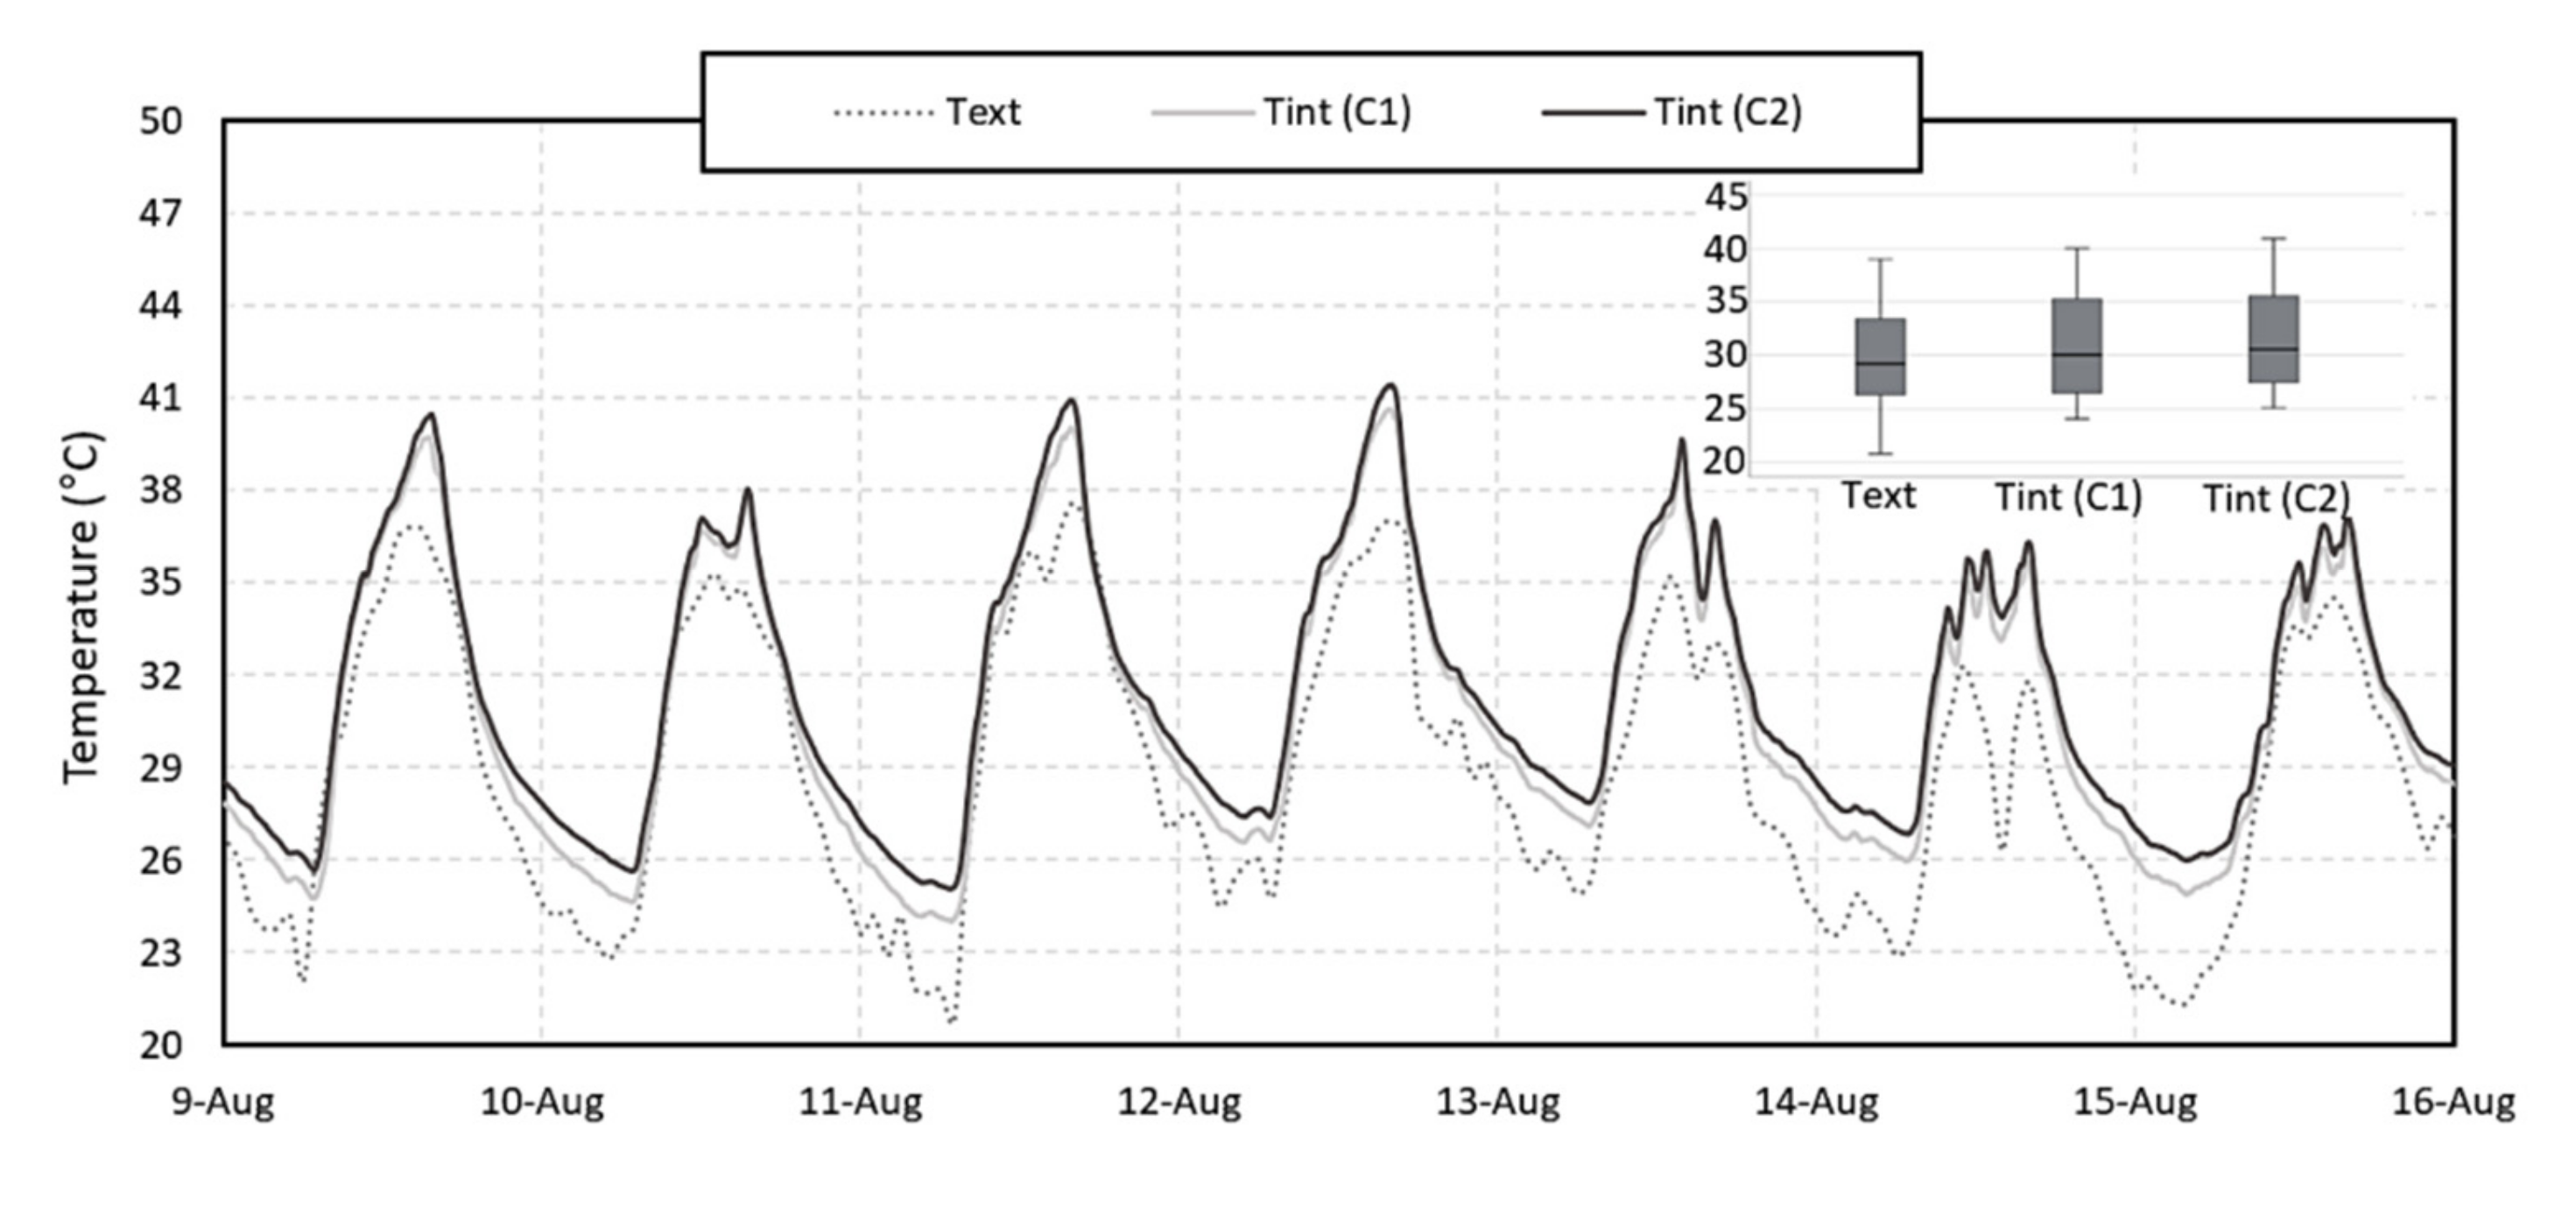
Figure 14.
Variation of external and internal temperature in cells C1 and C2 during one week of campaign 4 (painting the opaque envelope with reflective paint).
Figure 14.
Variation of external and internal temperature in cells C1 and C2 during one week of campaign 4 (painting the opaque envelope with reflective paint).
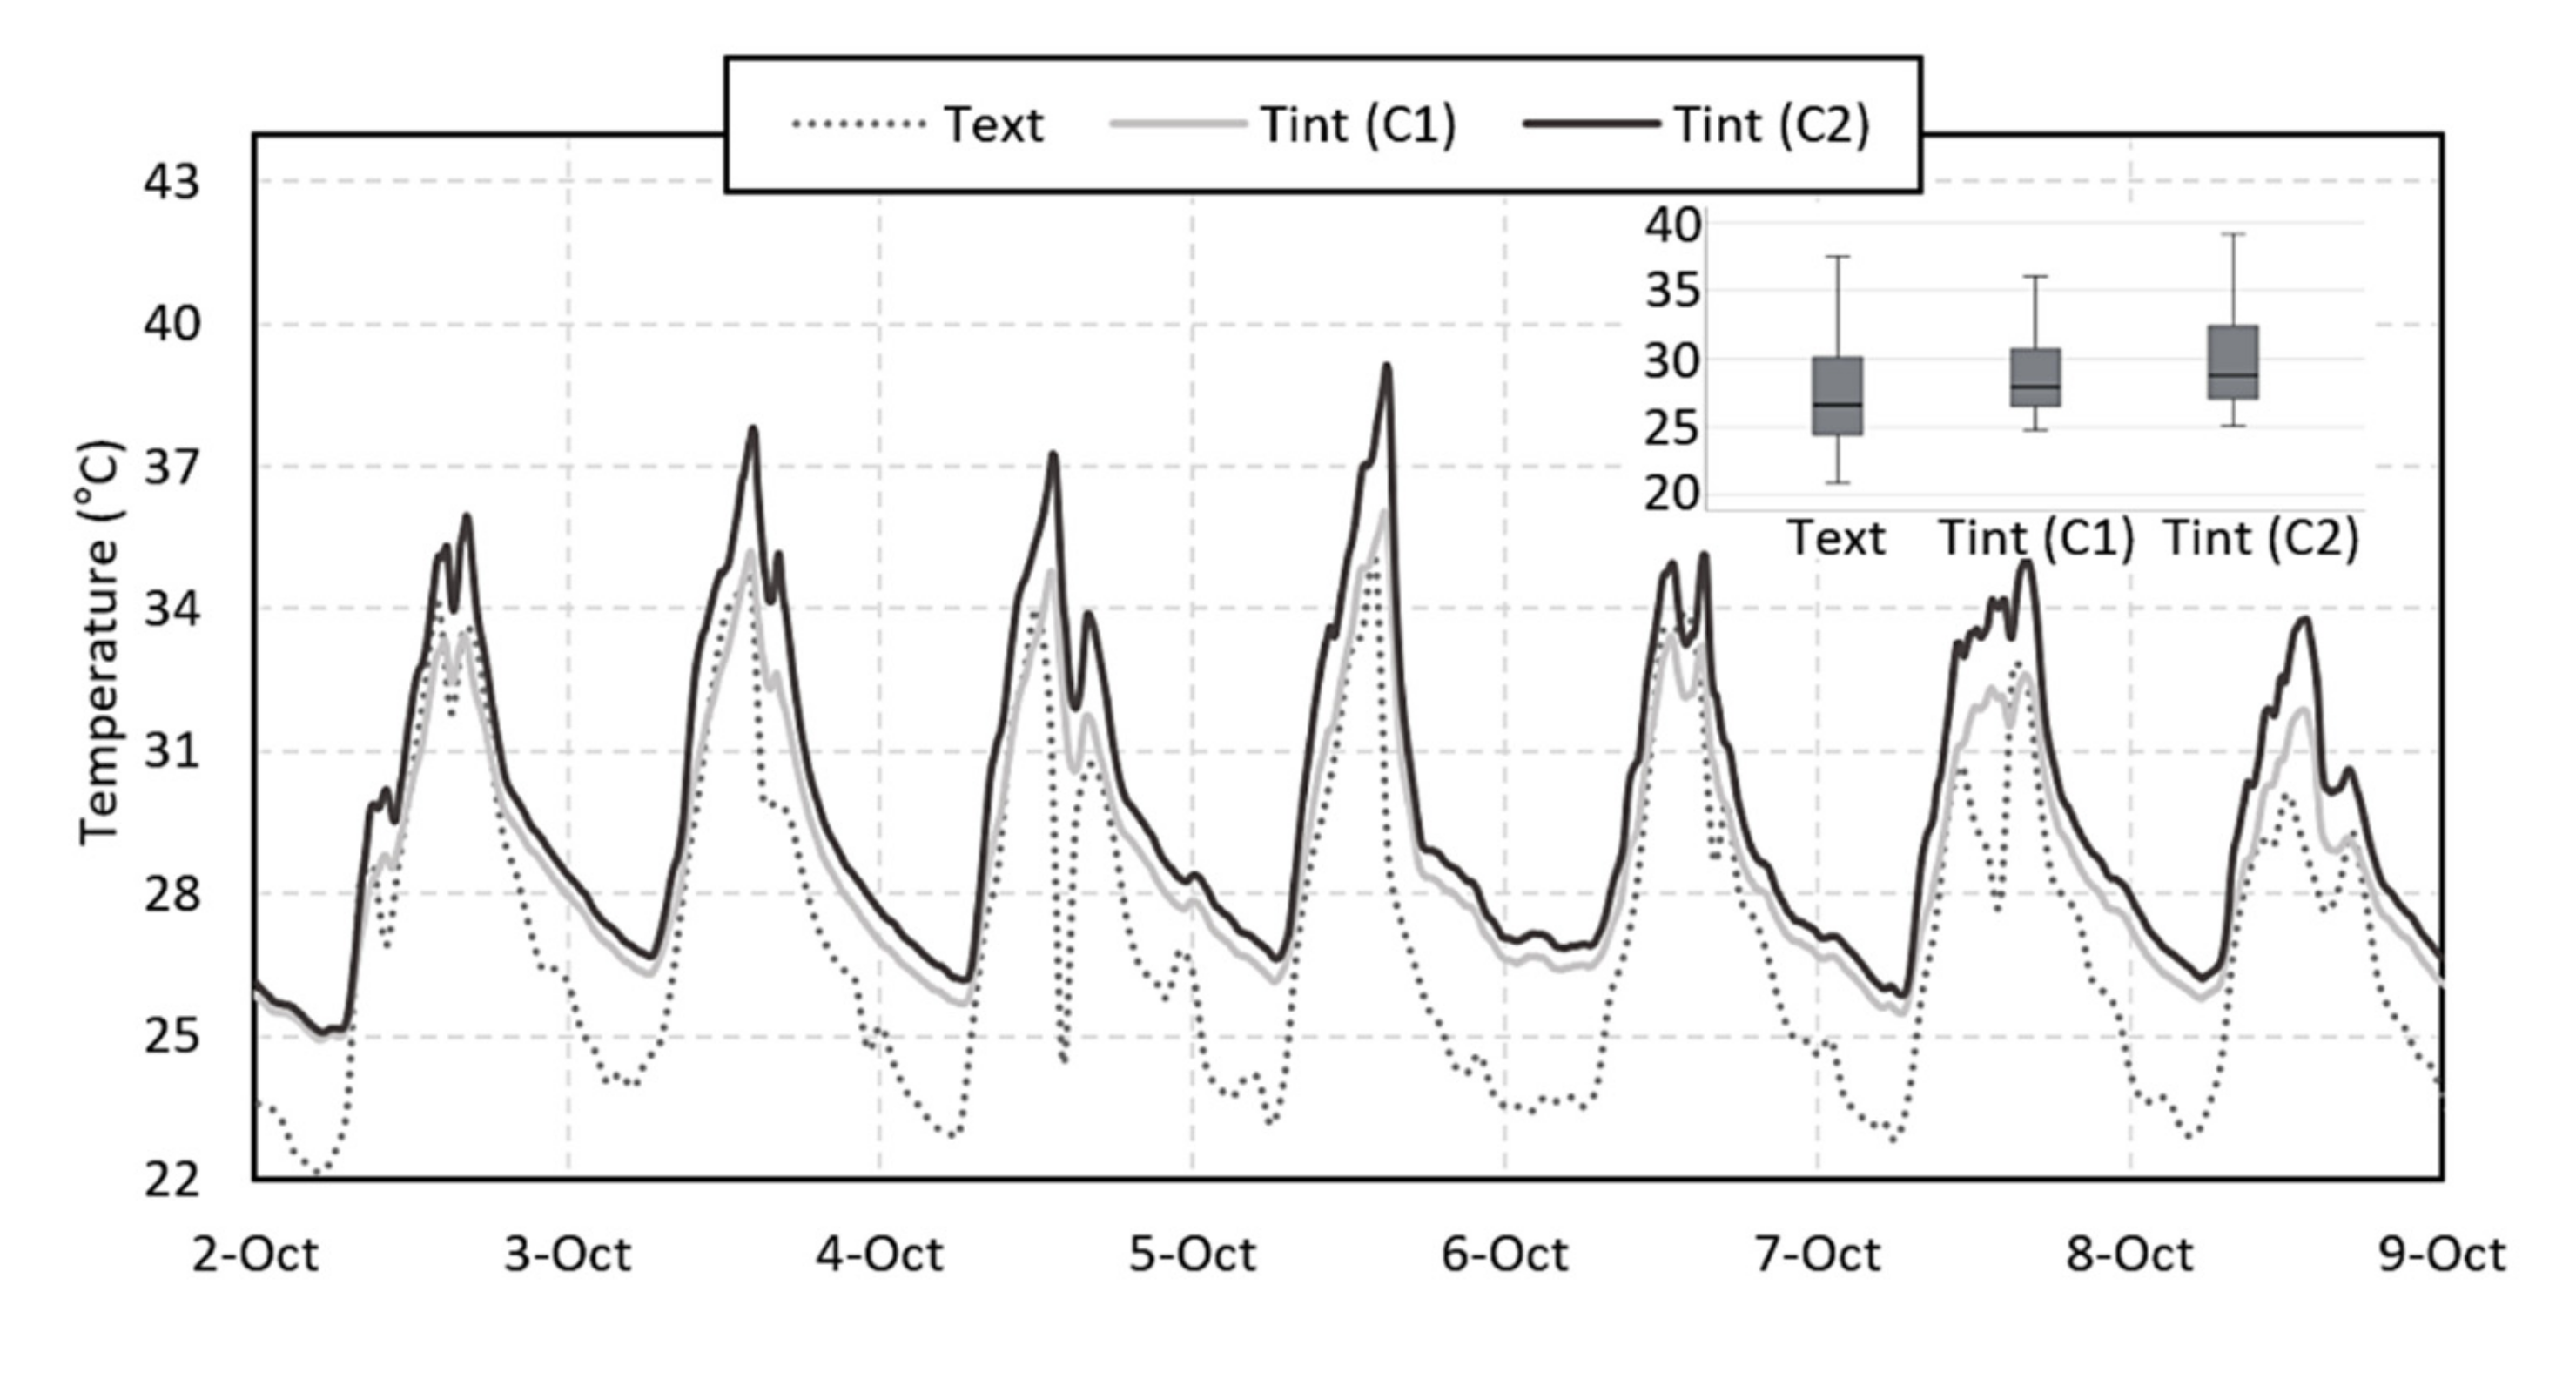
Figure 15.
Variation of external and internal temperature in cells C1 and C2 during one week of campaign 5 (painting of the opaque envelope with reflective paint and natural cross ventilation by wind action for 24 h).
Figure 15.
Variation of external and internal temperature in cells C1 and C2 during one week of campaign 5 (painting of the opaque envelope with reflective paint and natural cross ventilation by wind action for 24 h).

Figure 16.
Variation of external and internal temperature in cells C1 and C2 during one week of campaign 6 (painting of the opaque envelope with reflective paint and natural cross ventilation by wind action during the night period).
Figure 16.
Variation of external and internal temperature in cells C1 and C2 during one week of campaign 6 (painting of the opaque envelope with reflective paint and natural cross ventilation by wind action during the night period).
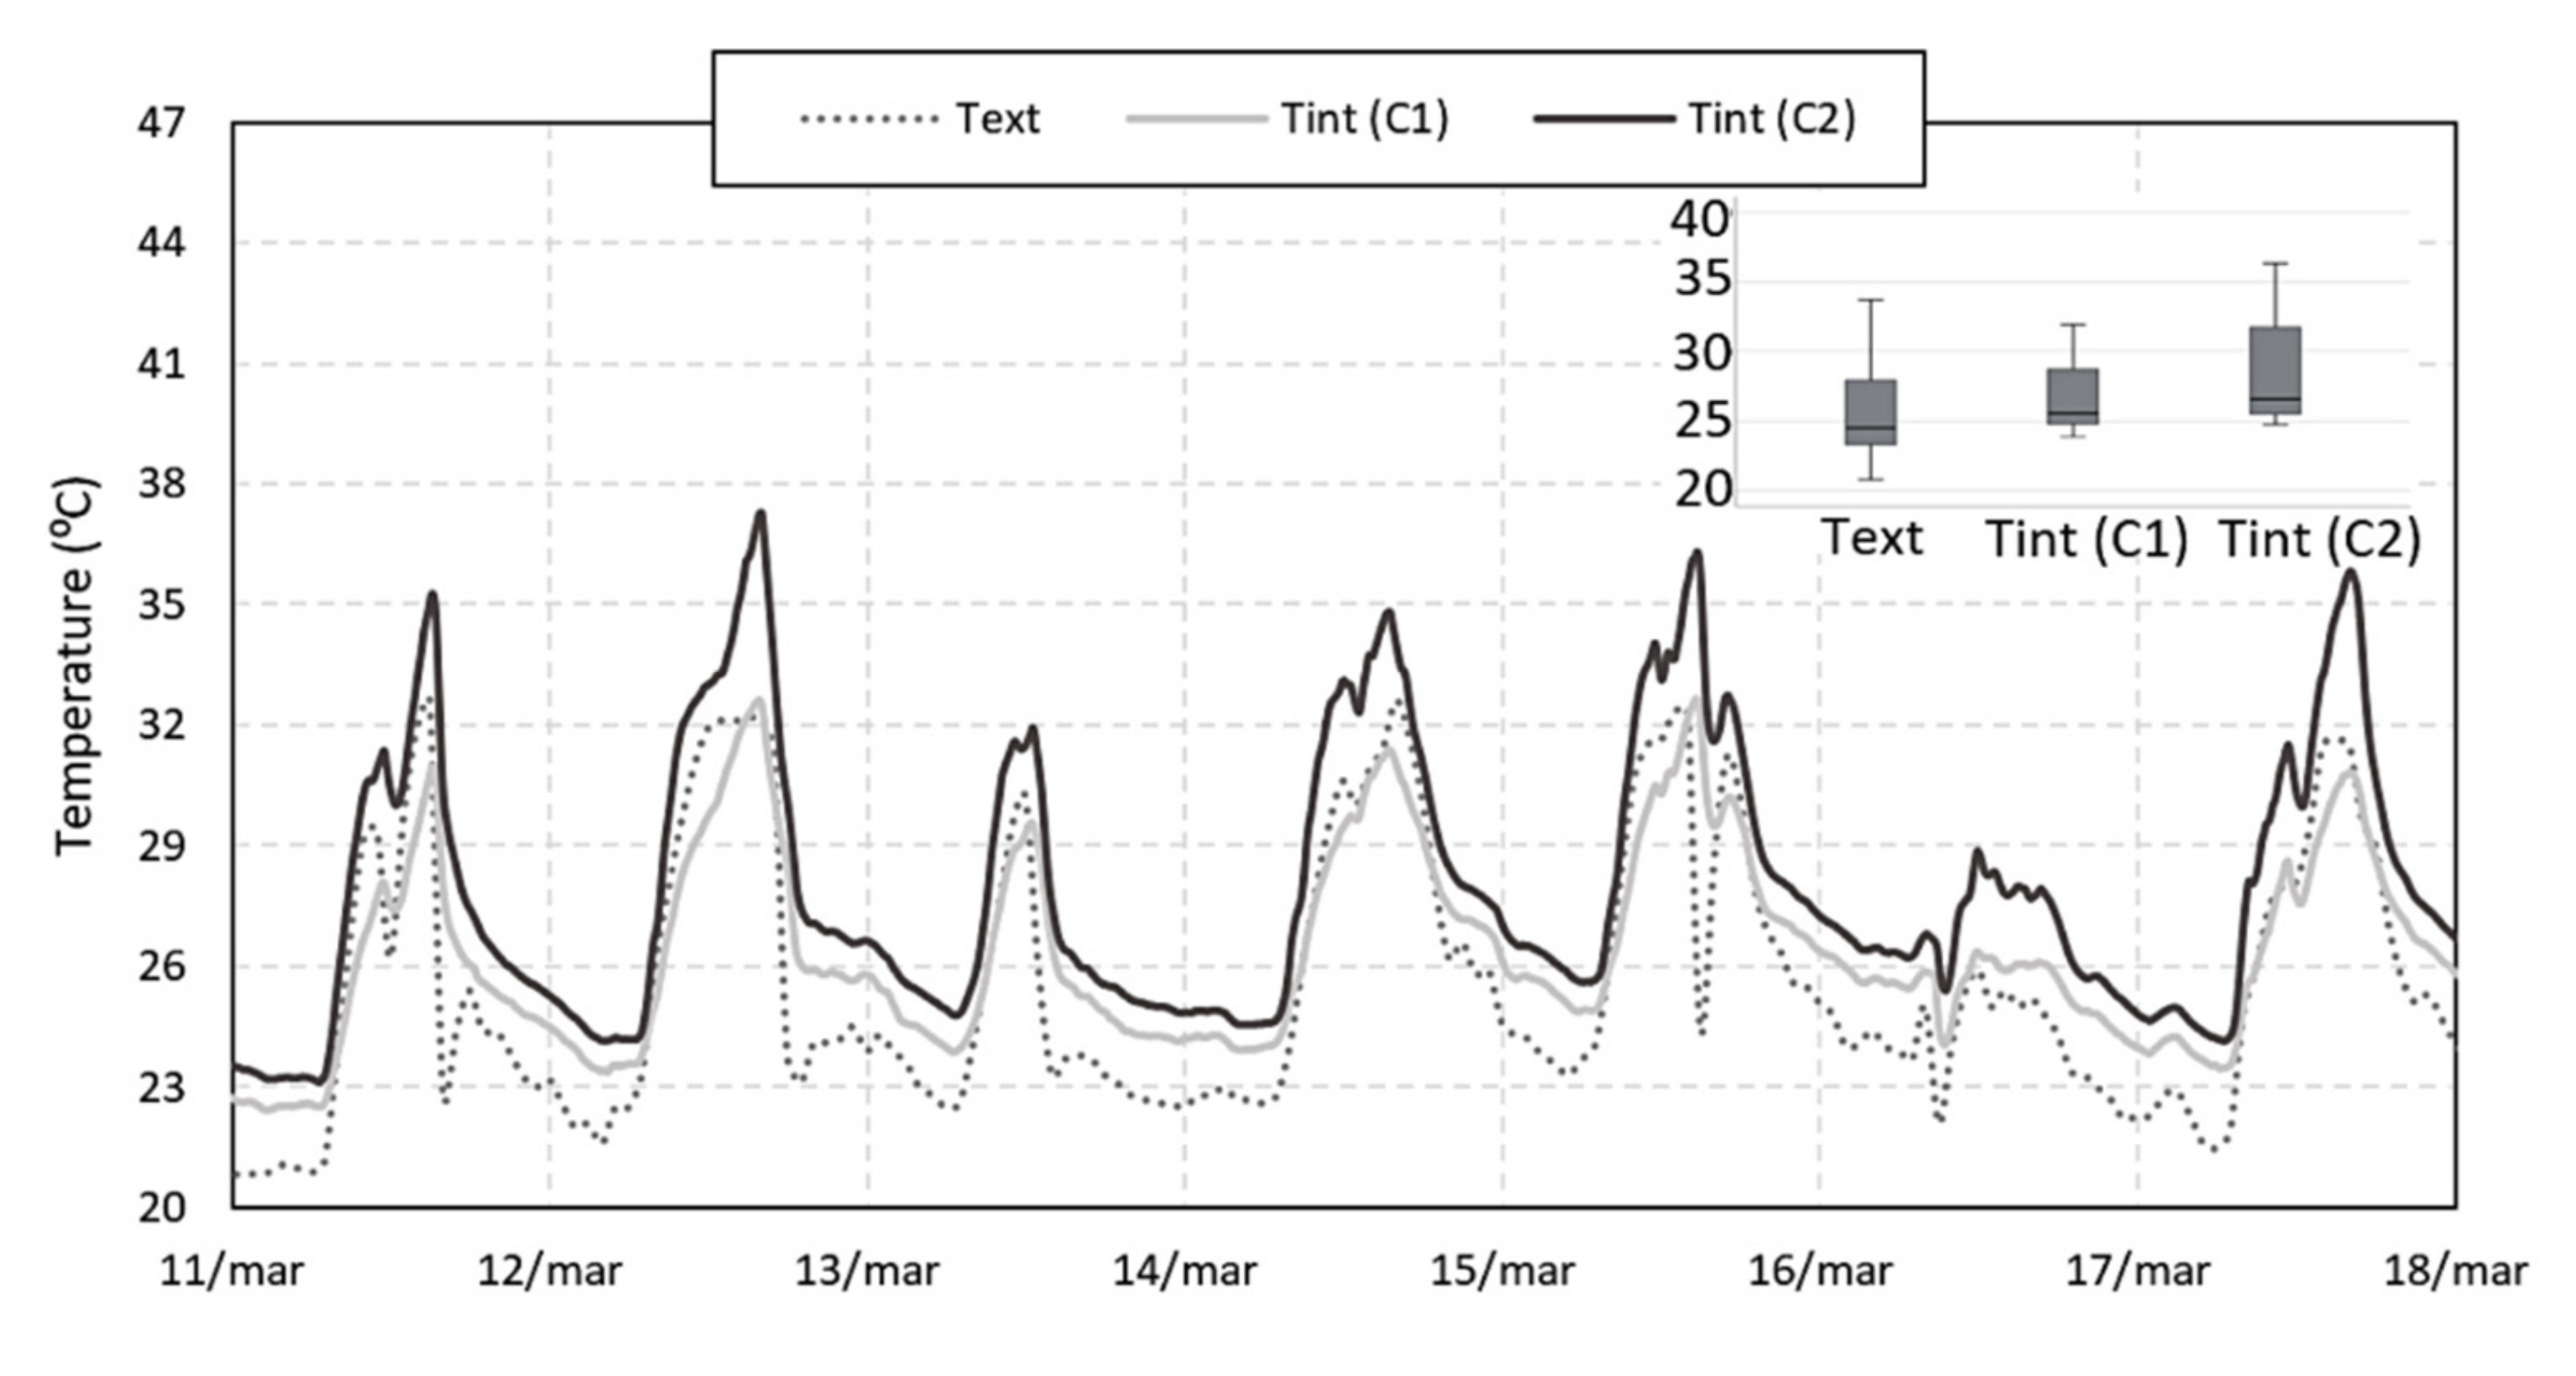
Figure 17.
External and internal temperature variation in cells C1 and C2 during one week of campaign 7 (opaque envelope with reflective painting and natural ventilation by chimney effect for 24 h).
Figure 17.
External and internal temperature variation in cells C1 and C2 during one week of campaign 7 (opaque envelope with reflective painting and natural ventilation by chimney effect for 24 h).

Table 1.
Thermal properties of the test cells.
| Thermal Resistance (m2 °C/W) | |
|---|---|
| Walls/Ceiling | 0.61 |
| Pitched Roof | 0.82 |
Table 2.
Measurement schedule.
| Campaign | Passive Cooling Techniques | Duration |
|---|---|---|
| Phase I | ||
| 1 | Shading of the glazed opening | 21 days |
| 2 | Application of low-emissivity reflective film in the attic | 21 days |
| 3 | Natural cross ventilation by wind action for 24 h | 21 days |
| 4 | Painting the opaque envelope with reflective paint | 28 days |
| Phase II | ||
| 5 | Painting of the opaque envelope with reflective paint and natural cross ventilation by wind action for 24 h | 10 days |
| 6 | Painting of the opaque envelope with reflective paint and natural cross ventilation by wind action during the night period | 14 days |
| 7 | Painting of the opaque envelope with reflective paint and natural ventilation by chimney effect for 24 h | 10 days |
Table 3.
Temperature differences between Cell 01 and Cell 02, in °C.
| Campaign | Passive Cooling Techniques | TAve, in °C | ||
|---|---|---|---|---|
| 24 h | Nigth | Daytime | ||
| Phase I | ||||
| 1 | Shading of the glazed opening | −0.2 | −0.0 | −0.2 |
| 2 | Application of low-emissivity reflective film in the attic | 0.2 | 0.2 | 0.3 |
| 3 | Natural cross ventilation by wind action for 24 h | −0.6 | −0.8 | −0.5 |
| 4 | Painting the opaque envelope with reflective paint | −1.1 | −0.5 | −1.7 |
| Phase II | ||||
| 5 | Painting of the opaque envelope with reflective paint and natural cross ventilation by wind action for 24 h | −1.7 | −0.8 | −2.7 |
| 6 | Painting of the opaque envelope with reflective paint and natural cross ventilation by wind action during the night period | −1.6 | −0.9 | −2.8 |
| 7 | Painting of the opaque envelope with reflective paint and natural ventilation by chimney effect for 24 h | −1.8 | −0.8 | −3.1 |
Publisher’s Note: MDPI stays neutral with regard to jurisdictional claims in published maps and institutional affiliations. |
© 2022 by the authors. Licensee MDPI, Basel, Switzerland. This article is an open access article distributed under the terms and conditions of the Creative Commons Attribution (CC BY) license (https://creativecommons.org/licenses/by/4.0/).
Share and Cite
MDPI and ACS Style
Marcolini, M.; Almeida, R.M.S.F.; Barreira, E. Evaluation of the Effect of Passive Cooling Techniques on Thermal Comfort Using Test Cells in the Northern Region of Brazil. Appl. Sci. 2022, 12, 1546. https://doi.org/10.3390/app12031546
AMA Style
Marcolini M, Almeida RMSF, Barreira E. Evaluation of the Effect of Passive Cooling Techniques on Thermal Comfort Using Test Cells in the Northern Region of Brazil. Applied Sciences. 2022; 12(3):1546. https://doi.org/10.3390/app12031546
Chicago/Turabian StyleMarcolini, Murilo, Ricardo M. S. F. Almeida, and Eva Barreira. 2022. "Evaluation of the Effect of Passive Cooling Techniques on Thermal Comfort Using Test Cells in the Northern Region of Brazil" Applied Sciences 12, no. 3: 1546. https://doi.org/10.3390/app12031546
Note that from the first issue of 2016, this journal uses article numbers instead of page numbers. See further details here.