Article

Implementing a GIS-Based Digital Atlas of Agricultural Plastics to Reduce Their Environmental Footprint; Part I: A Deductive Approach

1
School of Agriculture, Forest, Food and Environmental Sciences—SAFE, University of Basilicata, Via dell’Ateneo Lucano, n. 10, 85100 Potenza, Italy
2
DISAAT Department of Agricultural and Environmental Science, University of Bari, Via Amendola, n. 165/a, 70126 Bari, Italy
*
Author to whom correspondence should be addressed.
Appl. Sci. 2022, 12(3), 1330; https://doi.org/10.3390/app12031330
Submission received: 29 December 2021 / Revised: 24 January 2022 / Accepted: 25 January 2022 / Published: 26 January 2022
(This article belongs to the Special Issue Reducing the Plastic Footprint of Agriculture)

Abstract

:
The agricultural sector has benefitted over the last century from several factors that have led to an exponential increase in its productive efficiency. The increasing use of new materials, such as plastics, has been one of the most important factors, as they have allowed for increased production in a simpler and more economical way. Various polymer types are used in different phases of the agricultural production cycle, but when their use is incorrectly managed, it can lead to different environmental impacts. In this study, an applied and simplified methodology to manage agricultural plastics monitoring and planning is proposed. The techniques used are based on quantification through the use of different datasets (orthophotos and satellite images) of the areas covered by plastics used for crop protection. The study area chosen is a part of the Ionian Coast of Southern Italy, which includes the most important municipalities of the Basilicata Region for fruit and vegetable production. The use of geographical techniques and observation methodologies, developed in an open-source GIS environment, enabled accurate location of about 2000 hectares of agricultural land covered by plastics, as well as identification of the areas most susceptible to the accumulation of plastic waste. The techniques and the model implemented, due to its simplicity of use and reliability, can be applied by different local authorities in order to realize an Atlas of agricultural plastics, which would be applied for continuous monitoring, thereby enabling the upscaling of future social and ecological impact assessments, identification of new policy impacts, market searches, etc.

1. Introduction

In recent decades, agricultural production has significantly improved, thanks to the increase in land use for agricultural activities to feed growing populations, as well as to the implementation of new technologies [1]. However, it has also increased the impacts on the rural environment, as well as on the natural cycles of the ecosystem [2]. Among the most important of these factors, there is the growing use of new materials such as plastics, which allow for more efficient, easier, and cheaper agricultural productions. Polymers are employed in agriculture in several possible applications, from irrigation (pipes, tubes) to silage, crates, ropes, containers of chemicals for plant protection, etc. One of the most efficient applications is the use of plastic materials for crop protection, aimed to protect cultivations through the use of covers placed over plants while they are growing. The cover provides protection from adverse climatic factors, while at the same time increases yield and/or extends cropping season. In this sense, plastic covers can play a passive effect—protecting the crops from negative weather conditions, dust, animals, birds, insects, etc.—and, at the same time, an active effect, by exploiting solar radiation and realizing a more favorable environment for the cultivations. Plastic films are widespread for covering greenhouses, low and medium tunnels, and for soil mulching. Shading nets for greenhouses, or nets for the modification of the microenvironment, or for protection against hail and wind, are employed for a large variety of crops (horticulture, vineyards, orchards). Films and nets are also used in joint combination for the protection against virus-vector insects and birds as standalone cover or in connection with structures for the growing of horticultural and arboreal cultivations [3,4,5]. According to the most recent data, the consumption of plastics in agriculture has reached 1.7 million tons in 2017 in the EU [6], distributed mainly between greenhouse and tunnel films, nets, and mulch films.
However, the use of plastics in agriculture generates serious environmental problems, such as those related to the mismanagement of large amounts of post-consumer material. Frequent plastic replacement generates large amounts of post-consumer materials [7]. For example, in the Mediterranean area, the lifetime of greenhouse plastic films varies from 3–6 months, for one cultivation season, to a maximum of 3–4 years depending mainly on material thickness and chemical additives [8]. This results in possible release of macro-, micro-, and nano-plastics in agricultural soil, surface and deep waters, air, crops, etc. In particular, microplastics are at the attention of scientists, because their presence and impact on the agroecosystems is not yet well understood and standards for quantification are still being studied [9,10]. Many of these accumulations are due to Agricultural Plastic Waste (APW) which is often mismanaged—as it is improperly abandoned in landfills. APW is sometimes also illegally disposed of, since it is burned in open field, dumped along rivers or less-visible valley areas, or even buried in the agricultural soil. This inappropriate management of agricultural plastic waste produces huge environmental and economic problems, such as degradation of the ecosystem, soil and water contamination, release of toxic and air pollutants, contamination of foodstuffs, etc. [11].
This issue is now very much felt in the scientific community. In the Sustainable Development Goals (SDGs), many references to plastic pollution [12] and its effective use and reuse [13] are included. There are many alternatives to the use of plastics [14], but since it is still an experimental field, it is necessary to identify methodologies and practices for proper monitoring and management at local level. In this context, actions prior to post-use management of APW represent a key issue in order to implement sustainable planning methods for disposal and recycling.
Important support [15,16] can be provided by modern GIS (Geographic Information System) techniques, as they allow the integration of numerical databases, and field and remote-sensed data in order to quantify, organize, and analyze spatial data related to APW [17]. In the present paper, a first approach has been implemented, aimed at the realization of a digital Atlas of agricultural plastics in a study area, using in this phase a deductive approach, i.e., by analyzing and integrating different types of observed geodata (orthophotos, statistical data, and satellite data) concerning the location and quantification of Agricultural Plastic Surfaces (APSs) [18]. In this first approach, the areas (hectares) in which agricultural plastics are actually detected have been included in a GIS, in order to spatialize in a detailed and punctual way the distribution of APSs from different agricultural activities. The specific objective of this paper is, therefore, to provide an expeditious but simultaneously reliable methodology based on easy-to-use geospatial techniques, calibrated and verified in order to facilitate the realization of an Atlas of agricultural plastics at a larger (e.g., European) scale. Such an Atlas would be applied by authorities for planning continuous monitoring actions and sustainable management of APSs linked with agricultural activities. Indeed, the methodology is based on the combined use of semi-automatic classification based on satellite indices and manual classification by photo-interpretation of orthophotos, without making distinctions between the different types of plastics found. In addition, the density of the plastics has been spatialized within a grid, in order to provide a more immediate and easily manageable geo-visualization system.

2. Materials and Methods

2.1. Study Area

The study area includes some municipalities of the Basilicata Region (Southern Italy) that fall within the “Metapontino” agri-food district (Figure 1). It extends along the Ionian Sea, occupying the coastline for about 35 km. It includes eight municipalities: Bernalda; Montalbano Jonico; Nova Siri; Pisticci; Policoro; Rotondella; Scanzano Jonico, and Tursi.
The climate of the area is hot and semi-arid, with temperatures ranging from a minimum of about 5 °C in the coldest months to a maximum of over 40 °C in summer. Precipitation is less than 500 mm per year and is distributed mainly in the autumn–winter period. The vegetation is dominated by the presence of a widespread Mediterranean scrub as well as of pine forests of Mediterranean species [19]. This area has a higher population density than the regional average (74 inhabitants/km2 against 60 in the whole Basilicata region), with good employment indices. In fact, agriculture employs 26% of the active population; moreover, while representing 9.4% of the regional UAA (Utilized Agricultural Area), it produces more than 25% of the regional agricultural value added, with a value per hectare of EUR 2314. The agricultural workers, equal to 4432, represent 21% of the total; those in non-agricultural sectors are 16,659, while the number of conductors with non-farm remunerative activities represent about 31% of the total [19]. The level of education of farmers is also at the highest level in the region: around 24% have a university degree or high-school diploma. These data, referring to the last agricultural census carried out in 2010, are clearly improving. This area is also characterized by a vocation for tourism. In fact, most of the tourist infrastructure and hotel beds are concentrated here. The area is among the most dynamic in the agricultural sector: the value added produced is at high levels, both in terms of incidence on the regional total and on the agricultural area used [19]. The fruit and vegetable sector is the main agricultural activity in this district, this being one of the most important in southern Italy as well. Plastics are widely employed in this area, mostly for soil mulching, low/medium tunnel, greenhouse covers, or other kinds of crop-protection techniques (Figure 2). Therefore, this is an area where the problem of APW is relevant and needs to be addressed in an organized and standardized way. To this aim, for some years, the European Directive 2008/98/EC with the Waste Framework Directive (WFD) provides guidelines for the management and recycling of agricultural plastics. This directive obliges member states (leaving this to regional or local authorities) to implement specific waste management plans [20] in order to minimize the impact on the environment and human health. However, it is a matter of fact that—in this area, like in other agricultural locations in Italy—a systematic organization for the collection, transportation, and disposal of APW, unfortunately does not yet exist.
Table 1 represents the areas affected by vegetable crops, whose production cycle is linked to the massive use of plastics. Considering all the municipalities, the study area covers about 91,000 ha and represents almost 90% of the fruit and vegetable production in greenhouses or tunnels of the whole Region of Basilicata. The municipalities of Scanzano Jonico and Policoro alone account for more than 50% of the production.

2.2. Agricultural Plastic Surfaces (APS) Analysis

The present study stems from the need to quantify the surfaces (expressed in hectares) of agricultural land covered by plastic. Indeed, this is the starting point in all studies dealing with spatial quantification of APW [22]. The data currently present in Italy do not allow a precise and accurate quantification of plastics used in agriculture. Officially, there is no precise quantification of how much plastic is used by different farms and, especially, where it is spatially located and chronologically present. In addition, the official censuses [23], as well as providing data on a large scale (at most at the level of the municipality), provide data every ten years and are therefore too large for constant monitoring of the situation in the territories. Knowing data at the district or municipal level is useful at the general planning level, but for more specific actions, such as the location of a strategic plastics collection center, it is necessary to increase the detail of the identification as much as possible.
There are many techniques for quantifying agricultural plastic surfaces (APSs), but one of the most useful is spatial-data management provided by Geographic Information Systems (GIS). In particular, the use of satellite image classification exclusively or integrated with digital photointerpretation [24,25,26] is increasingly becoming the main component of rural land studies at the local level as well.
In this work, it was decided to use this integrated methodology to quantify the actual area covered by plastics as also proposed in other studies [18]. The first phase, through the classification of satellite images by means of specific spectral indices, enabled realization of a first quick and expeditious detection of the plastics, which were subsequently modified and integrated on the basis of orthophotos.
The year 2017 was chosen as the reference year because it is the year in which very-high-resolution orthophotos are freely available for the Basilicata Region [27]. All operations were performed with the open-source software QGIS.

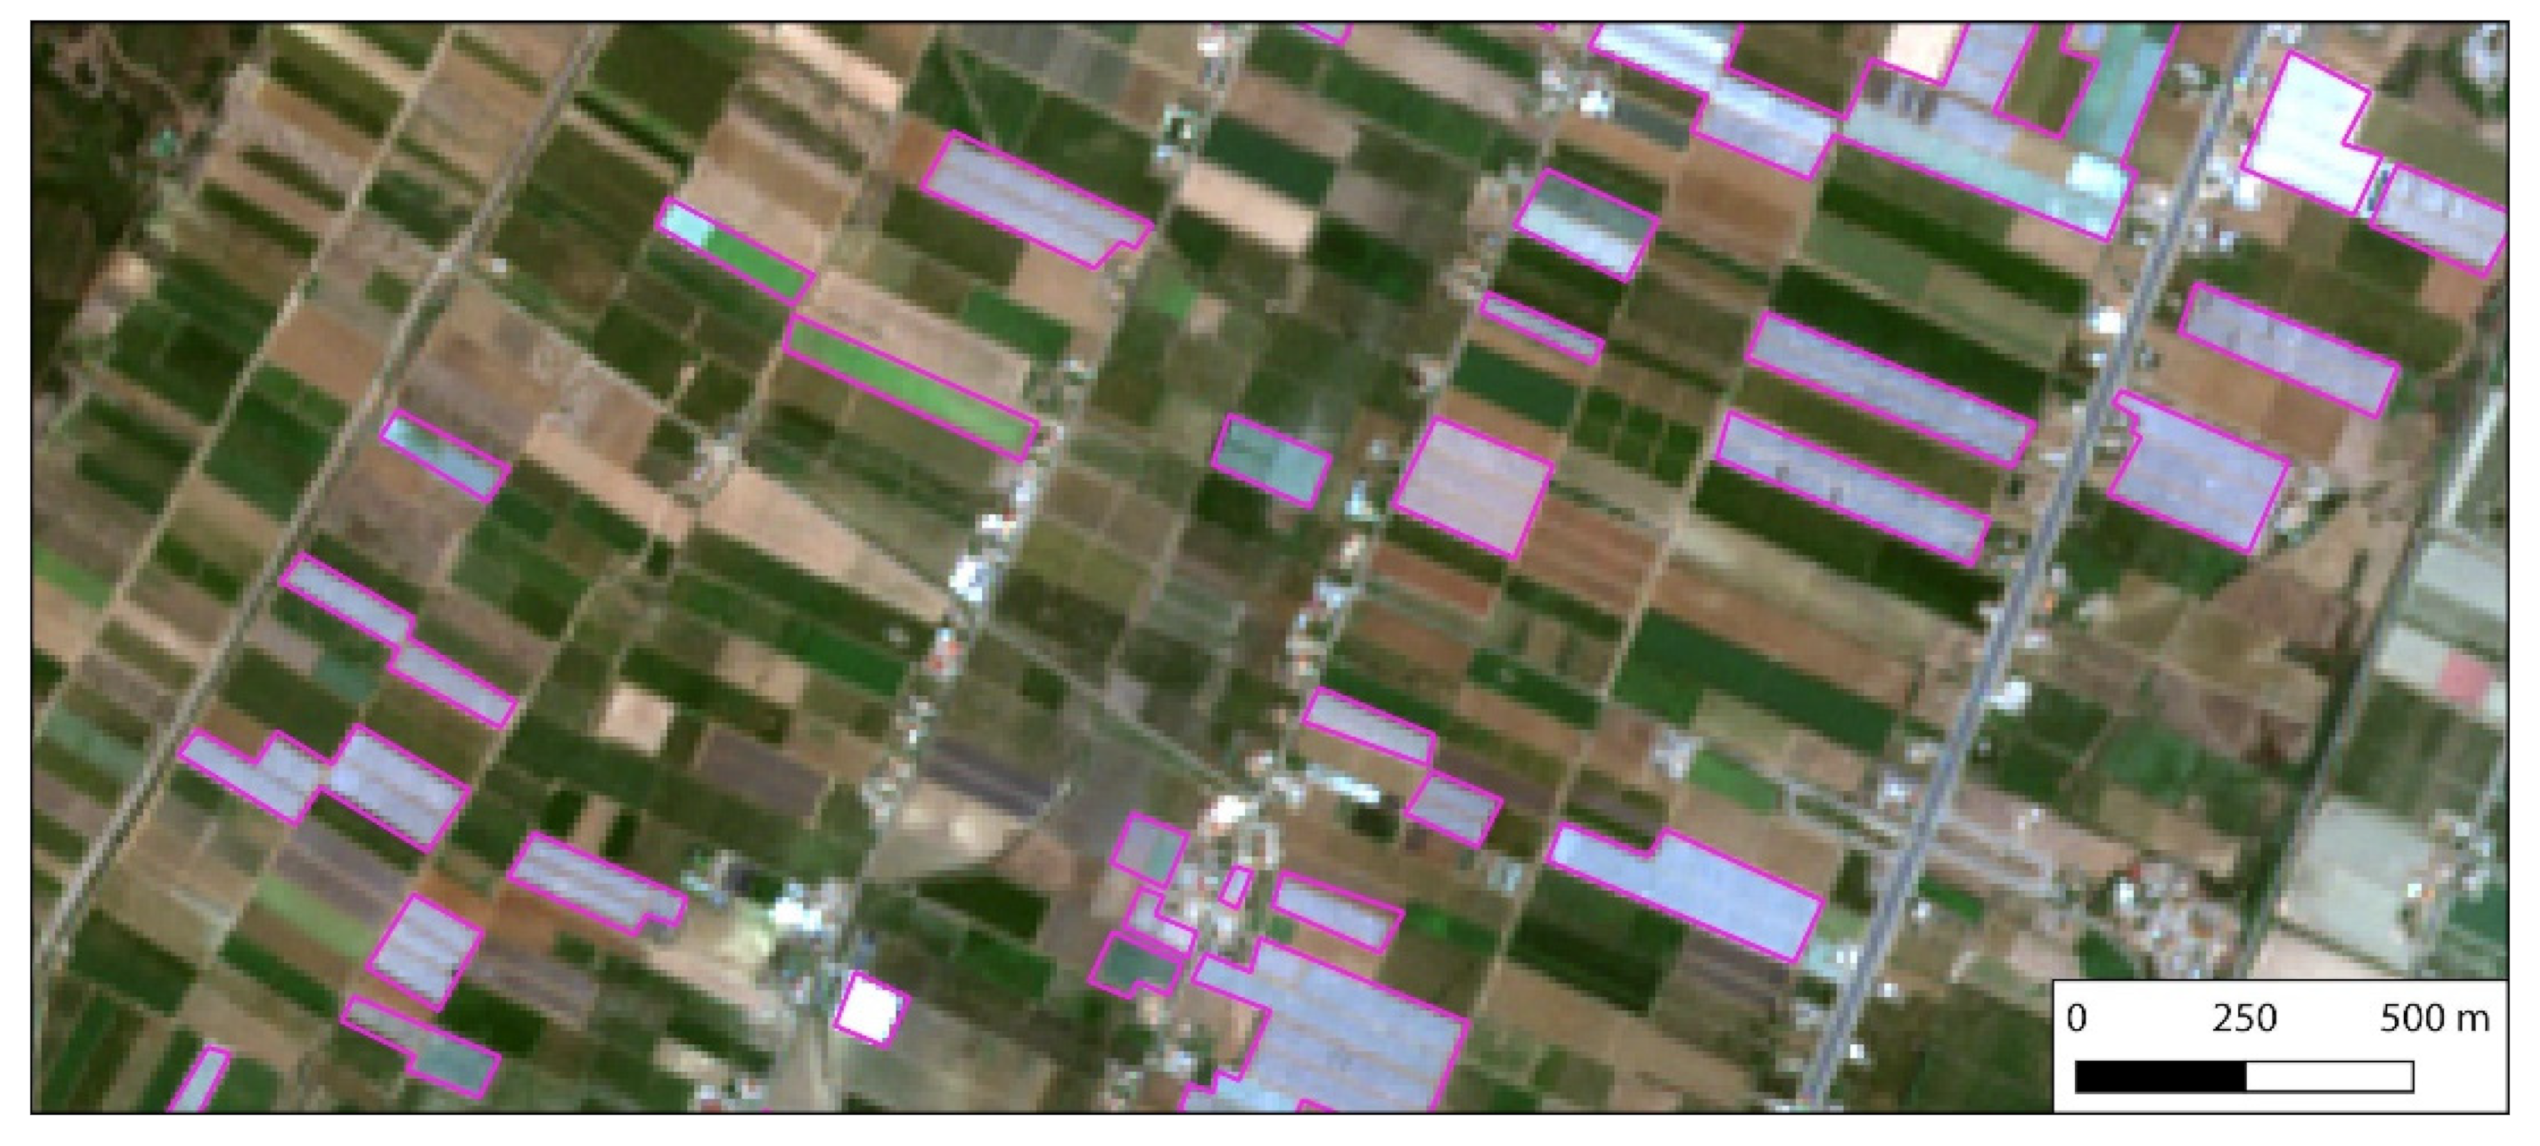
2.2.1. Satellite APS Localization

The use of satellite images has enabled a first rapid and accurate detection of APSs, so as to reduce the time of manual digitization on orthophotos. For high spatial, temporal, and spectral resolution, the freely downloadable online images of Sentinel-2 were chosen. Sentinel-2 is a mission developed by the European Space Agency (ESA) under the Copernicus program, for monitoring environment and territory, providing support in the management of natural disasters as well. It consists of two identical satellites, Sentinel-2A and Sentinel-2B, and it provides images from 2015. Given its versatility thanks to high revisit time, spectral, and spatial resolution, and free availability of images [28], the Sentinel-2 mission can be also widely used for APS detection. For example, there are several works showing the efficiency of using these images for the detection of plastics in agriculture based on different techniques and indices [29,30]. In this work, only the B2, B3, B4, and B8 bands of the Sentinel-2A satellite were used. These bands all have a spatial resolution of 10 m and the central wavelengths (λ) measure, respectively, of 492.4 nm, 559.8 nm, 664.6 nm, and 832.8 nm.
There are many applications that use complex algorithms for semi-automatic detection of APSs. In fact, it is possible to find different works in the literature where different algorithms are implemented with high degrees of accuracy [31,32]. However, these techniques often require very high scientific skills that are hardly found in local authorities.
Satellite images were downloaded through the Theia system, which provides ortho-rectified surface reflectance images after atmospheric correction. Two images (9 and 26 July 2017) were used to verify the presence of plastic films, avoiding errors due to the temporary absence of greenhouse cover.
For the present study, it was chosen to test a Retroprogressive Plastic Greenhouse Index (RPGI) proposed by Yang et al. [33] that can be useful for a more immediate and expeditious methodology. At the same time, this can provide useful data to make a first (but not complete) screening of areas with APSs. RPGI is an index that provides a binary classification (presence, absence of greenhouse plastics) and is very dependent on the vegetation under plastic, since it is higher when crops within the greenhouse are thriving. Indeed, the RPGI (Equation (1)) was calculated for areas where Normalized Difference Vegetation Index (Equation (2)) is less than 0.73 (Figure 3) as reported by the authors [33] and in other studies [28]. The values B2, B3, B4, and B8 of Equations (1) and (2) have been previously stated.
R P G I = B 2 1 m e a n ( B 4 + B 3 + B 8 )
N D V I = B 8 B 4 B 8 + B 4
The RPGI index provides a good detection of greenhouse plastic covers after having identified graphically the most functional threshold. This index is widely used, although limitations do not allow exclusive use [30,34]. Indeed, it provides very low or negative values when the greenhouses are colored white during the summer.
Therefore, the RPGI index was applied to both images in order to provide a wider time span to the analysis. The final result was combined in a single remote-sensed dataset that was used as the basis for subsequent operations. To reduce errors, all non-agricultural areas in the index were excluded. This was possible by using an ancillary dataset, which is that of the 2013 Nature Map [35] that provides an accurate classification of the territory.
In this paper, the RPGI index was used to verify its effectiveness in an initial expeditious assessment of APSs. In the end, for a general assessment of accuracy, it was compared to the final result obtained from the integrative mapping performed through the methodology applied in Section 2.2.2. In this way, it was possible to compare the classification obtained with the RPGI index and the real APS detection from the visual interpretation of orthophotos and to obtain a percentage value of accuracy. In addition to the overall accuracy in percentage, errors due to false detection were also calculated.

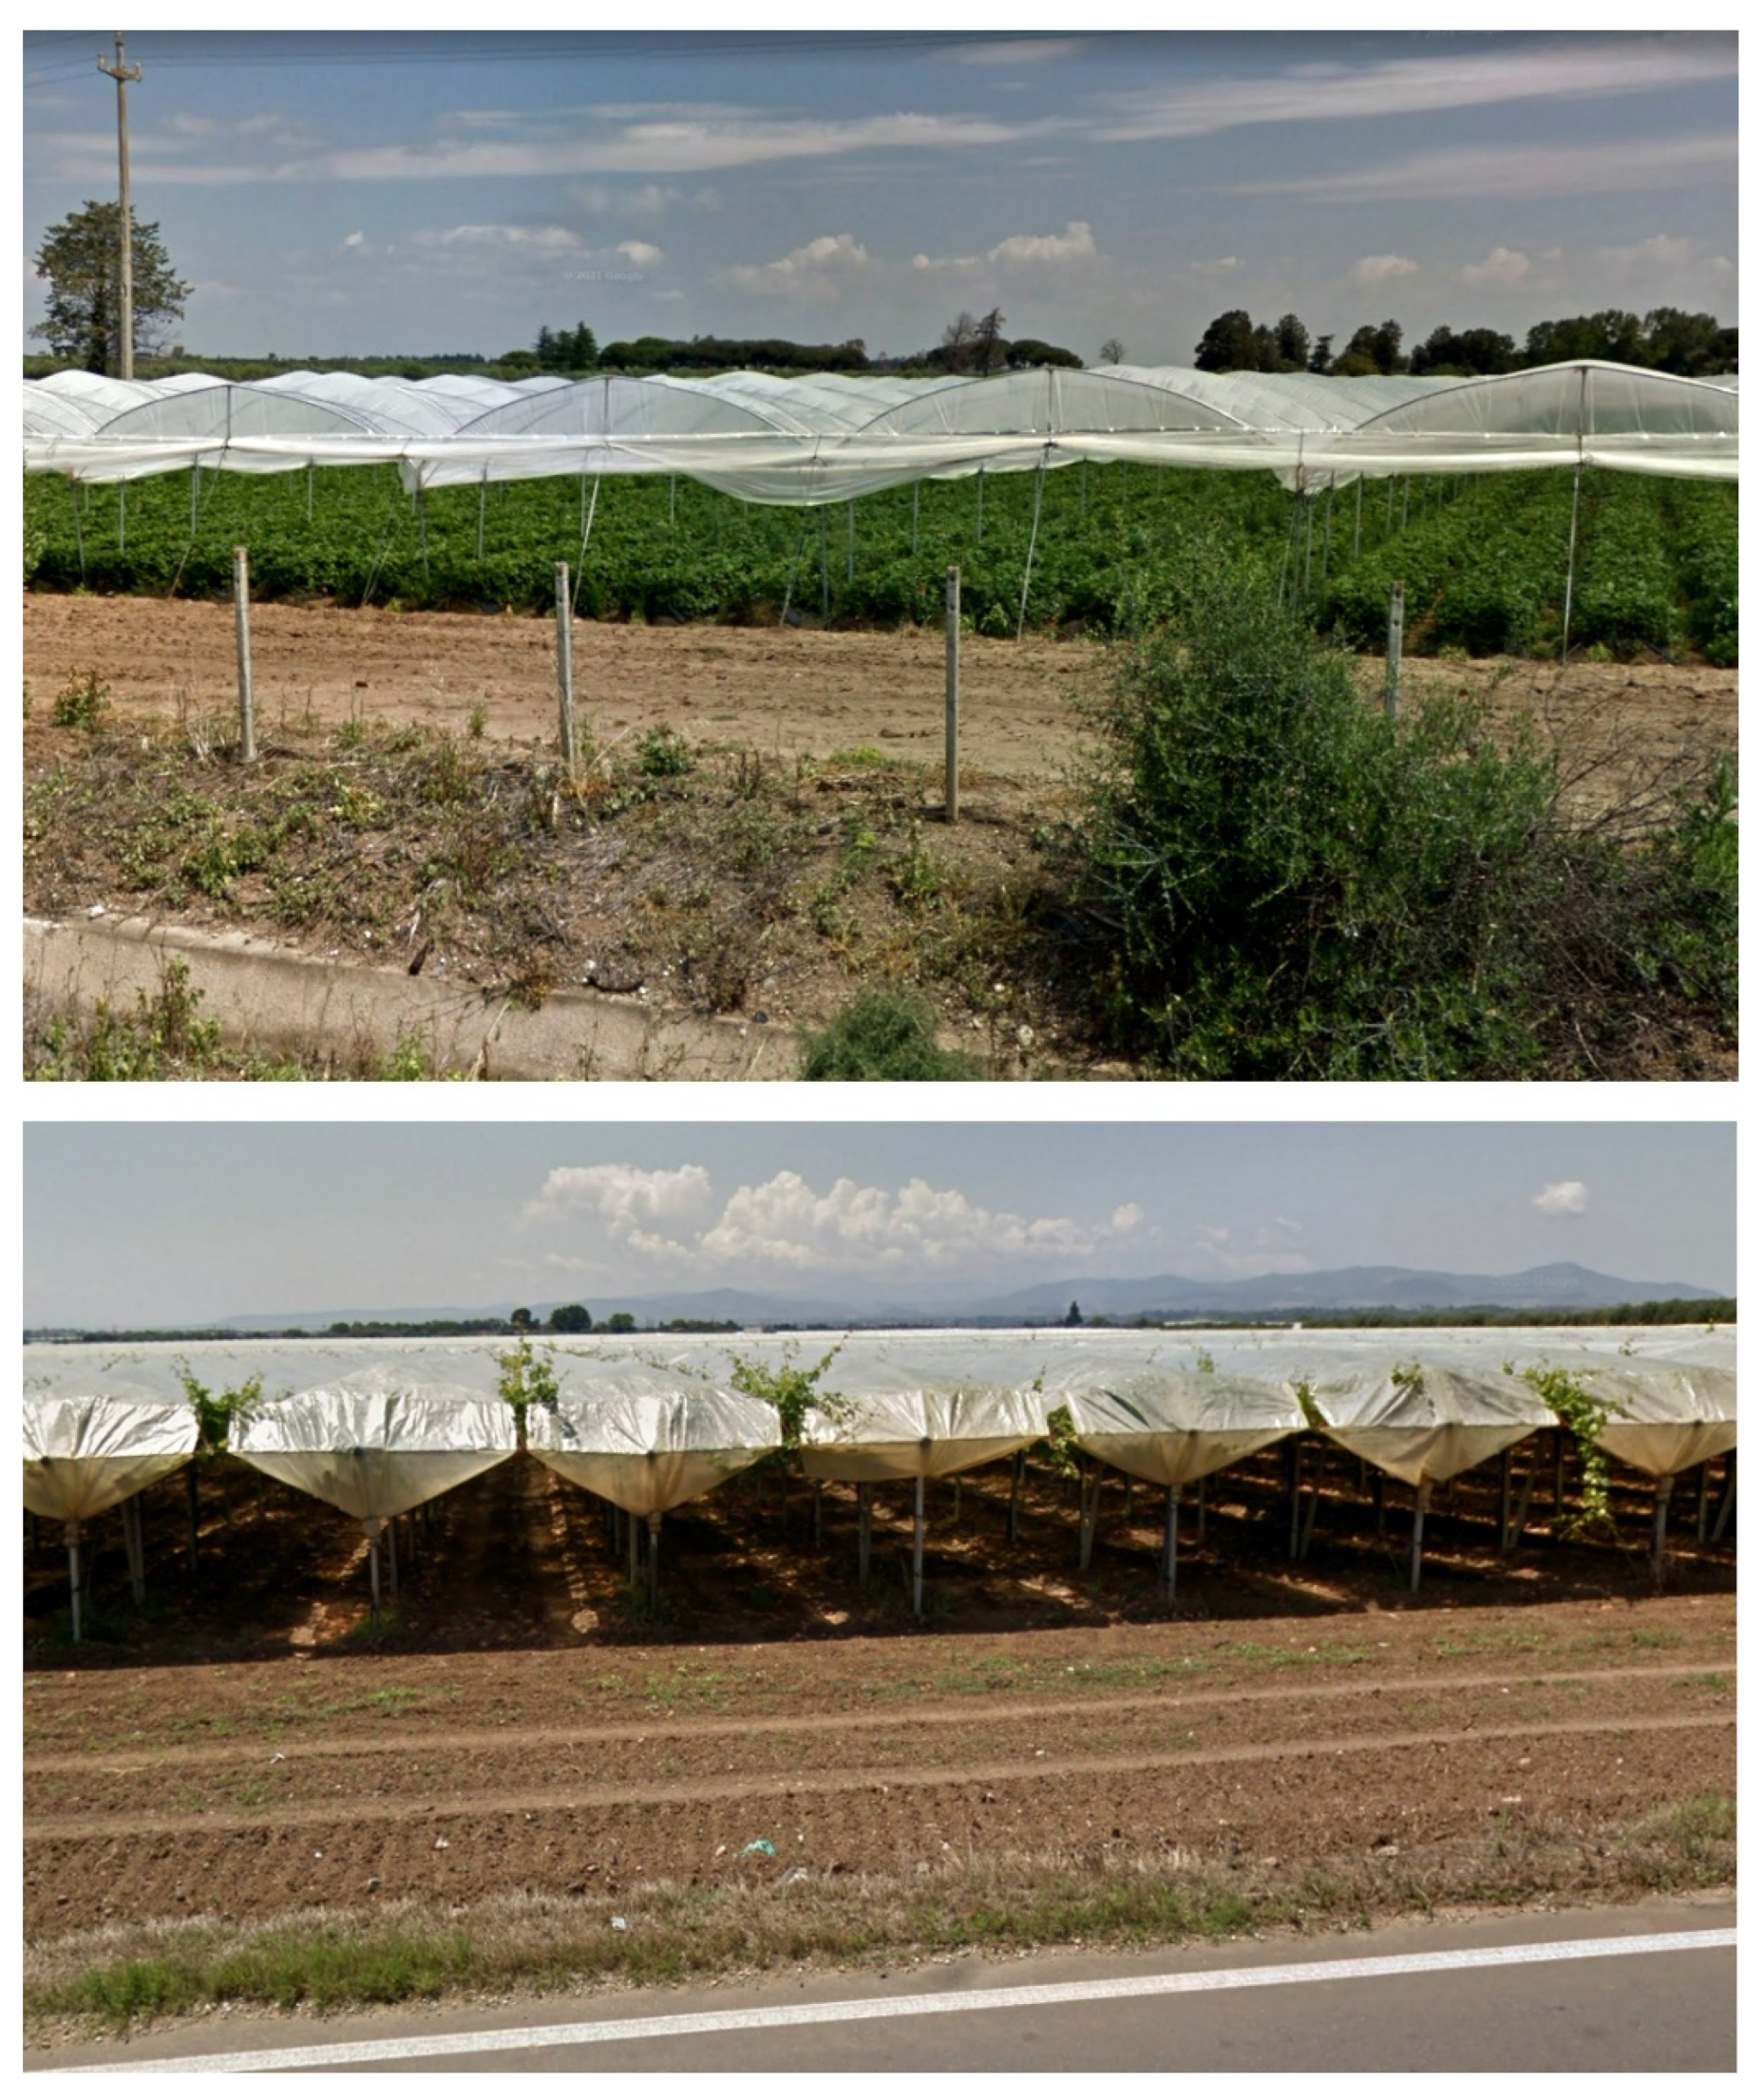
2.2.2. APS Mapping by Orthophoto Visual Interpretation

The result of the previous operation was vectorized through QGIS and used as a starting point for the complete digitization of the APS remains. The 2017 orthophotos [27] were used, and these have a 50 cm resolution that allows an accurate and true distinction of the plastics in the same period of the satellite analysis (summer 2017).
True-color orthophotos are another type of digital imagery that are commonly employed. These can be processed through semi-automated procedures to facilitate APS detection [36]. In this case study, given the extent of the study area and the density of APSs, manual digitization was adopted to complement the semi-automatic remote-sensed process previously presented. Specifically, false-detection errors derived from the use of the RPGI index were eliminated and non-detected APSs were manually digitized through visual interpretation. This was possible due to the ease of distinguishing greenhouse plastics from other landscape components thanks to particular color and shape and due to the very high resolution of the orthophotos (50 cm). The polygonization of the APS enabled performing of complex spatial analyses (Figure 4), which are fundamental for the overall planning of the rural territory [37]. The final result is a vectorial output in which the total consistency and location of the APS in terms of hectares at July 2017 is reported.

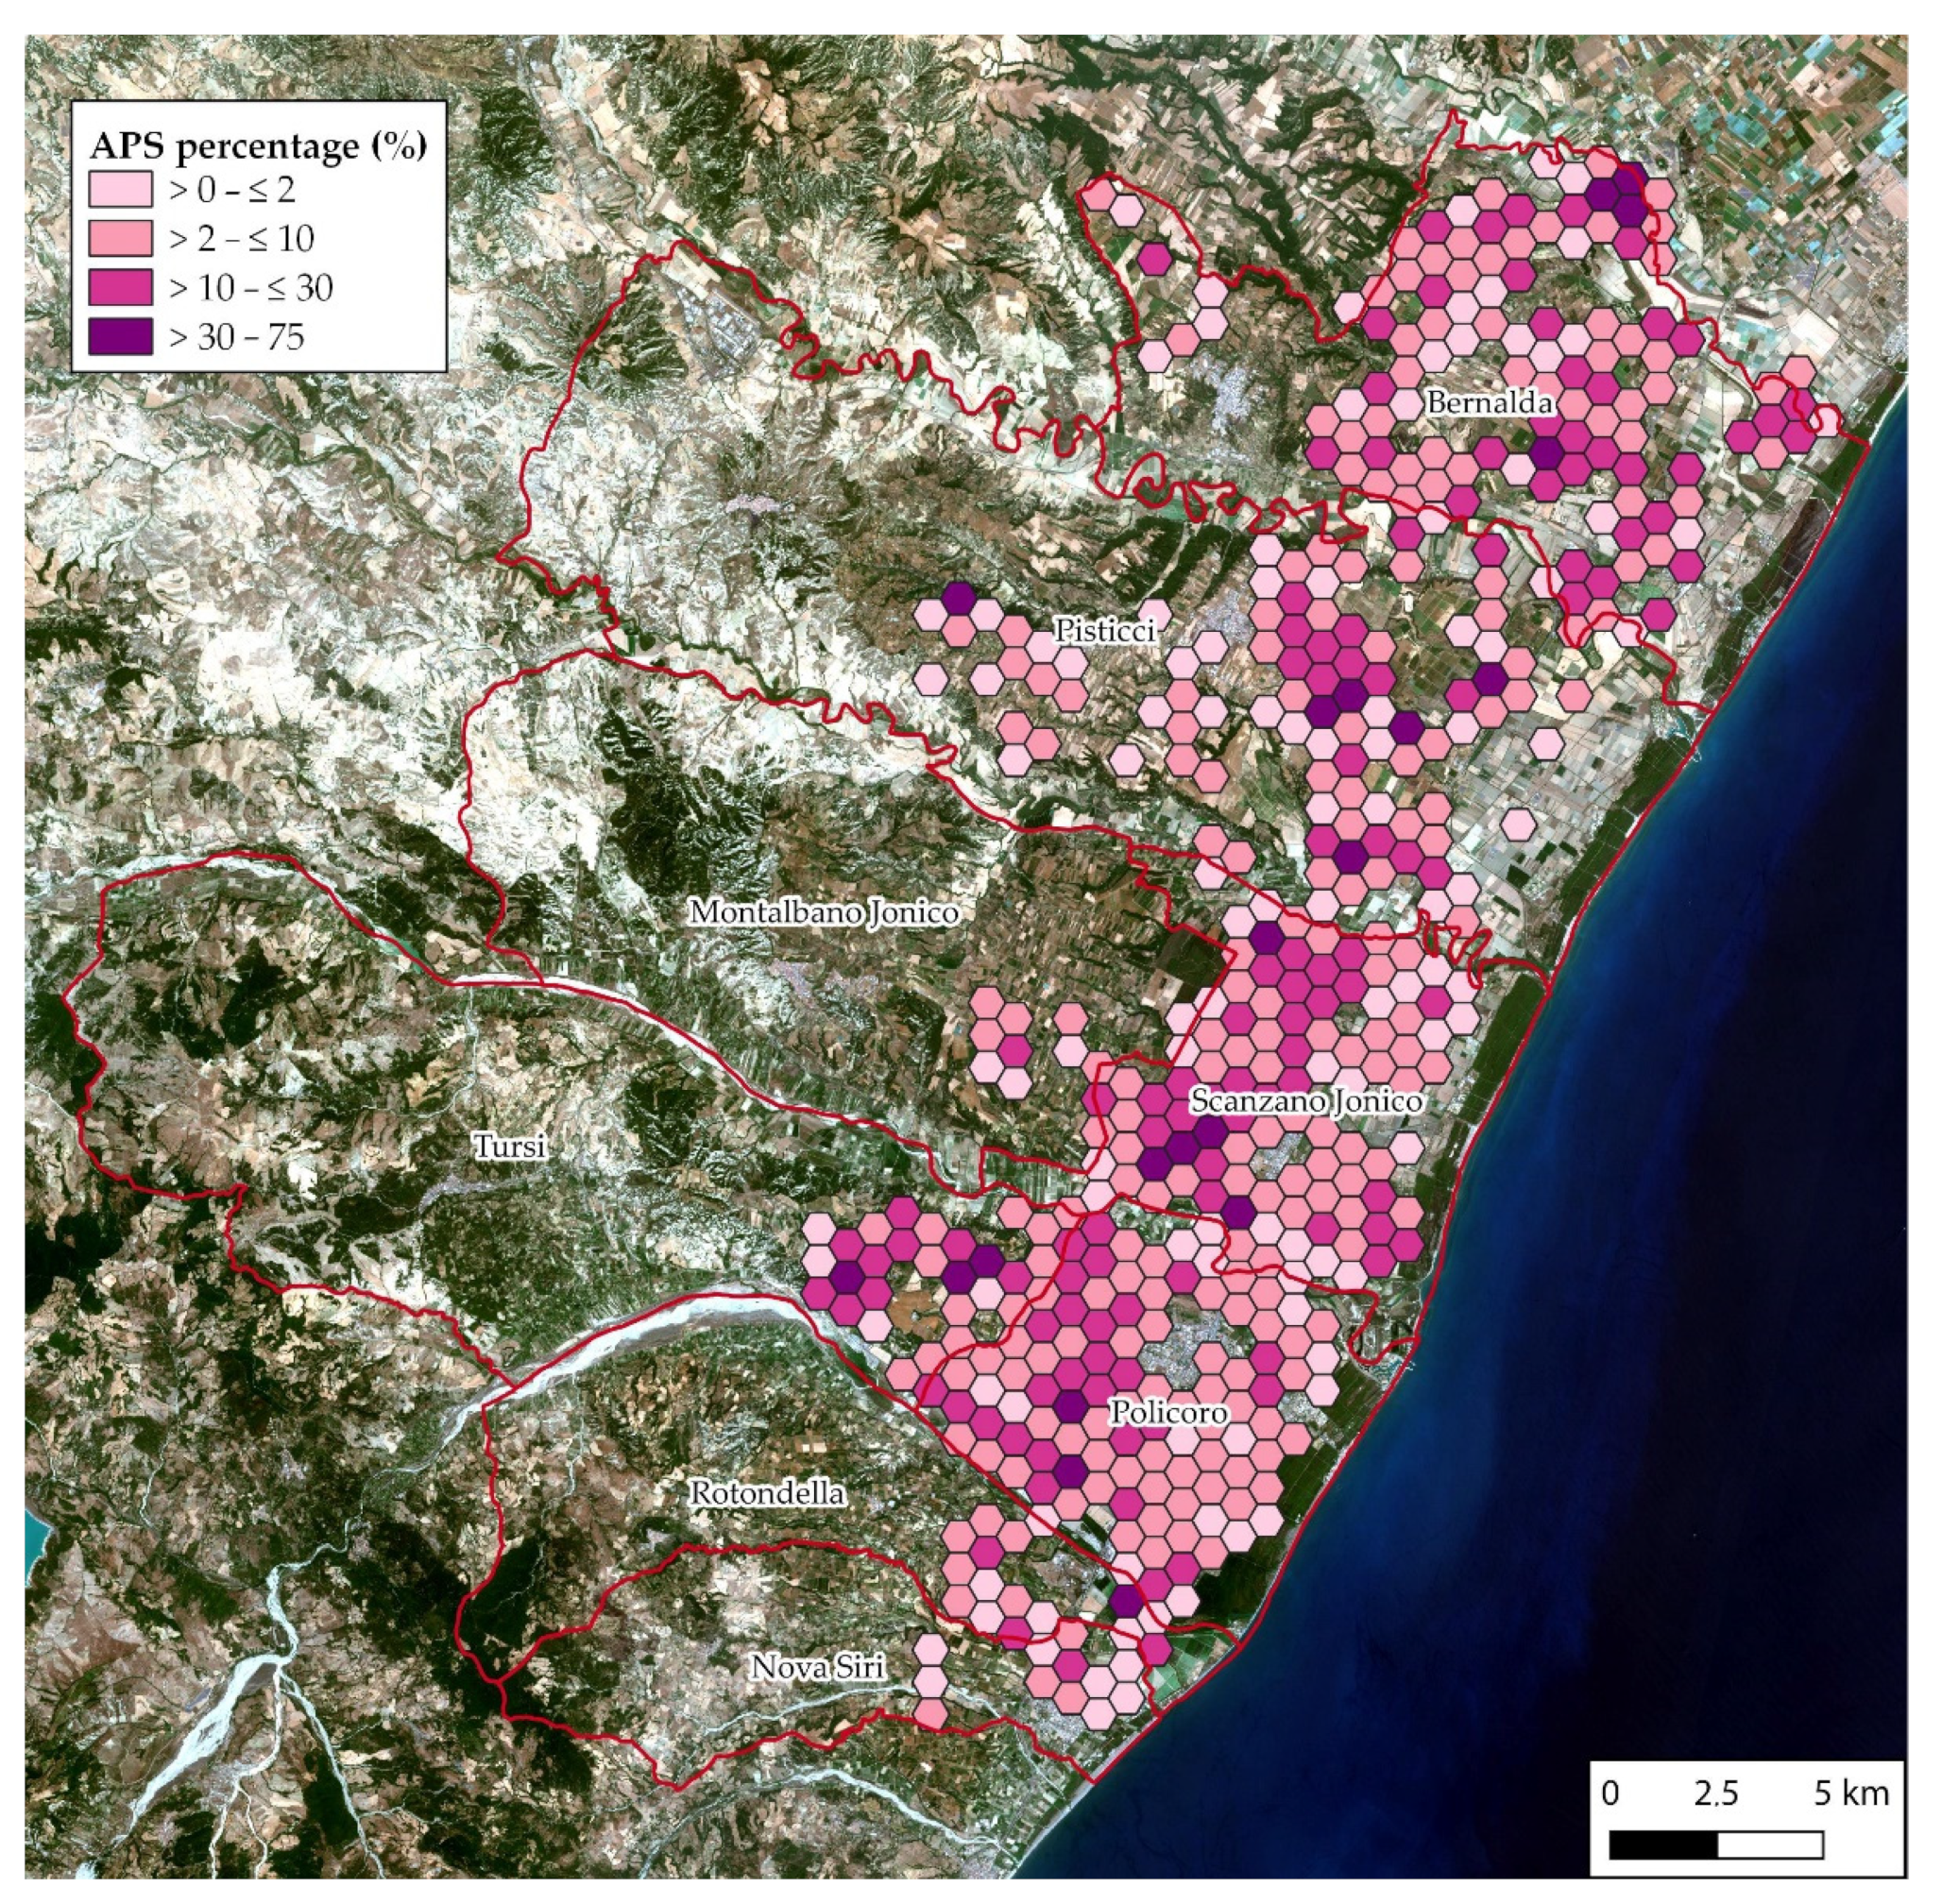
2.3. Agricultural Plastic Surface (APS) GIS-Based Analyses

After quantification, additional spatial operations were performed. For more efficient management of the APSs, they were aggregated and interpolated with a regular polygonal grid to standardize geographic mapping actions or to reduce the subjectivity given by aggregations based on irregular polygons (as can be that of administrative boundaries). Generally, a grid of squares is used because many global cartographic systems are represented in this way. However, they have mathematical limitations. In fact, in the fields of ecology and urban planning, hexagons are increasingly being used [38,39].
Moreover, hexagons have the property of matching perfectly, but also of being equidistant and sharing the same distance boundary between all of their neighbors. For this study, a single cell size of 50 hectares was chosen (maximum value found for a single APS polygon), while the grid size was calculated on the basis of the total geographical extent of the APS. Then, through the QGIS toolbox, the polygons of the APS were interpolated into the grid. The QGIS toolbox contains several integrated modules that allow spatial overlay analysis useful for the purpose of the work. In particular, the following tools have been used: Dissolve, Intersection, and Spatial Join. These enabled summarization of the information in the cells without losing data. In this way, within each cell, the percentage of APS present was computed, thus performing a clustering operation. This is useful for a hot-spot analysis in vector format and, therefore, is more easily manageable and applicable with other spatial analysis.

3. Results and Discussions

The applied techniques, which integrate manual and semi-automatic mapping, enabled accurate mapping of the plastics in the year 2017 (Figure 5). From a first qualitative assessment, the distribution of APSs within the municipal territories has been delimited exclusively to the part closest to the coast and flat.
From analysis of the elaborations summarized in Table 2, it emerges that about 2000 hectares of APS are concentrated in the four municipalities of Pisticci, Policoro, Scanzano Jonico, and Bernalda. At the overall level, the APSs occupy 2.25% of the total study area, that is, a 4.43 % of the total agricultural area. Since the complete classification of land cover has not been carried out, a different dataset [35] has been used only to make a descriptive statistical comparison for a general evaluation.
For an analysis of the frequency distribution of the single plastic covers, a histogram (Figure 6) was realized automatically in a GIS environment, showing how the single patches of identified plastic covers are distributed. From the analysis, it emerges that most of them do not exceed 10 hectares and that the largest number of polygons identifying plastic are in the first class of distribution (less than 1 ha). These data, at the planning level, show that there is not high spatial continuity in the APSs, and the total area is distributed mainly on small agricultural plots.
However, for a more precise analysis of the distribution of the quantity of APS present in the study area, the interpolation of the APS within the hexagonal grid made it possible to identify the areas with the greatest APS concentration. The aps concentration within cells was divided into percentage classes with a maximum value found of 75%. From this methodology of analysis (Figure 7), it is clear that the distribution within municipalities is different because the APSs are distributed exclusively in the portions closer to the coast and flat.
The quantitative analysis of the grid (Table 3) confirms what has been indicated above, i.e., mainly the APSs cover at most 30% of the cells, while only in 4% of the cases there are very relevant aggregates in terms of continuous extension.
The GIS methodologies applied in this work enabled quantification, for the first time, of the plastic surfaces used in agriculture in Basilicata Region, where there are not yet strategies of action and continuous monitoring. The density of area affected by plastics is lower than in other Mediterranean agricultures [40,41]. In consideration of the new obligations imposed to EU Member States on waste management, regional and/or local authorities will also have to implement strategies to reduce APW. Moreover, if we consider that the Basilicata region is considered one of the European areas with High Natural Value farmland [42], the provision of an APW management tool is even more important.
In addition, the use of the GIS environment is essential for the quantification of APSs for countries where there are only agricultural statistics and censuses in tabular format. Censuses and agricultural statistics allow an indirect APS estimation, which may not be up-to-date and by administrative areas (region, province, and municipality). However, for continuous monitoring for sustainable planning purposes, it is necessary to have spatially accurate and constantly updated data. Indeed, it is essential to geolocate APSs, because this represents the main dataset for subsequent quantifications of APW [15,16] and for complex spatial analyses essential for the implementation of spatial decision support systems [43].
GIS-based methodologies, particularly FOSS (Free and Open-Source Software) methodologies, allow for the integration of different techniques, geographic tools, and different types of geodata, so that the same work environment can be used to perform all analyses and assessments of agricultural activities in general [44].
In this paper, we have used digital images that can be easily processed even for those who do not have high technical skills. Orthophotos allow an effective and truthful classification and distinction of plastics, typologies, and rural context. New satellite imagery, and in particular, that of the Sentinel-2 mission allow the implementation of continuous and standardized monitoring of plastics [45]. Obviously, for regional-scale applications and land-use planning, the use of satellite imagery can be challenging for local authorities, but the index employed in this study can be a valuable support to those operationally involved in APS management. The overall accuracy recorded with the application of the RPGI index is about 55%, which was obtained by comparison with APS visual classification for the entire study area. This not-high value is due both to the resolution of the satellite images (as it does not allow identification of some very small plots) and to the fact that the application of the RPGI index is not a real supervised classification of the territory, so it only provides a rough indication of the presence of plastics and needs further investigation to improve its exclusive usability. As reported by Ibrahim et al. [30], the RPGI index is less sensitive than other classification methodologies because it is related to the type of crop, and if the plastic greenhouses are painted or not during their use. Moreover, greenhouse plastics have high correspondences to bare soil spectra, but still allow a preliminary detection of APSs [30]. In addition, a 5% incidence of classification errors emerged.
From the analysis of APS distribution data, it appears that, in the perspective of detailed planning in areas where there is not a continuous extension of plastics in the fields, it is necessary to use other methods of spatial aggregation of APSs different from the use of simple administrative boundaries [18]. Operating on grids, besides providing data that can be easily used in a spatial decision-support system useful for plastic-waste management, it is possible to perform analyses that also include different aspects such as the evaluation of visual impact or ecosystem services [46,47].
A hexagonal grid was chosen, because it can be better exploited for spatial surveys, simulations, and continuous process monitoring [38], since it will be used to apply more complex spatial analyses in future investigations of this research (Part II). Indeed, a hexagonal grid has proved to be more suitable compared to other shapes, as reported in several kinds of geospatial research [48,49,50,51].
In this case, an arbitrarily constructed grid was used on the basis of the maximum size of APS found. For a planning purpose, a local authority can define a grid on the basis of subjective evaluations and use it for all monitoring and planning phases so as to have a univocal spatial reference in time. In addition, the realization of a density grid in vector format is more useful, because it can be easily associated with a complex geodatabase and then integrated with other types of information in a more immediate and practical way than raster data [52].
The work carried out has proved to be fundamental for the automated mapping of surfaces covered by plastics. It could be extended to much larger study areas, where the results can provide even more application insights. Being a preliminary work, in the future the same techniques can be used to perform a differentiation of the different types of plastics used by simplifying the semi-automatic satellite image classification techniques already in use and to detect plastic used in other seasons as well. In addition, the same methodologies can be applied to high-spatial-resolution satellite imagery and spectra that would provide higher accuracy. Furthermore, by exploiting advanced spatial analysis tools from open-source GISs, it is possible to start from plastics distribution data to identify potential locations of disposal centers, through the analysis of spatial connection networks.

4. Conclusions

One of the main problems of some rural areas, especially those more accessible from an orographic and climatic point of view, is represented by the uncontrolled use of plastics and often the complete absence of reuse and disposal strategies.
For a correct management of the rural territory, modern geographic technologies and freely usable geodata represent one of the possible solutions to the question as they allow both accurate detection and accurate analysis of the impact on the territory. Therefore, dealing with the questions of APW through a GIS environment enables both quantification of agricultural plastics and analysis of them spatially with respect to the territorial context, in order to be properly reused or disposed of.
The results obtained in this study, applied to an area with a large use of plastics (the Ionian Coast of the Basilicata Region), made it possible to set up a working methodology useful for quantifying the fundamental data for environmental impact assessments, i.e., the surfaces of agricultural areas covered with different types of plastics (especially greenhouses, tunnels, and nets).
As it has been set up, the methodology allows constant updating of the data and connection to other agricultural databases, attempting to free from descriptive agricultural censuses. Furthermore, given the simplicity and immediacy of the techniques, local authorities can take advantage of this methodology for territorial and sustainable planning on the entire agroforestry territory.
The results obtained in this first study, therefore, pave the way to the realization of a digital Atlas that could be realized at European level—based on an open-source GIS platform. This could be calibrated in other selected geographical areas through in situ surveys and satellite data—to be explorable and updateable online. This Atlas would map AP uses and potential macro-, micro-, and nano-plastic (MNP) sources from AP categorized by physical characteristics, quantities and applications, estimated waste generation and management practices, and information on estimated sources of MNPs to soil.
In a successive paper (Part II), a different approach will be illustrated, through which a similar digital Atlas has been compiled with reference to the same study area, through an inductive approach, based on the statistical quantification of different crops in which plastic material are usually employed, then evaluating the current and potential quantities, location and time availability of plastic waste, at the end of the working life.

Author Contributions

The authors equally shared their contribution to preparing this paper. G.C. conceptualized and developed the research design, methodology, manuscript writing, data analysis, and elaboration, D.S. revised data analysis and elaboration, E.S. and G.V. revised and integrated the manuscript writing, and P.P. supervised the work. All authors have read and agreed to the published version of the manuscript.

Funding

This research was funded by the Project “Plastic in Agricultural Production: Impacts, Lifecycles and Long-term sustainability—PAPILLONS”, financed by the European Union—Topic: SFS-21-2020 Emerging challenges for soil management—Sub-Topic B [2020]: Emerging challenges for soil management: use of plastic in agriculture (RIA)—Grant agreement ID: 101000210.

Institutional Review Board Statement

Not applicable.

Informed Consent Statement

Not applicable.

Data Availability Statement

The elaborated data presented in this study are available on request from the corresponding author. The funders had no role in the design of the study; in the collection, analyses, or interpretation of data; in the writing of the manuscript, or in the decision to publish the results.

Conflicts of Interest

The authors declare no conflict of interest.

References

  1. Food and Agriculture Organization of the United Nations (FAO); Organization for Economic Co-Operation and Development (OECD). Background Notes on Sustainable. Productive and Resilient Agro-Food Systems: Value Chains, Human Capital, and the 2030 Agenda. A Report to the G20 Agriculture Deputies July 2019. Available online: https://www.oecd-ilibrary.org/docserver/dca82200-en.pdf?expires=1563959111&id=id&accname=guest&checksum=5BD0A7A51327DB165936B4AE57A0E5CE (accessed on 5 August 2021).
  2. Food and Agriculture Organization of the United Nations (FAO). Food and Agriculture: Driving Action across the 2030 Agenda for Sustainable Development. Rome, Italy. 2017. Available online: http://www.fao.org/3/a-i7454e.pdf (accessed on 15 September 2021).
  3. Picuno, P. Innovative Material and Improved Technical Design for a Sustainable Exploitation of Agricultural Plastic Film. Polym. Technol. Eng. 2014, 53, 1000–1011. [Google Scholar] [CrossRef]
  4. Scarascia-Mugnozza, G.; Sica, C.; Russo, G. Plastic Materials in European Agriculture: Actual Use and Perspectives. J. Agric. Eng. 2012, 42, 15–28. [Google Scholar] [CrossRef]
  5. Briassoulis, D.; Babou, E.; Hiskakis, M.; Scarascia-Mugnozza, G.; Picuno, P.; Guarde, D.; Dejean, C. Review, mapping and analysis of the agricultural plastic waste generation and consolidation in Europe. Waste Manag. Res. J. Sustain. Circ. Econ. 2013, 31, 1262–1278. [Google Scholar] [CrossRef] [PubMed]
  6. Plastics Europe. Plastics—The Facts 2018. Available online: https://plasticseurope.org/wp-content/uploads/2021/10/2018-Plastics-the-facts.pdf (accessed on 30 August 2021).
  7. Al-Maaded, M.; Madi, N.K.; Kahraman, R.; Hodzic, A.; Ozerkan, N.G. An Overview of Solid Waste Management and Plastic Recycling in Qatar. J. Polym. Environ. 2012, 20, 186–194. [Google Scholar] [CrossRef]
  8. Schettini, E.; Vox, G. Effects of Agrochemicals on The Radiometric Properties of Different Anti-UV Stabilized Eva Plastic Films. Acta Hortic. 2012, 956, 515–522. [Google Scholar] [CrossRef]
  9. Kumar, M.; Xiong, X.; He, M.; Tsang, D.C.; Gupta, J.; Khan, E.; Harrad, S.; Hou, D.; Ok, Y.S.; Bolan, N.S. Microplastics as pollutants in agricultural soils. Environ. Pollut. 2020, 265, 114980. [Google Scholar] [CrossRef]
  10. PAPILLONS Project—Plastic in Agricultural Production: Impacts, Lifecycles and Long-Term Sustainability. Available online: https://www.papillons-h2020.eu/ (accessed on 15 December 2021).
  11. Picuno, C.; Godosi, Z.; Kuchta, K.; Picuno, P. Agrochemical plastic packaging waste decontamination for recycling: Pilot tests in Italy. J. Agric. Eng. 2019, 50, 99–104. [Google Scholar] [CrossRef]
  12. Kumar, R.; Verma, A.; Shome, A.; Sinha, R.; Sinha, S.; Jha, P.K.; Kumar, R.; Kumar, P.; Shubham, P.; Das, S.; et al. Impacts of Plastic Pollution on Ecosystem Services, Sustainable Development Goals, and Need to Focus on Circular Economy and Policy Interventions. Sustainability 2021, 13, 9963. [Google Scholar] [CrossRef]
  13. Duque-Acevedo, M.; Belmonte-Ureña, L.J.; Cortés-García, F.J.; Camacho-Ferre, F. Agricultural waste: Review of the evolution, approaches and perspectives on alternative uses. Glob. Ecol. Conserv. 2020, 22, e00902. [Google Scholar] [CrossRef]
  14. de Sousa, F.D.B. The role of plastic concerning the sustainable development goals: The literature point of view. Clean. Responsible Consum. 2021, 3, 100020. [Google Scholar] [CrossRef]
  15. Richter, A.; Ng, K.T.W.; Karimi, N.; Li, R.Y.M. An iterative tessellation-based analytical approach to the design and planning of waste management regions. Comput. Environ. Urban Syst. 2021, 88, 101652. [Google Scholar] [CrossRef]
  16. Morsink-Georgali, P.-Z.; Afxentiou, N.; Kylili, A.; Fokaides, P.A. Definition of optimal agricultural plastic waste collection centers with advanced spatial analysis tools. Clean. Eng. Technol. 2021, 5, 100326. [Google Scholar] [CrossRef]
  17. Blanco, I.; Loisi, R.V.; Sica, C.; Schettini, E.; Vox, G. Agricultural plastic waste mapping using GIS. A case study in Italy. Resour. Conserv. Recycl. 2018, 137, 229–242. [Google Scholar] [CrossRef]
  18. Parlato, M.C.; Valenti, F.; Porto, S.M. Covering plastic films in greenhouses system: A GIS-based model to improve post use suistainable management. J. Environ. Manag. 2020, 263, 110389. [Google Scholar] [CrossRef]
  19. Contò, F.; La Sala, P. Approccio territoriale e sviluppo locale. In Il Programma di Sviluppo del Distretto Agroalimentare di Qualità del Metapontino; Franco Angeli Edizioni: Milan, Italy, 2011. [Google Scholar]
  20. Waste Management Planning. Available online: https://ec.europa.eu/environment/waste/plans/index.htm (accessed on 6 October 2021).
  21. Basilicata Region, Banca Dati Agricoltura 6° Censimento 2010. Available online: http://sestocensimentoagricoltura.regione.basilicata.it/ (accessed on 9 August 2021).
  22. Vox, G.; Loisi, R.V.; Blanco, I.; Mugnozza, G.S.; Schettini, E. Mapping of Agriculture Plastic Waste. Agric. Agric. Sci. Procedia 2016, 8, 583–591. [Google Scholar] [CrossRef] [Green Version]
  23. ISTAT. Censimenti dell’Agricoltura. Available online: https://www.istat.it/it/censimenti-permanenti/censimenti-precedenti/agricoltura (accessed on 30 November 2021).
  24. Murray, A.T. Contemporary optimization application through geographic information systems. Omega 2021, 99, 102176. [Google Scholar] [CrossRef]
  25. Usmani, R.S.; Hashem, I.A.; Pillai, T.R.; Saeed, A.; Abdullahi, A.M. Geographic Information System and Big Spatial Data: A Review and Challenges. Int. J. Enterp. Inf. Syst. 2020, 16, 101–145. [Google Scholar] [CrossRef]
  26. Cillis, G.; Statuto, D.; Picuno, P. Integrating Remote-Sensed and Historical Geodata to Assess Interactions Between Rural Buildings and Agroforestry Land. J. Environ. Eng. Landsc. Manag. 2021, 29, 229–243. [Google Scholar] [CrossRef]
  27. RSDI. Infrastruttura Regionale dei Dati Spaziali della Regione Basilicata. Available online: https://rsdi.regione.basilicata.it/ (accessed on 25 September 2021).
  28. European Space Agency—ESA. Available online: https://sentinel.esa.int/web/sentinel/missions/sentinel-2 (accessed on 28 December 2021).
  29. Borgogno-Mondino, E.; De Palma, L.; Novello, V. Investigating Sentinel 2 Multispectral Imagery Efficiency in Describing Spectral Response of Vineyards Covered with Plastic Sheets. Agronomy 2020, 10, 1909. [Google Scholar] [CrossRef]
  30. Ibrahim, E.; Gobin, A. Sentinel-2 Recognition of Uncovered and Plastic Covered Agricultural Soil. Remote. Sens. 2021, 13, 4195. [Google Scholar] [CrossRef]
  31. Lanorte, A.; De Santis, F.; Nolè, G.; Blanco, I.; Loisi, R.V.; Schettini, E.; Vox, G. Agricultural plastic waste spatial estimation by Landsat 8 satellite images. Comput. Electron. Agric. 2017, 141, 35–45. [Google Scholar] [CrossRef]
  32. Aguilar, M.; Jiménez-Lao, R.; Aguilar, F. Evaluation of Object-Based Greenhouse Mapping Using WorldView-3 VNIR and SWIR Data: A Case Study from Almería (Spain). Remote. Sens. 2021, 13, 2133. [Google Scholar] [CrossRef]
  33. Yang, D.; Chen, J.; Zhou, Y.; Chen, X.; Chen, X.; Cao, X. Mapping plastic greenhouse with medium spatial resolution satellite data: Development of a new spectral index. ISPRS J. Photogramm. Remote Sens. 2017, 128, 47–60. [Google Scholar] [CrossRef]
  34. Balcik, F.B.; Senel, G.; Goksel, C. Greenhouse Mapping using Object Based Classification and Sentinel-2 Satellite Imagery. In Proceedings of the 2019 8th International Conference on Agro-Geoinformatics (Agro-Geoinformatics), Istanbul, Turkey, 16–19 July 2019; pp. 1–5. [Google Scholar]
  35. ISPRA. Italian Nature Map. Available online: https://www.isprambiente.gov.it/it/servizi/sistema-carta-della-natura (accessed on 30 August 2021).
  36. Tarantino, E.; Figorito, B. Mapping Rural Areas with Widespread Plastic Covered Vineyards Using True Color Aerial Data. Remote Sens. 2012, 4, 1913–1928. [Google Scholar] [CrossRef] [Green Version]
  37. Tassinari, P.; Torreggiani, D.; Benni, S.; Carfagna, E.; Pollicino, G.; Ludwiczak, Z. Spatial analysis methods and land-use planning models for rural areas. Ital. J. Agron. 2009, 4, 71–76. [Google Scholar] [CrossRef] [Green Version]
  38. Burdziej, J. Using hexagonal grids and network analysis for spatial accessibility assessment in urban environments—A case study of public amenities in Toruń. Misc. Geogr. 2019, 23, 99–110. [Google Scholar] [CrossRef] [Green Version]
  39. Dharmawan, R.D.; Suharyadi, P.; Farda, N.M. Geovisualization Using Hexagonal Tessellation for Spatiotemporal Earthquake Data Analysis in Indonesia. Robotics 2017, 788, 177–187. [Google Scholar] [CrossRef]
  40. Picuno, P.; Sica, C.; Laviano, R.; Dimitrijevic, A.; Scarascia-Mugnozza, G. Experimental tests and technical characteristics of regenerated films from agricultural plastics. Polym. Degrad. Stab. 2012, 97, 1654–1661. [Google Scholar] [CrossRef]
  41. Agriculture Plastic Europe. Statistics 2021. Available online: https://apeeurope.eu/statistics/ (accessed on 5 November 2021).
  42. Paracchini, M.; Petersen, J.; Hoogeveen, Y.; Bamps, C.; Burfield, I.; Van Swaay, C. High Nature Value Farmland in Europe. In An Estimate of the Distribution Patterns on the Basis of Land Cover and Biodiversity Data; EUR 23480 EN; OPOCE: Luxembourg, 2008. [Google Scholar]
  43. Li, H.; Zhao, Y.; Zheng, F. The framework of an agricultural land-use decision support system based on ecological environmental constraints. Sci. Total Environ. 2020, 717, 137149. [Google Scholar] [CrossRef]
  44. Belcore, E.; Angeli, S.; Colucci, E.; Musci, M.; Aicardi, I. Precision Agriculture Workflow, from Data Collection to Data Management Using FOSS Tools: An Application in Northern Italy Vineyard. ISPRS Int. J. Geo-Inf. 2021, 10, 236. [Google Scholar] [CrossRef]
  45. Lin, J.; Jin, X.; Ren, J.; Liu, J.; Liang, X.; Zhou, Y. Rapid Mapping of Large-Scale Greenhouse Based on Integrated Learning Algorithm and Google Earth Engine. Remote. Sens. 2021, 13, 1245. [Google Scholar] [CrossRef]
  46. Statuto, D.; Cillis, G.; Picuno, P. Visual quality indicators for assessing landscape characteristics and managing its protection. In Proceedings of the Public Recreation and Landscape Protection—With Sense Hand in Hand? Křtiny, Czech Republic, 13–15 May 2019; pp. 476–480. [Google Scholar]
  47. Cerreta, M.; Mele, R.; Poli, G. Urban Ecosystem Services (UES) Assessment within a 3D Virtual Environment: A Methodological Approach for the Larger Urban Zones (LUZ) of Naples, Italy. Appl. Sci. 2020, 10, 6205. [Google Scholar] [CrossRef]
  48. Birch, C.P.; Oom, S.P.; Beecham, J.A. Rectangular and hexagonal grids used for observation, experiment and simulation in ecology. Ecol. Model. 2007, 206, 347–359. [Google Scholar] [CrossRef]
  49. Levine, A.S.; Feinholz, C.L. Participatory GIS to inform coral reef ecosystem management: Mapping human coastal and ocean uses in Hawaii. Appl. Geogr. 2015, 59, 60–69. [Google Scholar] [CrossRef]
  50. Cabrera-Barona, P.; Wei, C.; Hagenlocher, M. Multiscale evaluation of an urban deprivation index: Implications for quality of life and healthcare accessibility planning. Appl. Geogr. 2016, 70, 1–10. [Google Scholar] [CrossRef]
  51. Venturi, M.; Piras, F.; Corrieri, F.; Fiore, B.; Santoro, A.; Agnoletti, M. Assessment of Tuscany Landscape Structure According to the Regional Landscape Plan Partition. Sustain. 2021, 13, 5424. [Google Scholar] [CrossRef]
  52. Xu, Y.; Wang, L.; Fu, C.; Kosmyna, T. A fishnet-constrained land use mix index derived from remotely sensed data. Ann. GIS 2017, 23, 303–313. [Google Scholar] [CrossRef] [Green Version]
Figure 1. Location of the study area with details of the Municipalities involved and altitude ranges.
Applsci 12 01330 g001
Figure 2. Two of the types of plastics used in agricultural fields in the study area.
Applsci 12 01330 g002
Figure 3. Shown on the left is the result of applying the RPGI index and on the right only the true RGB co-lens representation of the 26 July 2017 satellite image. This visual comparison shows limitations and potential in the application of this index. In fact, one can see the correctly classified APSs, the incorrect ones, and the unclassified ones.
Applsci 12 01330 g003
Figure 4. Example extracts of the APS mapping result for two different portions of the study area.
Applsci 12 01330 g004aApplsci 12 01330 g004b
Figure 5. APS map for the study area.
Applsci 12 01330 g005
Figure 6. Histogram of the distribution of APS polygons.
Applsci 12 01330 g006
Figure 7. APS expressed as a percentage for each hexagonal cell. Cells where the value is equal to 0 were not represented.
Applsci 12 01330 g007
Table 1. Area (in ha and %) recorded for major horticultural crops with plastic protection within the study area municipalities. Data processed from the sixth Italian census of agriculture, the last publicly available census [21].
MunicipalityGreenhouse Catering TomatoesOther Greenhouse VegetablesVegetables in Tunnels and Other StructuresTotal of Categories
ha% 1ha% 1ha% 1ha% 1
Bernalda2.510.1024.435.257.73.5134.634.88
Montalbano jonico00.0040.8620.9160.85
Pisticci0.10.4043.19.2721.79.8864.99.15
Policoro1.847.43151.5932.6034.615.75188.0326.50
Nova siri00.006.281.357.653.4813.931.96
Rotondella00.003.60.773.11.416.70.94
Scanzano jonico14.04169.0736.3684.3838.41254.4535.87
Tursi1.56.063.980.865223.6757.488.10
Total for study area6.9428.04406.0587.32213.1397.02626.1288.26
Total for Basilicata Region24.75 465.01 219.68 709.44
1 Percentage compared to the total area of the same category registered in Basilicata Region.
Table 2. APS quantities (ha) and percentage incidence for each municipality in the study area.
MunicipalityMunicipality Area (ha)APS (ha)Agricultural Area (ha) 1% Compared to Total APS% Compared to Municipality Area% Compared to Agricultural Areas
Pisticci23,143.70346.4412,558.3516.801.502.76
Nova Siri5225.4728.302321.141.370.120.23
Policoro6700.44394.673982.1419.141.713.14
Tursi15,846.90173.915357.138.430.751.38
Montalbano Jonico13,472.3419.715618.170.960.090.16
Rotondella7599.9559.653554.272.890.260.47
Bernalda12,495.67598.338086.0929.012.594.76
Scanzano Jonico7147.62441.235122.8021.401.913.51
Total91,632.092062.2346,600.10100.002.254.43
1 Calculated using the Italian Nature Map dataset [33], which is the most up-to-date dataset, with a high scale of detail.
Table 3. Number of hexagonal cells for each of the APS percentage classes shown in Figure 7.
APS ClassCells Numbers%
0–211323.64
2–1022246.44
10–3012225.52
30–75214.39
Total478100
Publisher’s Note: MDPI stays neutral with regard to jurisdictional claims in published maps and institutional affiliations.

