

A Microscopic Traffic Flow Model Characterization for Weather Conditions


1
Department of Electrical and Computer Engineering, University of Victoria, Victoria, BC V8W 2Y2, Canada
2
Department of Electrical Engineering, Jalozai Campus, UET Peshawar, Jalozai 24240, Pakistan
3
Department of Computer System Engineering, University of Engineering and Technology, Peshawar 25000, Pakistan
*
Author to whom correspondence should be addressed.
Appl. Sci. 2022, 12(24), 12981; https://doi.org/10.3390/app122412981
Submission received: 25 October 2022
/
Revised: 5 December 2022
/
Accepted: 15 December 2022
/
Published: 17 December 2022
(This article belongs to the Topic Intelligent Transportation Systems)
Abstract
:Road surfaces are affected by rain, snow, and ice, which influence traffic flow. In this paper, a microscopic traffic flow model based on weather conditions is proposed. This model characterizes traffic based on the weather severity index. The Intelligent Driver (ID) model characterizes traffic behavior based on a constant acceleration exponent resulting in similar traffic behavior regardless of the conditions, which is unrealistic. The ID and proposed models are evaluated over a circular road of length m. The results obtained indicate that the proposed model characterizes the velocity and density better than the ID model. Further, variations in the traffic flow with the proposed model are smaller during adverse weather, as expected. It is also shown that traffic is stable with the proposed model, even during adverse weather.
1. Introduction
Traffic flow is significantly affected by weather conditions, which impact traffic planning, mobility, and efficacy [1]. Weather can cause traffic delays [2] and make driving hazardous [3,4]. During normal weather, traffic flow is smooth, as the distance between vehicles to align to forward conditions is covered quickly. In adverse weather, the flow is affected by road surface conditions [1]. Rain, hail, and snow cause slick roadss, which reduce the friction between the road and tires, causing vehicles to take longer to align. This results in congestion and traffic queues that take longer to dissipate. Slick road increase the accident probability, hence driver perception of weather conditions is important [4]. Thus, a traffic model is required that accurately and realistically characterizes traffic flow based on the weather.
Weather conditions such as fog, rain, snow, and dust reduce friction and visibility, causing a reduction in velocity and increased delay. An 18% increase in delay during adverse weather conditions has been reported [1]. Slick roads due to light snow decrease vehicle adhesion by 10% [5]. Heavy snow and rain reduce visibility, which increases the time and distance required to align to forward vehicles. During heavy rain, traffic volume has been reported to increase by 8.5% when the temperature is below freezing, 12% when the temperature is above freezing, and 6.5% when the temperature is high [1]. In light rain, free flow speed is reduced by m/s, and in heavy rain, it is reduced by m/s [6].
Road safety is a major concern around the world, as accidents cause severe injuries and loss of life. Approximately 1.35 million fatalities occur each year due to traffic accidents [7] and about million injuries [8]. Accident rates increase from % to % when it is snowing [9]. From 1990 to 1998, road accidents increased by % during the winter in Ottawa, Canada [10]. When it is snowing, the velocity and traffic flow are reduced by 40% and 11%, respectively, and the time headway increases by s [11]. Furthermore, fuel consumption increases during adverse weather due to the greater delay.
The number of vehicles worldwide is estimated to reach billion by [12]. This will increase congestion and accident probability, which will be worse during adverse weather [13]. According to the National Center for Statistics and Analysis, people died in 2020 and million people were injured in 2018 due to accidents on United States roads [8]. Automated driving technology is being developed to reduce the number of traffic accidents [14,15]. However, automated driving is challenging in adverse weather [15].
Three types of models are used to characterize traffic flow: microscopic, macroscopic, and mesoscopic. Microscopic models consider individual vehicles and are often based on driver physical and psychological response [16]. These models consider parameters such as vehicle position, velocity, distance, and time headway [17]. Macroscopic models are used to characterize collective traffic flow behavior, while mesoscopic models consider both individual and collective behavior [18].
2. Related Work
Newell [19] developed a microscopic model that characterizes vehicle behavior in dense traffic. In this model, velocity is based on the distance headway, thus a larger headway results in lower density and higher velocity. However, this relationship between velocity and density results in unrealistic acceleration [20]. Bando et al. [21] modified the Newell model by ignoring velocity differences, but this results in unstable traffic flow behavior. Furthermore, deviations from equilibrium velocity lead to the same acceleration, which is not realistic. Helbing and Tilch [22] proposed a model that considers reaction to velocity differences. This model can accurately characterize traffic during congestion, but the acceleration is unrealistic. Gipps [23] developed a model to better characterize acceleration and driver behavior, but it is accurate for only a small range of parameters [20].
Treiber, Henneck, and Helbing [20] proposed the Intelligent Driver (ID) model, which is based on driver response. This model characterizes driver behavior by considering the velocity and distance headway of forward vehicles and incorporating traffic parameters [24,25,26]. However, the acceleration exponent in the ID model is a constant and not based on traffic dynamics, which results in unrealistic traffic behavior. The ID model was revised in [27] to consider driver intent at junctions. However, at high velocities, the safe distance between vehicles is small, which can lead to accidents in adaptive cruise control systems. An improved safe distance was obtained in [28] using velocity-based parameters.
Jamal et al. [29] employed machine learning to predict the severity of injuries due to traffic accidents. The weather, road surface condition, lighting, vehicle type, and damage were considered as features. Ijaz et al. [30] identified the factors that affect motorbike accident injury severity using the random parameters logit model. The results obtained indicate that weather is a primary cause of these accidents in developing countries. Weather also influences commuting decisions [31,32]. Rain, snow, wind, and temperature often result in a switch from open to sheltered modes of transport [33].
Traffic signal parameters were modified in Lu et al. [34] to improve traffic efficiency and road safety during adverse weather. Cao et al. [35] employed a multi-layer logistic regression classification tree model to characterize the relationship between weather, road surface conditions, and traffic speed. The effect of weather on road safety was also examined in [36,37]. The influence of weather on traffic flow was examined in [13] using a combination of driving simulation and traffic simulation. A convolutional neural network was employed in [38] using data from a traffic monitoring camera to alert road users of adverse weather conditions.
In this paper, a microscopic traffic model is proposed that characterizes traffic flow according to the weather conditions. The road surface condition is determined using the weather severity index. This index is low for normal and high for adverse weather conditions. The behavior of the ID and proposed models is evaluated over a circular road of length m. A circular road is employed so that traffic is conserved and does not move off the road. This can be considered a worst-case condition to assess the performance of traffic models. Results are presented that indicate the proposed model realistically characterizes traffic behavior during adverse weather.
3. Traffic Flow Models
The ID model is a microscopic model that characterizes traffic based on forward vehicles [39]. Acceleration is based on driver response, distance between vehicles, and time headway. Driver response is defined as the ratio of average velocity to maximum velocity. For a smooth flow, this ratio is 1 and acceleration is low. Thus, acceleration is given by [20]
where is the maximum acceleration; and are the average and maximum velocities, respectively; is the acceleration exponent; is the bumper-to-bumper distance between the vehicles; and is the distance headway during alignment, which can be expressed as [11]
where is the distance between vehicles during congestion, known as the jam spacing; is the time headway; is the change in velocity during alignment to forward vehicles; and is the minimum acceleration. The ID model uses (1) and (2) to characterize traffic flow based on driver response and distance headway for traffic alignment during transitions. The ID model acceleration exponent is a constant determined considering vehicle alignment during transitions. Thus, it is not based on traffic physics, which leads to unrealistic and inadequate traffic characterization. In particular, traffic behavior does not change according to the environment, including road surface conditions due to weather. Therefore, a variable exponent is proposed in this paper to accurately characterize traffic behavior based on these conditions.
The time required for velocity alignment during a transition is the transition time headway , and the distance covered during this time is the transition distance headway . These headways affect driver response during transitions [40] and vary based on weather conditions. During adverse weather, the headway ratio is smaller than during normal weather. Thus, the acceleration exponent based on weather conditions can be characterized as
where is the weather severity index and is the maximum severity index. When , the weather is considered normal and the road surface is clear, thus there is maximum friction between the road and tires. When , the friction between the road and tires is minimum due to adverse weather conditions, such as snow, compacted snow, and ice, which make roads slick.
The proposed model is obtained by substituting (3) in (1), so that
This model can characterize traffic during transitions based on the road surface conditions; hence, it is more accurate and realistic than with a constant exponent . The acceleration given by (4) varies according to the weather conditions, unlike the ID model.
The density is given by [41], where is obtained by substituting (2) in (1). At equilibrium, , thus the distance headway for the ID model at equilibrium is
while for the proposed model it is
According to (5), the equilibrium distance headway between vehicles with the ID model is the same, regardless of the conditions. Conversely, (6) indicates that the distance headway with the proposed model varies according to the weather conditions.
The traffic flow is the product of density and velocity and is given by
Substituting (5) in (7) gives the traffic flow for the ID model
This indicates that the flow with the ID model is the same for all conditions. Substituting (6) in (7) gives the traffic flow for the proposed model
which shows that the flow is based on the weather conditions. In normal weather, the traffic flow is highest, as is for , while in adverse weather, the flow is lowest, as decreases to for
4. Model Stability
In this section, the stability of the ID and proposed models is evaluated for different values of the acceleration exponent and weather severity index, respectively, over a circular road of length 800 m for s. The time headway for both models is s [42], and the minimum and maximum acceleration are m/s2 and m/s2, respectively [20]. The length of a vehicle is m [41], the distance headway is m [40], and the jam spacing is m [41]. For the ID model, the acceleration exponent ranges between and , and is typically 4 [20]. Hence, this model is evaluated using and . The proposed model is evaluated using and , where denotes normal weather and denotes the most adverse weather. The initial equilibrium velocity is m/s. A disturbance at the maximum acceleration m/s2 is introduced at s. The parameters for the ID and proposed models are given in Table 1.
The velocity of the ID and proposed models is shown in Figure 1. The red line indicates the trajectory of the st vehicle, and the black lines indicate the trajectories of the following vehicles. For the ID model with , the disturbance at s causes the velocity of the 1st vehicle to decrease to m/s. It then increases to m/s at s and fluctuates, as shown in Figure 1a. These fluctuations increase with time, and the velocity varies between m/s and m/s. With , at s, the velocity of the 1st vehicle decreases to m/s. It then increases to m/s at s and fluctuates, as shown in Figure 1b. The fluctuations increase with time, and the velocity varies between m/s and m/s. With , the velocity of the 1st vehicle decreases to m/s at s. It then increases to m/s at s and fluctuates, as shown in Figure 1c. The fluctuations increase with time, and the velocity varies between m/s and m/s.
For the proposed model with , the velocity of the 1st vehicle decreases to m/s at s. It then increases to m/s at s and fluctuates, as shown in Figure 1d. The fluctuations increase with time, and the velocity varies between m/s and m/s. With , the velocity of the 1st vehicle decreases to m/s at s. It then increases to m/s at s and fluctuates, as shown in Figure 1e. The fluctuations increase with time, and the velocity varies between m/s and m/s. With , the velocity of the 1st vehicle decreases to m/s at s. It then increases to m/s at s and fluctuates, as shown in Figure 1f. The fluctuations increase with time, and the velocity varies between m/s and m/s. With , the velocity of the 1st vehicle decreases to m/s at s. It then increases to m/s at s and fluctuates, as shown in Figure 1g. The fluctuations increase with time, and the velocity varies between m/s and m/s. With , the velocity of the 1st vehicle decreases to m/s at s. It then increases to m/s at s and fluctuates, as shown in Figure 1h, varying between m/s and m/s. With , the velocity of the 1st vehicle decreases to m/s at s. It then increases to m/s at s and fluctuates, as shown in Figure 1i, varying between m/s and m/s.
The results obtained indicate that for the ID model, an increase in also increases the velocity fluctuations, as shown in Figure 1a–c. Thus, employing a constant leads to instability. Conversely, for the proposed model, an increase in decreases the velocity fluctuations, as shown in Figure 1d–i. This indicates that the traffic behavior with the proposed model is stable, even during adverse weather.
5. Performance Evaluation
Both the ID and proposed models are evaluated over a circular road of length m, with a platoon of 15 vehicles for s, using MATLAB. It is commonly employed for performance evaluation, as it is an interactive environment that integrates numerical and symbolic computations with scientific visualization [43]. MATLAB has a simple language that is ideal for quick prototyping. It can be more expensive than conventional C or Python compilers [44], but this is more than offset by the reduced development time [44].
The explicit Euler scheme [41] with time step s is employed to implement both models. The simulation parameters are given in Table 2. The maximum velocity is m/s, the time headway is s [42], and the minimum and maximum acceleration are m/s2 and m/s2, respectively [20]. The vehicle length is m [41] and the distance headway is m [40]. The proposed model is evaluated with and 0.9, and the ID model with , and . For a platoon of 15 vehicles, the jam spacing is m [41] and the maximum normalized density is . For a platoon of vehicles, the jam spacing is m [20] and the maximum normalized density is .
The traffic flow behavior of the ID and proposed models is given in Figure 2. This shows that for , the maximum flow with the ID model is 0 veh/s at a density of . The corresponding velocity is m/s, as shown in Figure 3. With , the maximum flow is veh/s at a density of , and the corresponding velocity is m/s. With , the maximum flow is veh/s at a density of 0.016, and the corresponding velocity is m/s, as shown in Figure 3. Table 3 indicates that the maximum flow and velocity increase with , whereas the density decreases.
For the proposed model, the maximum flow with is veh/s at a density of 0.017, as shown in Figure 2. The corresponding velocity is m/s, as shown in Figure 3. With and , the maximum flow is veh/s and veh/s at a density of and 0.021, respectively. The corresponding velocities are m/s and m/s, as shown in Figure 3. With and , the maximum flow is veh/s and veh/s at a density of and respectively. The corresponding velocities are m/s and m/s. With , the maximum flow is veh/s at a density of , and the corresponding velocity is m/s. Table 4 indicates that the maximum flow decreases as increases, whereas the maximum density increases and the corresponding velocity decreases.
Figure 4 presents the time-space velocity evolution of the queue due to traffic congestion for the ID and proposed models. This shows that, initially, the velocity in the queue is zero. For the ID model with , the queue dissipates at s, as shown in Figure 4a, while with , the queue dissipates at s, as shown in Figure 4b. The corresponding velocity is m/s and m/s, respectively. With , the initial queue dissipates at s, and the velocity after the queue is m/s, as shown in Table 5. The queue again develops at .0 s and lasts until s, as shown in Figure 4c. With , the maximum velocity is m/s, while with and , the maximum velocity is m/s and m/s, respectively. These results show that the maximum velocity increases as increases.
For the proposed model with , the queue exists between s and s. The velocity after the queue dissipates varies between m/s and m/s. The queue appears again at s and lasts until s, as shown in Figure 4d. With , the queue exists between s and s, and the velocity after the queue dissipates varies between m/s and m/s. The queue again develops at s and lasts until s, as shown in Figure 4e. With .55, the queue dissipates at s, as shown in Figure 4f, and the corresponding velocity is m/s. With and the queue dissipates at s and s, respectively, as shown in Figure 4g,h. The corresponding velocity is m/s and m/s, respectively. With , the queue dissipates at s, and the corresponding velocity is m/s, as shown in Figure 4g. With and , the maximum velocity is .0 m/s, with and it is m/s, and with it is m/s.
Figure 5 presents the time-space vehicle trajectories for a platoon of 15 vehicles with the ID and proposed models over a circular road of length m. The red trajectory is for the first vehicle, and the black trajectories are for the remaining 14 vehicles that follow the 1st vehicle. The positions with the ID and proposed models of the st, th, and th vehicles at s are given in Table 6. These results show that for the ID model with , the position of the st and th vehicles is m and m, respectively, and the position of the th vehicle is m, as shown in Figure 5a. With , the position of the st and th vehicles is m and m, respectively, as shown in Figure 5b, while with = 20, the position of the st and th vehicles is m and m, respectively, as shown in Figure 5c. With and , the position of the th vehicle is m and m, respectively. For the proposed model with , the position of the st and th vehicles is m and m, respectively, as shown in Figure 5d. With , the position of the st and th vehicles is m and m, respectively, as shown in Figure 5e, while with , the position of the st and th vehicles is m and m, respectively, as shown in Figure 5f. With and , the position of the th vehicle is m, as shown in Figure 5d–f. With , the position of the st and th vehicles is m and m, respectively, while the position of the th vehicle is m, as shown in Figure 5g. With , the position of the st and th vehicles is m and m, respectively, while the position of the th vehicle is m, as shown in Figure 5h. With , the position of the st and th vehicles is m and m, respectively, while the position of the th vehicle is m, as shown in Figure 5i. Table 6 indicates that as the exponent increases, the distance covered by the st and th vehicles increases, whereas the distance covered by the th vehicle decreases. Furthermore, with the proposed model, as increases, the distance covered by the st and th vehicles decreases, whereas the distance covered by the th vehicle increases.
Figure 6 presents the traffic flow evolution for the ID model with and over a circular road of length m. With , the flow increases to veh/s at s and then decreases to veh/s at s. It then decreases to veh/s at s. With , the flow increases to veh/s at s and then decreases to veh/s at s. It then increases to veh/s at s. With the flow increases to veh/s at s and then decreases to veh/s at s. The flow varies between veh/s and veh/s from s to s. Further, the flow rapidly increases to veh/s at s and then decreases to veh/s at s. Figure 6 indicates that variations in the traffic flow are greater with a larger .
Figure 7 presents the traffic flow evolution for the proposed model with and over a circular road of length m. With , the flow increases to veh/s at s and then decreases to veh/s at s. The flow varies between veh/s and veh/s from .0 s to s. It then rapidly increases to veh/s at s and then decreases to veh/s at s. With , the flow increases to veh/s at s and then decreases to veh/s at s. It varies between veh/s and veh/s from s to s. Then the flow rapidly increases to veh/s at s and then decreases to veh/s at s. With , the flow increases to veh/s at s and then decreases to veh/s at s. It then increases to veh/s at s and decreases to veh/s at s. With , the flow increases to veh/s at s and then decreases to veh/s at s. It then increases to veh/s at s and decreases to veh/s at s. With , the flow increases to veh/s at s and then decreases to veh/s at .0 s. It then increases to veh/s at s. With , the flow increases to veh/s at s and then decreases to veh/s at s. It then decreases to veh/s at s and increases to veh/s at s. Figure 7 indicates that the variations in traffic flow are smaller during adverse weather than in normal weather.
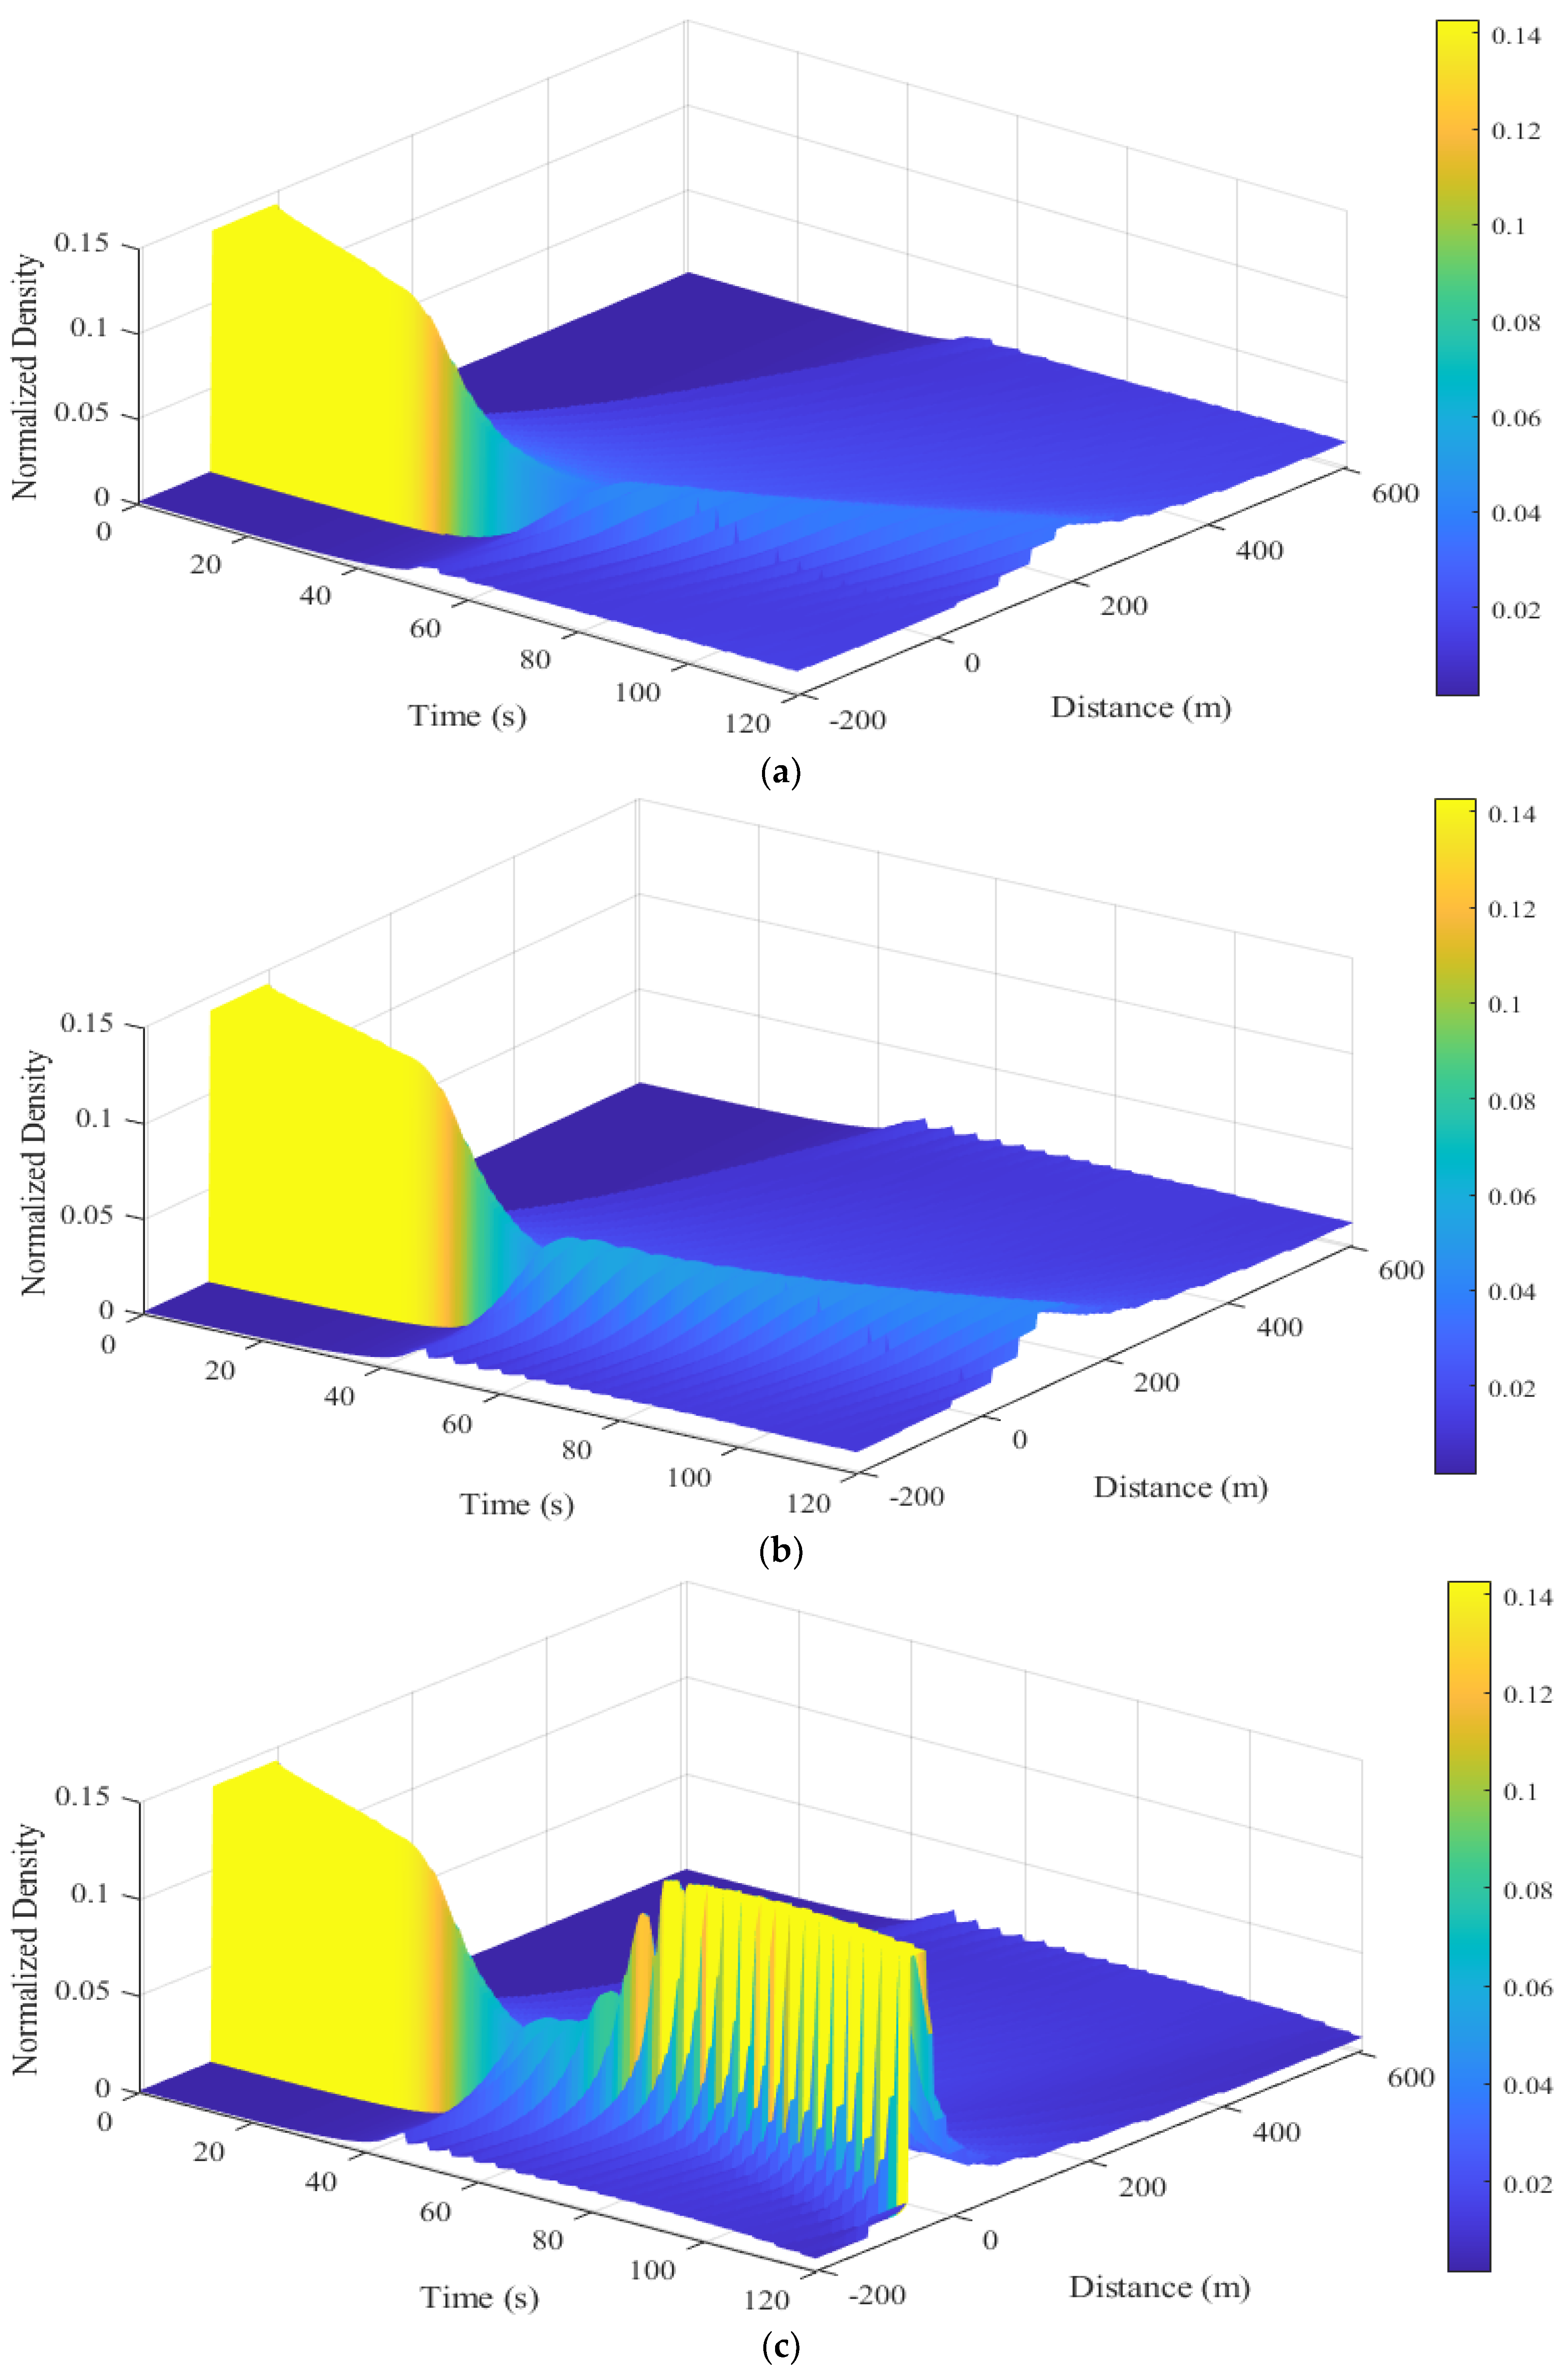
The traffic density behavior of the ID and proposed models is given in Figure 8. This shows that for the ID model with , the density between m and 29.97 m at s is . It then increases to at m and decreases to at m, as shown in Figure 8a. The density between s and s at m is , which indicates a traffic queue. After the queue dissipates, the density at s gradually decreases to at m, as shown in Figure 8a. With = 4, the density between m and m at s is . It then increases to at m, decreases to at m, and decreases further at m, as shown in Figure 8b. The density between s and s is , which indicates a traffic queue. The queue then gradually dissipates, and at s, the density decreases to at m, as shown in Figure 8b. With = 20, the density between m and m at s is which indicates a traffic queue. The density then decreases to at m, as shown in Figure 8c. The density between s and .0 s is which indicates a traffic queue. The density at s gradually decreases to at s. The queue develops again at .0 s and m, with a density of , and at s is between m and m, as shown in Figure 8c. Figure 8a–c show that as increases the changes in density over time increase, which indicates that the model is not stable.
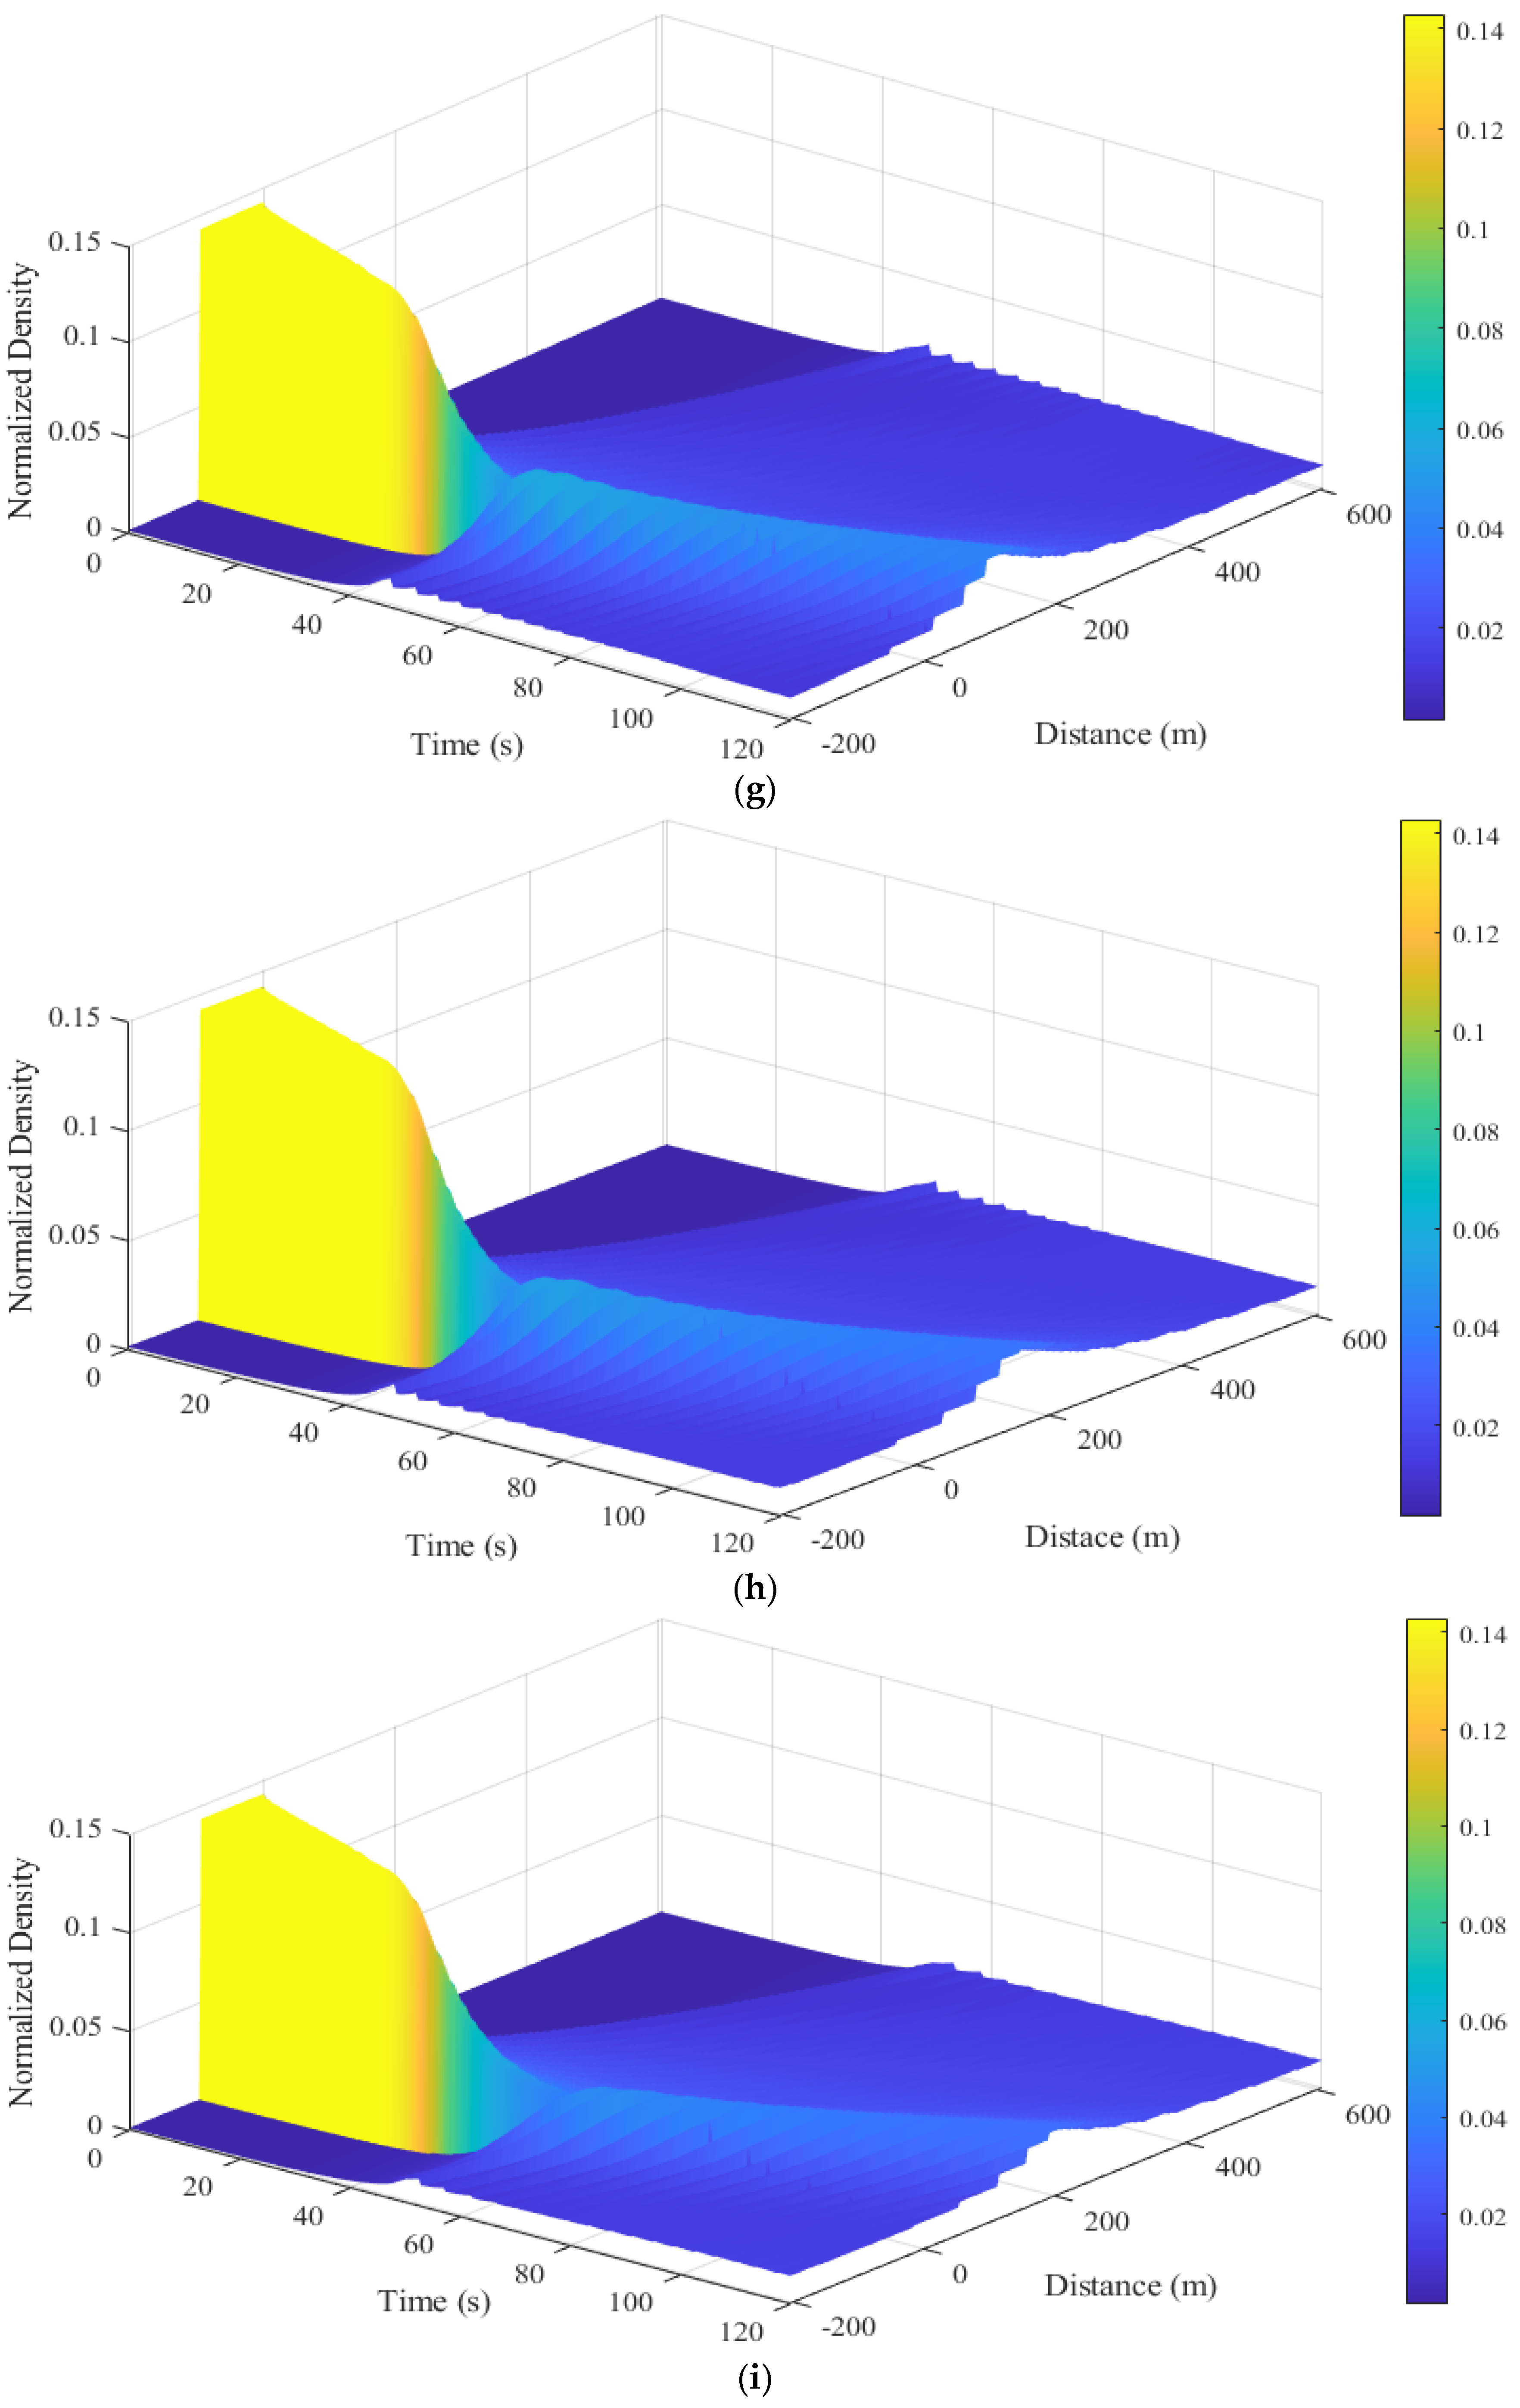
For the proposed model with , the density between m and m at s is , which indicates a traffic queue. After the queue dissipates, the density decreases to at m and then to at m, where it remains, as shown in Figure 8d. The density between s and .0 s at m is , which indicates a traffic queue. After the queue dissipates, the density at s gradually decreases to at m. The queue again develops at s and m, with a density of and remains until s, as shown in Figure 8d. With , the density between m and m at s is 0.14, which indicates a traffic queue. The density then decreases to at m and at m, where it remains, as shown in Figure 8e. The density between s and s is 0.14, which indicates a queue. After the queue dissipates, the density gradually decreases to at s and m. The queue again develops at s and m, with a density of and remains until s, as shown in Figure 8e. With , the density between m and m at s is . It then increases to at m and decreases to at m, where it remains, as shown in Figure 8f. The density between s and s is which indicates a traffic queue. After the queue dissipates, the density at s decreases to at m and then to at s at m, as shown in Figure 8f. With , the density between m and m at s is . It then increases to at and decreases to at m, where it remains, as shown in Figure 8g. The density between s and s is which indicates a queue. After the queue dissipates, the density at .0 s gradually decreases to at m. It then decreases to at s and m, as shown in Figure 8g. With , the density between m and m at s is . It then increases to at m and decreases to at m, as shown in Figure 8h. The density between s and s is which indicates a queue. After the queue dissipates, the density decreases to at s and m and then to at s and m, as shown in Figure 8h. With , the density between m and m at s is . It increases to at m and decreases to at m, as shown in Figure 8i. The density between s and s is which indicates a queue. After the queue dissipates, the density decreases to at s and m and then to at s and m, as shown in Figure 8i. Figure 8d–i show that as the weather severity index increases, the changes in density with the proposed model decrease over time, which is realistic.
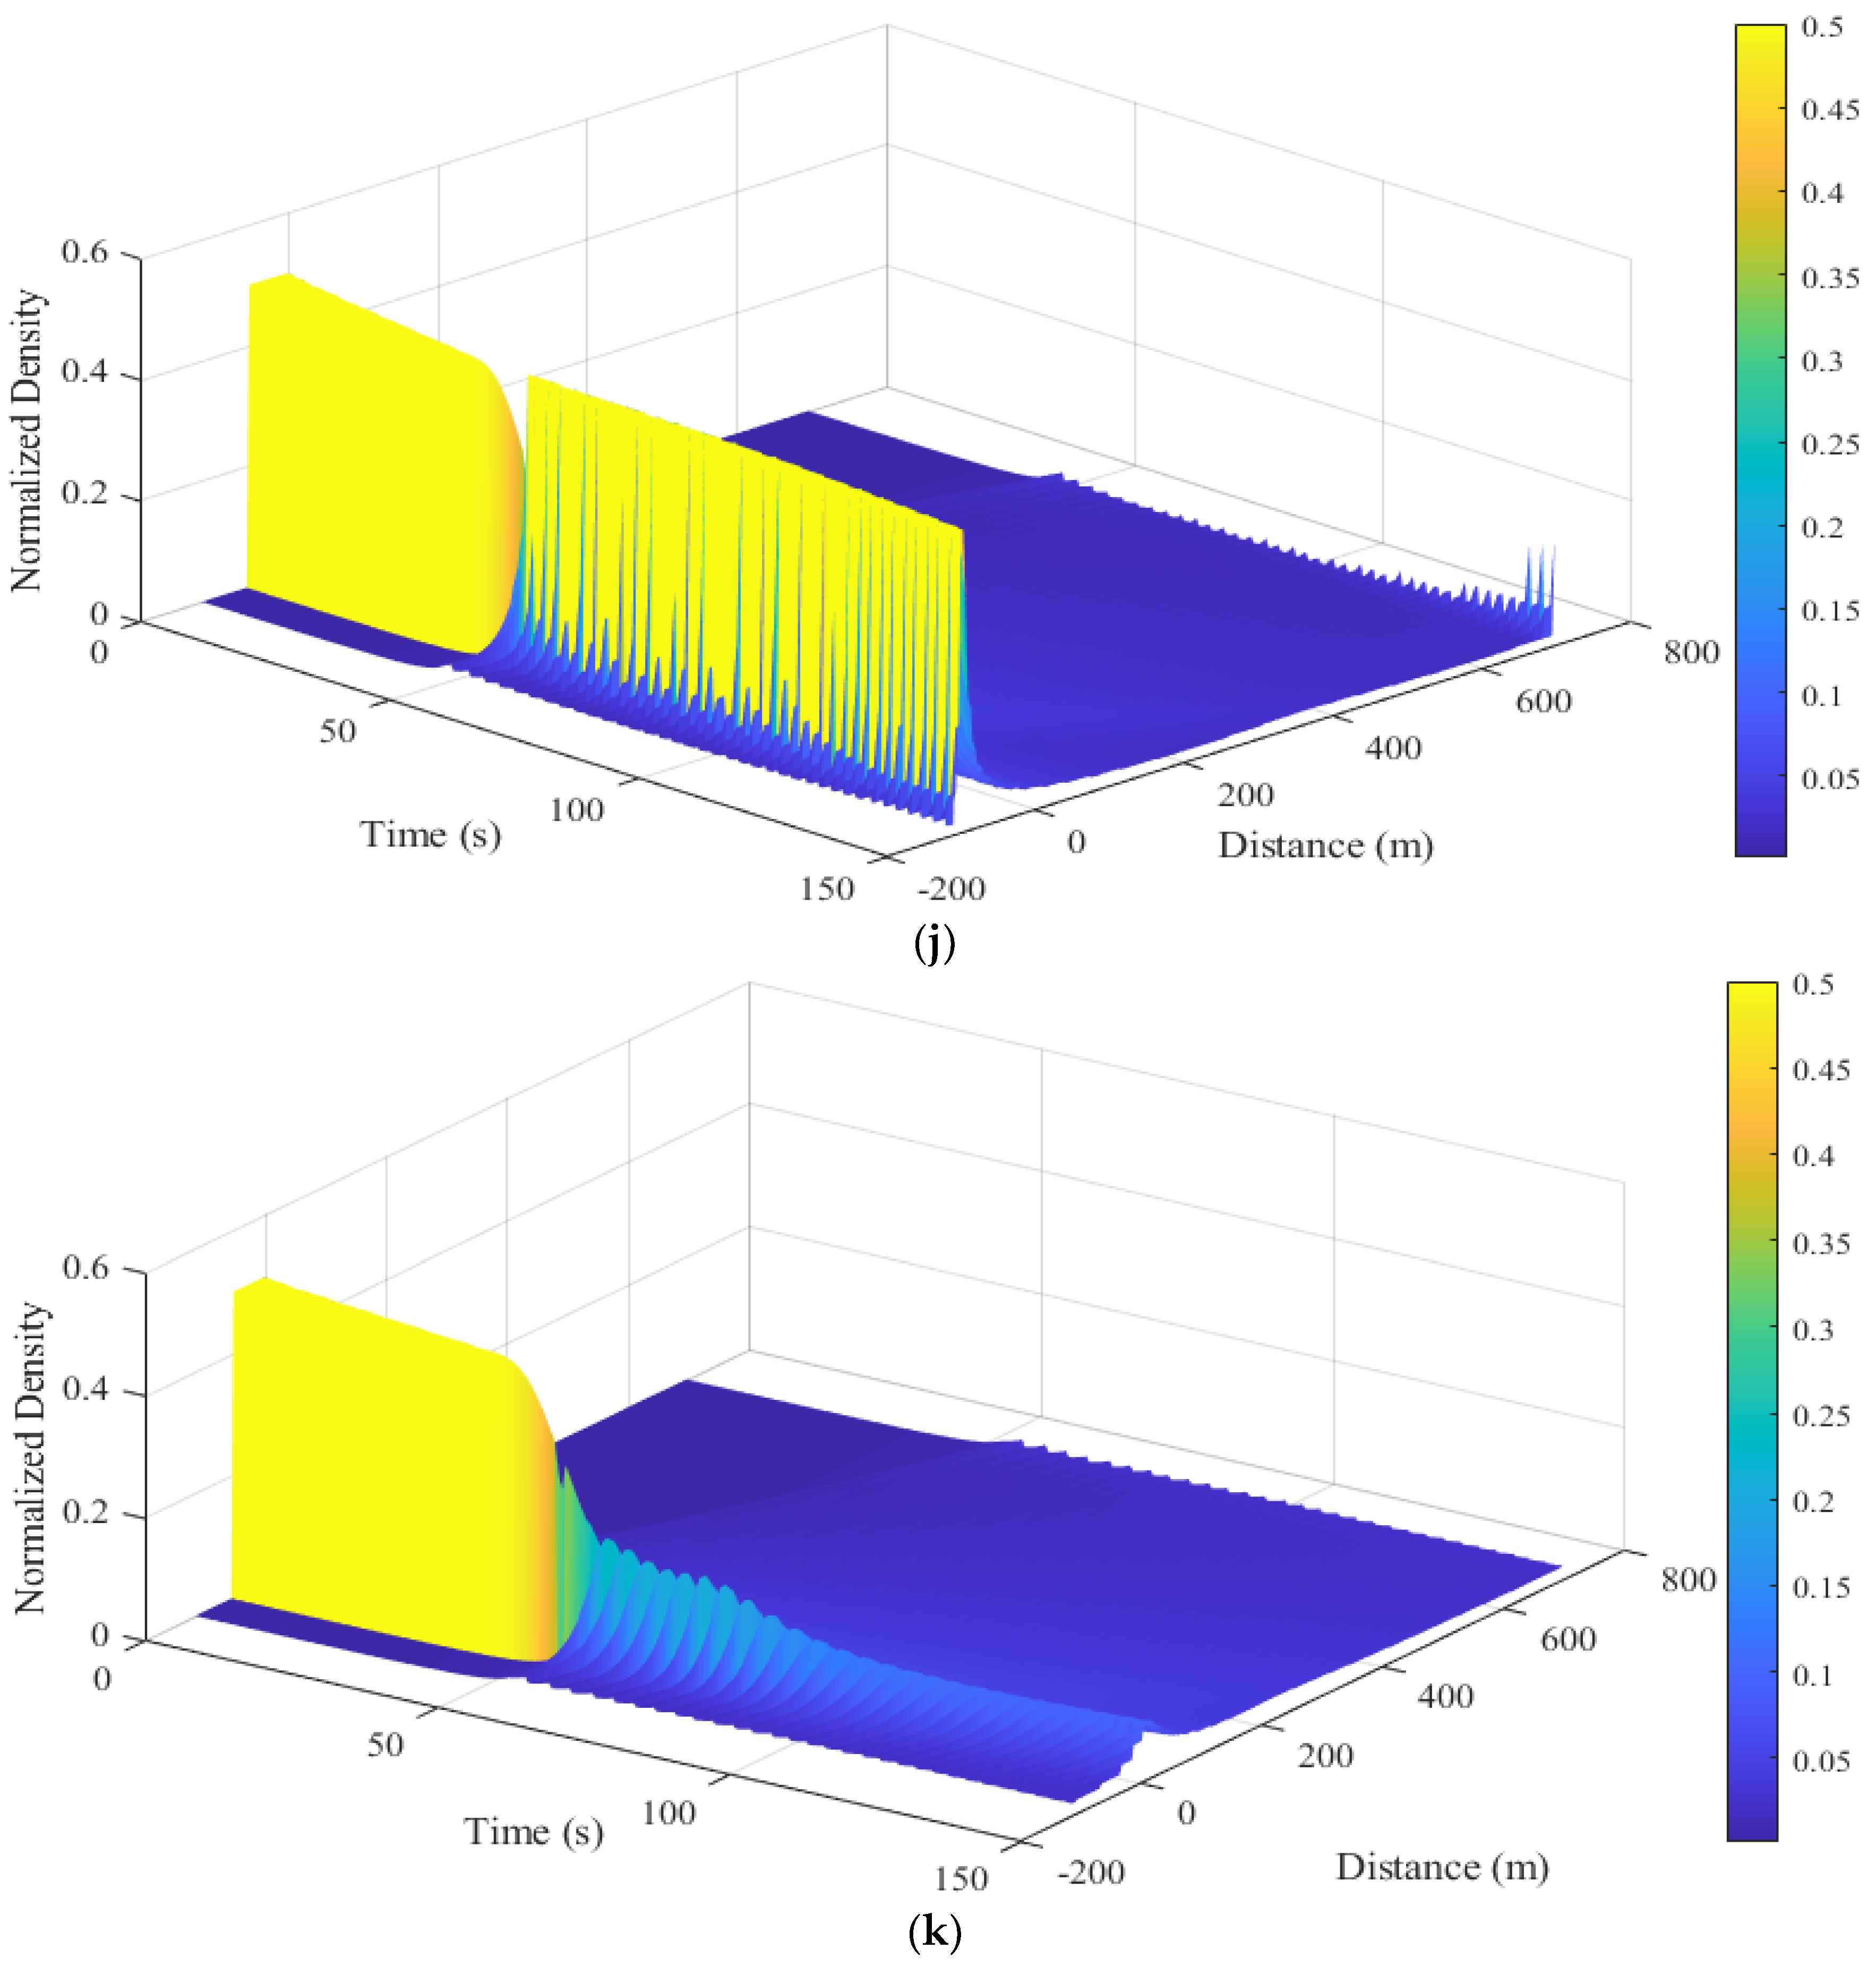
The density of the proposed model for a platoon of vehicles with and is presented in Figure 8j,k, respectively. With the density between m and m at s is , which indicates a traffic queue. After the queue dissipates, the density decreases to at m and remains there until m. It then increases to at m, as shown in Figure 8j. The density between s and s at m is , which indicates a traffic queue. The density at s gradually decreases to at m. The queue again develops at s and m, with a density of and remains there until s, as shown in Figure 8j. With , the density between m and m at s is . It increases to at m and decreases to at m, where it remains, as shown in Figure 8k. The density between s and s is , which indicates a traffic queue. After the queue dissipates, the density decreases to at s and m and then decreases to at s and m, as shown in Figure 8k.
The above results show that the changes in velocity and density with the proposed model decrease as the weather becomes more adverse. This holds when the platoon of vehicles is increased from 15 to 30, as indicated in Figure 8j,k. Conversely, the ID model velocity and density depend on a constant exponent , which results in unrealistic traffic behavior. For example, large changes in density occur with , which increase over time, whereas they should decrease. Furthermore, vehicles move slower with a larger exponent . With the proposed model, vehicles move based on the weather severity index , and are slower with a larger , as expected. This is because drivers are more cautious in adverse weather. In addition, the flow is smoother with the proposed model compared to the ID model. Moreover, the variations in flow are smaller during adverse weather with the proposed model, but the variations with the ID model increase with .
6. Conclusions
The weather has a significant impact on traffic behavior. Snow, ice, and rain reduce road friction, which leads to higher accident rates. In this paper, a microscopic traffic flow model was proposed that characterizes traffic behavior based on the road surface conditions. These conditions were determined using the weather severity index. The performance of this model was evaluated for different weather severity indices and compared with the ID model over a circular road of length 800 m. Results were presented that show during adverse weather, the changes in density with the proposed model are smaller than with the ID model. With the ID model, the traffic queue does not dissipate with a larger exponent , which is unrealistic. Conversely, with the proposed model, the queue dissipates quickly with a larger weather severity index (adverse weather), while it dissipates slowly with a smaller index (normal weather), as expected. Moreover, vehicle movement with the ID model is based on a constant , which leads to unrealistic traffic behavior. Conversely, vehicle motion with the proposed model is based on the weather severity index, which results in a smooth flow that is realistic. The variations in flow are smaller than with the ID model. Further, the ID model velocity exhibits oscillatory behavior that increases with ; thus, the model can be unstable. Conversely, the oscillations with the proposed model decrease with an increase in the weather severity index, as expected.
The results obtained suggest that the proposed model can be employed in adaptive cruise control (ACC) systems and connected and automated vehicles (CAVs) for effective traffic control. It can also be incorporated into advanced driver assistance systems (ADASs) to improve traffic safety by providing information about road surface conditions during adverse weather. Existing studies based on data obtained in the field are limited by the variability in weather conditions and the type and amount of data obtained. Thus, future research can incorporate weather parameters, such as radiation, temperature, visibility, and wind obtained in real-time from roadside units.
Author Contributions
Conceptualization, F.A. and Z.H.K.; methodology, F.A.; software, F.A.; validation, F.A., Z.H.K., K.S.K. and T.A.G.; formal analysis, F.A., Z.H.K., K.S.K. and T.A.G.; investigation, F.A., Z.H.K., K.S.K. and T.A.G.; writing—original draft, F.A.; writing—review and editing, F.A., Z.H.K., K.S.K. and T.A.G.; visualization, F.A., Z.H.K., K.S.K. and T.A.G.; funding acquisition, Z.H.K., K.S.K. and T.A.G. All authors have read and agreed to the published version of the manuscript.
Funding
This research received no external funding.
Institutional Review Board Statement
Not applicable.
Informed Consent Statement
Not applicable.
Data Availability Statement
Not applicable.
Conflicts of Interest
The authors declare no conflict of interest.
References
- Khan, Z.H.; Shah, S.A.A.; Gulliver, T.A. A macroscopic traffic model based on weather conditions. Chin. Phys. B 2018, 27, 70202. [Google Scholar] [CrossRef]
- Knapp, K.K.; Smithson, L.D. Winter storm event volume impact analysis using multiple source archived monitoring data. Transp. Res. Rec. 2000, 1700, 10–16. [Google Scholar] [CrossRef]
- Andreescu, M.P.; Frost, D.B. Weather and traffic accidents in Montreal, Canada. Clim. Res. 1998, 9, 225–230. [Google Scholar] [CrossRef] [Green Version]
- Norrman, J.; Eriksson, M.; Lindqvist, S. Relationships between road slipperiness, traffic accident risk and winter road maintenance activity. Clim. Res. 2000, 15, 185–193. [Google Scholar] [CrossRef] [Green Version]
- Lee, W.K.; Lee, H.A.; Hwang, S.S.; Kim, H.; Lim, Y.H.; Hong, Y.C.; Ha, E.H.; Park, H. Does temperature modify the effects of rain and snow precipitation on road traffic injuries. J. Epidemiol. 2015, 25, 544–552. [Google Scholar] [CrossRef] [Green Version]
- Shbeeb, L.; Hazim, N. Modelling the effects of environmental factors on traffic flow parameters. Int. J. Eng. Res. Technol. 2019, 12, 2910–2924. [Google Scholar]
- Farooq, D.; Moslem, S.; Jamal, A.; Butt, F.M.; Almarhabi, Y.; Faisal, T.R.; Almoshaogeh, M. Assessment of significant factors affecting frequent lane-changing related to road safety: An integrated approach of the AHP–BWM model. Int. J. Environ. Res. Public Health. 2021, 18, 10628. [Google Scholar] [CrossRef]
- Li, G.; Li, Y.; Li, Y.; Craig, B.; Wu, X. Investigation of contributing factors to traffic crash severity in southeast Texas using multiple correspondence analysis. J. Road Saf. 2021, 32, 15–28. [Google Scholar] [CrossRef]
- Qiu, L.; Nixon, W.A. Effects of adverse weather on traffic crashes: Systematic review and meta-analysis. Transp. Res. Rec. 2008, 2055, 139–146. [Google Scholar] [CrossRef]
- Theofilatos, A.; Yannis, G. A review of the effect of traffic and weather characteristics on road safety. Accid. Anal. Prev. 2014, 72, 244–256. [Google Scholar] [CrossRef]
- McBride, J.C. Economic Impact of Highway Snow and Ice Control; Impact of Highway Snow and Ice Control; Federal Highway Administration: Washington, DC, USA, 1997.
- Ali, F.; Khan, Z.H.; Khan, F.A.; Khattak, K.S.; Gulliver, T.A. A new driver model based on driver response. Appl. Sci. 2022, 12, 5390. [Google Scholar] [CrossRef]
- Chen, C.; Zhao, X.; Liu, H.; Ren, G.; Zhang, Y.; Liu, X. Assessing the influence of adverse weather on traffic flow characteristics using a driving simulator and VISSIM. Sustainability 2019, 11, 830. [Google Scholar] [CrossRef] [Green Version]
- Sohrabi, S.; Khodadadi, A.; Mousavi, S.M.; Dadashova, B.; Lord, D. Quantifying the automated vehicle safety performance: A scoping review of the literature, evaluation of methods, and directions for future research. Accid. Anal. Prev. 2021, 152, 106003. [Google Scholar] [CrossRef] [PubMed]
- Yoneda, K.; Suganuma, N.; Yanase, R.; Aldibaja, M. Automated driving recognition technologies for adverse weather conditions. IATSS Res. 2019, 43, 253–262. [Google Scholar] [CrossRef]
- Henein, C.M.; White, T. Microscopic information processing and communication in crowd dynamics. Phys. A Stat. Mech. Appl. 2010, 389, 4636–4653. [Google Scholar] [CrossRef]
- Khan, Z.H.; Gulliver, T.A. A macroscopic traffic model for traffic flow harmonization. Eur. Transp. Res. Rev. 2018, 10, 30. [Google Scholar] [CrossRef]
- Imran, W.; Khan, Z.H.; Gulliver, T.A.; Khattak, K.S.; Nasir, H. A macroscopic traffic model for heterogeneous flow. Chin. J. Phys. 2020, 63, 419–435. [Google Scholar] [CrossRef]
- Newell, G.F. Nonlinear effects in the dynamics of car following. Oper. Res. 1961, 9, 209–229. [Google Scholar] [CrossRef]
- Treiber, M.; Hennecke, A.; Helbing, D. Congested traffic states in empirical observations and microscopic simulations. Phys. Rev. E. 2000, 62, 1805–1824. [Google Scholar] [CrossRef] [Green Version]
- Bando, M.; Hasebe, K.; Nakayama, A.; Shibata, A.; Sugiyama, Y. Dynamical model of traffic congestion and numerical simulation. Phys. Rev. E. 1995, 51, 1035–1042. [Google Scholar] [CrossRef]
- Helbing, D.; Tilch, B. Generalized force model of traffic dynamics. Phys. Rev. E. 1998, 58, 133–138. [Google Scholar] [CrossRef]
- Gipps, P.G. A behavioural car-following model for computer simulation. Transp. Res. Part B. 1981, 15, 105–111. [Google Scholar] [CrossRef]
- Cao, Z.; Lu, L.; Chen, C.; Chen, X.U. Modeling and simulating urban traffic flow mixed with regular and connected vehicles. IEEE Access 2021, 9, 10392–10399. [Google Scholar] [CrossRef]
- Dahui, W.; Ziqiang, W.; Ying, F. Hysteresis phenomena of the intelligent driver model for traffic flow. Phys. Rev. E 2007, 76, 2–8. [Google Scholar] [CrossRef] [PubMed]
- Kesting, A.; Treiber, M.; Helbing, D. Enhanced intelligent driver model to access the impact of driving strategies on traffic capacity. Philos. Trans. R. Soc. A Math. Phys. Eng. Sci. 2010, 368, 4585–4605. [Google Scholar] [CrossRef] [Green Version]
- Liebner, M.; Baumann, M.; Klanner, F.; Stiller, C. Driver intent inference at urban intersections using the intelligent driver model. In Proceedings of the IEEE Intelligent Vehicle Symposium, Madrid, Spain, 3–7 June 2012. [Google Scholar]
- Derbel, O.; Peter, T.; Zebiri, H.; Mourllion, B.; Basset, M. Modified intelligent driver model for driver safety and traffic stability improvement. IFAC Proc. 2013, 46, 744–749. [Google Scholar] [CrossRef]
- Jamal, A.; Zahid, M.; Rahman, M.T.; Al-Ahmadi, H.M.; Almoshaogeh, M.; Farooq, D.; Ahmad, M. Injury severity prediction of traffic crashes with ensemble machine learning techniques: A comparative study. Int. J. Inj. Contr. Saf. Promot. 2021, 28, 408–427. [Google Scholar] [CrossRef]
- Ijaz, M.; Lan, L.; Usman, S.M.; Zahid, M.; Jamal, A. Investigation of factors influencing motorcyclist injury severity using random parameters logit model with heterogeneity in means and variances. Int. J. Crashworthiness 2022, 27, 1412–1422. [Google Scholar] [CrossRef]
- Ahmed, F.; Rose, G.; Jakob, G. Commuter cyclist travel behavior: Examination of the impact of changes in weather. Transp. Res. Rec. 2013, 2387, 76–82. [Google Scholar] [CrossRef]
- Borowska-Stefańska, M.; Mikusova, M.; Kowalski, M.; Kurzyk, P.; Wiśniewski, S. Changes in urban mobility related to the public bike system with regard to weather conditions and statutory retail restrictions. Remote Sens. 2021, 13, 3597. [Google Scholar] [CrossRef]
- Böcker, L.; Dijst, M.; Prillwitz, J. Impact of everyday weather on individual daily travel behaviours in perspective: A literature review. Transp. Rev. 2013, 33, 71–91. [Google Scholar] [CrossRef]
- Lu, Z.; Kwon, T.J.; Fu, L. Effects of winter weather on traffic operations and optimization of signalized intersections. J. Traffic Transp. Eng. 2019, 6, 196–208. [Google Scholar] [CrossRef]
- Cao, L.; Thakali, L.; Fu, L.; Donaher, G. Effect of weather and road surface conditions on traffic speed of rural highways. In Proceedings of the Transportation Research Board Annual Meeting, Washington, DC, USA, 13–17 January 2013. [Google Scholar]
- Maze, T.H.; Agarwal, M.; Burchett, G. Whether weather matters to traffic demand, traffic safety, and traffic operations and flow. Transp. Res. Rec. 2006, 1948, 170–176. [Google Scholar] [CrossRef]
- Nookala, L.S. Weather Impact on Traffic Conditions and Travel Time Prediction. Master’s Thesis, Department of Computer Science, University of Minnesota Duluth, Duluth, MN, USA, 2006. [Google Scholar]
- Dahmane, K.; Duthon, P.; Bernardin, F.; Colomb, M.; Chausse, F.; Blanc, C. Weathereye-proposal of an algorithm able to classify weather conditions from traffic camera images. Atmosphere 2021, 12, 717. [Google Scholar] [CrossRef]
- Malinauskas, R. The Intelligent Driver Model: Analysis and Application to Adaptive Cruise control. Ph.D. Thesis, Clemson University, Clemson, SC, USA, 2014. [Google Scholar]
- Khan, Z.H.; Gulliver, T.A. A macroscopic traffic model based on anticipation. Arab. J. Sci. Eng. 2019, 44, 5151–5163. [Google Scholar] [CrossRef]
- Kessels, F. Traffic Flow Modelling: Introduction to Traffic Flow Theory Through a Genealogy of Models; Springer: Cham, Switzerland, 2019. [Google Scholar]
- Khansari, E.R.; Tabibi, M.; Nejad, F.M. A study on following behavior based on the time headway. J. Kejuruter. 2020, 32, 187–195. [Google Scholar]
- Etter, D.M.; Kuncicky, D.C.; Hull, D.W. Introduction to MATLAB; Prentice Hall: Hoboken, NJ, USA, 2002. [Google Scholar]
- Advantages and Disadvantages of MATLAB—Javatpoint. Available online: https://www.javatpoint.com/advantages-and-disadvantages-of-matlab (accessed on 20 November 2022).
Figure 1.
The velocity of the ID and proposed models with an initial equilibrium velocity of m/s: (a) ID model, ; (b) ID model, ; (c) ID model, ; (d) proposed model, ; (e) proposed model, ; (f) proposed model, ; (g) proposed model, ; (h) proposed model, ; (i) proposed model, .
Figure 1.
The velocity of the ID and proposed models with an initial equilibrium velocity of m/s: (a) ID model, ; (b) ID model, ; (c) ID model, ; (d) proposed model, ; (e) proposed model, ; (f) proposed model, ; (g) proposed model, ; (h) proposed model, ; (i) proposed model, .
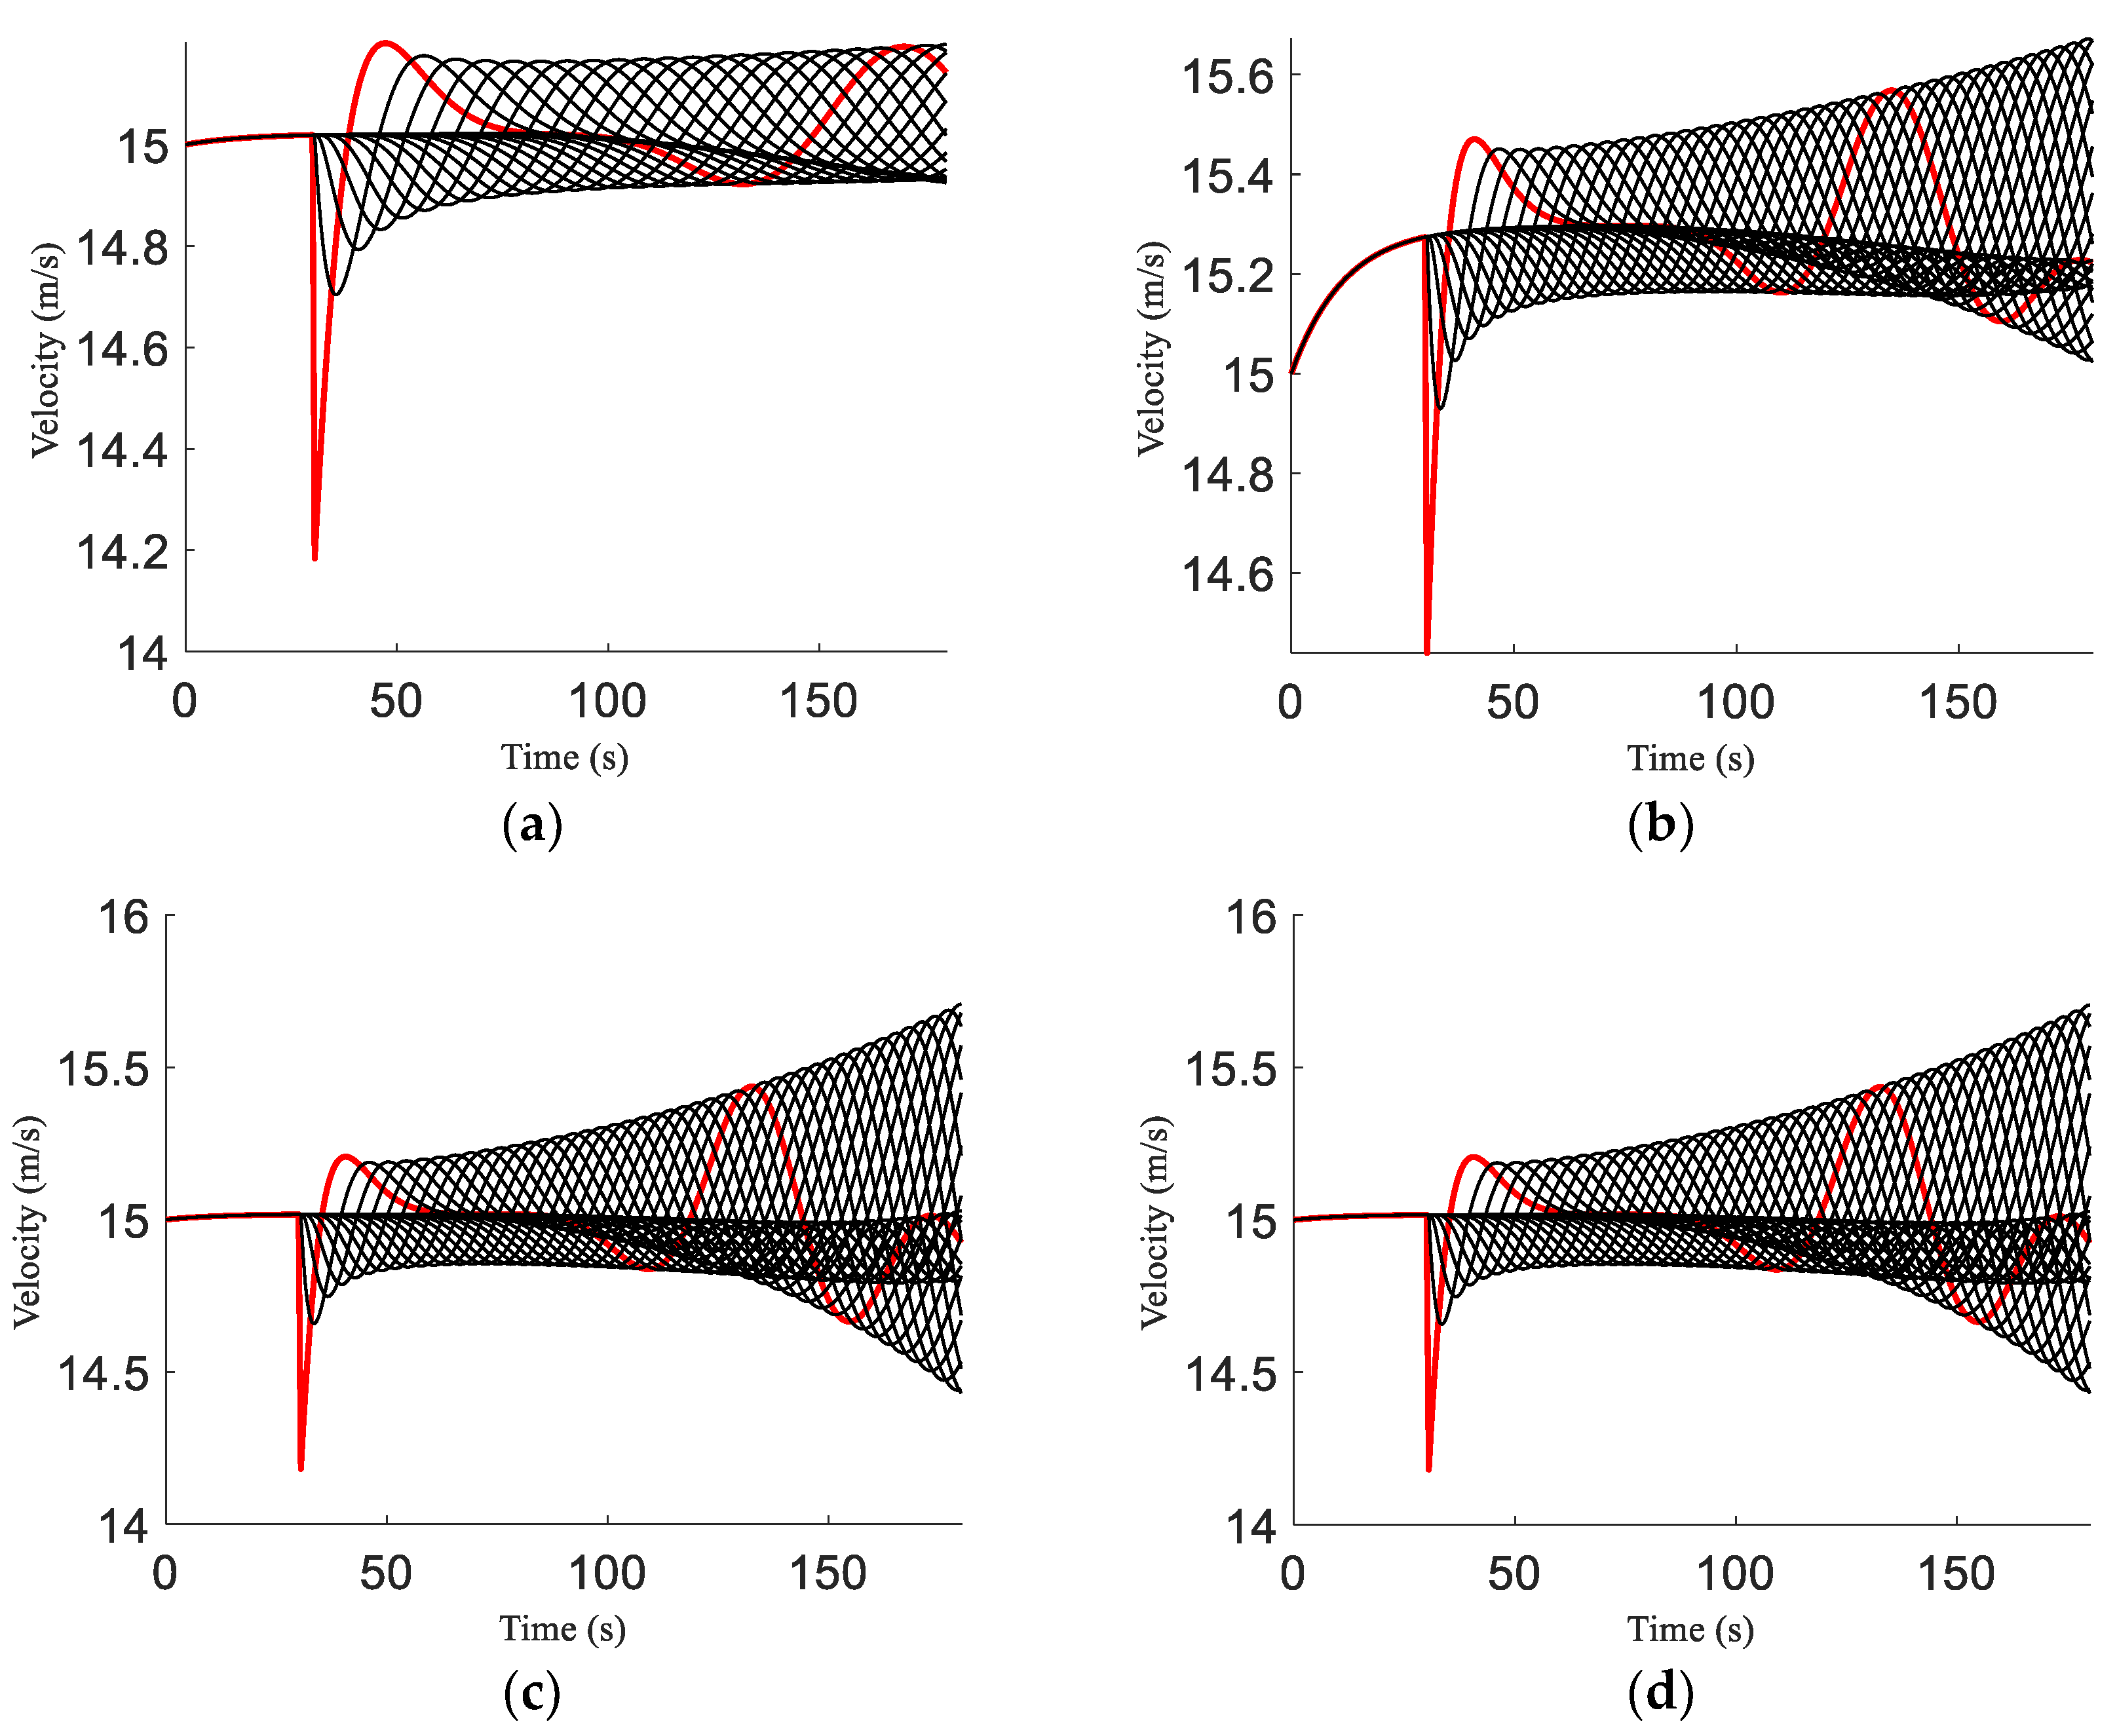

Figure 2.
Flow for the ID and proposed models over an m circular road for different acceleration exponents and weather severity indices, respectively.
Figure 2.
Flow for the ID and proposed models over an m circular road for different acceleration exponents and weather severity indices, respectively.
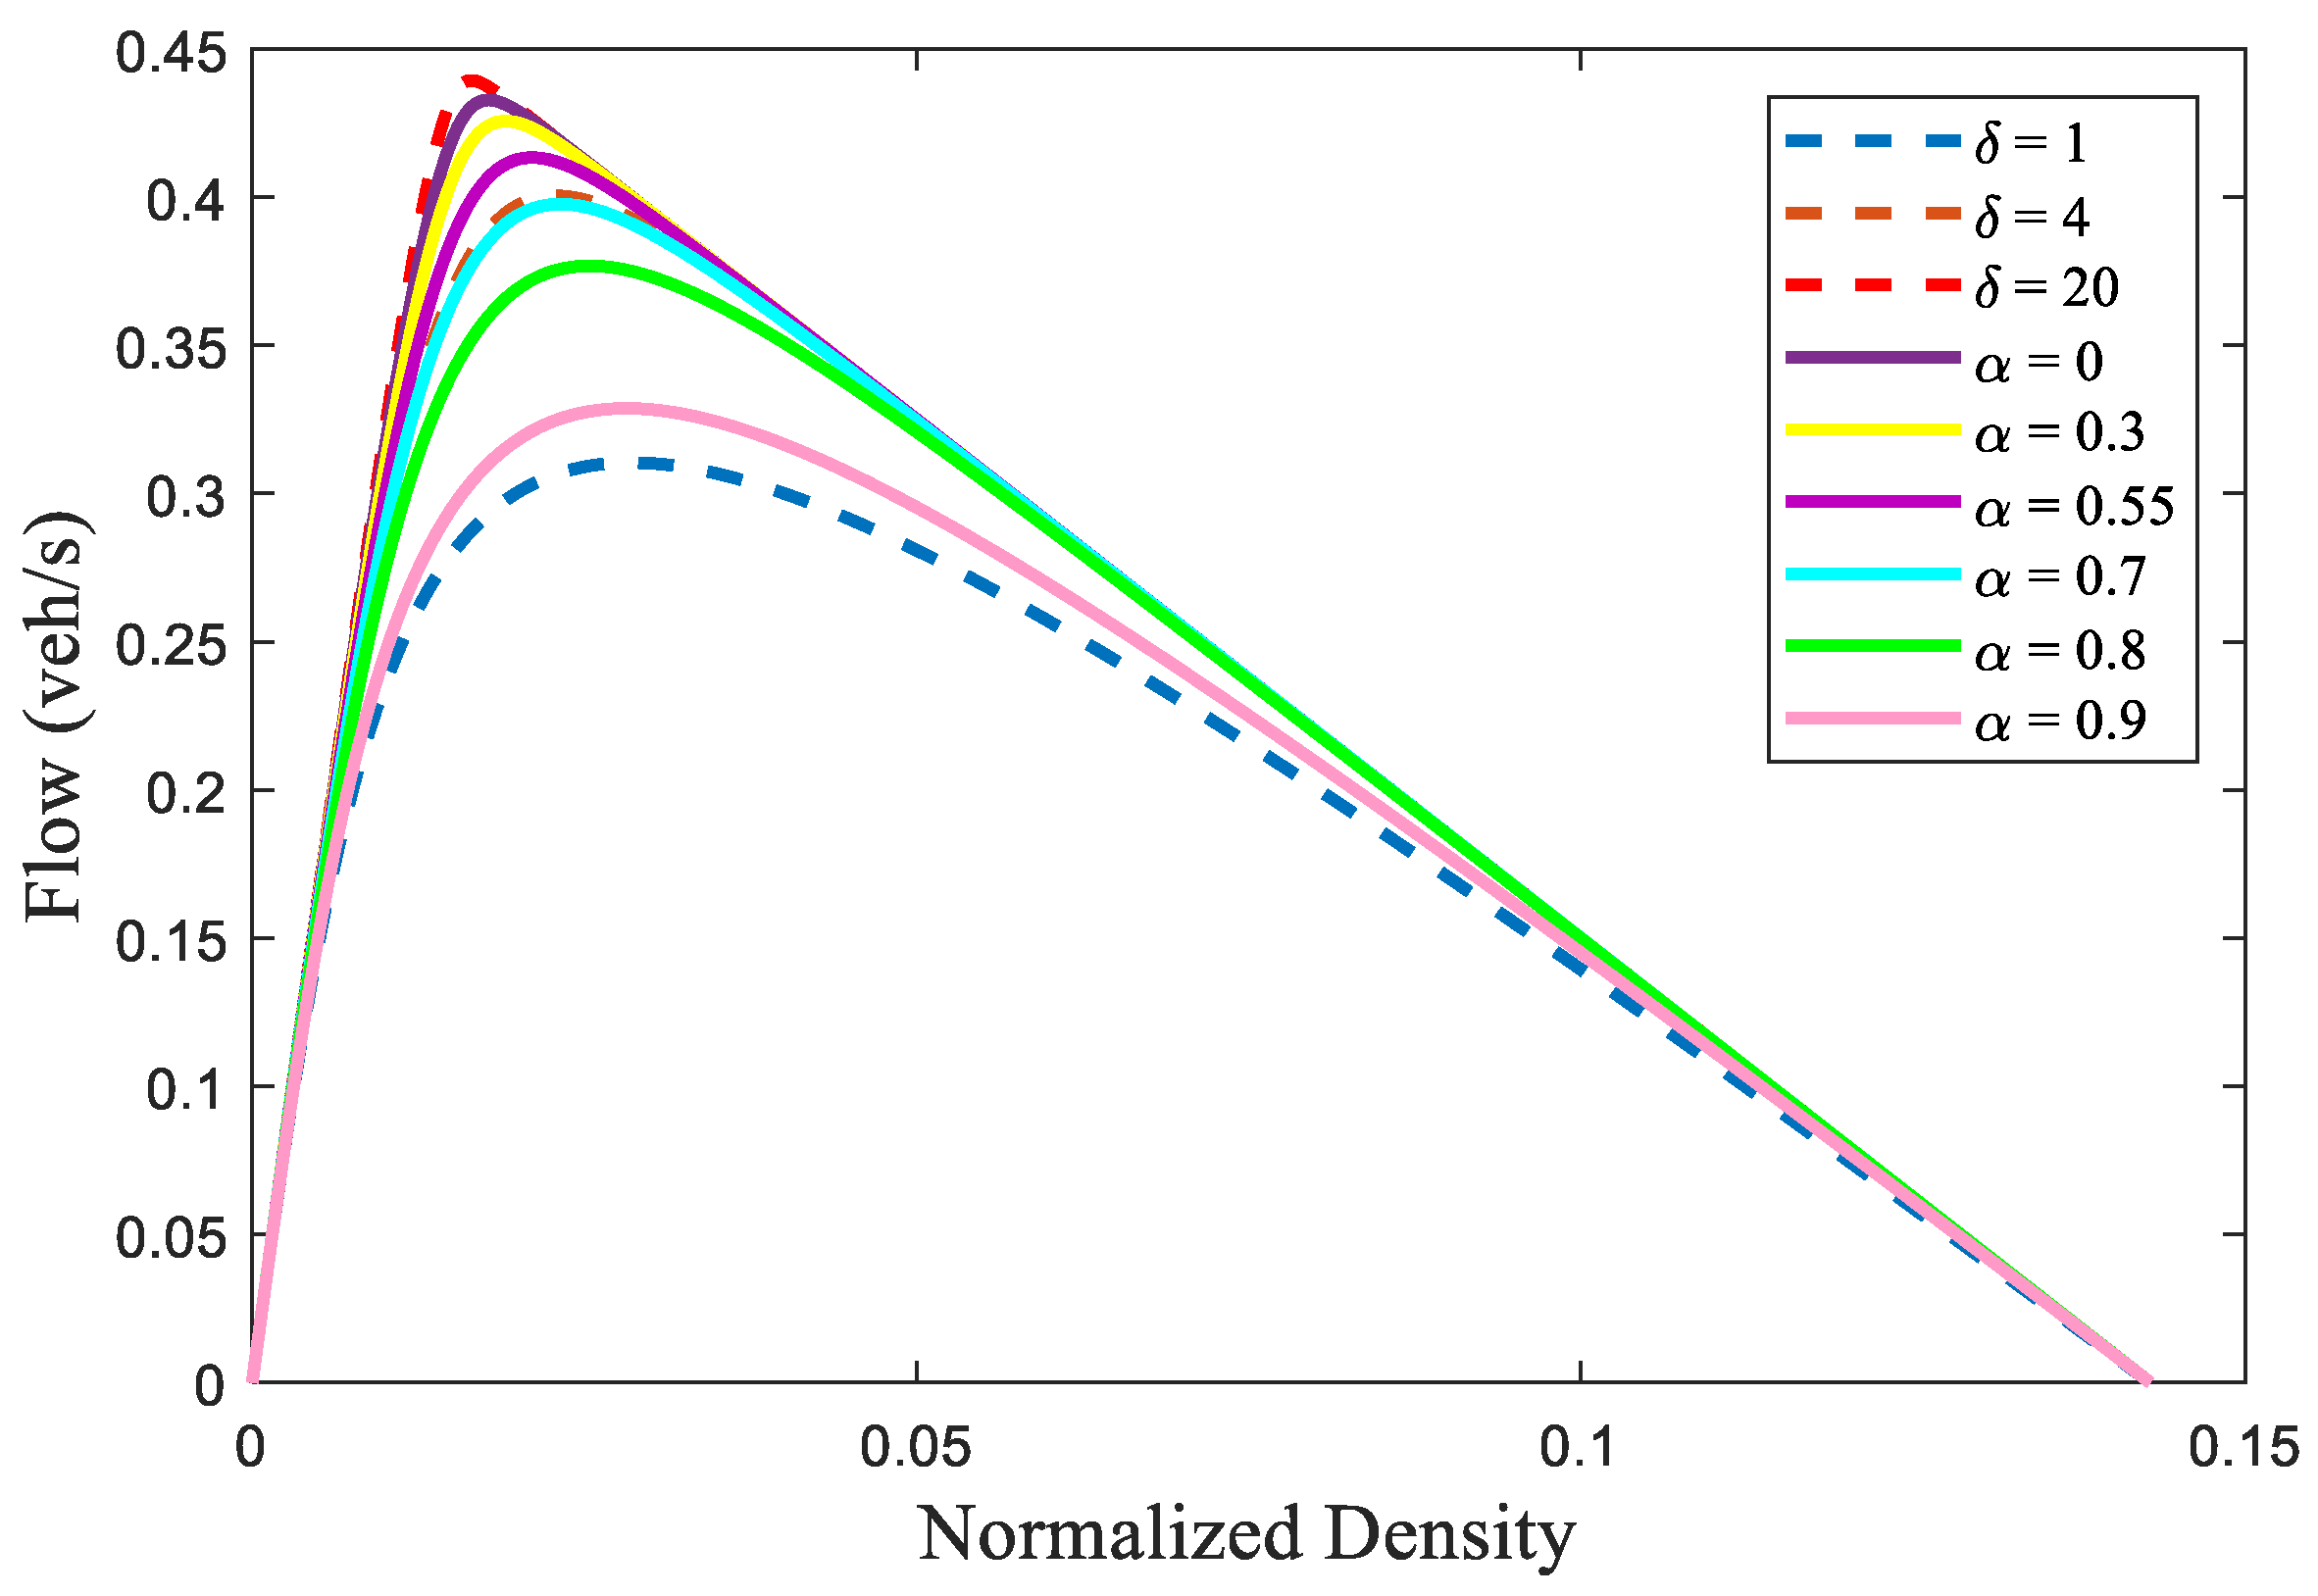
Figure 3.
Velocity for the ID and proposed models over an m circular road for different acceleration exponents and weather severity indices, respectively.
Figure 3.
Velocity for the ID and proposed models over an m circular road for different acceleration exponents and weather severity indices, respectively.
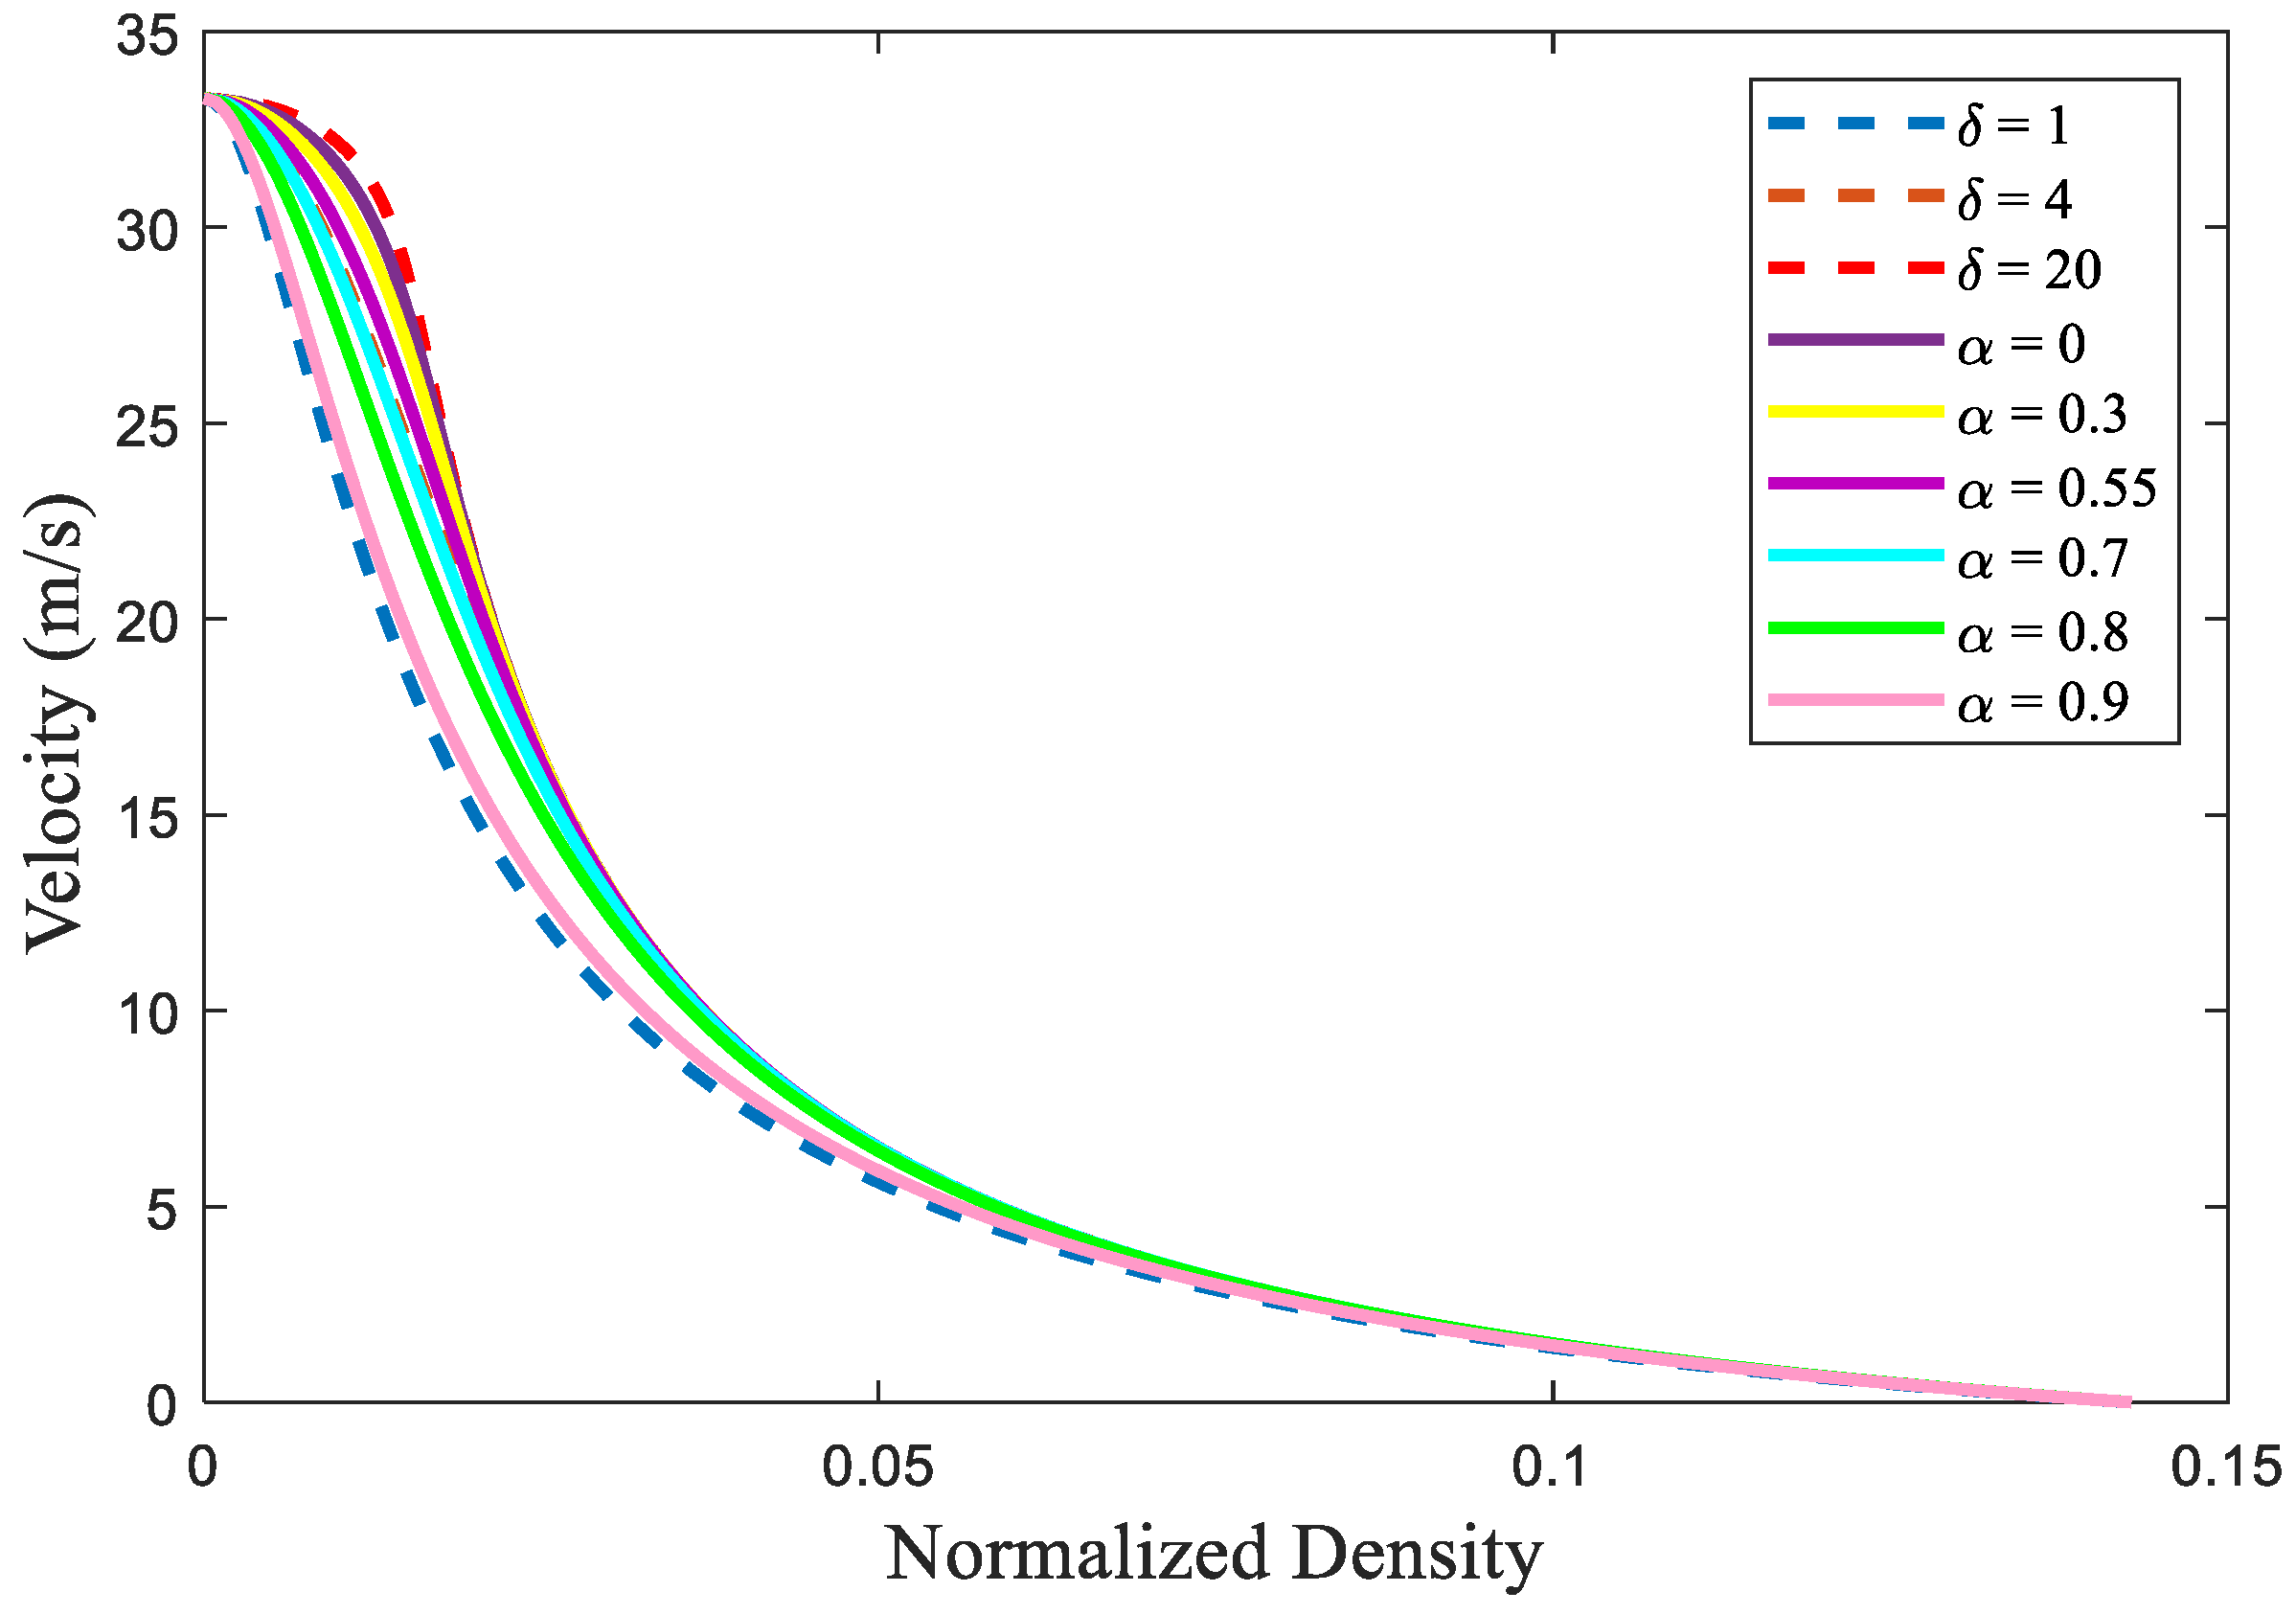
Figure 4.
Time-space velocity evolution for the ID and proposed models over an 800 m circular road: (a) ID model, ; (b) ID model, ; (c) ID model, ; (d) proposed model, ; (e) proposed model, ; (f) proposed model, ; (g) proposed model, ; (h) proposed model, ; (i) proposed model, .
Figure 4.
Time-space velocity evolution for the ID and proposed models over an 800 m circular road: (a) ID model, ; (b) ID model, ; (c) ID model, ; (d) proposed model, ; (e) proposed model, ; (f) proposed model, ; (g) proposed model, ; (h) proposed model, ; (i) proposed model, .
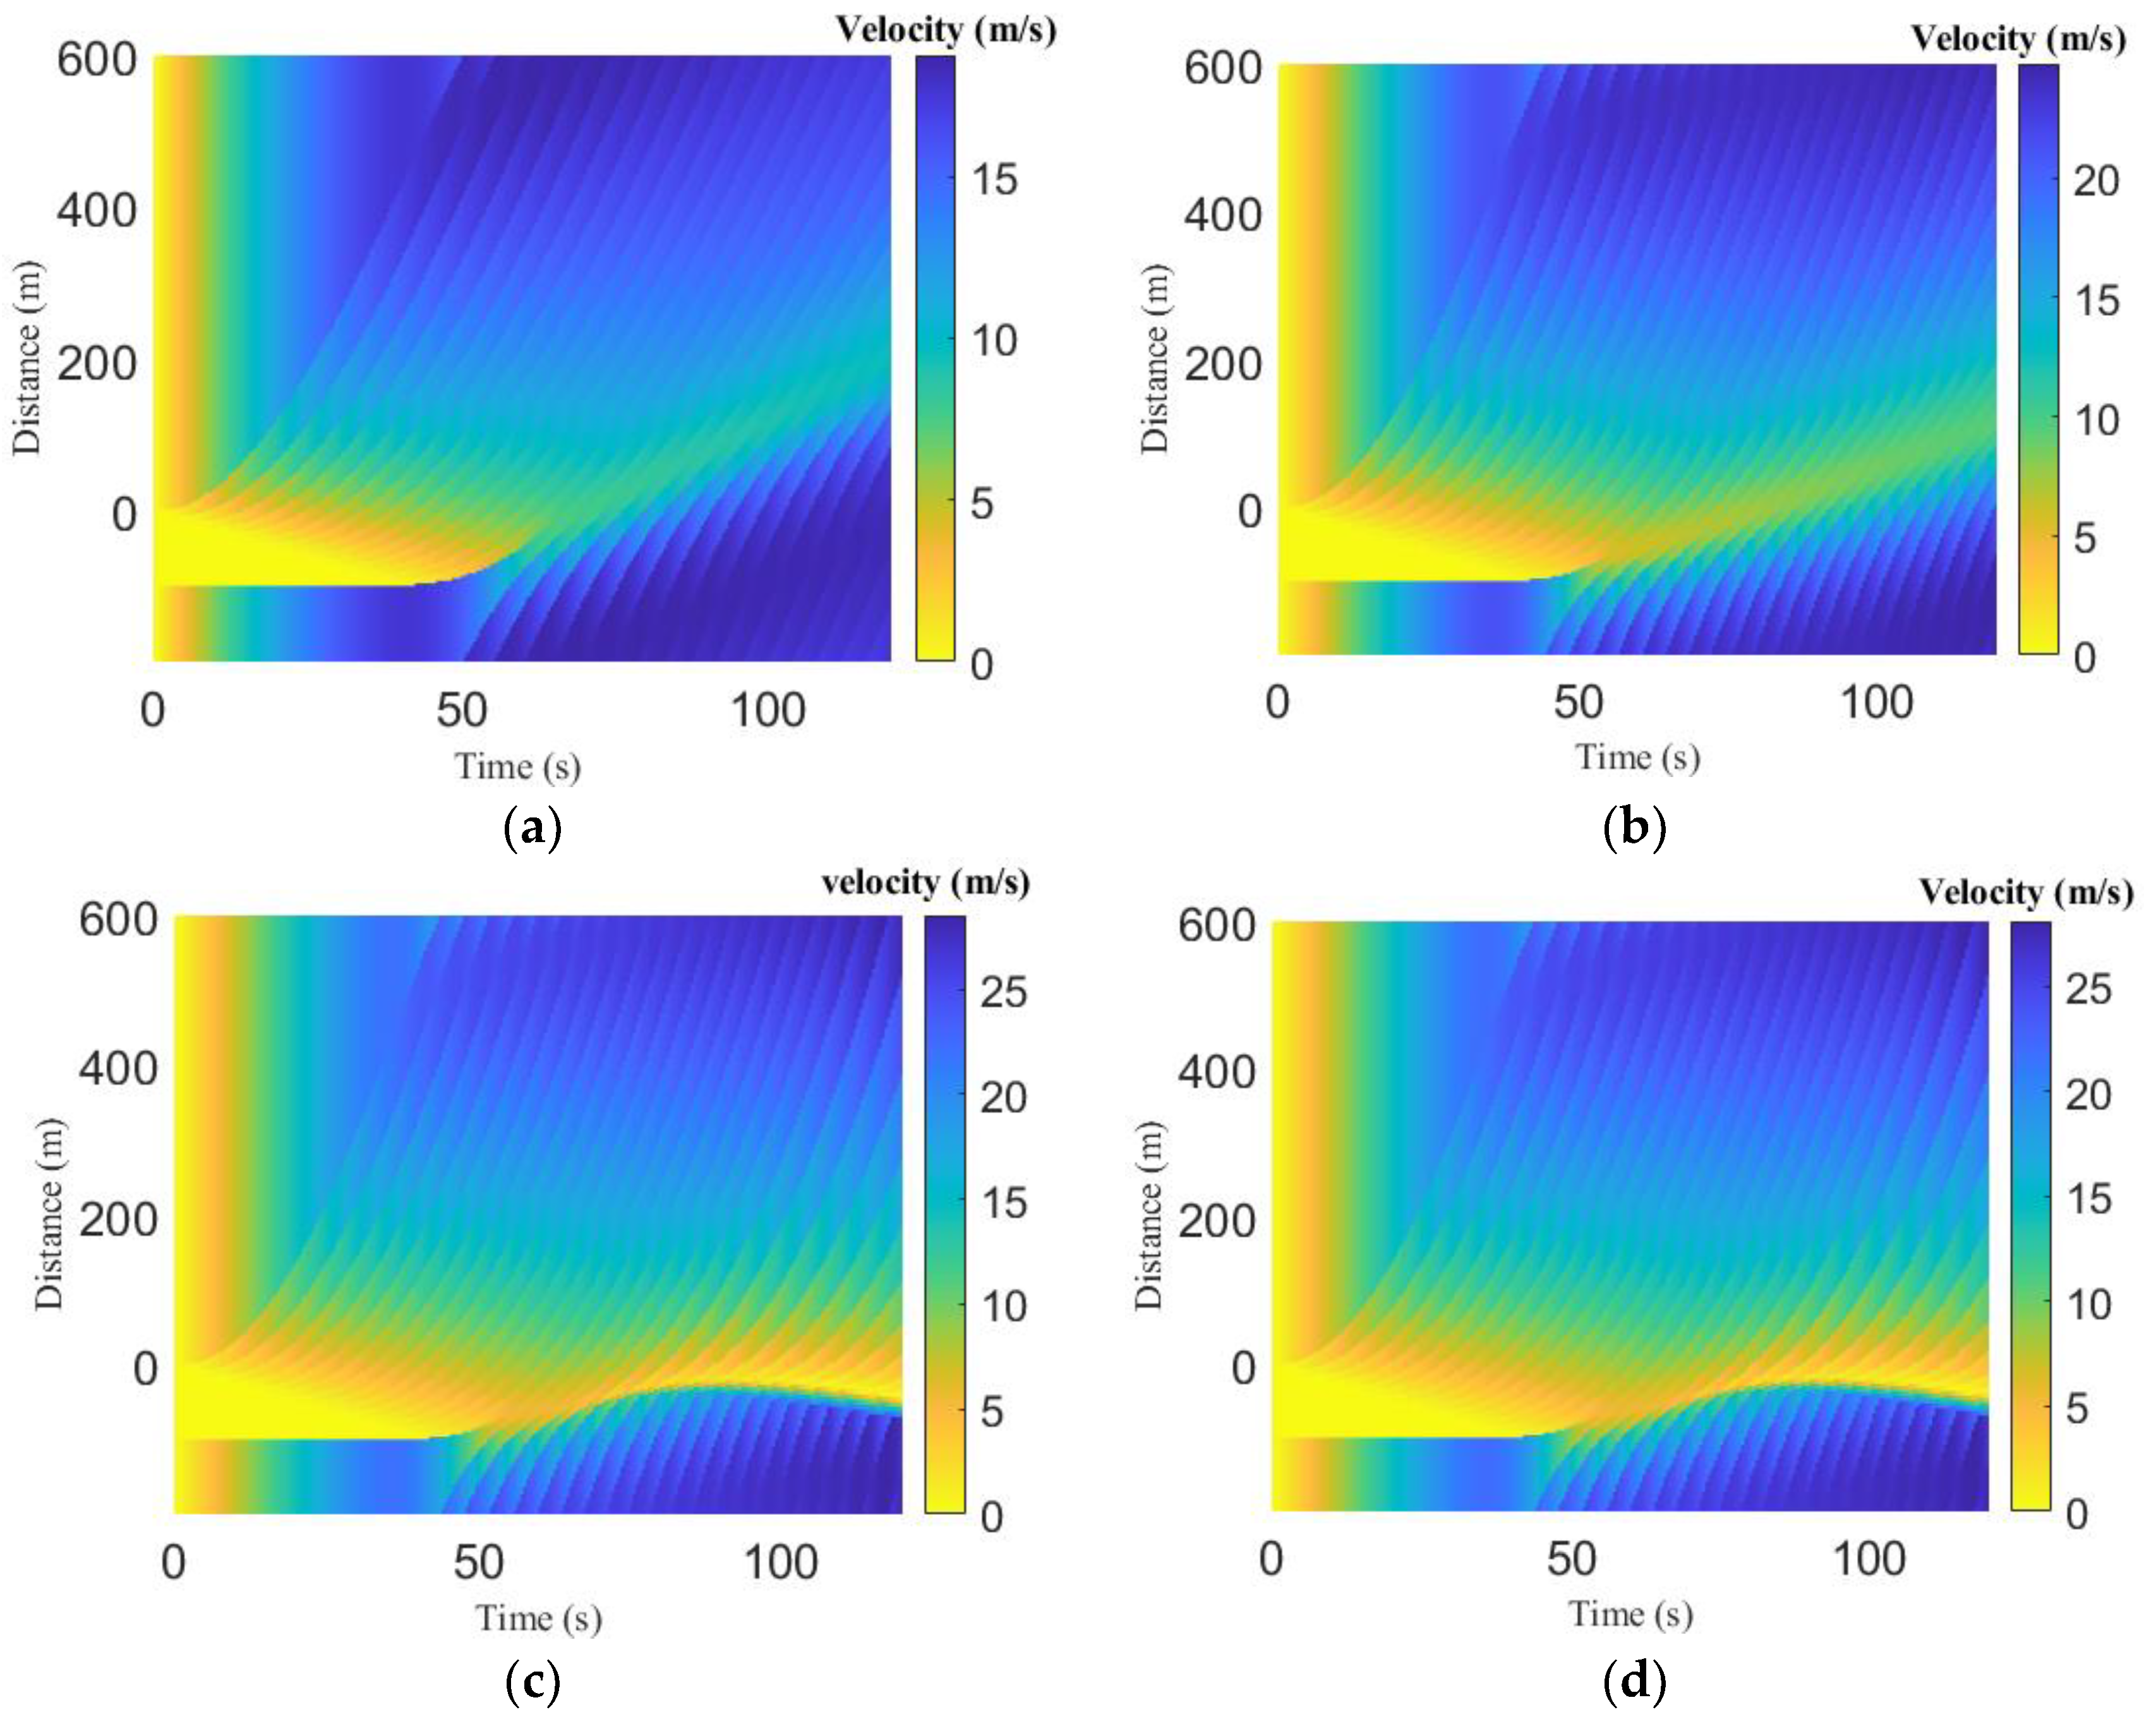
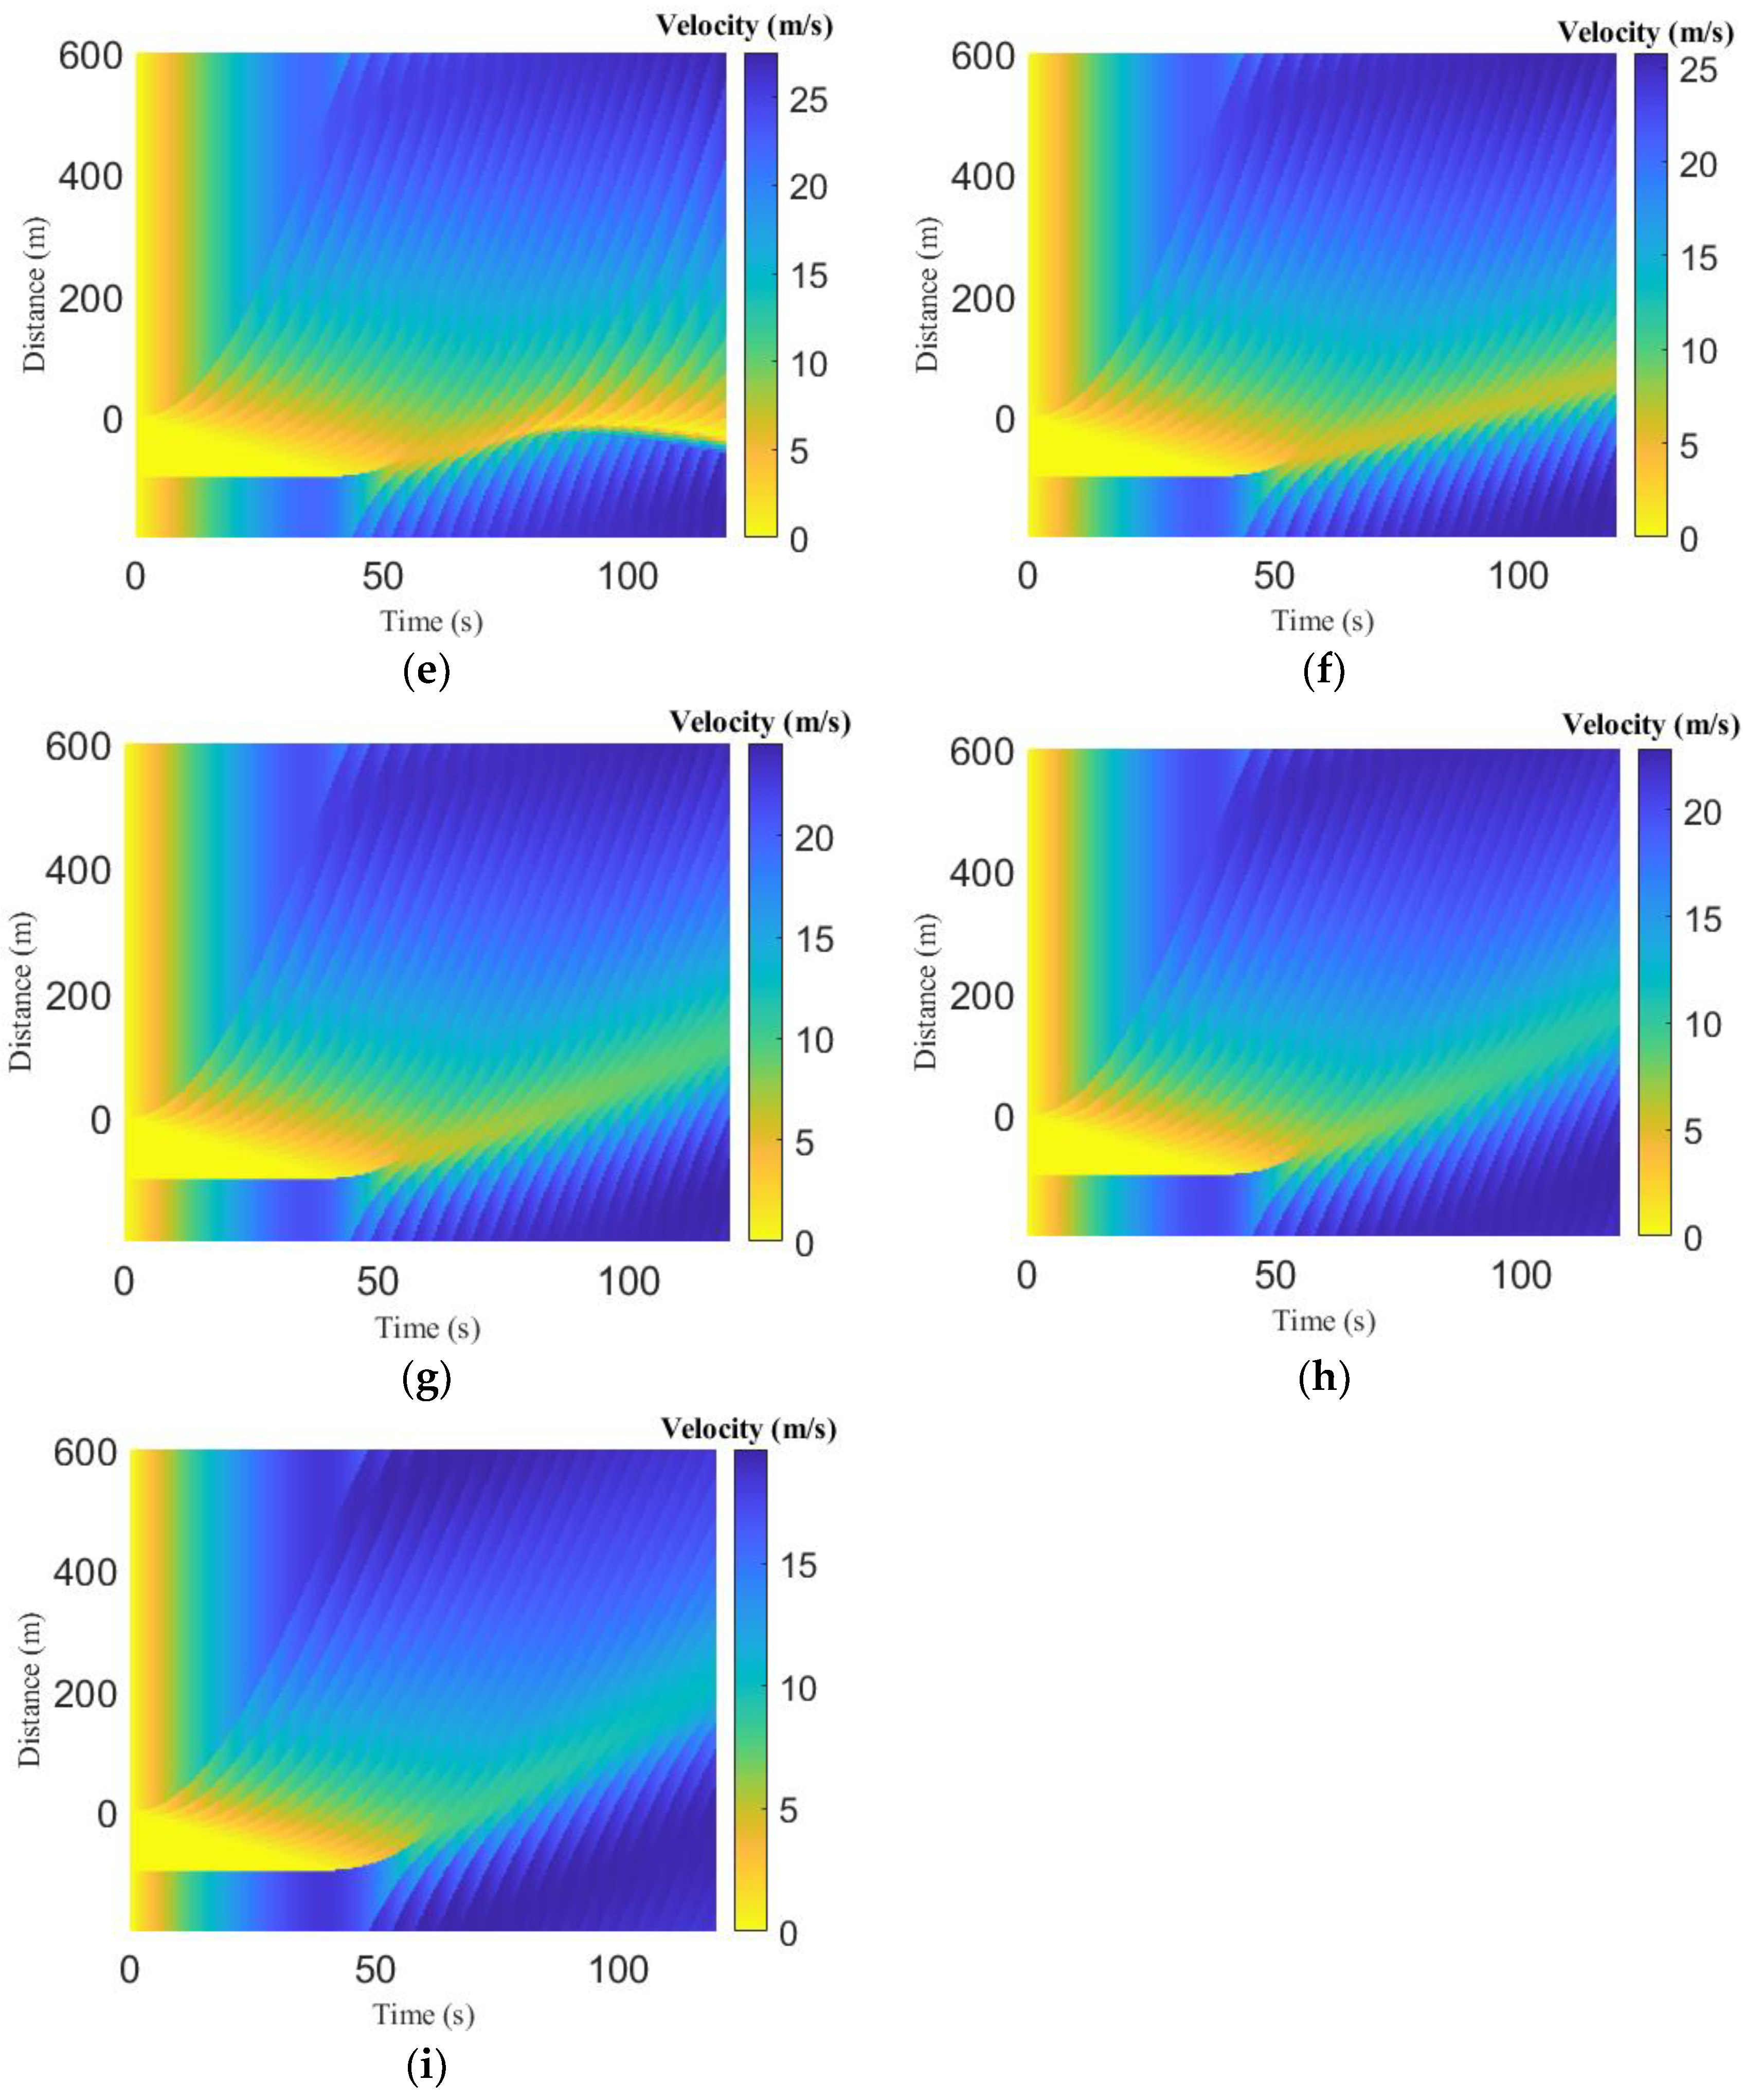
Figure 5.
Time-space vehicle trajectories for the ID and proposed models over an m circular road: (a) ID model, ; (b) ID model, ; (c) ID model, ; (d) proposed model, ; (e) proposed model, ; (f) proposed model, ; (g) proposed model, ; (h) proposed model, ; (i) proposed model, .
Figure 5.
Time-space vehicle trajectories for the ID and proposed models over an m circular road: (a) ID model, ; (b) ID model, ; (c) ID model, ; (d) proposed model, ; (e) proposed model, ; (f) proposed model, ; (g) proposed model, ; (h) proposed model, ; (i) proposed model, .
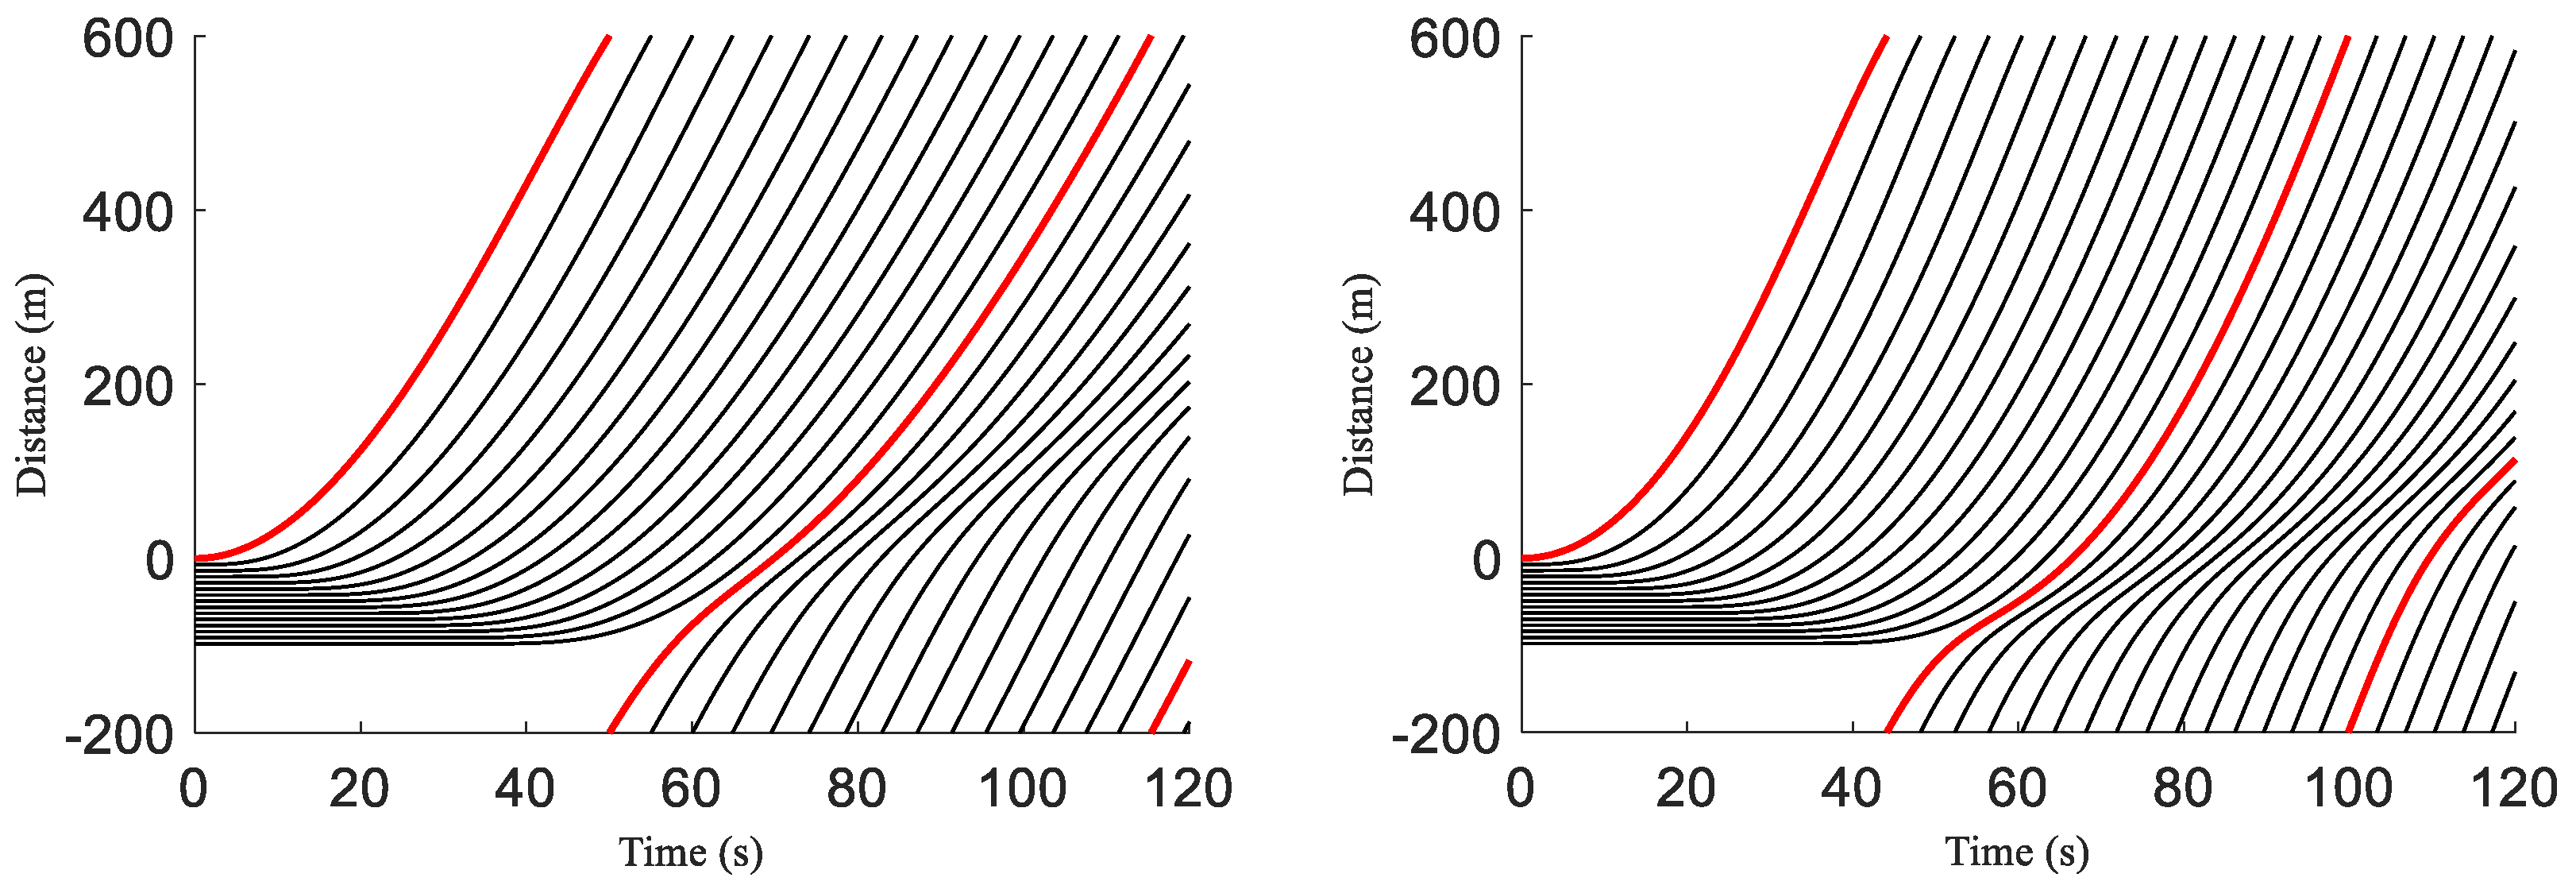
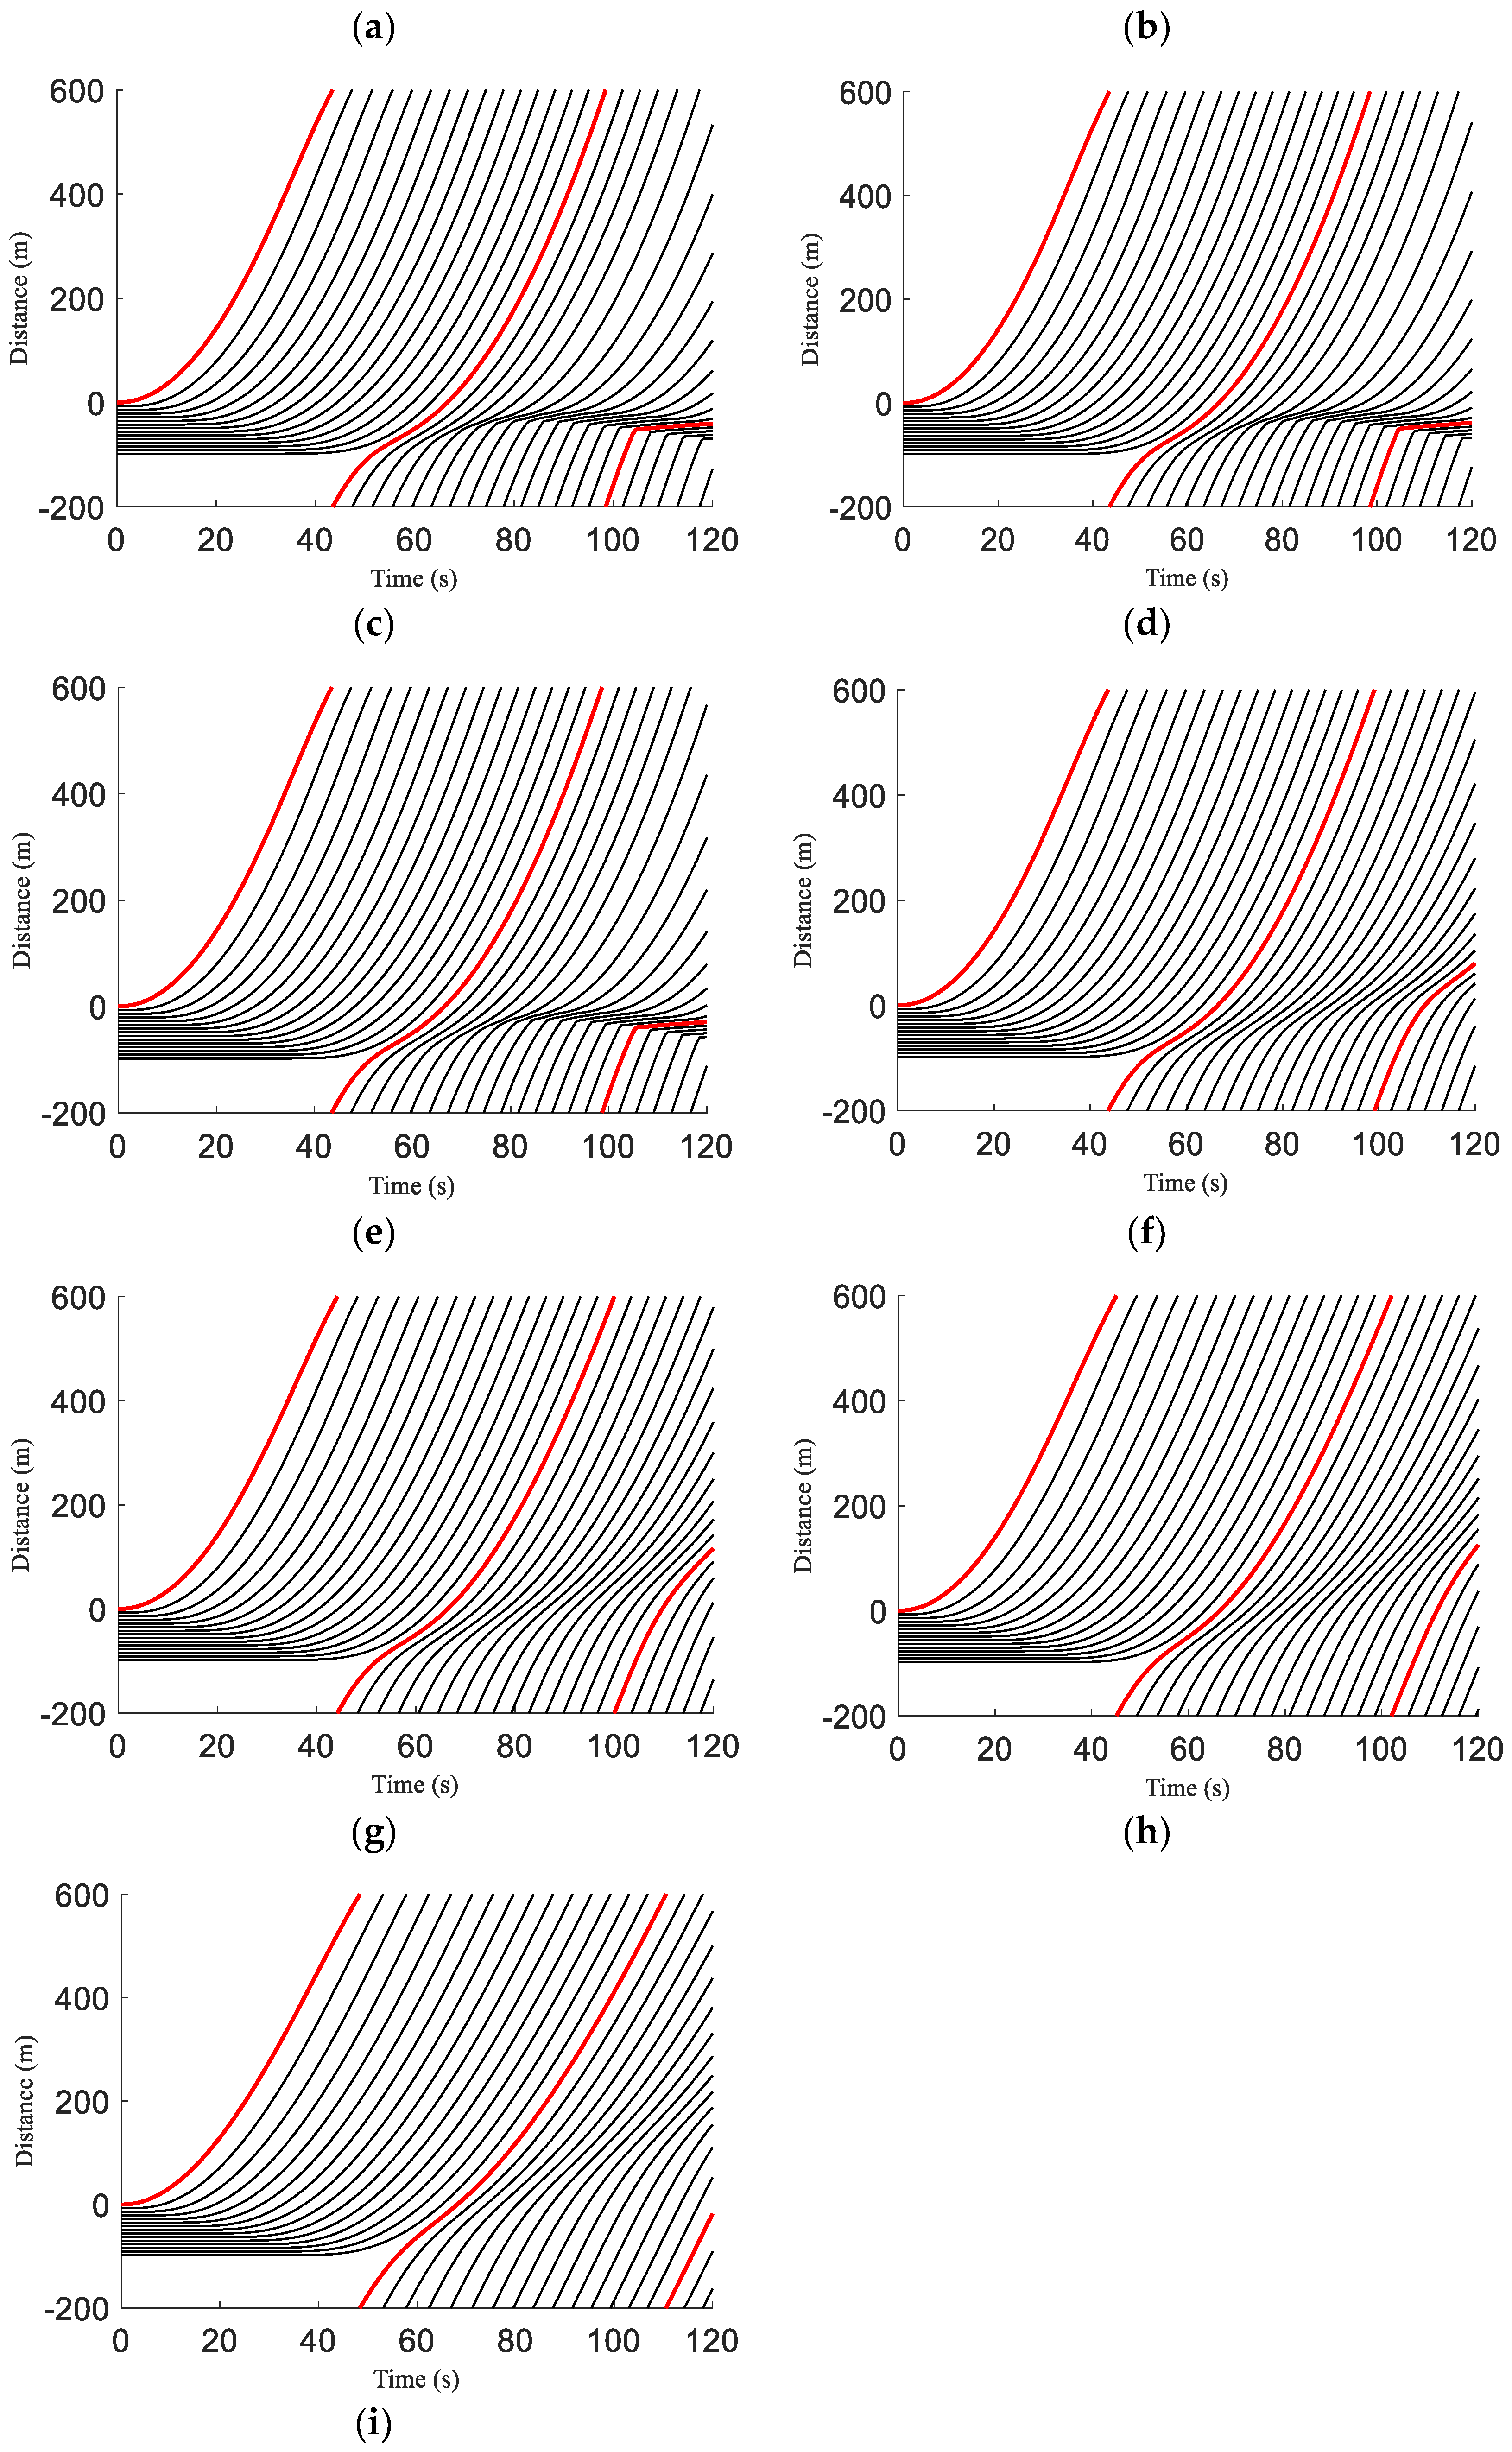
Figure 6.
Traffic flow evolution over time with the ID model over an m circular road.
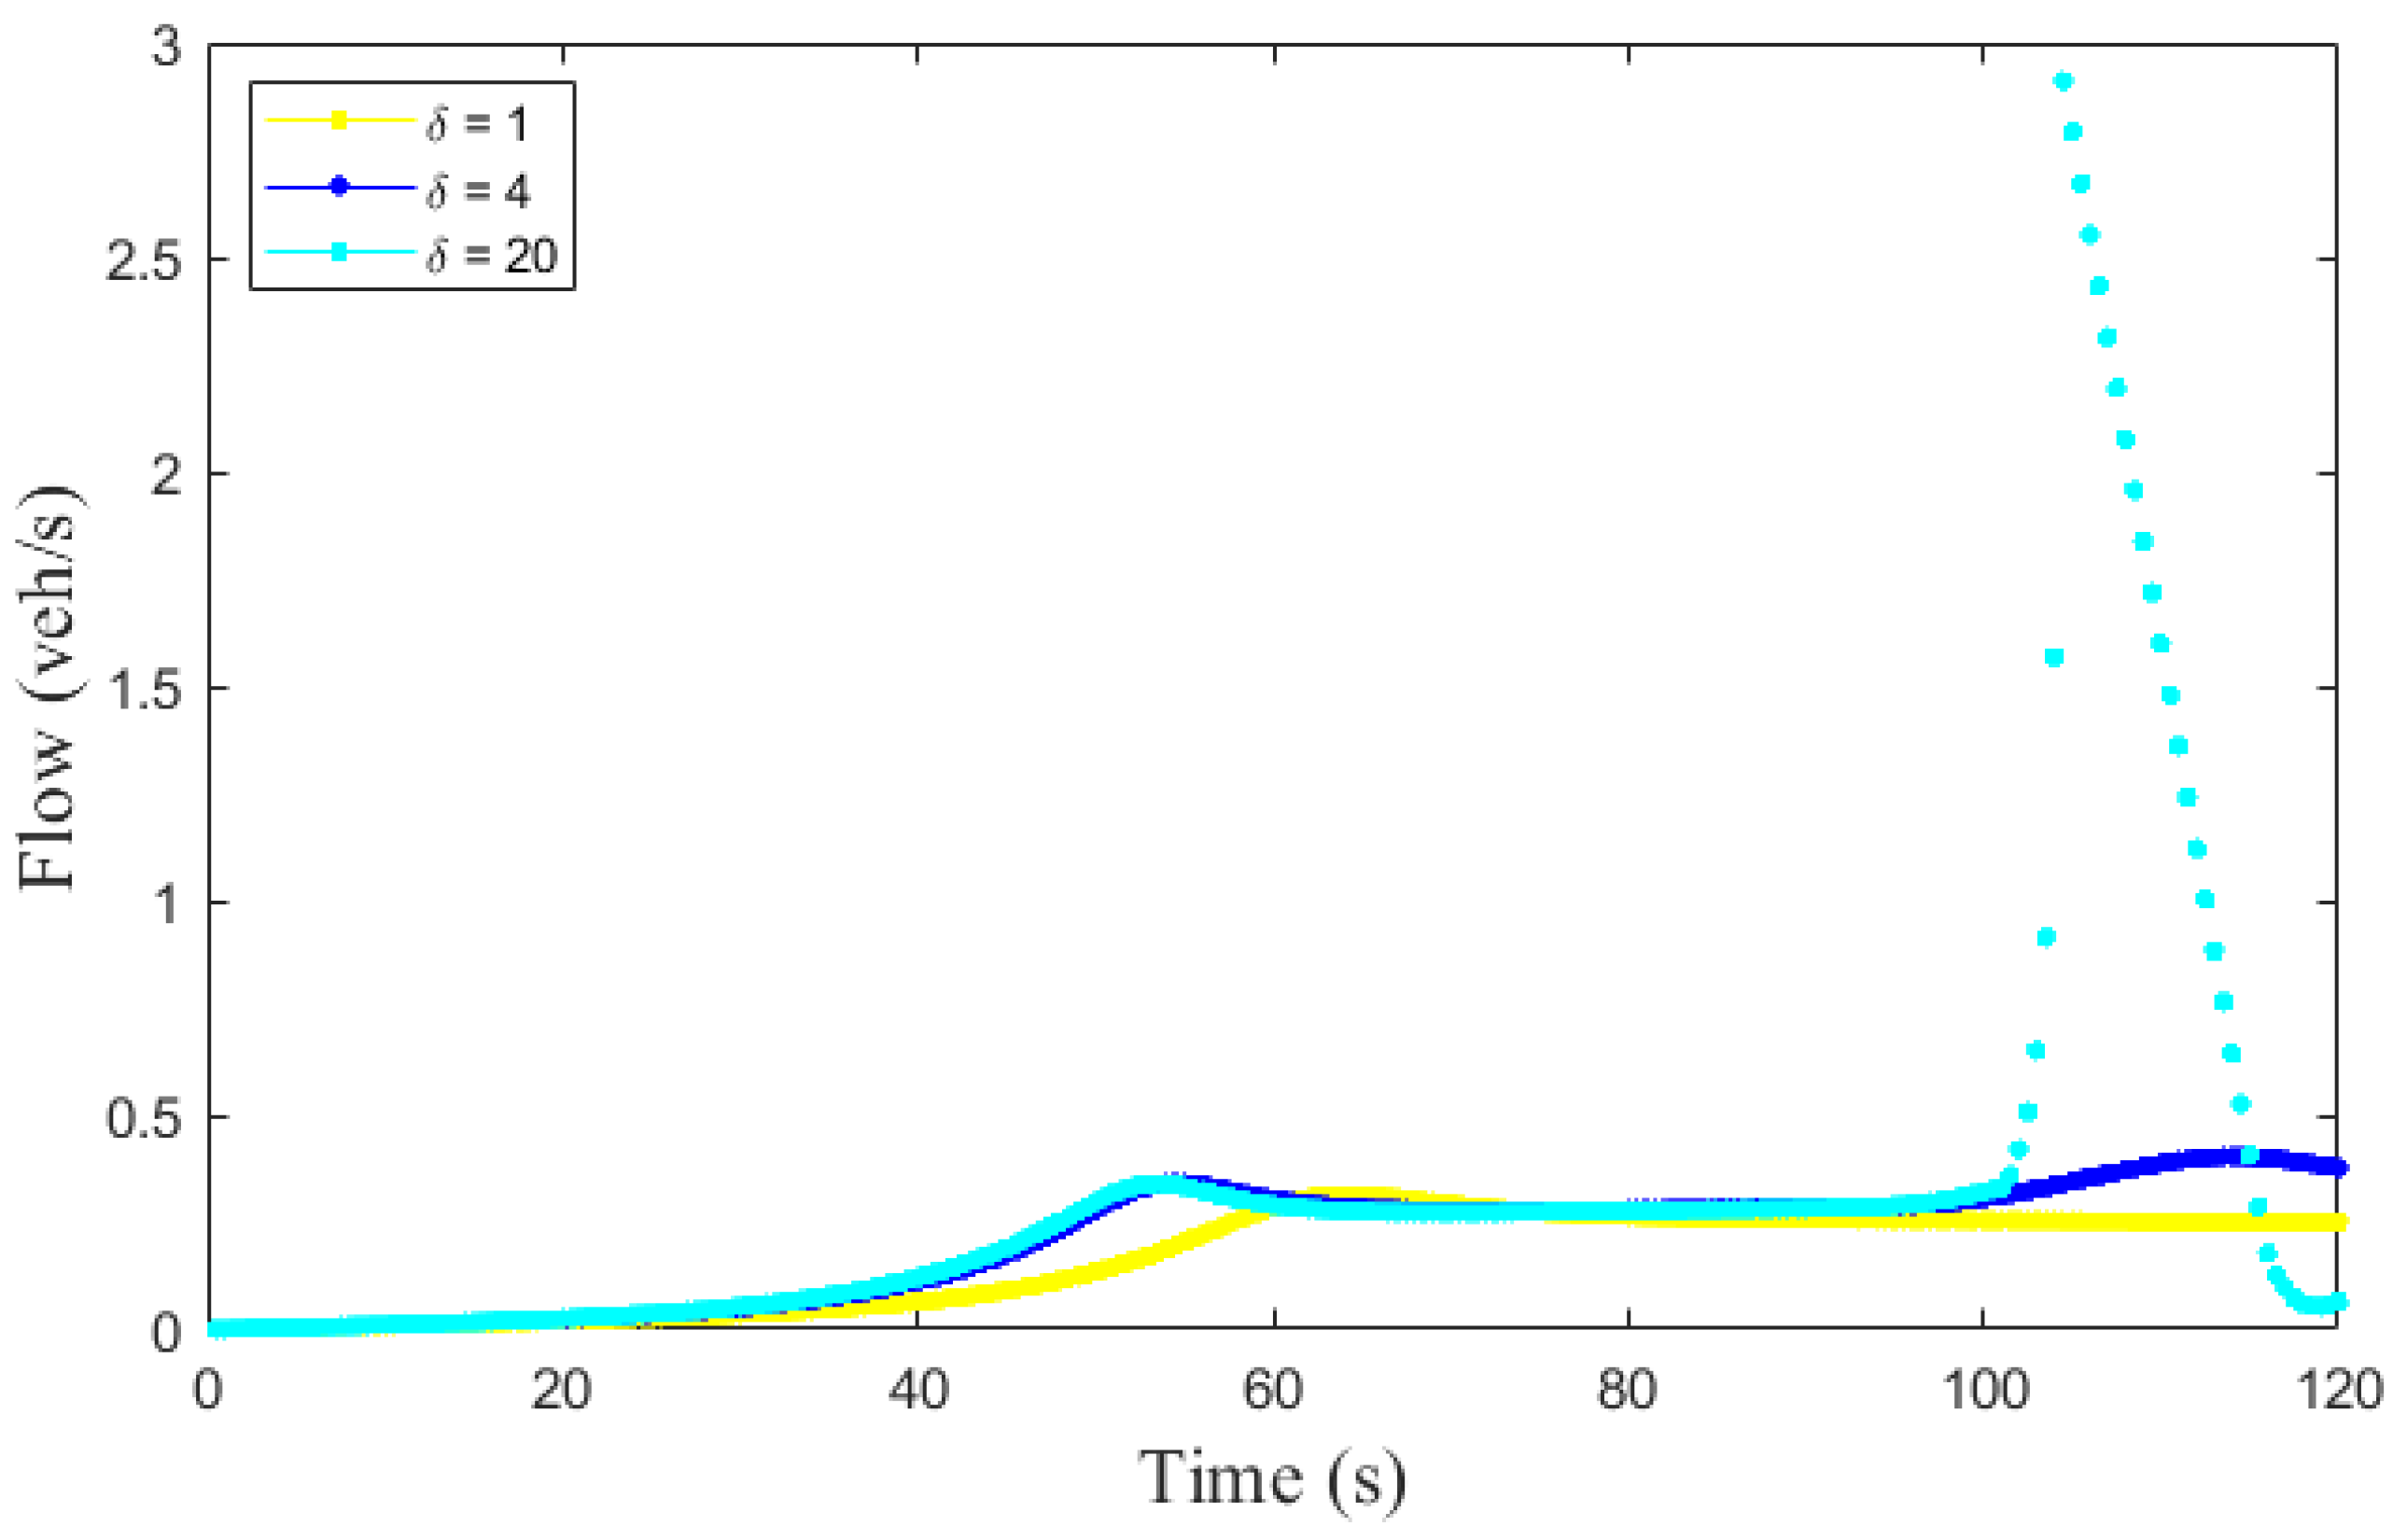
Figure 7.
Traffic flow evolution over time with the proposed model over an m circular road.
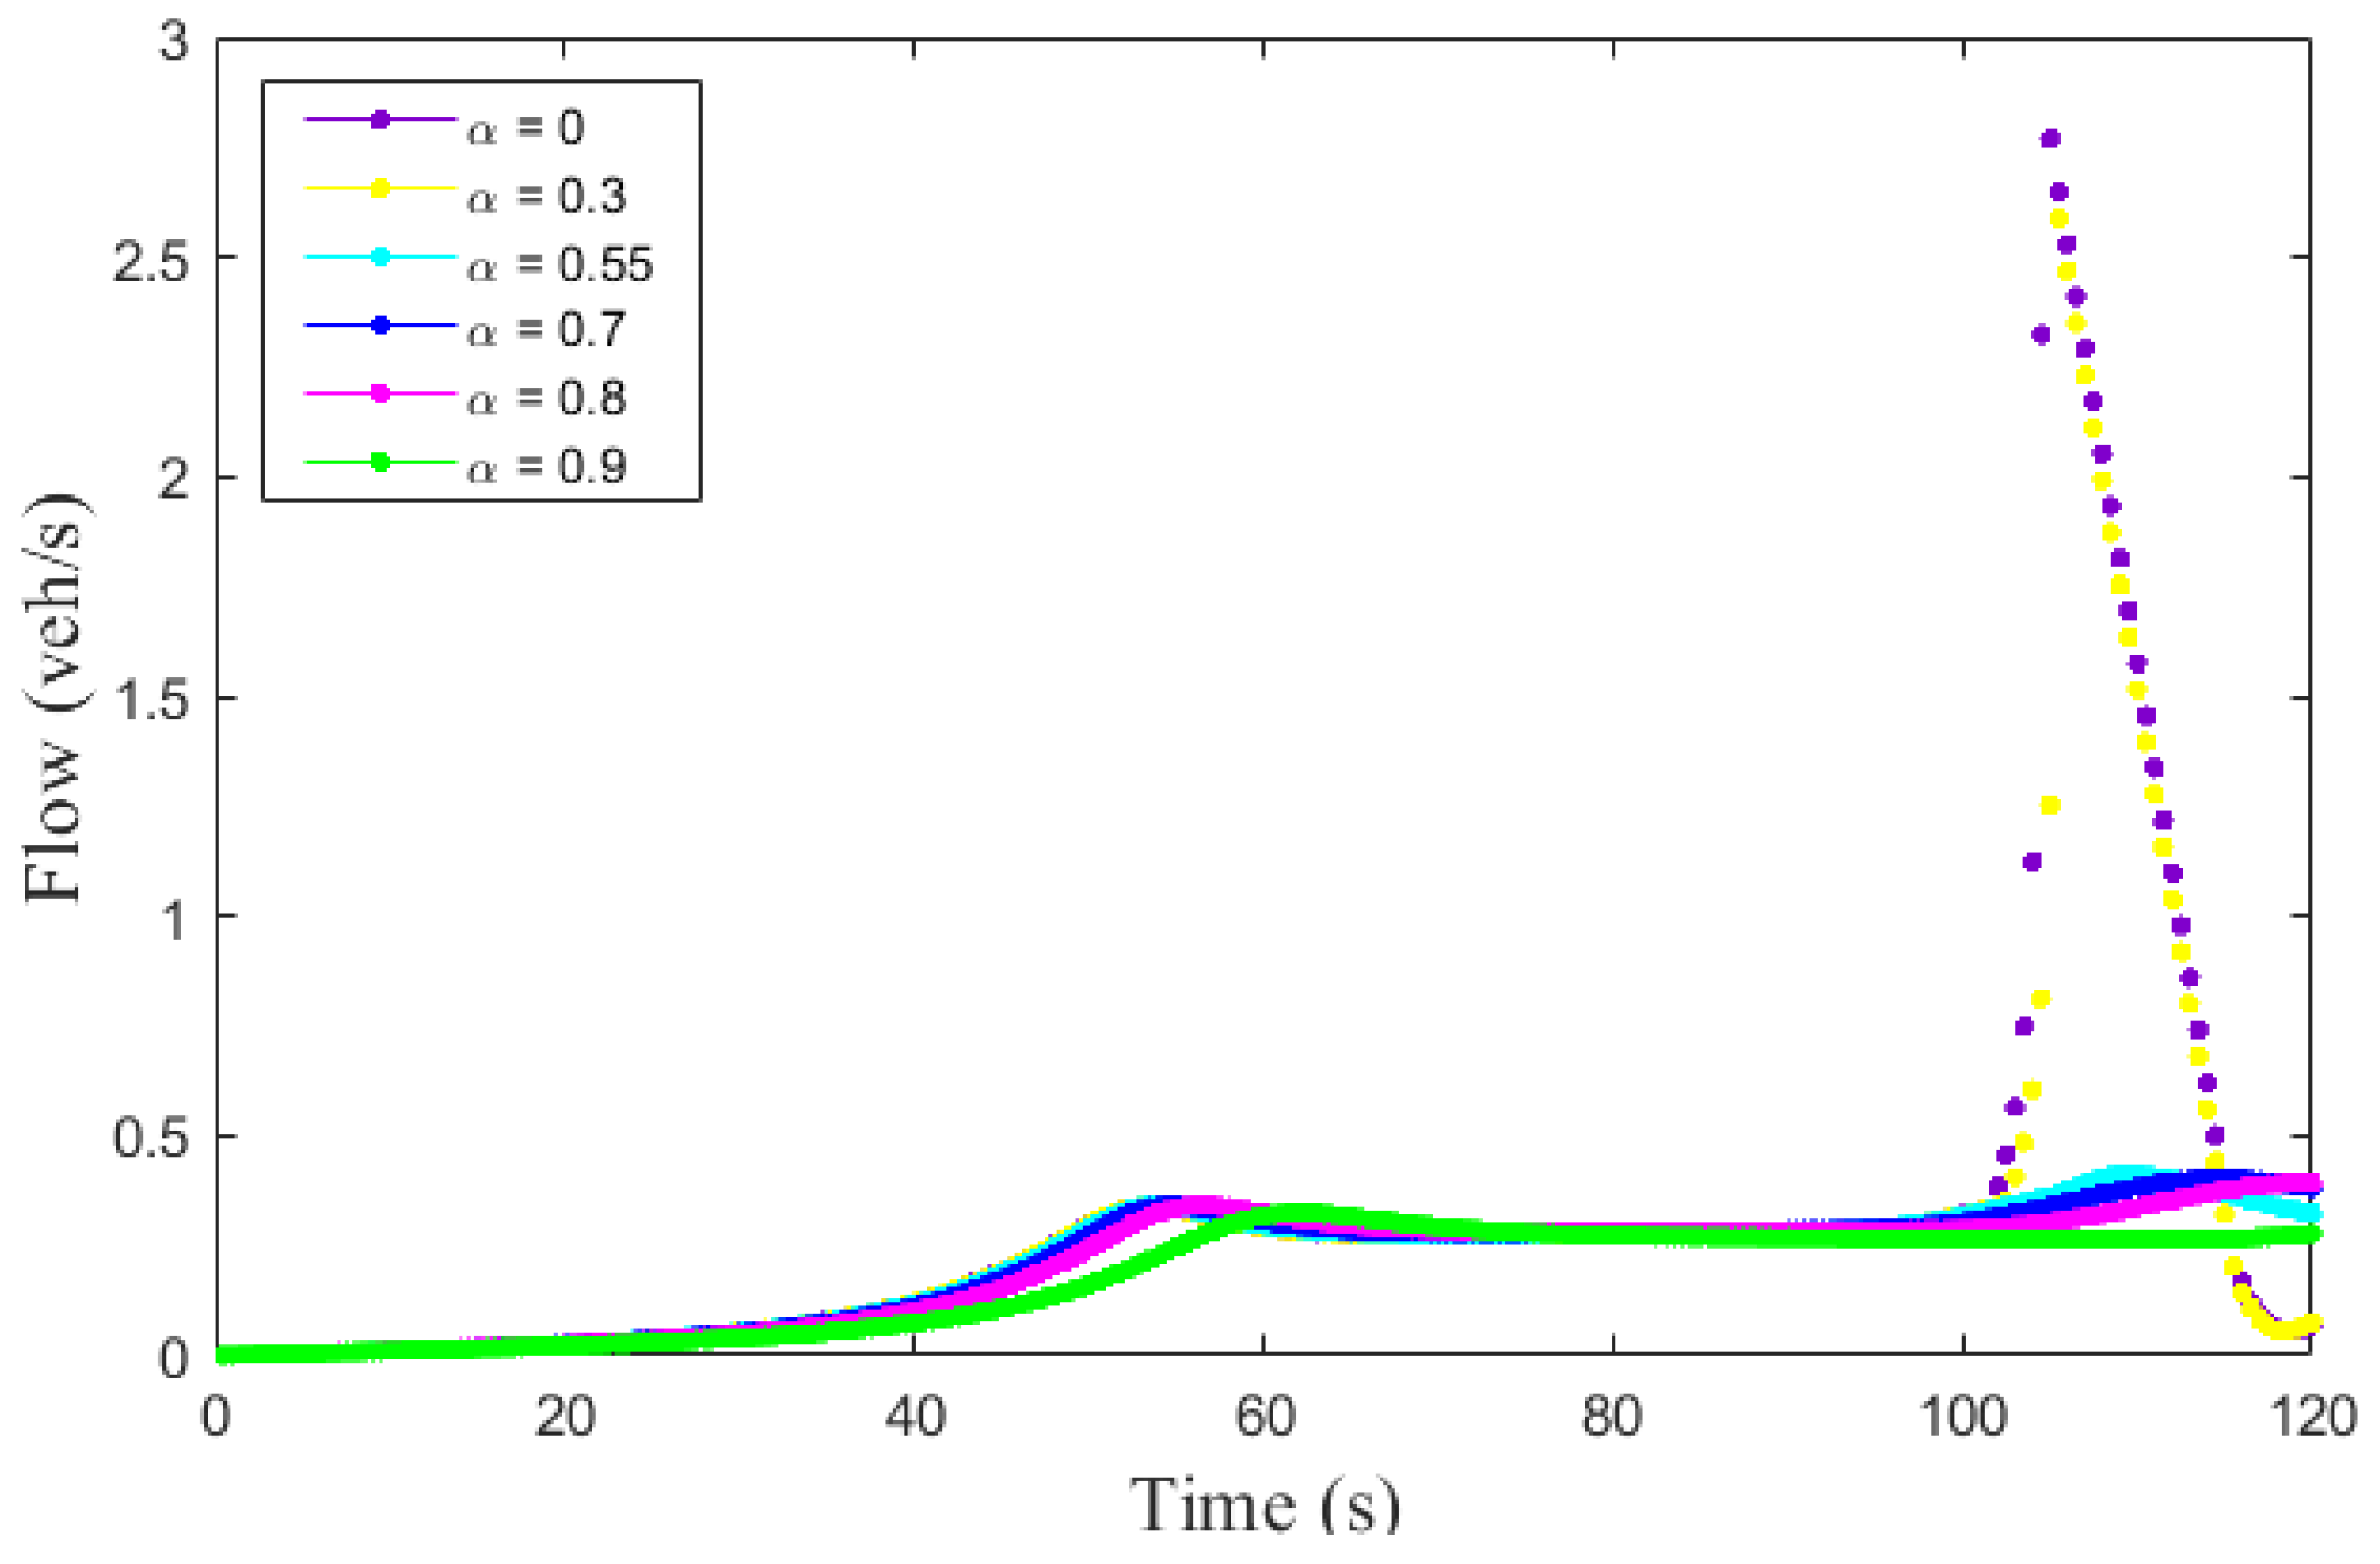
Figure 8.
Traffic density behavior of the ID and proposed models over an m circular road: (a) ID model, ; (b) ID model, ; (c) ID model, ; (d) proposed model, ; (e) proposed model, ; (f) proposed model, ; (g) proposed model, ; (h) proposed model, ; (i) proposed model, ; (j) proposed model for a platoon of 30 vehicles, ; (k) proposed model for a platoon of 30 vehicles, .


Table 1.
Stability evaluation parameters for the ID and proposed models.
| Parameter | Value |
|---|---|
| Initial equilibrium velocity, | m/s |
| Maximum severity index, | 1 |
| Distance headway, | m |
| Time headway, | s |
| Weather severity index, | and 0.9 |
| Jam spacing, | 7 m |
| Minimum acceleration, | 0.73 m/s2 |
| Maximum acceleration, | 1.67 m/s2 |
| Vehicle length, | 5 m |
| Time step, | s |
| Acceleration exponent | and |
Table 2.
Simulation Parameters.
| Parameter | Value |
|---|---|
| Maximum velocity, | m/s |
| Maximum normalized density for 15 vehicle platoon, at m/s | 0.143 |
| Maximum severity index, | 1 |
| Distance headway, | m |
| Time headway, | s |
| Weather severity index, | and 0.9 |
| Jam spacing for 15 vehicle platoon, | 7m |
| Minimum acceleration, | 0.73 m/s2 |
| Maximum acceleration, | 1.67 m/s2 |
| Vehicle length, | 5m |
| Time step, ∆t | 0.5 s |
| Jam spacing for 30 vehicle platoon, | 2 m |
| Maximum normalized density for 30 vehicle platoon, at m/s |
Table 3.
Maximum flow and density, and critical velocity for the ID model.
| Acceleration Exponent | Maximum Flow (veh/s) | Maximum Density | Critical Velocity (m/s) |
|---|---|---|---|
| 1 | 0.310 | 0.028 | 11.1 |
| 4 | 0.400 | 0.024 | 16.3 |
| 20 | 0.440 | 0.016 | 27.5 |
Table 4.
Maximum flow and density, and critical velocity for the proposed model.
| Weather Severity Index | Maximum Flow (veh/s) | Maximum Density | Critical Velocity (m/s) |
|---|---|---|---|
| 0 | 0.433 | 0.017 | 24.5 |
| 0.3 | 0.426 | 0.019 | 22.4 |
| 0.55 | 0.413 | 0.021 | 19.3 |
| 0.7 | 0.397 | 0.023 | 17.3 |
| 0.8 | 0.376 | 0.025 | 15.0 |
| 0.9 | 0.328 | 0.028 | 11.6 |
Table 5.
Velocity and time for the ID and proposed models during the queue and after the queue dissipates.
Table 5.
Velocity and time for the ID and proposed models during the queue and after the queue dissipates.
| Parameter | Time When the Queue Exists (s) | Velocity after the Queue Dissipates (m/s) | Time when the Queue Dissipates (s) |
|---|---|---|---|
| = 1 | |||
| = 4 | |||
| = 20 | and | ||
| and | |||
| and | |||
Table 6.
Positions of the st, th, and th vehicles at s with the ID and proposed models.
| Parameter | 1st Vehicle Position (m) | 6th Vehicle Position (m) | 10th Vehicle Position (m) |
|---|---|---|---|
| = 1 | 429.4 | 84.77 | −34.83 |
| = 4 | 522.3 | 116.1 | −28.58 |
| = 20 | 532.5 | 116.5 | −28.57 |
| 532.4 | 116.5 | −28.57 | |
| 531.7 | 116.5 | −28.57 | |
| 528.5 | 116.5 | −28.57 | |
| 520.6 | 115.9 | −28.58 | |
| 505.0 | 113.5 | −28.71 | |
| 453.3 | 95.78 | −31.75 |
Publisher’s Note: MDPI stays neutral with regard to jurisdictional claims in published maps and institutional affiliations. |
© 2022 by the authors. Licensee MDPI, Basel, Switzerland. This article is an open access article distributed under the terms and conditions of the Creative Commons Attribution (CC BY) license (https://creativecommons.org/licenses/by/4.0/).
Share and Cite
MDPI and ACS Style
Ali, F.; Khan, Z.H.; Khattak, K.S.; Gulliver, T.A. A Microscopic Traffic Flow Model Characterization for Weather Conditions. Appl. Sci. 2022, 12, 12981. https://doi.org/10.3390/app122412981
AMA Style
Ali F, Khan ZH, Khattak KS, Gulliver TA. A Microscopic Traffic Flow Model Characterization for Weather Conditions. Applied Sciences. 2022; 12(24):12981. https://doi.org/10.3390/app122412981
Chicago/Turabian StyleAli, Faryal, Zawar Hussain Khan, Khurram Shehzad Khattak, and Thomas Aaron Gulliver. 2022. "A Microscopic Traffic Flow Model Characterization for Weather Conditions" Applied Sciences 12, no. 24: 12981. https://doi.org/10.3390/app122412981
Note that from the first issue of 2016, this journal uses article numbers instead of page numbers. See further details here.