
Ultrasound-Assisted Extraction of β-Asarone from Sweet Flag (Acorus calamus) Rhizome


1
Department of Chemistry, Faculty of Science, Universiti Malaya, Kuala Lumpur 50603, Malaysia
2
Research Services Division (BPP), Institute of Research Management and Services (IPPP), Universiti Malaya, Kuala Lumpur 50603, Malaysia
3
School of Chemistry, University of Melbourne, Parkville, VIC 3010, Australia
*
Authors to whom correspondence should be addressed.
Appl. Sci. 2022, 12(21), 11007; https://doi.org/10.3390/app122111007
Submission received: 2 September 2022
/
Revised: 24 October 2022
/
Accepted: 27 October 2022
/
Published: 30 October 2022
(This article belongs to the Collection Ultrasound in Extraction Processing)
Abstract
:In this study, the extraction efficiency of β-asarone from Malaysian Acorus calamus from Acoraceae family using conventional solvent extraction and ultrasound-assisted extraction techniques was compared. The results showed that the ultrasound-assisted extraction technique significantly improves the extraction yields and process feasibility without changing the structure of the active compound, i.e., β-asarone. The extraction yield increment was found to be ~2.5-fold and ~1.6-fold at 1:100 and 1:50 solid-to-solvent ratio, at 30% applied sonication power. The positive impact of sonication can also be observed for both mechanistic stages of extraction, i.e., the washing and diffusion stages, due to the favorable physical effect of acoustic cavitations. The observation was supported by the SEM images of the plant residue. The characterization of the extract was carried out using HPLC, NMR, UV and IR techniques. In conclusion, ultrasound assistance increases the extraction efficiency by ~2.5-fold even at only 30% applied ultrasonic power at a 1:100 solid-to-solvent ratio. The present study also provides an efficient and simple method for accurate direct dosing of Acorus calamus extracts to an application.
1. Introduction
Acorus calamus is commonly known as sweet flag, Bacha or Jerangau Putih [1]. Asarone is a naturally occurring phenylpropanoid usually found in the Acoraceae (Acorus) and Aristolochiacease (Asarum) plant families [2,3,4,5,6,7]. All of its variations, the α-, β- and γ- asarone are commonly used in naturopathy due to their significant medicinal and pharmacological values [4,5,8,9]. Amongst the proven benefits of asarone is the treatment of various physiological disorders such as hyperlipidaemia, respiratory, circulation problems, neurological disorders, epilepsy, Alzheimer’s and ischemia [3,5,10,11,12]. Asarone is also known to relieve inflammation and gas or colic, and treatment for diarrhea, ulcers and intestine-related issues. Moreover, asarone can act as an antidepressant, relaxant or calm inducer, thus helping with sleeping problems and minor psychological issues. Asarone provides quick relief due to its ability to cross the blood–brain barrier, thus directly affecting the body’s central nervous system [13].
However, there are numerous reports on the concerns over the safety of asarone. It was reported that prolonged exposure to A. calamus could cause toxification and excessive vomiting [14]. It was also reported that both α- and β- asarone are cytotoxic, genotoxic and hepatocarcinogenic [12,15,16]. Due to the reported toxicity effects of asarones, the use of A. calamus in food and flavoring is prohibited by law in certain countries, including the United States of America [17]. Despite the decision of certain countries to refuse the use of asarone, there are an increasing number of studies that prove the benefits of the compound in treating various health issues. Therefore, instead of a complete ban, some countries introduce regulations that limit the intake of β-asarone [9,10,18,19,20]. Hence, it is important to have an efficient and reliable method to determine accurately the amount of β-asarone in A. calamus to reduce the risk of toxication.
Ultrasound is known to aid the extraction process by increasing extract yield and improving the experimental feasibility. The phenomenon of microbubble oscillation and collapse causes the physical effect necessary to aid the extraction process. The oscillation of the microbubbles may result in macro turbulences that could improve solute in solvent micro-mixing. The event would also promote materials collision, thus fragmenting and rupturing the plant material structure. On the other hand, the collapse of the microbubble results in violent phenomena such as micro-jetting and shockwaves with extreme temperature and pressure released locally. Such occurrences on the plant surface result in the fragmentation and disruption of the material matrix, detachment and erosion of the sacs and glands, and sonoporation that could aid the release of its active compounds bound by the structure. Therefore, there have been many reports on the improved extraction efficiency by ultrasound aidance. The ultrasound-assisted extraction efficiency is also known to be affected by many experimental factors, such as material particle size [21,22] and moisture contents [23,24]; and ultrasound parameters such as frequency, power and sonication time [25,26].
Several studies on the extraction and quantification of asarone by HPTLC [27,28], HPLC [29], GCMS [30,31], LC-MS/MS [32,33,34] and near-infrared reflection (NIR) spectroscopy [35] have been reported. In this study, an ultrasound-assisted extraction coupled with HPLC analysis is developed to provide an efficient and simple method to quantify β-asarone in the A. calamus. The effects of experimental conditions such as the size of plant materials, solvent medium, and sonication power were investigated, while the ultrasound reactor design was kept constant. The extraction efficiency of the ultrasound assisted method was compared with the conventional solvent extraction method.
2. Materials and Methods
2.1. Plants Materials
In this study, dried rhizomes of Acorus calamus were obtained from Alor Setar, Kedah, Malaysia. The rhizomes were ground to particles with size ranges from 0.05 to 0.20 cm for extraction.
2.2. Conventional Solvent Extraction of A. calamus
The processes involved during the extraction are depicted in Figure 1. An amount of 0.5 or 1.0 g of ground A. calamus was soaked in a container with 50 mL of ethanol (purity of ≥ 95% from Kofa Chemicals) for 30 min in a condition of with and without temperature control. This makes the solid-to-solvent ratios to be either at 1:100 or 1:50 (g/mL). The temperature was maintained using a water bath coupled with a thermoregulator at 40–45 °C. After the extraction, the ethanol extract was filtered through a 0.45 µm nylon membrane filter (Millipore HNWP04700). The ethanol solvent in the filtrate was then removed under reduced pressure and the dried crude extract was stored at room temperature. The experiment was performed in triplicates. Isolation and purification were extensively carried out on the crude extract using column chromatography (CC; 10 g silica gel 60, 0.040–0.063, Merck, Darmstadt, Germany; chloroform:hexane (1:1), 500 mL) and centrifugal thin layer chromatography (CTLC; Silica gel 60 PF254 containing gypsum, Merck, Darmstadt, Germany, 2 mm thick; chloroform:hexane (1:1), 250 mL). Both techniques were repeated until a single spot in TLC was obtained. The purified β-asarone was then characterized using NMR, IR and UV-spectroscopy for identification confirmation. The extracted ground rhizome was air-dried for microscopy analysis. The extraction process was carried out in a fume hood. However, throughout the processes, the strong distinct smell of β-asarone can be immediately detected and lingers. Mask and gloves were used during the whole extraction process to reduce the risk of β-asarone intoxication.
2.3. Ultrasonic-Assisted Extraction of A. calamus
The ultrasonic-assisted extraction was carried out for similar solvent volume, time, replication and solid-to-solvent ratio as the conventional solvent extraction method. The ultrasound unit used was a 20 kHz ultrasonic probe (Qsonica Q500, Qsonica LLC., Newton, NJ, USA) with a tip diameter of 1.0 cm. The probe was immersed and maintained at 1.0 cm below the solvent surface throughout all experiments. This is shown in Figure 1a above. The sonication power was varied at 30, 5, and 70% with power densities of 471.2 Wdm−3, 981 Wdm−3, and 1571.6 Wdm−3, respectively. The subsequent processes are similar to the conventional method.
2.4. Characterization
The NMR spectra data were obtained from a 400 MHz Bruker AVANCE III spectrometer with chemical shifts (δ) expressed in ppm and TMS as an internal standard in CDCl3. The coupling constants (J) are reported in Hz. The UV measurement was carried out using ethanol solvent with UV-Vis spectrophotometer (Shimadzu, UV-1800, Shimadzu Corporation, Kyoto, Japan). The IR measurement was carried out on the Perkin-Elmer RX1 FT-IR (Perkin Elmer, Waltham, MA, USA) spectrophotometer using the thin film method with NaCl cell. HRMS data were obtained from an Agilent 6530 Q-TOF (Agilent Technologies, Santa Clara, CA, USA) mass-spectrometer coupled with an Agilent 1200 series Rapid Resolution LC system (Agilent Technologies, Santa Clara, CA, USA). All characterization was performed with the extracted β-asarone.
The physical structures of the rhizomes before and after being treated with both ultrasound-assisted and conventional extraction were observed under a field emission scanning electron microscope (FESEM, Hitachi SU8220, Hitachi High-Tech Corporation, Tokyo, Japan). Samples were uncoated and observed under 1 kV.
2.5. HPLC Analysis
The kinetic study of the extraction process was carried out using HPLC to quantify the amount of β-asarone from the extracts obtained from Section 2.2, while the calibration curve was constructed using the purified β-asarone in the present study. The compound was dissolved in 1.5 mL of methanol (HPLC grade) and passed through a 0.45 µm membrane filter. HPLC analysis was performed on Agilent’s HPLC system equipped with 1290 Infinity Binary pump and autosampler injector, Agilent Poroshell 120 C18 column (4.6 × 50 mm, 2.7 µm), and PDA detector. Sample volume was 1 µL and eluted using mobile phase of methanol: MiliQ water (90:10, v/v), delivered at a flow rate of 0.4 mL/min. Detection was carried out at 260 nm. The analysis was carried out in triplicates. The HPLC spectrum of β-asarone at 260 nm is shown in Figure 2. A calibration curve of the pure β-asarone was developed with its concentration range of 10–200 µg/mL (Figure S1 of SI). The calibration curve was used to determine the extract yield (Yt). The Yt data were subsequently used for kinetic modelling calculation.
2.6. Kinetic Modeling
The β-asarone extraction progress plot was fitted according to the So and MacDonald’s model [36]. The kinetics equation that describes the extraction process is given as Equation (1).
where Yt is the amount of solute extracted at any given time (µg/mL), cw is the amount of solute extracted in the solvent during the washing step, kw is the rate of extraction during the washing step (min−1), cd is the amount of solute extracted in the solvent during the diffusion step and kd is the rate of extraction during the diffusion step (min−1). All experiments were performed in triplicates and the results were expressed as mean value ± standard deviation. The statistical analysis of the model was carried out using JMP 15 and Excel 2016.
Yt = cw [1 − e−kwt] + cd [1 − e−kdt]
3. Results and Discussions
3.1. Characterization of β-Asarone
In this study, the extraction of the volatile β-asarone oil was carried out from the A. calamus rhizomes using two techniques—the conventional solvent extraction and ultrasound-assisted extraction techniques (Figure 1a,b). The major component of the extract and the focus of this study, β-asarone or 1,2,4-trimethoxy-5-(prop-1-en-1-yl)benzene is shown below in Figure 3a. The UV spectrum showed three absorption maxima at 302, 252 and 203 (Figure 3b). The IR spectrum indicated the presence of methyl group C-H stretch (2936 cm−1), aromatic ring C-C stretch (1608, and 1508 cm−1) and ether C-O stretch (1203 cm−1) functional groups (Figure 3c). The m/z is found to be 209.0954 [M+H]+ (calcd. 209.1172) (Figure 3d).
The purified β-asarone was further characterized by 1H and 13C NMR spectra. Both spectra are shown in Figure 4. The 1H NMR spectrum displayed eight proton signals. Of the eight proton signals, two signals were observed as a doublet of doublet (dd) at δH 6.46 and 1.82, one signal was observed as multiplet (m) at δH 5.74 and the other five signals were observed as singlet (s) at δH 6.82, 6.51, 3.87, 3.81 and 3.78. The COSY, DEPT, HSQC and HMBC spectra are provided as Figures S2 to S5 in the SI. The COSY spectrum indicated the partial structure -CH=CH-CH3, corresponding to C(7)-C(8)-C(9), hence suggesting the presence of the aliphatic chain substituted at the aromatic rings system. The 13C NMR spectrum showed the presence of an sp3 primary carbon, three sp3 methoxy carbon, four sp2 tertiary carbon and four sp2 quaternary carbon signals. The carbon signals at δC 56.12, 56.50 and 56.66 indicated the presence of three methoxy carbon, while the δH 14.70 suggested the presence of an sp3 primary carbon. The experimental spectroscopic data (NMR, UV, IR and MS) of β-asarone are similar to the values from the literature [7].
The HPLC spectrum of β-asarone at 260 nm (Figure 2) showed two peaks at 1.7 and 2.1 min. The characterization of purified β-asarone is crucial as it is used as a reference for the kinetics study.
3.2. The Kinetics of Ultrasonic-Assisted Extraction of A. calamus
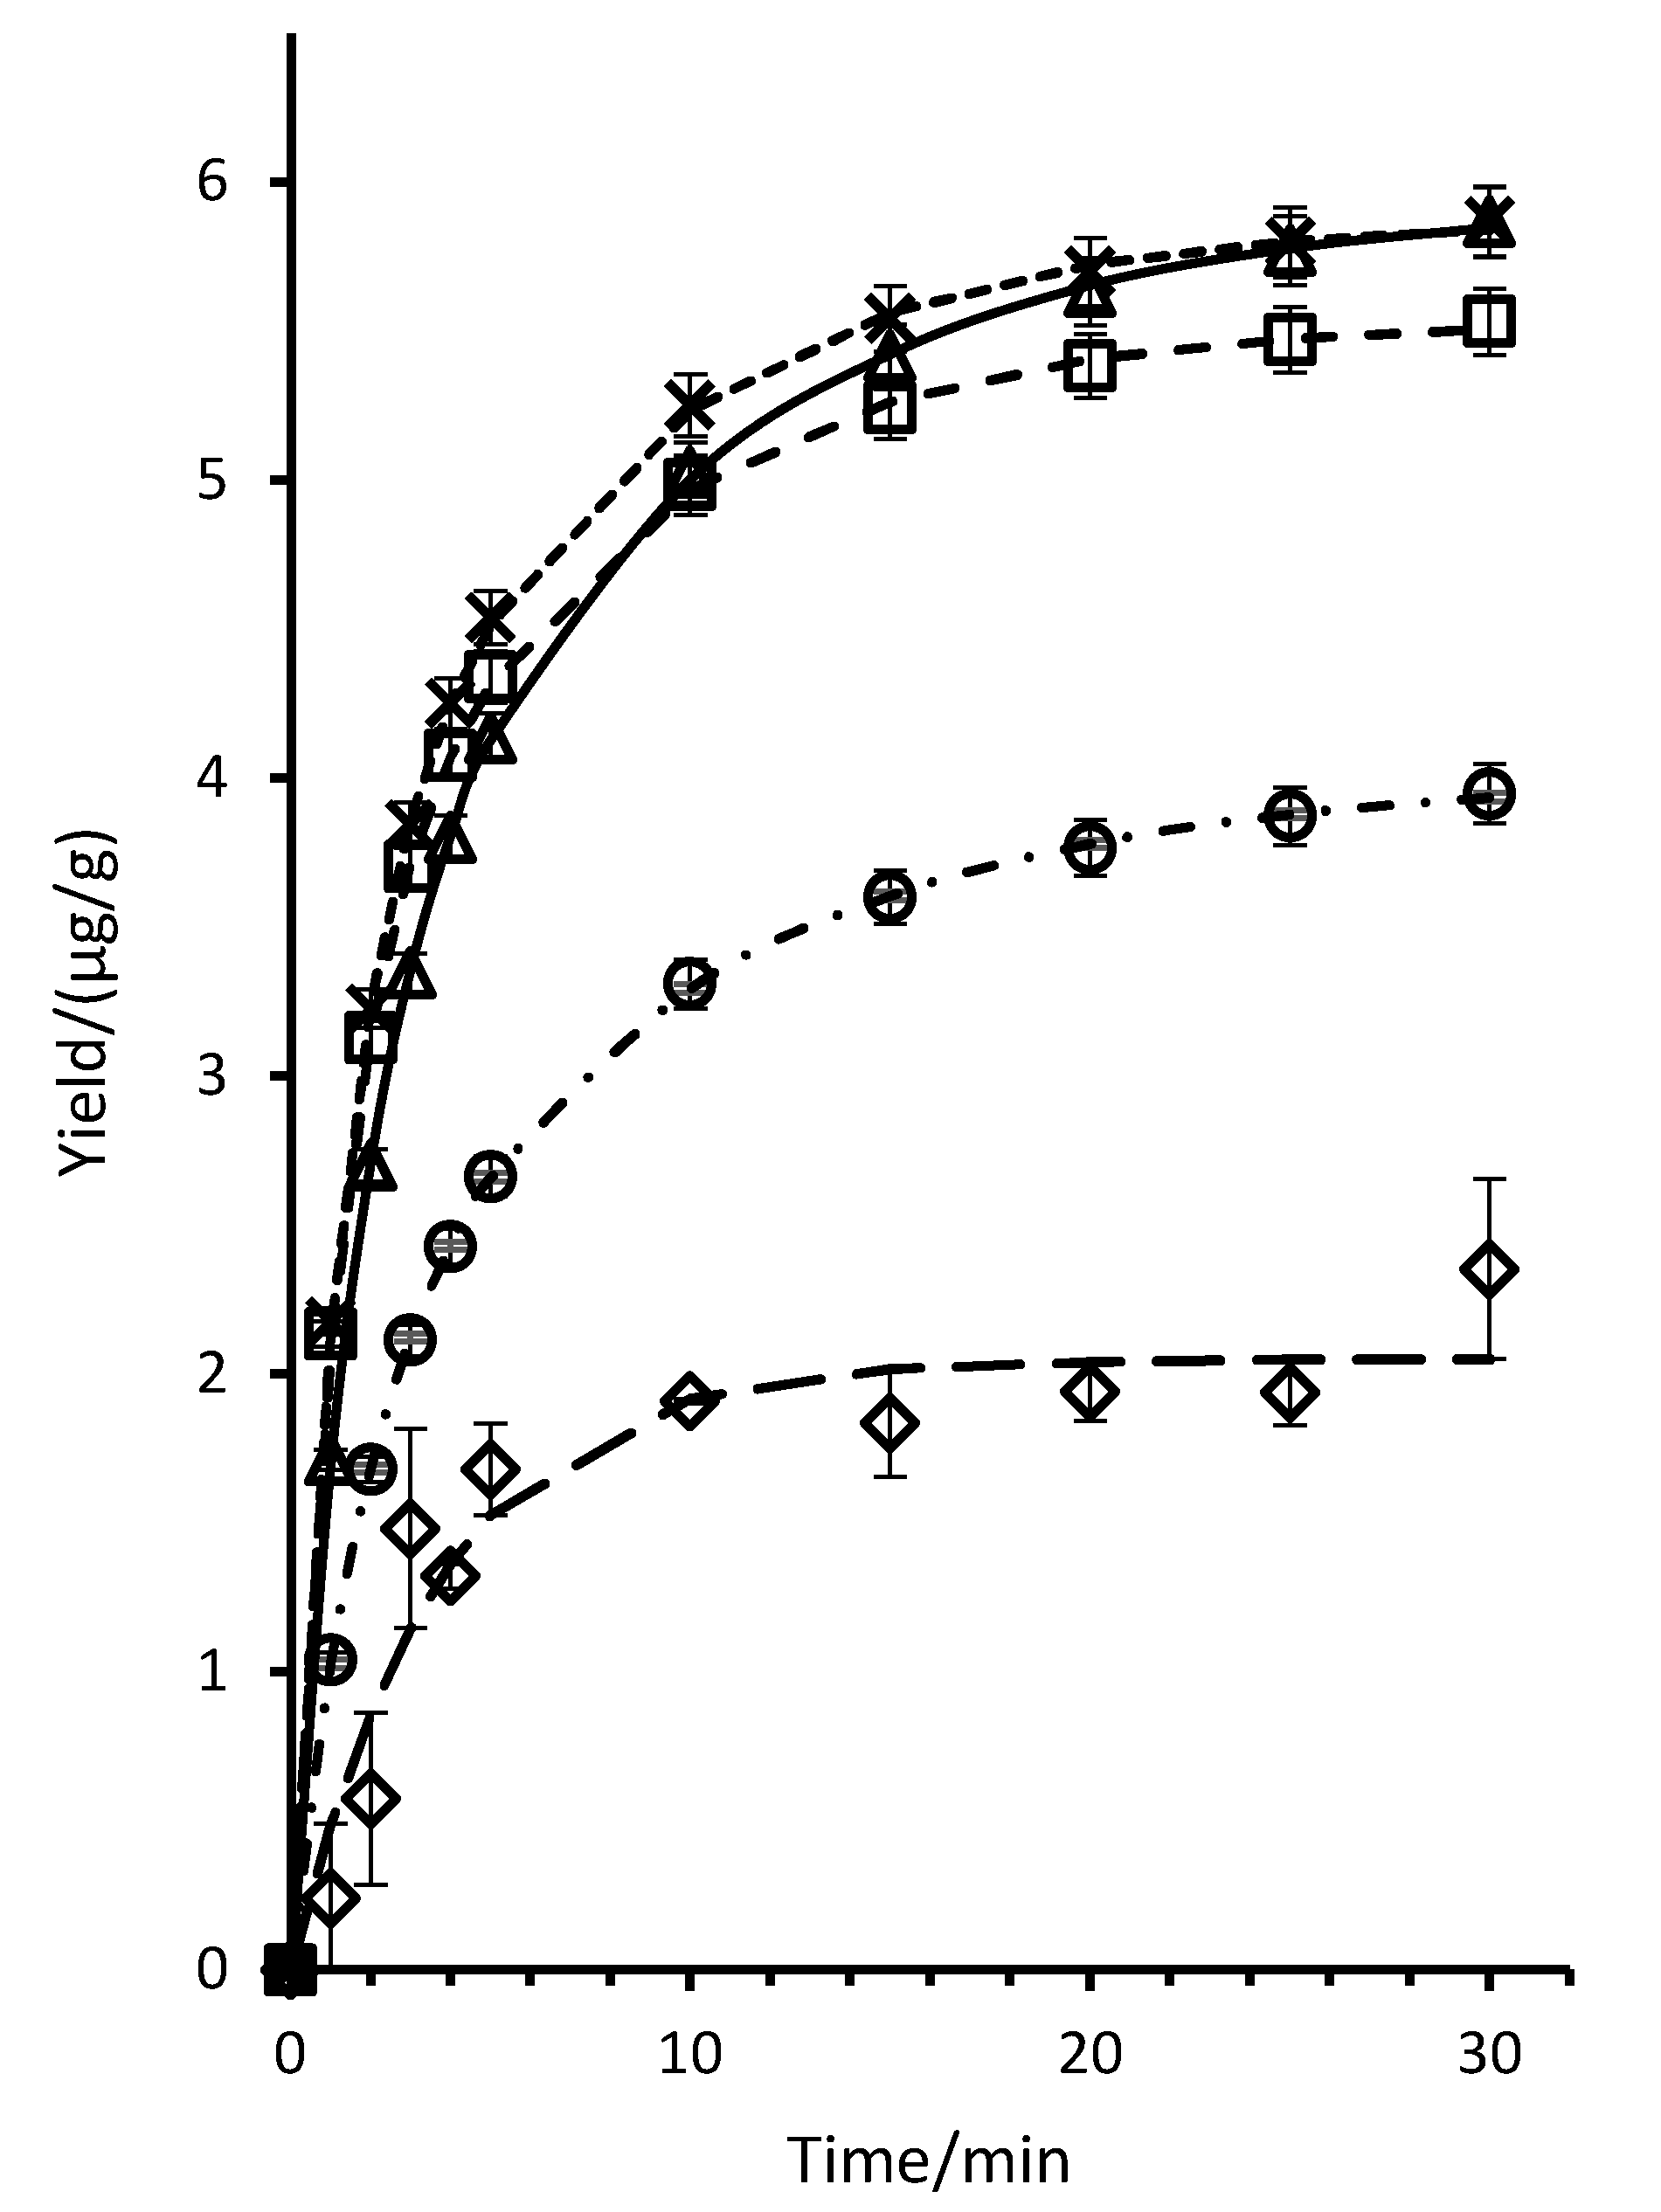
The ultrasound-assisted extraction was carried out to improve the extraction of β-asarone from A. calamus. The increasing β-asarone yield of extraction upon sonication duration of 30 min for 1:100 and 1:50 solid-to-solvent ratios are shown in Figure 5 and Figure 6, respectively for sonication power of 30 (∆), 50 (×), 70% (□); and in the absence of sonication, with the presence of temperature (○) and without (◊). The extract yield was calculated from the calibration curve of the purified β-asarone constructed using HPLC technique as shown in Figure S1 in SI. The lines in the figures were plotted with the calculated values modelled according to Equation (1).
The extraction progress plots revealed the typical trend of the extraction curve commonly observed. The curves are described by the two important mechanistic stages during extraction—the washing and diffusion mechanism [36]. Washing refers to the initial stage of extraction where the volatile oil is relatively easier to be washed out and is usually characterized by the rapid increase in the extraction plot. The high rate of extraction is due to the location of the active compounds at various sites of the plant matrices. As the samples are soaked in the medium, the solvent pervades into the plant matrices and solubilized the easily accessible solutes, washing them out. The affected solutes in this stage are those located near the surface or originally adsorbed on the surface of the matrices. Therefore, the more compounds available on the surface, the higher the rate of the washing mechanism. On the other hand, the solutes located in the interior or enclosed within the structure of the plant matrices will only be diffused out by the solvent diffusion process. The diffusion process represents the later stage of the extraction plot where the increment of extract yield happens at a slower rate, even though the two stages in the mechanism work in different manners, simultaneously. Thus, the two processes cannot be completely distinguished in the discussion. However, the domination of one process over the other is clearly evident in the plots shown in Figure 5 and Figure 6. The rapid increase in yield extract within ~ the first 10 min of the extraction indicates the dominance of the washing stage over the diffusion stage, whilst the slow increment of the extract yield that follows indicates the dominance of the diffusion stage over the washing stage.
To kinetically explain the β-asarone extraction yield during the washing and diffusion stages, the progress of extraction is fitted to the So and MacDonald’s model as shown in Equation (1). The washing rate coefficient is kinetically depicted by kw values, and the diffusion rate coefficient is depicted by kd values. The extract yield, Yt of the extraction in the presence and absence of ultrasound aid is also shown in Table 1 below.
Before we delve into the effect of ultrasound assistance, a quick look at the extract yield in Table 1 showed a higher amount of extract yield at 1:50 as compared to the 1:100 solid-to-solvent ratio. This indicates that extracting 1.0 g of Acorus calamus in 50 mL of ethanol is practical even though it was initially doubted during the experiment. This is because it is known that a larger solid-to-solvent ratio results in a higher concentration gradient, thus allowing more solvent penetration into the material [37]. Therefore, the lower amount of ground A. calamus, the higher surface contact between plant material, and hence the greater the improvement of the extraction yields. The larger amount of β-asarone extracted at a higher solid-to-solvent ratio (1:50) proved that having 1.0 g of ground A. calamus in 50 mL of ethanol is efficient and suitable for further investigation in this study. It is also notable to mention that β-asarone has good solubility in ethanol at 50 mg/mL [38]. A higher solid-to-solvent ratio effect than 1:50 was not explored in this study.
That the extract yields (Yt) of the 1:50 conventional experiments are higher than that of 1:100 conventional is due to a larger amount of A. calamus being used in the 1:50 experiment (1.0 g) than the 1:100 experiment (0.5 g). It is also interesting to note that the kw of both heated and non-heated 1:50 and 1:100 experiments are very low, while the kd value for non-heated conventional extraction was too low for determination. This shows that in non-heated conventional extraction, the extraction process was in the washing stages in which β-asarone was extracted slowly from the plant surface. As expected, heated non-conventional extraction increases the extract yields (Yt) when compared to the non-heated experiments, i.e., ~1.7-fold for 1:100 and ~1.4-fold for 1:50 experiments. However, caution needs to be exercised for heated conventional extraction as β-asarone is known to be volatile.
The extraction yields of (Yt) Increase substantially when sonication power was applied for all experiments. The largest increase (2.5-fold) was observed in the 30% sonication power to 1:100 solid-to-solvent ratio experiment. This shows the advantages of applying sonication in the extraction process.
The results in Table 1 showed a slight increase in extract yield (Yt) (30% and 50% ultrasound power) in the solid-to-solvent ratio 1:100 experiment when compared to that of the 1:50 experiment, indicating the dominant effect of a higher concentration gradient due to lower solid-to-solvent ratio [37]. However, at 70% ultrasound power, the higher solid-to-sample ratio experiment (1:50) gave a higher extraction yield, indicating the favorable application of ultrasound-assisted extraction in a higher solid-to-solvent ratio. However, it was observed that the variation in ultrasound power does not exert much difference on the extraction yield. This observation proves that efficient energy processing can be achieved even at low sonication power for small-scale extraction of β-asarone from A. calamus.
Using the kinetic model as represented in Equation (1), we can further analyze the effect of sonication upon the washing- and diffusion-dominance stages of extraction. It was interesting to note that for the 1:100 solid-to-solvent ratio, the rate of washing stage (kw) increment was very dependent on the sonication power used. The increments were ~1.5-fold (852/569 × 10−3), ~1.4-fold (816/569 × 10−3) and ~1.1-fold (633/569 × 10−3) for 70%, 50% and 30% ultrasound power applied, respectively. The same trend was observed for the 1:50 solid-to-solvent ratio condition with increments of ~1.6 (815/485 × 10−3), ~2.2 (1055/485 × 10−3), and ~1.8 (870/485 × 10−3) for 70, 50 and 30% ultrasound power applied, respectively. Such observation implies the significant ultrasound influence on the washing stage during the extraction process. Further discussion on the physical effect of sonication on the washing mechanistic stage will be presented in the following section.
A similar trend was observed for the rates of diffusion stage (kd). For the 1:100 solid-to-solvent ratio, the kd were found to increase by ~1.3-fold (146/112 × 10−3), ~1.3-fold (142/112 × 10−3) and ~1.1-fold (120/112 × 10−3) for 70, 50 and 30% ultrasound power applied, respectively. For the 1:50 solid-to-solvent ratio, the kd were found to increase by ~1.4-fold (141/100 × 10−3), ~1.7-fold (168/100 × 10−3), and ~1.5-fold (148/100 × 10−3) for 70, 50, and 30% ultrasound power applied, respectively. This could also represent the ability of ultrasound to positively influence the diffusion process.
3.3. The Physical Effect of Sonication in UAE
The extract of the ultrasound-assisted process was subjected to isolation, purification and characterization similar to the extract from conventional solvent extraction. The extraction product including β-asarone was found to be the same, confirming that the ultrasound process does not change any of the compound structure. Therefore, it is safe to deduce the qualitative characteristics of A. calamus extract, including its biochemical activity is impervious to ultrasound irradiation in this study. The significant efficiency increase in the extraction is due to the physical effect of sonication.
There have been many reports on the physical effect of ultrasonication during the extraction process [26,39,40,41]. In this study, similar effects were observed from the SEM images. The dried A. calamus rhizomes (Figure 7a) were ground to uniform sizes as shown in Figure 7b. The SEM images of the ground samples are shown in Figure 7c,d with their usual matrix characteristics such as fibers secretion, and oil sacs. The active compounds of the plants are available on the surface or exterior of the matrices, as well as enveloped in the oil sacs.
During the solvent extraction process, the active compounds available on the plant matrices are extracted mostly via the washing mechanism, whilst the active compounds in the oil sacs are extracted by the process of diffusion. This is clearly visible in the SEM images of the A. calamus residue after solvent extraction, as shown in Figure 8. The secretion or oil glands are now depleted and flattened. The diffusion process induced by the solvent has caused the sacs to be emptied. However, the plant structures are still well intact, without any significant rupture or damage.
The SEM images of plant residue upon ultrasound-assisted extraction were also taken to compare the impact of sonication on the plant structure. By a quick look at the four images in Figure 9 and comparing them to the images in Figure 7 and Figure 8, it can be clearly seen that the plant structures are heavily impacted by the process of sonication. Sonication results in acoustic cavitation, in which the formation and growth was by rectified diffusion, and the collapse of microbubbles. The process leads to high shear forces in the media. The implosion of microbubbles on a plant matrix results in micro jetting which generates effects such as particle breakdown or formation of pores [39]. Many of the cell walls are ruptured, therefore also breaking the sacs and cells. The strong agitation from microbubble oscillation and implosion could result in the fragmentation of the structures into smaller pieces, thus increasing the surface areas for contact with the solvent, thus improving the extraction efficiency. The damages of sonofragmentation effect can be seen in all four pictures; an example is in Figure 9a. Sonofragmentation effect can be seen resulting from bubble collapse, as well as the collision of the particles during ultrasound-induced streaming. The surface of the plant matrix had also been eroded by the physical action of ultrasound, as seen in Figure 9b. The visible impact of erosion is due to the release of solid structures into the solvent [26]. These are among the physical impacts of sonication that increase the extraction during the washing mechanism by decreasing the diffusion boundary, thus accelerating mass transfer to the solvent phase [42]. The effect of sonoporation can also be seen in Figure 9c. The pores formed are due to the microbubble implosion on the surface of the structure. The pores will increase the membrane permeability, which in turn discharges the active compounds [43]. The ultrasound-induced maceration is also evident in Figure 9d. The sacs were seen to be attached at the surface of the rhizome but pushed deeper into the surrounding structure. The ultrasound-induced maceration is caused when the microjet generation from microbubble implosion jets directly towards the sacs, thus pushing the sac deeper, yet, releasing the oil into the surrounding [44].
The assistance of ultrasound also happens at a bigger scale. The oscillation of the microbubbles results in microstreaming which causes turbulence and disruptions to the solid samples, thus facilitating the mixing around the solvent, as well as enhancing the mass transfer [39]. The alternating compression and rarefaction ultrasound waves will also induce a sponge effect on the system. Apart from that, the implosion of the microbubbles will also increase the temperature during extraction. This mimics and improves the necessary factor as in the conventional solvent extraction.
4. Conclusions
In this study, β-asarone was successfully extracted from a species of A. calamus found in the northern part of Malaysia. The extraction was carried out using two techniques—the conventional solvent and ultrasound-assisted extraction at different solid-to-solvent ratios and sonication powers. The extraction yields were quantified using the HPLC technique. The results allowed detailed quantitative analysis of the naturally occurring β-asarone, as well as providing a foundation for the evaluation of the two extraction techniques’ efficiency. It was found that sonication can improve extraction efficiency and processing feasibility even at low power. The chemical structure of β-asarone was not affected by the sonification process, thus preserving the benefits of the compound β-asarone.
Supplementary Materials
The following supporting information can be downloaded at: https://www.mdpi.com/article/10.3390/app122111007/s1, Figure S1: Calibration curve of the pure β-asarone; Figure S2: COSY Spectrum of β-asarone; Figure S3: DEPT-135 Spectrum of β-asarone; Figure S4: HSQC Spectrum of β-asarone; Figure S5: HMBC Spectrum of β-asarone.
Author Contributions
Conceptualization, N.S.M.Y. and M.A.; methodology, N.O.; formal analysis, N.O.; investigation, N.O.; resources, N.S.M.Y. and Y.-M.C.; writing—original draft preparation, N.O. and N.S.M.Y.; writing—review and editing, N.S.M.Y.; supervision, N.S.M.Y. and Y.-M.C.; project administration, N.S.M.Y.; funding acquisition, N.S.M.Y. All authors have read and agreed to the published version of the manuscript.
Funding
This study was supported by grant from the Ministry of Higher Education under the Fundamental Research Grant Scheme (FRGS/1/2019/STG07/UM/02/2) and N.O. acknowledges the Ministry of Higher Education Malaysia for the MyBrain15 scholarship.
Institutional Review Board Statement
Not applicable (studies not involving humans or animals).
Informed Consent Statement
Not applicable.
Data Availability Statement
Data can be provided upon request to the corresponding author.
Conflicts of Interest
The authors declare no conflict of interest.
References
- Seidemann, J. World Spice Plants: Economic Usage, Botany, Taxonomy; Springer: Berlin/Heidelberg, Germany, 2005. [Google Scholar]
- Gao, E.; Zhou, Z.Q.; Zou, J.; Yu, Y.; Feng, X.L.; Chen, G.D.; He, R.R.; Yao, X.S.; Gao, H. Bioactive Asarone-Derived Phenylpropanoids from the Rhizome of Acorus tatarinowii Schott. J. Nat. Prod. 2017, 80, 2923. [Google Scholar] [CrossRef] [PubMed]
- Yang, Y.X.; Chen, Y.T.; Zhou, X.J.; Hong, C.L.; Li, C.Y.; Guo, J.Y. Beta-asarone, a major component of Acorus tatarinowii Schott, attenuates focal cerebral ischemia induced by middle cerebral artery occlusion in rats. BMC Complement. Altern. Med. 2013, 13, 236. [Google Scholar] [CrossRef] [PubMed] [Green Version]
- Zuba, D.; Byrska, B. Alpha- and beta-asarone in herbal medicinal products. A case study. Forensic Sci. Int. 2012, 223, e5–e9. [Google Scholar] [CrossRef] [PubMed]
- Rajput, S.B.; Tonge, M.B.; Karuppayil, S.M. An overview on traditional uses and pharmacological profile of Acorus calamus Linn. (Sweet flag) and other Acorus species. Phytomedicine 2014, 21, 268–276. [Google Scholar] [CrossRef] [PubMed]
- Uebel, T.; Hermes, L.; Haupenthal, S.; Müller, L.; Esselen, M. α-Asarone, β-asarone, and γ-asarone: Current status of toxicological evaluation. J. Appl. Toxicol. 2021, 41, 1166–1179. [Google Scholar] [CrossRef]
- Park, C.H.; Kim, K.H.; Lee, I.K.; Lee, S.Y.; Choi, S.U.; Lee, J.H.; Lee, K.R. Phenolic constituents of Acorus gramineus. Arch. Pharmacal Res. 2011, 34, 1289–1296. [Google Scholar] [CrossRef]
- Chellian, R.; Pandy, V.; Mohamed, Z. Pharmacology and toxicology of α- and β-Asarone: A review of preclinical evidence. Phytomedicine 2017, 32, 41–58. [Google Scholar] [CrossRef]
- Das, B.K.; Swamy, A.H.M.V.; Koti, B.C.; Gadad, P.C. Experimental evidence for use of Acorus calamus (asarone) for cancer chemoprevention. Heliyon 2019, 5, e01585. [Google Scholar] [CrossRef] [Green Version]
- Geng, Y.; Li, C.; Liu, J.; Xing, G.; Zhou, L.; Dong, M.; Li, X.; Niu, Y. Beta-asarone improves cognitive function by suppressing neuronal apoptosis in the beta-amyloid hippocampus injection rats. Biol. Pharm. Bull. 2010, 33, 836–843. [Google Scholar] [CrossRef] [Green Version]
- Fu, S.Y.; Fang, R.M.; Fang, G.L.; Xie, Y.H.; Fang, Y.Q. Effects of beta-asarone on expression of FOS and GAD65 in cortex of epileptic rat induced by penicillin. J. Chin. Med. Mater. 2008, 31, 79–81. [Google Scholar]
- Qi, H.; Chen, L.; Ning, L.; Ma, H.; Jiang, Z.; Fu, Y.; Li, L. Proteomic analysis of β-asarone induced cytotoxicity in human glioblastoma U251 cells. J. Pharm. Biomed. Anal. 2015, 115, 292–299. [Google Scholar] [CrossRef]
- Meng, X.; Liao, S.; Wang, X.; Wang, S.; Zhao, X.; Jia, P.; Pei, W.; Zheng, X.; Zheng, X. Reversing P-glycoprotein-mediated multidrug resistance in vitro by α-asarone and β-asarone, bioactive cis–trans isomers from Acorus tatarinowii. Biotechnol. Lett. 2014, 36, 685–691. [Google Scholar] [CrossRef]
- Björnstad, K.; Helander, A.; Hultén, P.; Beck, O. Bioanalytical investigation of asarone in connection with Acorus calamus oil intoxications. J. Anal. Toxicol. 2009, 33, 604–609. [Google Scholar] [CrossRef] [Green Version]
- Hasheminejad, G.; Caldwell, J. Genotoxicity of the alkenylbenzenes alpha- and beta-asarone, myristicin and elimicin as determined by the UDS assay in cultured rat hepatocytes. Food Chem. Toxicol. 1994, 32, 223–231. [Google Scholar] [CrossRef]
- Unger, P.; Melzig, M.F. Comparative study of the cytotoxicity and genotoxicity of alpha- and Beta-asarone. Sci. Pharm. 2012, 80, 663–668. [Google Scholar] [CrossRef] [Green Version]
- US Goverment Printing Office. Title 21, Food and Drugs, 21CFR189.110. In Code of Federal Regulations; US Goverment Printing Office: Washington, DC, USA, 2019. [Google Scholar]
- Scientific Committee on Food, E.C. Opinion of the Scientific Committee on Food on the Presence of β-Asarone in Flavorings and Other Food Ingredients with Flavoring Properties (SCF/CS/FLAV/FLAVOUR/9 ADD1 Final); European Medicines Agency (EMEA): Brussels, Belgium, 2002. [Google Scholar]
- Patel, D.N.; Ho, H.K.; Tan, L.L.; Tan, M.M.; Zhang, Q.; Low, M.Y.; Chan, C.L.; Koh, H.L. Hepatotoxic potential of asarones: In vitro evaluation of hepatotoxicity and quantitative determination in herbal products. Front. Pharmacol. 2015, 6, 25. [Google Scholar] [CrossRef]
- Committee on Herbal Medicinal Products. Public Statement on the Use of Herbal Medicinal Products Containing Asarone (EMEA/HMPC/139215/2005); European Medicines Agency (EMEA): London, UK, 2005. [Google Scholar]
- Lorenzo, J.M.; Agregán, R.; Munekata, P.E.S.; Franco, D.; Carballo, J.; Şahin, S.; Lacomba, R.; Barba, F.J. Proximate Composition and Nutritional Value of Three Macroalgae: Ascophyllum nodosum, Fucus vesiculosus and Bifurcaria bifurcata. Mar. Drugs 2017, 15, 360. [Google Scholar] [CrossRef] [Green Version]
- Dang, T.T.; Van Vuong, Q.; Schreider, M.J.; Bowyer, M.C.; Van Altena, I.A.; Scarlett, C.J. Optimisation of ultrasound-assisted extraction conditions for phenolic content and antioxidant activities of the alga Hormosira banksii using response surface methodology. J. Appl. Phycol. 2017, 29, 3161–3173. [Google Scholar] [CrossRef]
- Stramarkou, M.; Papadaki, S.; Kyriakopoulou, K.; Krokida, M. Effect of drying and extraction conditions on the recovery of bioactive compounds from Chlorella vulgaris. J. Appl. Phycol. 2017, 29, 2947–2960. [Google Scholar] [CrossRef]
- Dang, T.T.; Vuong, Q.V.; Schreider, M.J.; Bowyer, M.C.; Altena, I.A.V.; Scarlett, C.J. The Effects of Drying on Physico-Chemical Properties and Antioxidant Capacity of the Brown Alga (Hormosira banksii (Turner) Decaisne). J. Food Process. Preserv. 2017, 41, e13025. [Google Scholar] [CrossRef]
- Kentish, S.; Ashokkumar, M. The Physical and Chemical Effects of Ultrasound. In Ultrasound Technologies for Food and Bioprocessing; Feng, H., Barbosa-Cánovas, G.V., Weiss, J., Eds.; Food Engineering Series; Springer: New York, NY, USA, 2011; pp. 1–12. [Google Scholar]
- Chemat, F.; Rombaut, N.; Sicaire, A.-G.; Meullemiestre, A.; Fabiano-Tixier, A.-S.; Abert-Vian, M. Ultrasound assisted extraction of food and natural products. Mechanisms, techniques, combinations, protocols and applications. A review. Ultrason. Sonochemistry 2017, 34, 540–560. [Google Scholar] [CrossRef] [PubMed]
- Widmer, V.; Schibli, A.; Reich, E. Quantitative determination of beta-asarone in calamus by high-performance thin-layer chromatography. J. AOAC Int. 2005, 88, 1562–1567. [Google Scholar] [CrossRef] [PubMed] [Green Version]
- Pandit, S.; Mukherjee, P.K.; Gantait, A.; Ponnusankar, S.; Bhadra, S. Quantification of alpha-Asarone in Acorus calamus by Validated HPTLC Densitometric Method. J. Planar Chromatogr.-Mod. TLC 2011, 24, 541–544. [Google Scholar] [CrossRef]
- Hwang, S.H.; Kwon, S.H.; Kang, Y.H.; Lee, J.Y.; Lim, S.S. Rapid High Performance Liquid Chromatography Determination and Optimization of Extraction Parameters of the α-Asarone Isolated from Perilla frutescens L. Molecules 2017, 22, 270. [Google Scholar] [CrossRef] [PubMed] [Green Version]
- Yu, S.M.; Kim, E.K.; Lee, J.H.; Lee, K.R.; Hong, J. Development of Fingerprints for Quality Control of Acorus species by Gas Chromatography/Mass Spectrometry. Bull. Korean Chem. Soc. 2011, 32, 1547–1553. [Google Scholar] [CrossRef] [Green Version]
- Meng, X.; Zhao, X.F.; Wang, S.X.; Jia, P.; Bai, Y.J.; Liao, S.; Zheng, X.H. Simultaneous Determination of Volatile Constituents from Acorus tatarinowii Schott in Rat Plasma by Gas Chromatography-Mass Spectrometry with Selective Ion Monitoring and Application in Pharmacokinetic Study. J. Anal. Methods Chem. 2013, 2013, 949830. [Google Scholar] [CrossRef] [Green Version]
- Nandakumar, S.; Menon, S.; Shailajan, S. A rapid HPLC-ESI-MS/MS method for determination of beta-asarone, a potential anti-epileptic agent, in plasma after oral administration of Acorus calamus extract to rats. Biomed. Chromatogr. 2013, 27, 318–326. [Google Scholar] [CrossRef]
- Hermes, L.; Römermann, J.; Cramer, B.; Esselen, M. Phase II Metabolism of Asarone Isomers In Vitro and in Humans Using HPLC-MS/MS and HPLC-qToF/MS. Foods 2021, 10, 2032. [Google Scholar] [CrossRef]
- Zhong, S.; Zhang, K.; Shen, L.; Jin, X.; Chen, R.; Shen, W. Iron (III)-mediated degradation of α-asarone and characterization of its major degradation products by UPLC-MS/MS and NMR. Pharmazie 2021, 76, 588–593. [Google Scholar] [CrossRef]
- Ying, X.H.; Pei, Y.; Liu, M.Y.; Ding, G.Y.; Jiang, M.; Liang, Q.L.; Wang, Y.M.; Bai, G.; Luo, G.A. Discrimination and quantification analysis of Acorus calamus L. and Acorus tatarinowii Schott with near-infrared reflection spectroscopy. Anal. Methods 2014, 6, 4212–4218. [Google Scholar] [CrossRef]
- So, G.C.; Macdonald, D.G. Kinetics of oil extraction from canola (rapeseed). Can. J. Chem. Eng. 1986, 64, 80–86. [Google Scholar] [CrossRef]
- Takeuchi, T.M.; Pereira, C.G.; Braga, M.E.M.; Maróstica, M.R.; Leal, P.F.; Meireles, M.A.A. Low-Pressure Solvent Extraction (Solid-Liquid Extraction, Microwave Assisted, and Ultrasound Assisted) from Condimentary Plants. In Extracting Bioactive Compounds for Food Products; Meireles, M.A.A., Ed.; CRC Press: Boca Raton, FL, USA, 2008. [Google Scholar]
- β-Asarone. In Cayman Chemical. Available online: https://www.caymanchem.com/product/11682/β-Asarone (accessed on 14 July 2022).
- Ashokkumar, M.; Mason, T.J. Sonochemistry. In Kirk-Othmer Encyclopedia of Chemical Technology; John Wiley & Sons, Inc.: Hoboken, NJ, USA, 2007. [Google Scholar]
- Fu, X.; Belwal, T.; Cravotto, G.; Luo, Z. Sono-physical and sono-chemical effects of ultrasound: Primary applications in extraction and freezing operations and influence on food components. Ultrason. Sonochemistry 2020, 60, 104726. [Google Scholar] [CrossRef] [PubMed]
- Lv, S.; Taha, A.; Hu, H.; Lu, Q.; Pan, S. Effects of Ultrasonic-Assisted Extraction on the Physicochemical Properties of Different Walnut Proteins. Molecules 2019, 24, 4260. [Google Scholar] [CrossRef] [PubMed] [Green Version]
- Tao, Y.; Sun, D.-W. Enhancement of Food Processes by Ultrasound: A Review. Crit. Rev. Food Sci. Nutr. 2015, 55, 570–594. [Google Scholar] [CrossRef]
- Meullemiestre, A.; Breil, C.; Abert-Vian, M.; Chemat, F. Microwave, ultrasound, thermal treatments, and bead milling as intensification techniques for extraction of lipids from oleaginous Yarrowia lipolytica yeast for a biojetfuel application. Bioresour. Technol. 2016, 211, 190–199. [Google Scholar] [CrossRef]
- Veillet, S.; Tomao, V.; Chemat, F. Ultrasound assisted maceration: An original procedure for direct aromatisation of olive oil with basil. Food Chem. 2010, 123, 905–911. [Google Scholar] [CrossRef]
Figure 1.
The (a) ultrasonic-assisted and (b) conventional solvent extraction processes in obtaining the pure asarone from A. calamus rhizome.
Figure 1.
The (a) ultrasonic-assisted and (b) conventional solvent extraction processes in obtaining the pure asarone from A. calamus rhizome.

Figure 2.
The HPLC spectrum of β-asarone (1.7 min; >95% purity).

Figure 3.
(a) The chemical structure, (b) UV, (c) IR and (d) HRMS spectra of β-asarone.

Figure 4.
(a) 1H-NMR (CDCl3, 400 MHz) and (b) 13C-NMR (CDCl3, 100 MHz) spectra of asarone.

Figure 5.
The extraction progress plot of β-asarone at solid-to-solvent ratio 1:100 with sonication power of 70 (□), 50 (×), 30% (∆), and in the absence of sonication, with the presence of temperature (○) and without (◊). The lines were plotted with the calculated value according to Equation (1) for sonication power of 70 (dashed line), 50 (dotted line), 30% (straight line), and in the absence of sonication with the presence of temperature (dash-dot line) and without (long dashed line).

Figure 6.
The extraction progress plot of β-asarone at solid-to-solvent ratio 1:50 with sonication power of 70 (□), 50 (×), 30% (∆), and with the presence of temperature (○) and without (◊). The lines were plotted with the calculated value according to Equation (1) for sonication power of 70 (dashed line), 50 (dotted line), 30% (straight line), and in the absence of sonication with the presence of temperature (dash-dot line) and without (long dashed line).

Figure 7.
The (a) dried and (b) ground A. calamus samples. (c,d) are the plant matrices with visible structures of fiber and oil glands at 1000× magnification.
Figure 7.
The (a) dried and (b) ground A. calamus samples. (c,d) are the plant matrices with visible structures of fiber and oil glands at 1000× magnification.

Figure 8.
The SEM images of the A. calamus residue after the solvent extraction process. Both images (a) and (b) shows the collapsed oil glands at different magnifications after the active compound is extracted. Image (a) was taken at 3000× magnification and image (b) at 1000× magnification.
Figure 8.
The SEM images of the A. calamus residue after the solvent extraction process. Both images (a) and (b) shows the collapsed oil glands at different magnifications after the active compound is extracted. Image (a) was taken at 3000× magnification and image (b) at 1000× magnification.

Figure 9.
The SEM images of the A. calamus residue after the ultrasound-assisted extraction process. The images are evidence of physical impact from ultrasound due to (a) fragmentation, (b) erosion, (c) sonoporation and (d) ultrasound-induced maceration.
Figure 9.
The SEM images of the A. calamus residue after the ultrasound-assisted extraction process. The images are evidence of physical impact from ultrasound due to (a) fragmentation, (b) erosion, (c) sonoporation and (d) ultrasound-induced maceration.


Table 1.
The extract yield, Yt of the extraction in the presence and absence of ultrasound. The values of cw, kw, cd and kd.
Table 1.
The extract yield, Yt of the extraction in the presence and absence of ultrasound. The values of cw, kw, cd and kd.
| Solid-to-Solvent Ratio (g:mL) | Sonication Power c (%) | Extract Yield | cW | 103 kW | cd | 103 kd |
|---|---|---|---|---|---|---|
| f Yt (µg/g) | ||||||
| 1:100 a | 30 | 5.869 ± 0.024 | 2.860 ± 0.128 | 633 ± 28 | 3.071 ± 0.110 | 120 ± 6 |
| 50 | 5.867 ± 0.029 | 3.222 ± 0.132 | 816 ± 36 | 2.657 ± 0.116 | 142 ± 9 | |
| 70 | 5.532 ± 0.029 | 3.099 ± 0.125 | 852 ± 39 | 2.439 ± 0.111 | 146 ± 10 | |
| d 0T | 3.948 ± 0.015 | 1.833 ± 0.086 | 569 ± 25 | 2.179 ± 0.073 | 112 ± 6 | |
| e 0 | 2.352 ± 0.015 | 2.049 ± 0.109 | 273 ± 49 | n.a. | n.a. | |
| 1:50 b | 30 | 5.617 ± 0.030 | 3.176 ± 0.128 | 870 ± 40 | 2.444 ± 0.114 | 148 ± 10 |
| 50 | 5.511 ± 0.033 | 3.378 ± 0.135 | 1055 ± 52 | 2.120 ± 0.122 | 168 ± 14 | |
| 70 | 6.089 ± 0.031 | 3.338 ± 0.136 | 813 ± 136 | 2.765 ± 0.120 | 141 ± 9 | |
| d 0T | 5.039 ± 0.015 | 2.182 ± 0.111 | 485 ± 21 | 2.992 ± 0.092 | 100 ± 5 | |
| e 0 | 3.491 ± 0.015 | 3.245 ± 0.207 | 148 ± 27 | n.a. | n.a. |
n.a.—Not available; a 0.5 g of ground A. calamus in 50 mL of ethanol; b 1.0 g of ground A. calamus in 50 mL of ethanol; c The power percentage from the total power of 500 W ultrasonic unit; d The extraction was carried out in the absence of ultrasound assistance at 40–45 °C; e The extraction was carried out in the absence of ultrasound assistance at ambient temperature; f The yield of β-asarone per gram of A. calamus.
Publisher’s Note: MDPI stays neutral with regard to jurisdictional claims in published maps and institutional affiliations. |
© 2022 by the authors. Licensee MDPI, Basel, Switzerland. This article is an open access article distributed under the terms and conditions of the Creative Commons Attribution (CC BY) license (https://creativecommons.org/licenses/by/4.0/).
Share and Cite
MDPI and ACS Style
Omer, N.; Choo, Y.-M.; Ashokkumar, M.; Yusof, N.S.M. Ultrasound-Assisted Extraction of β-Asarone from Sweet Flag (Acorus calamus) Rhizome. Appl. Sci. 2022, 12, 11007. https://doi.org/10.3390/app122111007
AMA Style
Omer N, Choo Y-M, Ashokkumar M, Yusof NSM. Ultrasound-Assisted Extraction of β-Asarone from Sweet Flag (Acorus calamus) Rhizome. Applied Sciences. 2022; 12(21):11007. https://doi.org/10.3390/app122111007
Chicago/Turabian StyleOmer, Noridayu, Yeun-Mun Choo, Muthupandian Ashokkumar, and Nor Saadah Mohd Yusof. 2022. "Ultrasound-Assisted Extraction of β-Asarone from Sweet Flag (Acorus calamus) Rhizome" Applied Sciences 12, no. 21: 11007. https://doi.org/10.3390/app122111007
Note that from the first issue of 2016, this journal uses article numbers instead of page numbers. See further details here.