Article

Mobile Health App for Adolescents: Motion Sensor Data and Deep Learning Technique to Examine the Relationship between Obesity and Walking Patterns

1
Division of Computer Science and Engineering, Sun Moon University, Asan-si 31460, Korea
2
Department of Hospitality and Tourism Management, University of South Alabama, Mobile, AL 36688, USA
3
Department of Educational Technology, Research and Assessment, Northern Illinois University, DeKalb, IL 60115, USA
4
School of Nursing, University of Nevada, Las Vegas, NV 89154, USA
5
Department of Computer Science, University of Wisconsin-Whitewater, Whitewater, WI 53190, USA
6
Department of Social Work, University of Wisconsin-Whitewater, Whitewater, WI 53190, USA
7
Department of Computer Science, William Paterson University of New Jersey, Wayne, NJ 07470, USA
*
Author to whom correspondence should be addressed.
Appl. Sci. 2022, 12(2), 850; https://doi.org/10.3390/app12020850
Submission received: 18 November 2021 / Revised: 10 December 2021 / Accepted: 14 December 2021 / Published: 14 January 2022
(This article belongs to the Special Issue Advances in Biosignal Processing and Biomedical Data Analysis)

Abstract

:
With the prevalence of obesity in adolescents, and its long-term influence on their overall health, there is a large body of research exploring better ways to reduce the rate of obesity. A traditional way of maintaining an adequate body mass index (BMI), calculated by measuring the weight and height of an individual, is no longer enough, and we are in need of a better health care tool. Therefore, the current research proposes an easier method that offers instant and real-time feedback to the users from the data collected from the motion sensors of a smartphone. The study utilized the mHealth application to identify participants presenting the walking movements of the high BMI group. Using the feedforward deep learning models and convolutional neural network models, the study was able to distinguish the walking movements between nonobese and obese groups, at a rate of 90.5%. The research highlights the potential use of smartphones and suggests the mHealth application as a way to monitor individual health.

1. Introduction

Since 1960, obesity has continually increased in the United States of America. According to the National Heart, Lung, and Blood Institute, obesity has been acknowledged as a serious medical concern that is a major contributor to potential health risks, such as heart disease, type 2 diabetes (high blood sugar), high blood pressure, and so on [1,2]. According to the reports of the U.S. Department of Health and Human Services, more than 300,000 people died in one year because of the obesity epidemic in the United States [3,4]. More importantly, obesity in adolescents has tripled in the last thirty years in the United States [5]. It has been reported that 70% of the children with obesity are likely to become obese adults [6]. Accordingly, childhood obesity has become one of the major concerns in public health in the twenty-first century. Therefore, it is crucial to explore the possible ways of reducing childhood obesity.
Obesity has been found to influence an individual’s manner of walking, such as the joint and walking velocities [7,8], the movements of the ankle joint speed [9], peak extensor knee moments [10], knee joint loads [11], and so on. The human balance is achieved and maintained by a complex set of human sensorimotor and musculoskeletal systems that control vision, proprioception, vestibular function, muscle contraction, and more [12]. The human balance is used to diagnose disorders and diseases related to the nervous system [13], such as ataxia [14], cognitive deficits [15,16], Parkinson’s disease [17,18], vision problems [19], Alzheimer’ [15], and so on. The walking balance is a good method for capturing the human postural balance, as it requires the coordinated use of the visual, vestibular, and musculoskeletal systems. The walking balance can become less stable if an individual has experienced a stroke [20], or lower limb or back injury [21], because of the fragile biomechanical structures in the sensorimotor and musculoskeletal systems that influence how the human body moves while walking [22].
According to the health-belief model, perceived personal susceptibility increases prevention-seeking behaviors and treatments for obesity [23,24]. The recognition of one’s own obesity and its related health risks is a prerequisite for treating childhood obesity [25]. Articles addressing the management of obesity disease highlight the importance of self-care efforts in improving the effectiveness and efficiency of overall healthcare [26]. Self-recognition and self-care efforts are essential elements to preventing and treating obesity [27]. However, the weight increase in adolescents often occurs rapidly, which makes it difficult for them to recognize the body mass index (BMI) changes toward obesity. The current research attempts to address the matter by examining the walking movements of adolescents with deep learning. The study suggests an easy and convenient way for adolescents to monitor their walking movements leading to obesity using a smartphone. By self-recognizing their obesity level status in real time using the mHealth application and the deep learning model, students can become alert and encouraged to make self-care efforts.

2. Experiment Methods

2.1. Mobile Health Application

The mHealth application [28] was developed to measure and record rotational data in real time using an Android smartphone’s motion sensors [29]. The application was developed using software development kits (SDKs) greater than version 21 for use on Android mobile platforms [30]. The mHealth application was installed on the Samsung Galaxy S8, with the Android 7.0 mobile operating system.
The smartphone measures rotation through an angle using an axis (X, Y, Z). The mHealth application collects the rotation data in ten-millisecond intervals using the on-board accelerometer, a gyroscope, and a rotation vector software-based sensor. The data is then saved to an SQLite database and (comma-separated value) CSV files stored on the smartphone.

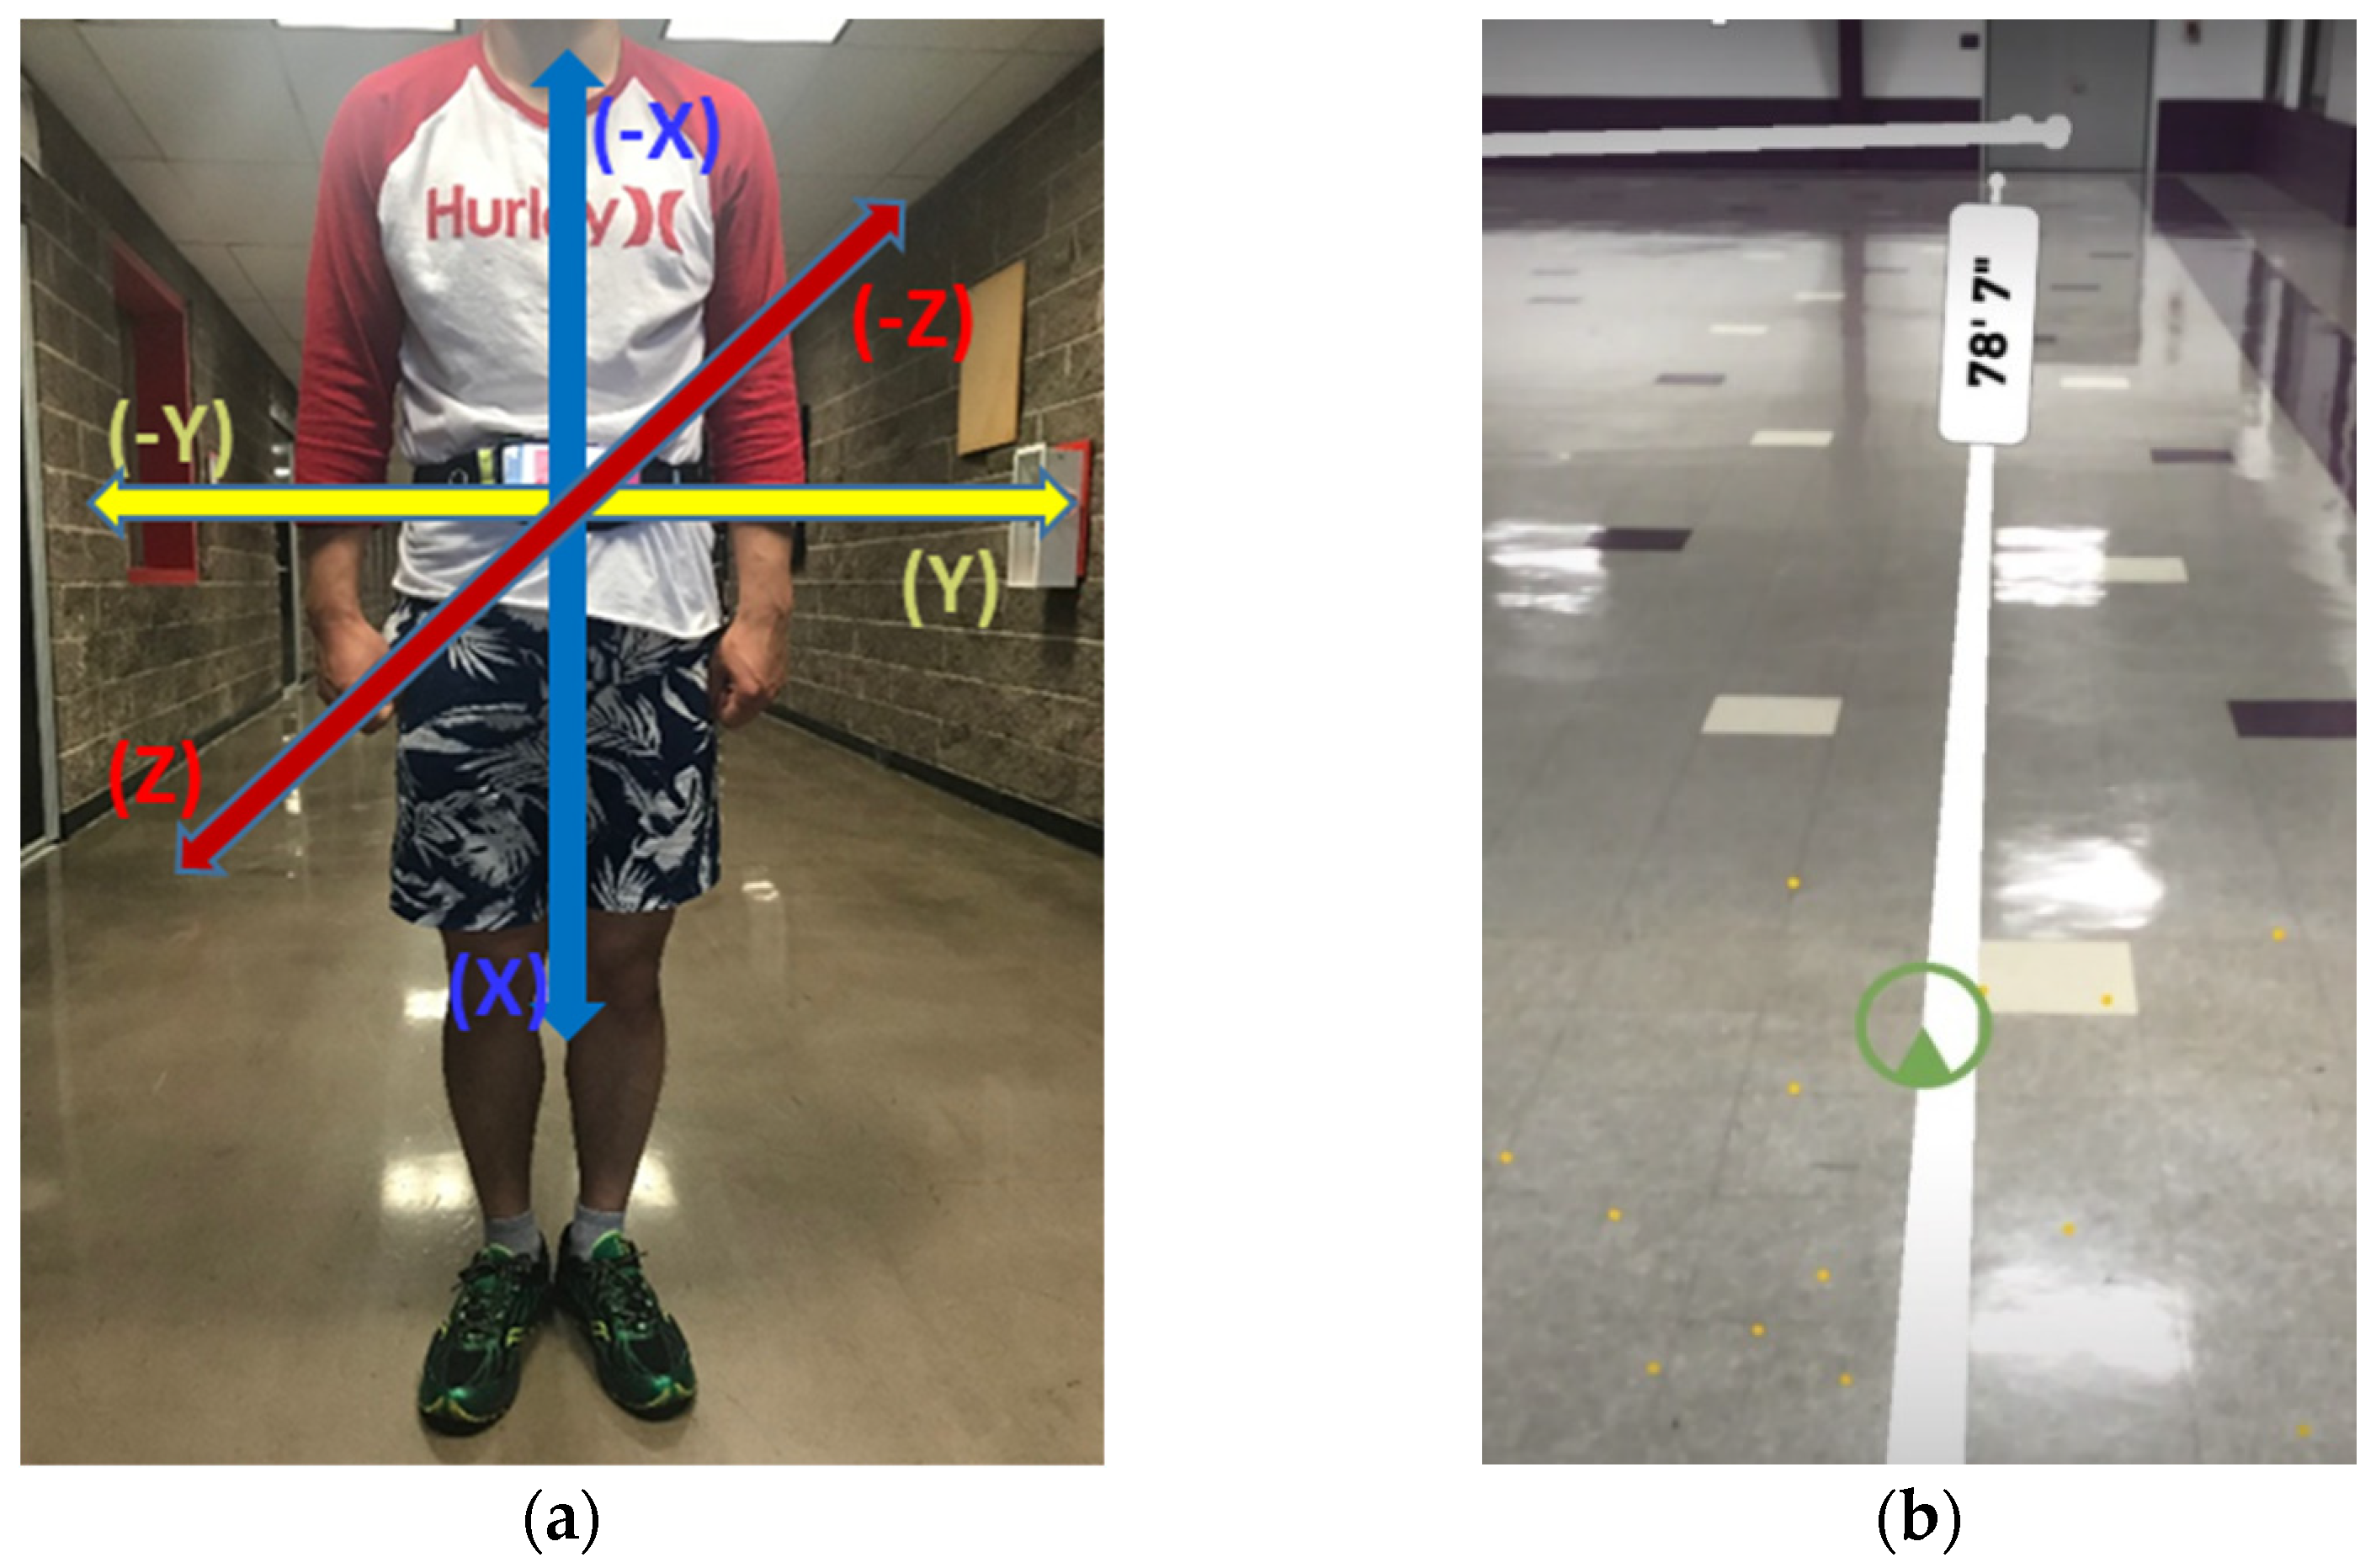
2.2. Data Collection

As shown in Figure 1, this research divides the student respondent samples into four parts (BMI 1, BMI 2, BMI 3, and BMI 4) using the BMI Percentile Calculator of the Centers for Disease Control and Prevention [31]. BMI 1 represents underweight adolescents, with a BMI% < 5th percentile, and BMI 2 is characterized as a healthy weight: 5th percentile ≤ BMI% < 85th percentile. BMI 3 represents an overweight group: 85th percentile ≤ BMI% < 95th percentile. The BMI 4 group is considered obese, with a BMI% ≥ 95th percentile.
We collected walking data from freshman students in high school in order to collect controlled data. High school students have grown up enough to walk well, and they are less exposed to drugs and alcohol than adults. A total of 244 freshmen in high school participated in the study, and their walking data were collected by the mHealth application. Among the 244 students, 32 students reported having traumatic brain injury (TBI) experience, 46 students experienced pain while walking, and 7 students had difficulties in walking. The 74 students with pre-existing conditions that may have influenced their walking patterns, such as TBI, were eliminated from the study. Therefore, the walking data of 170 students among 244 freshmen were used for the research.
Table 1 reflects the body mass index (BMI) for age (in months) chart for the freshmen, as suggested by the Centers for Disease Control and Prevention [32]. The students in the samples were 14 years old at the time of the data collection: October 2019. Thus, as presented in Table 1, we followed the BMIs for the age chart for 174.5 months old.
Demographic information, along with the BMI categories of the student participants (n = 170), are displayed in Table 2. In terms of gender, 86 (50.59%) female and 84 (49.41%) male students participated in the research. The same number of students were underweighted (BMI 1), representing 2.33% of female students and 2.38% of male students. More than 60% of students fell under the healthy weight group (BMI 3), 55 female students representing 63.95%, and 51 males representing 60.71%. The percentages of female and male students either overweight or obese are quite similar: 33.72% and 36.91%, respectively. However, for BMI 4, the number of male students with obesity was 17, which doubled the 8 female students in the same category.
Among the student samples, White was the dominant race, consisting of more than 75%, followed by Hispanic (10.59%), and other races (7.06%). Similar to the gender, there were 83 students with a healthy weight in the White category, consisting of 62.41%. There were about 3% of White students who were in the underweight group, while there were 20 who were obese, consisting of 15.04%. All the Black students, a sample of three, fell in the overweight group (BMI 3). Among the 18 Hispanic students, 13 students were in the healthy weight group, BMI 2, while 4 students were in the overweight group. Half of the Asian students were in BMI 2, and there was one student each for both BMI 3 and BMI 4. The students of other races were those with more than two races. A total of 5 students (41.67%) of other races were of healthy weights, and the rest of them were in BMI 3 (33.33%) and BMI 4 (25%).
During the experiment, all students wore the smartphone in the pocket of a waistband located at the center of the body, as shown in Figure 2a. The smartphone screen was placed facing toward the direction of travel, with its top turned to the right side of the body. The participants walked along a straight linear path at a comfortable pace in an indoor physical education (PE) room. The participants were also instructed to walk leisurely to an initial destination about 78 feet away from their current location and return to the starting location, as shown in Figure 2b. Upon returning, each participant walked a total of about 157 feet as a round trip. The mHealth application was activated when a participant pressed the start button on the main screen at the beginning of the trial. The mHealth application terminated the data collection when the participant returned to the starting location.

2.3. Data Preprocessing
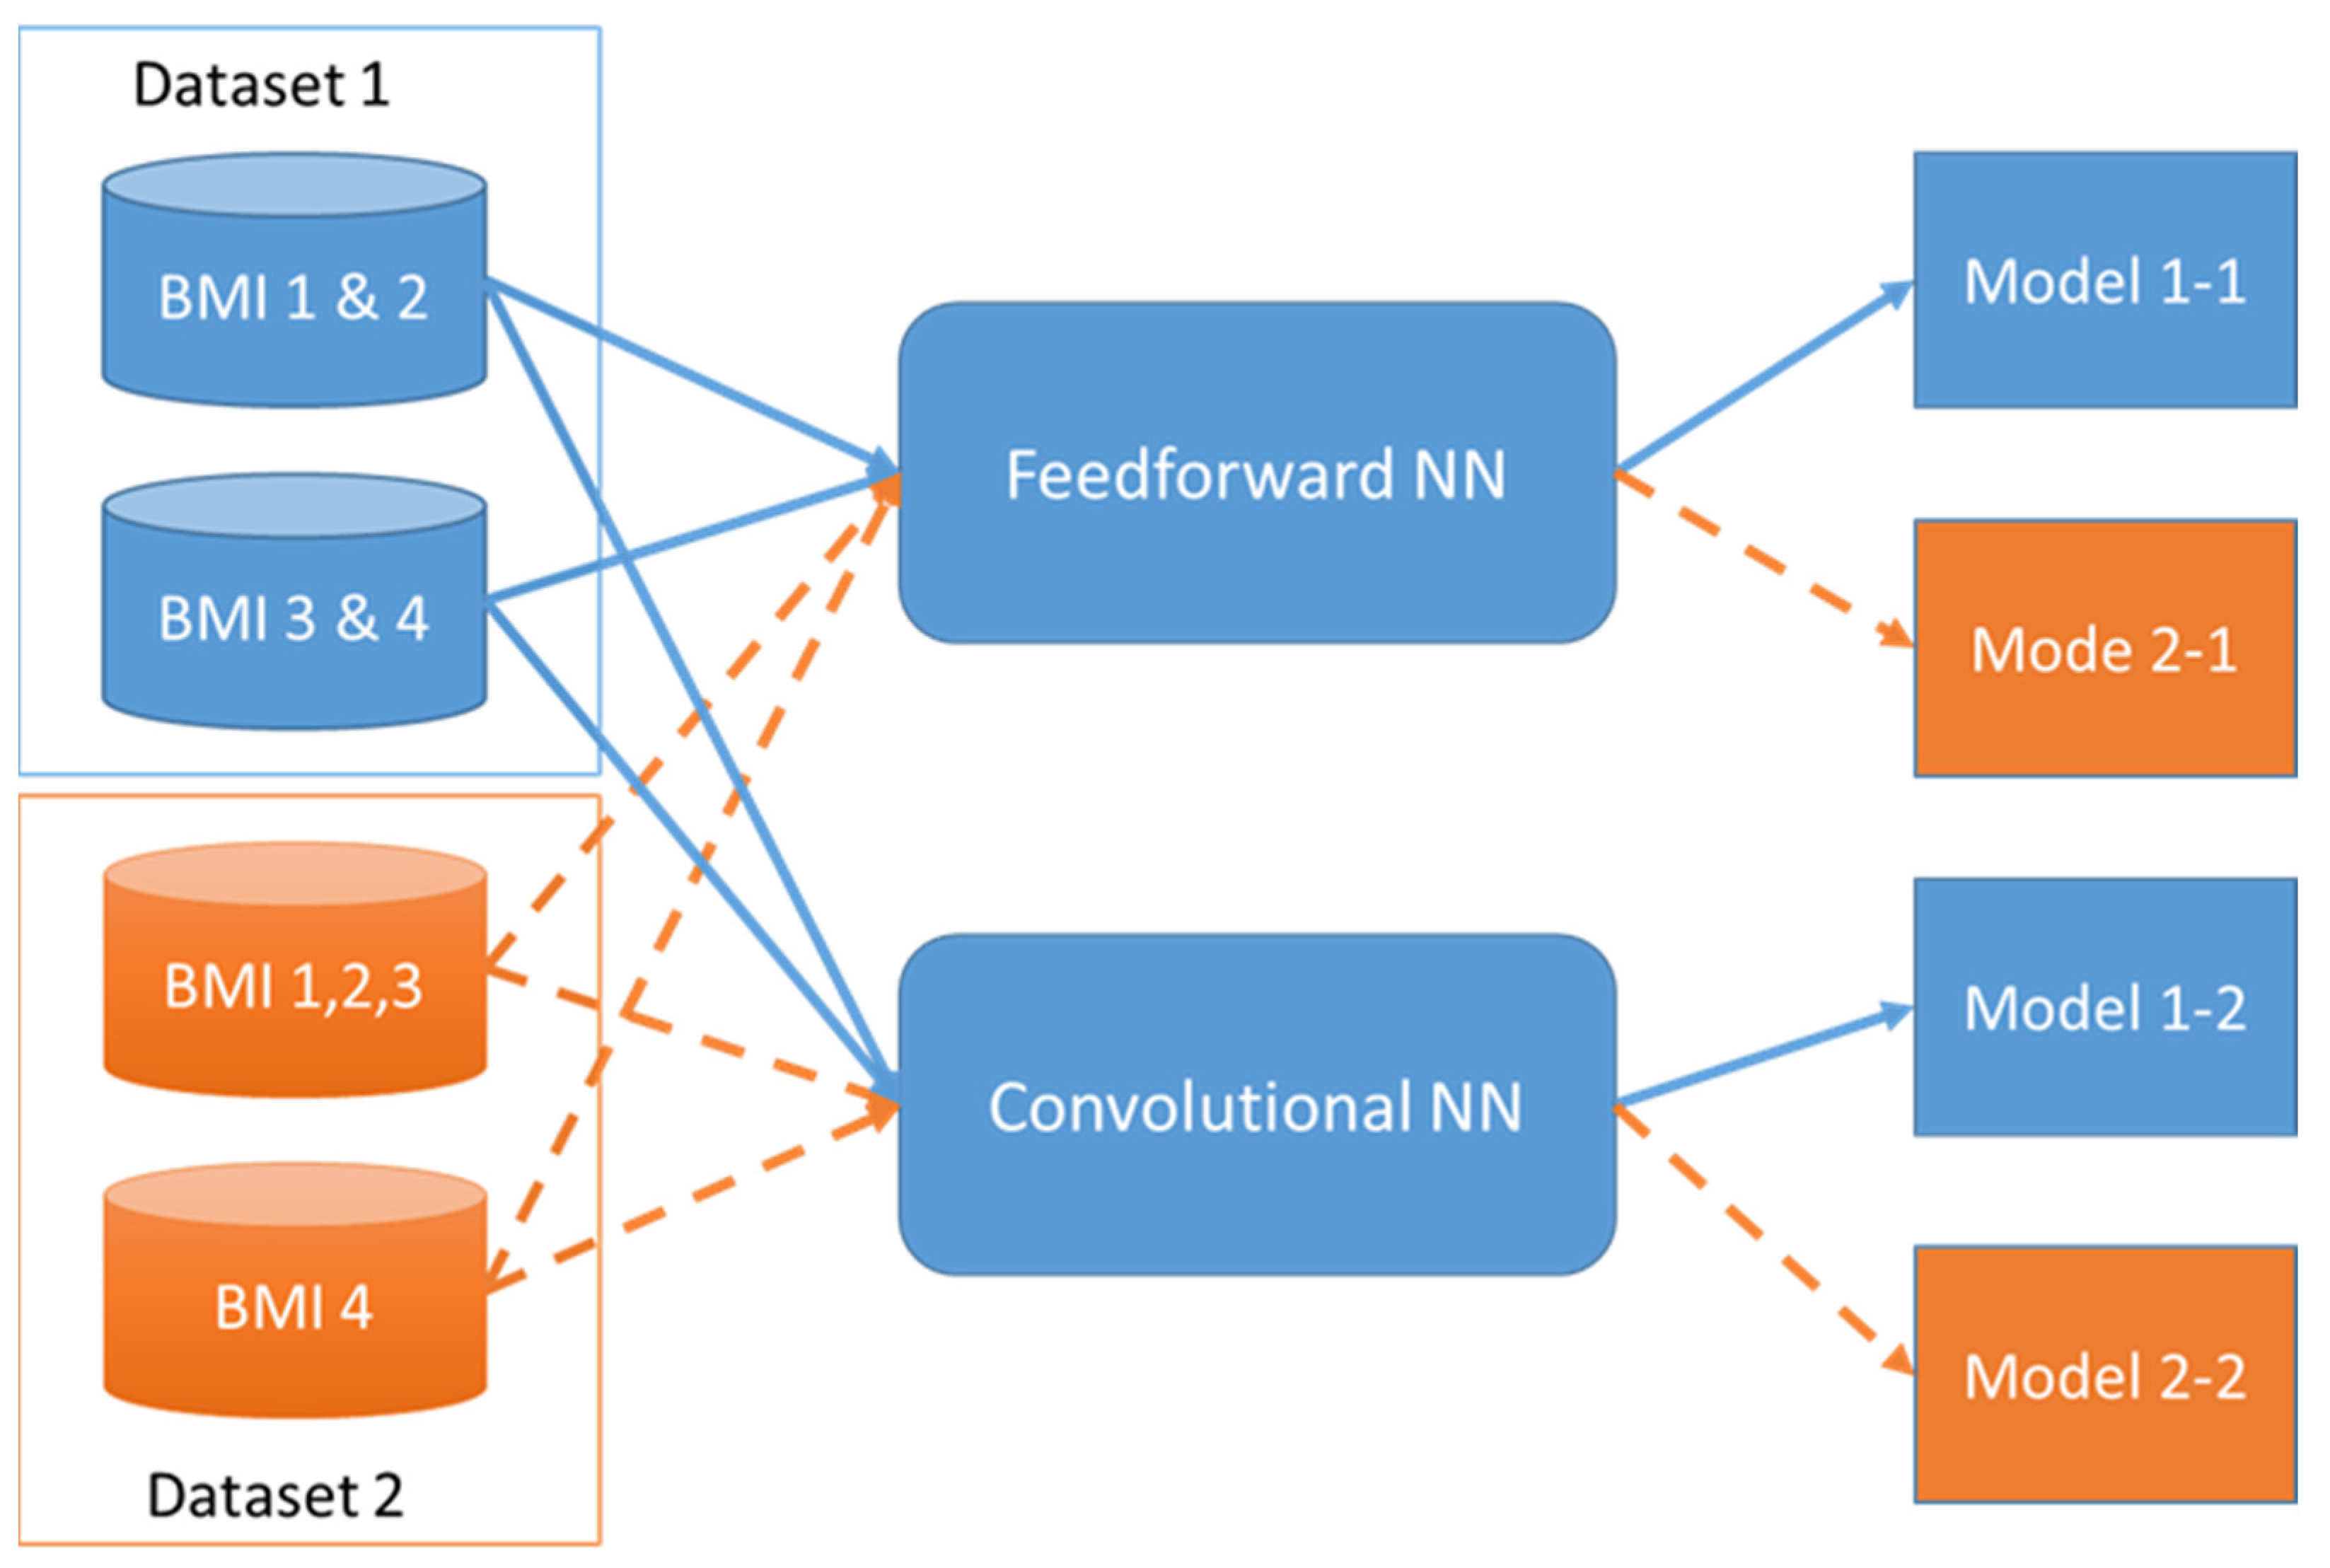
Considering the differentiation in the balance control for the participants while walking, the rotation vector data are the most effective [33,34,35]. Therefore, the rotation vectors were extrapolated from the rotation matrix data recorded with the smartphone and the mHealth application. Using the mHealth application, the X-, Y-, Z-axis rotation vectors of the middle of the waistline were identified as the center of gravity (COG) of each participant. The X-axis represents the body motion angle between the right and the left side of a participant. The Y-axis represents the body motion angle between the upward and the downward movement of a participant. The Z-axis represents the body motion angle between the forward and the backward movements of a participant (see Figure 2).
The X-, Y-, and Z-axis rotation vectors came from the rotation matrix. The rotation matrix data was collected using the rotation sensor in Android Open-Source Project (AOSP). Using the rotation sensor, the mHealth application determined the rotation matrix as:
A = [ cos θ cos ψ cos ϕ sin ψ + sin ϕ sin θ cos ψ sin ϕ sin ψ + cos ϕ sin θ cos ψ   cos θ sin ψ cos ϕ   cos ψ + sin ϕ sin θ sin ψ   sin ϕ cos ψ + cos ϕ sin θ sin ψ sin θ sin ϕ cos θ cos ϕ cos θ ]
Let the rotation matrix be as:
A = [ R 00 R 01 R 02 R 10 R 11 R 12 R 20 R 21 R 22 ]
From the rotation matrix (3 × 3), we extracted the rotation vector X-axis (RX), Y-axis (RY), and Z-axis (RZ) using the following formula [36]:
R x = ( R 21 R 12 ) ( R 21 R 12 ) 2 + ( R 02 R 20 ) 2 + ( R 10 R 01 ) 2  
R y = ( R 02 R 20 ) ( R 21 R 12 ) 2 + ( R 02 R 20 ) 2 + ( R 10 R 01 ) 2  
R z = ( R 10 R 01 ) ( R 21 R 12 ) 2 + ( R 02 R 20 ) 2 + ( R 10 R 01 ) 2  
Although each participant wore the smartphone on the same location of his/her body, the sensors in the smartphone appeared to be located with slightly different slopes. Therefore, we used the difference of the rotation between the current time (t) and the previous time (t − 1) for the data analysis:
V X = R X ( t ) R X ( t 1 ) V Y = R Y ( t ) R Y ( t 1 ) V Z = R Z ( t ) R Z ( t 1 )   }
We calculated the difference of each step’s rotation vector for the participants, using Formula (5) to create the new feature construction. This preprocessing data was used for the proposed analysis model. The analysis is explained in the next section.

3. Analysis Model

The current research constructed models using feedforward deep learning algorithms and convolutional neural networks. As a result, four different models were created, as presented in Figure 3. The participants that were underweight or that had healthy weights, BMI 1 and BMI 2, were merged into a group and labeled “0” in Dataset 1 of Figure 3, as supervised learning. The overweight and obese participants, categorized as BMI 3 or BMI 4, were merged into a group and labeled "1" for the purposes of training and testing the four models presented in Figure 3.
For example, BMI 3 (overweight), in Dataset 1, is in the obese group. BMI 1, BMI 2, and BMI 3 in Dataset 2 of Figure 3 are labeled "0". Thus, BMI 3 (overweight) in Dataset 2 is in the normal group. BMI 4 in Dataset 2 is labeled "1".
To train and test the four different models, the students were divided into two groups. One group, composed of the rotation vector data of 119 students, based on the X, Y, and Z data points, was utilized for training the proposed models, Model 1-1 to Model 2-2. For the other groups, the rest of the student data was used to test the proposed models. We analyzed the subjects’ nine rotation vectors’ components, along the X, Y, and Z axes. We removed the first and last five seconds of the walking data to prevent the overfitting of the model. Within the average time spent for the round trip per respondent, approximately 3000 (times) × 9 (nine vectors) data points were collected.
Dataset 1 and Dataset 2 in Figure 3 were fed to train the feedforward neural network for creating Model 1-1 and Model 1-2. Again, both datasets were fed to train the convolutional network for creating Model 2-1 and Model 2-2.
The data points in Dataset 1 and Dataset 2 in Model 1-1 and Model 1-2 were shuffled by the sample function [37] in R and were normalized by min–max normalization before training the feedforward neural network. Moreover, the input shape of Model 1-1 and Model 1-2 is 9: nine vectors of rotation.
The data points in Dataset 1 and Dataset 2 in Model 2-1 and Model 2-2 were normalized by min–max normalization. Then, 500 data points of each student were extracted to be used as one input data point in the convolutional neural network. The resulting input shape of Model 2-1 and Model 2-2 is 9 (nine vectors of rotation) × 500 × 1 (output labels).
Using Keras [38] and Tensorflow [39] with R, we build Algorithm 1 employing the feedforward neural network, and Algorithm 2 using the convolutional neural network. The feedforward neural network in Algorithm 1 uses one input layer, five hidden layers, and one output layer. The input layer is initialized by Glorot normal initialization [40]. The input shape of the input layer is nine rotation vectors. The activation function of the input and hidden layers uses the Relu function [41], and each layer has 512 neurons, and 50% of the neurons are randomly dropped to prevent the overfitting of the input data. The output layer has two neurons for distinguishing the group of students with obesity from the normal group. The activation function of the output layer uses the Softmax [42] function.
Algorithm 1. Feedforward NN
#init model
model <- keras_model_sequential()
initializer <- tf$keras$initializers$GlorotNormal()
unit<-512
# Build Model
model <- model %>%
layer_dense (units = unit, activation = ‘relu’, input_shape = shape(data_dim), kernel_initializer = initializer, name = “input_layer”) %>%
layer_dropout (rate = 0.5) %>%
layer_dense (units = unit,activation = ‘relu’,
       kernel_initializer = initializer,name=“hidden_layer1”) %>%
layer_dropout(rate = 0.5) %>%
layer_dense(units = unit,activation = ‘relu’,
       kernel_initializer = initializer,name=“hidden_layer2”) %>%
layer_dropout(rate = 0.5) %>%
layer_dense(units = unit,activation = ‘relu’,
       kernel_initializer = initializer,name=“hidden_layer3”) %>%
layer_dropout(rate = 0.5) %>%
layer_dense(units = unit,activation = ‘relu’,
       kernel_initializer = initializer,name=“hidden_layer4”) %>%
layer_dropout(rate = 0.5) %>%
layer_dense(units = unit,activation = ‘relu’,
       kernel initializer = initializer,name=“hidden_layer5”) %>%
layer_dropout (rate = 0.5) %>%
layer dense (units = nb_classes,name = “output_layer”)%>%
layer_activation (activation = ‘softmax’)
model$summary
# Compile model
model %>% compile (
loss = ‘categorical_crossentropy’,
optimizer = optimizer_adam(),
metrics = c(‘accuracy’)
)
model %>% fit (
x_train, y_train,
batch_size = 500,
epoch=50
)
scores<-model%>%evaluate (x_test, y_test,verbose=0)
print(scores)
Algorithm 2. Convolutional NN
#init model
model <- keras_model_sequential()
n_filter<-512
# Build Model
model <- model %>%
layer_conv_2d (filters = n_filter, kernel_size = c (3,3), activation = ‘relu’,
       input_shape = input_shape,
       padding = ‘same’,strides = c(2,2)) %>% layer_dropout(rate = 0.50) %>%
layer_conv_2d (filters = (n_filter*2), kernel_size = c (3,3), activation = ‘relu’,
       padding = ‘same’,strides = c(2,2)) %>%
layer_dropout(rate = 0.5) %>%
layer_conv_2d (filters = (n_filter*4), kernel_size = c (3,3), activation = ‘relu’,
       padding = ‘same’,strides = c(2,2)) %>%
layer_max_pooling_2d (pool_size = c (2, 2), padding = ‘same’) %>%
layer_dropout(rate = 0.5) %>%
layer_flatten() %>% # 2D ->1D
layer_dense(units = n_filter, activation = ‘relu’) %>%
layer_dropout(rate = 0.5) %>%
layer_dense(units = nb_classes, activation = ‘softmax’)
# Compile model
model %>% compile (
loss = ‘categorical_crossentropy’,
optimizer = optimizer_adadelta(),
metrics = c(‘accuracy’)
)
# Train model
model %>% fit (
x_train, y_train,
batch_size = 500,
epochs = 50, verbose=1
)
scores <- model %>% evaluate (
x_test, y_test, verbose = 0
)
The convolutional neural network in Algorithm 2 uses three convolution layers with the Relu activation function, one max pooling layer for the resizing layer, and two densely connected neural network layers for the output layer. The kernel size of three convolution layers are three widths and three heights, and the strides of the convolutional layers are two widths and two heights. The first convolution layer has 512 output filters. The second convolution layer has 1024 outputs, and the third convolution layer has 2048 outputs. The size of the outputs in the third convolution is resized by the layer_max_pooling_2d function. Moreover, the Relu and Softmax functions are used for the output layer. The convolution layers and the max-pooling layer use the padding to prevent data loss during the training in layers. Additionally, the two outputs are generated by the output layer to distinguish the normal from the obese group, the same as the output layer of Algorithm 1. The layers of the drop rate in Algorithm 2 are 50%.

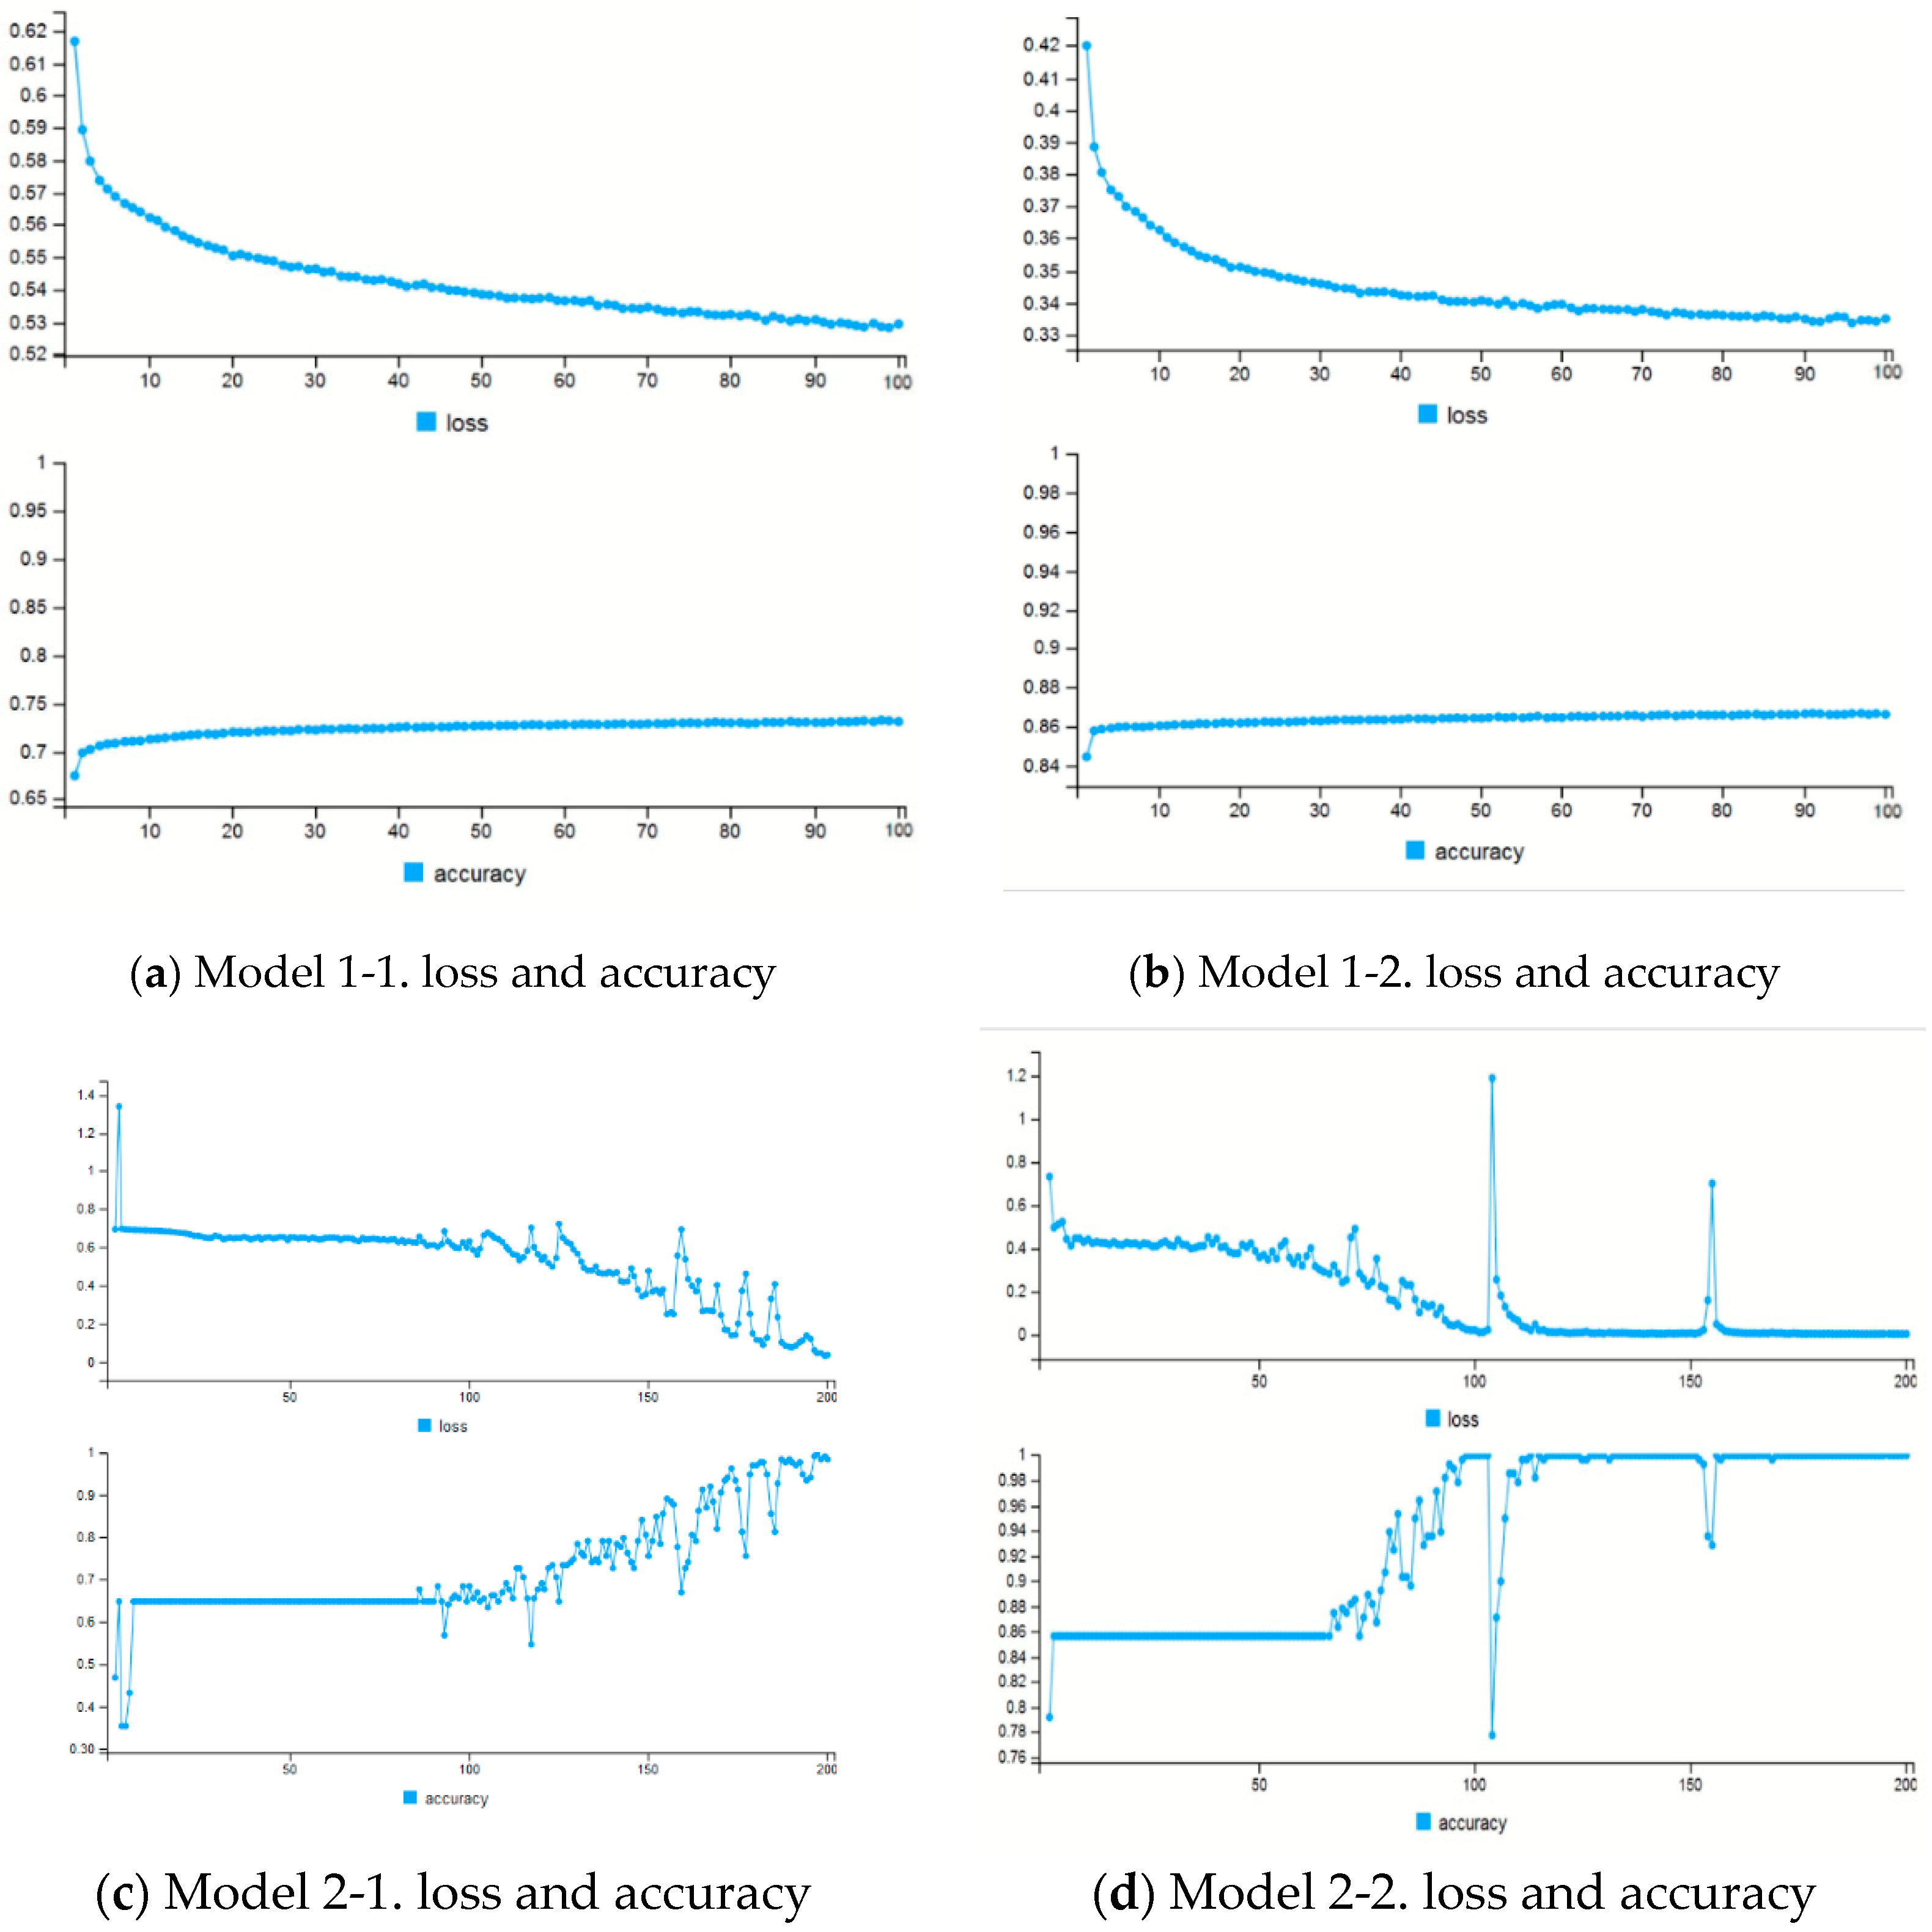
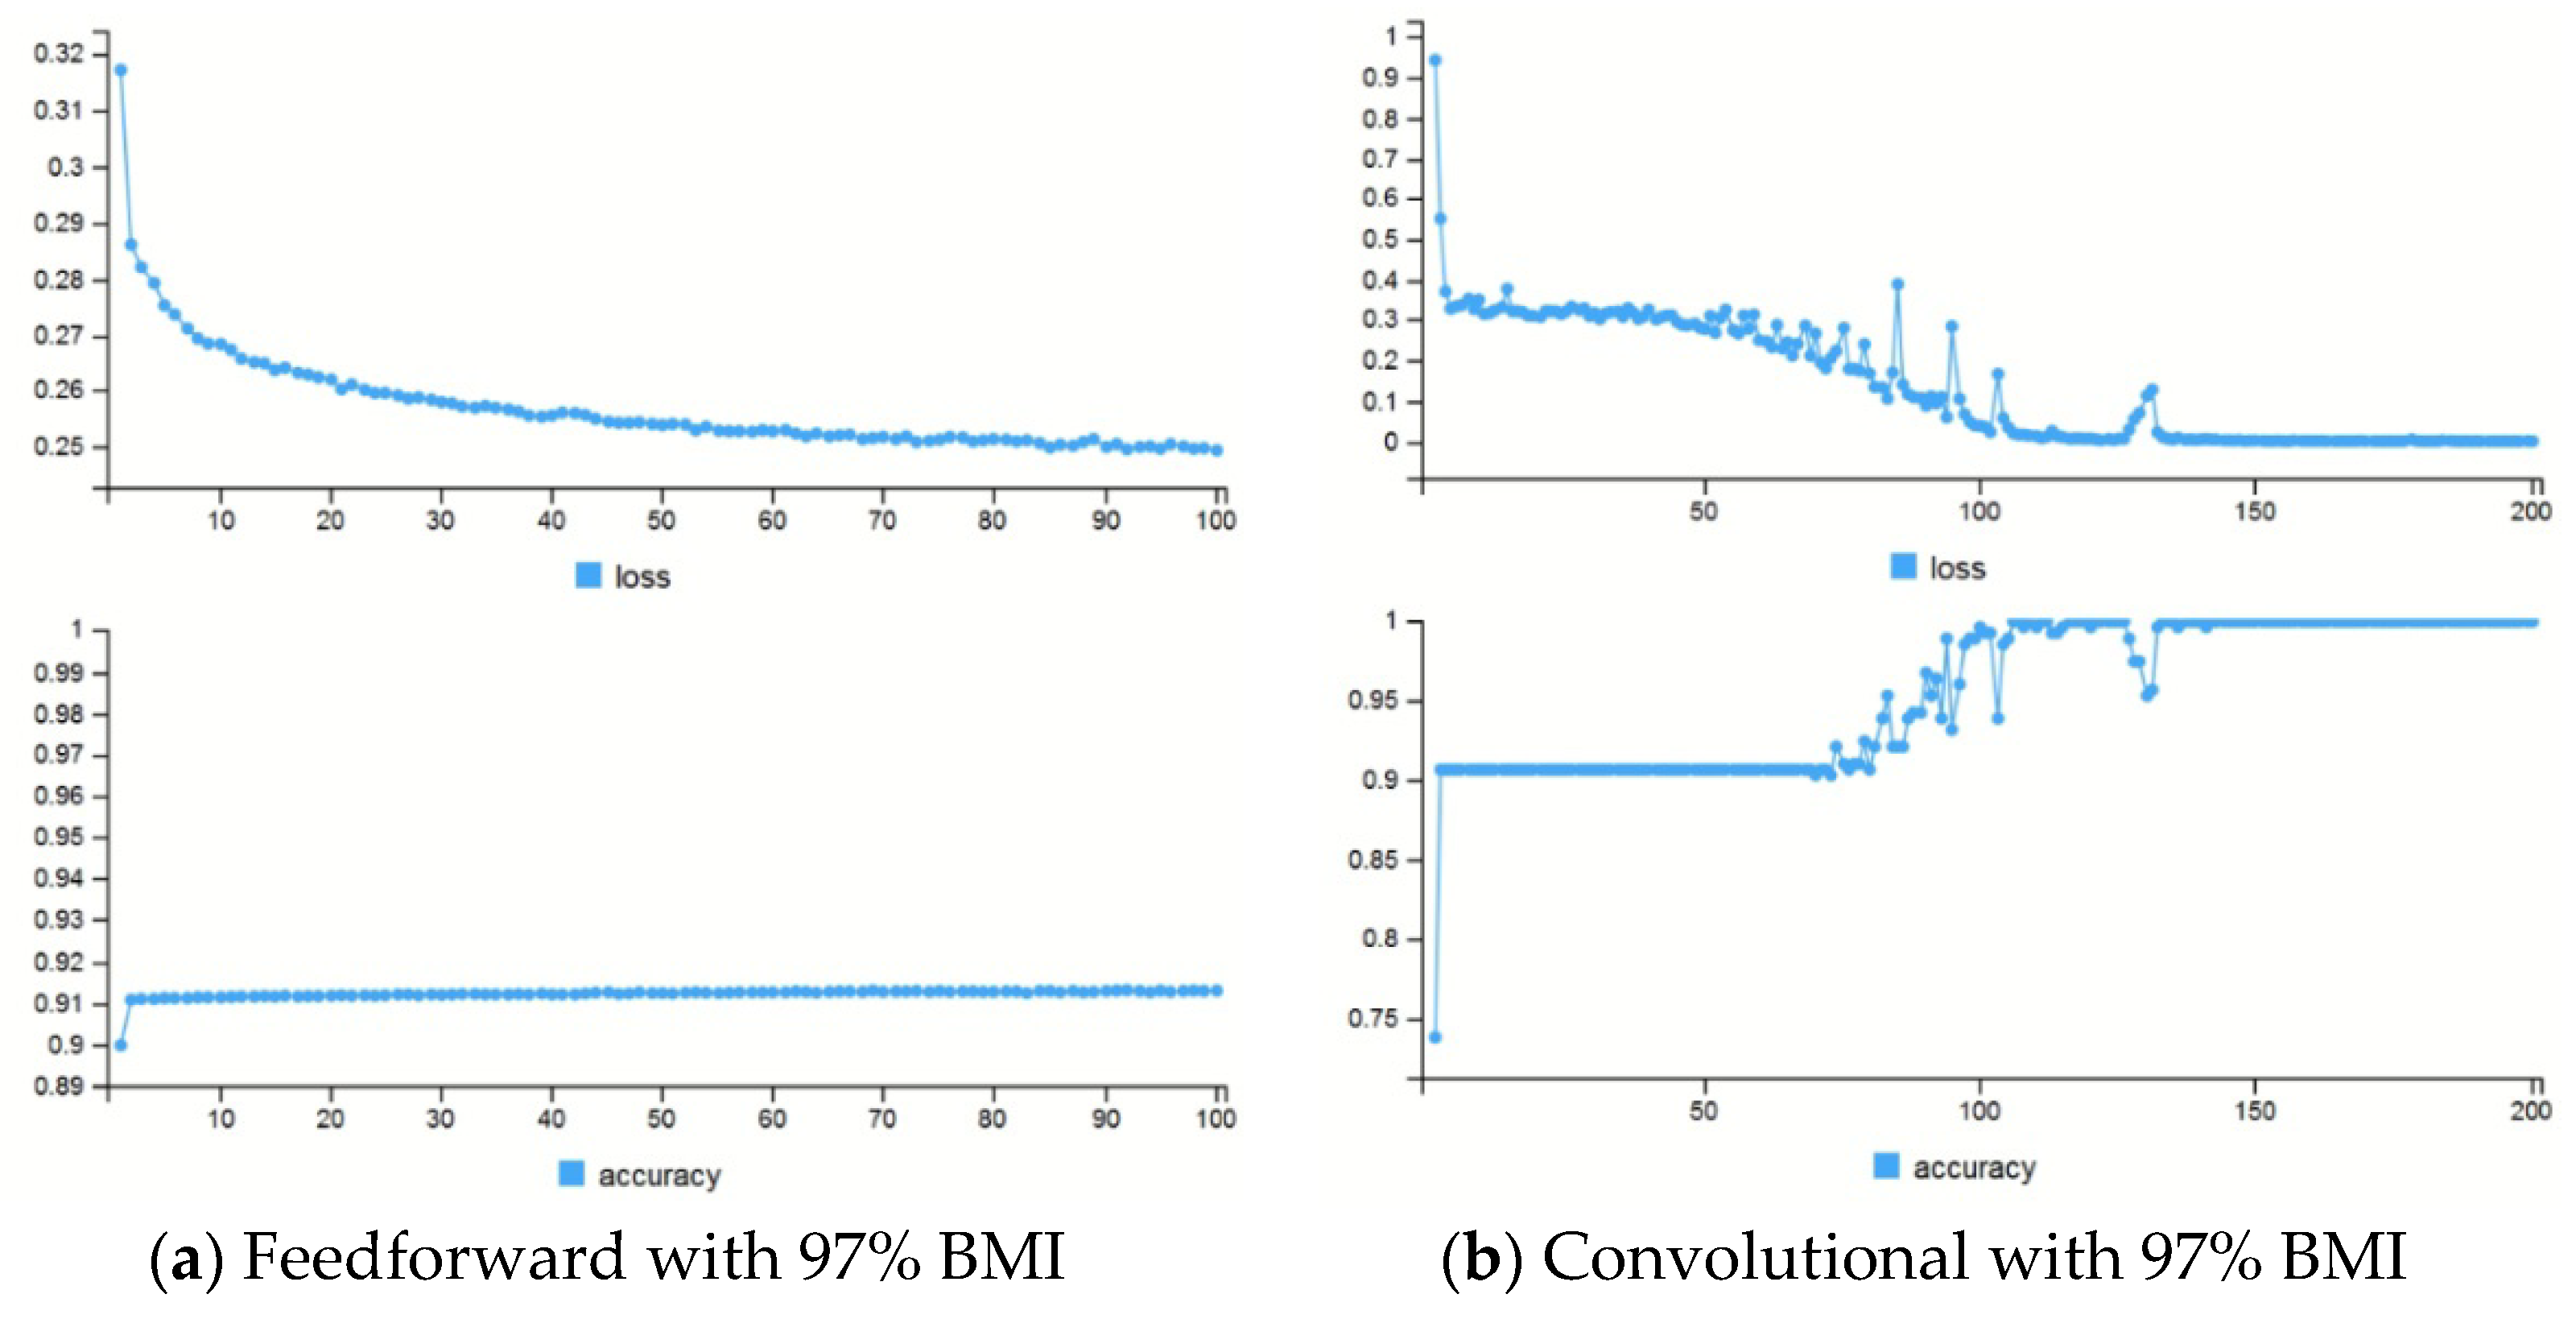
4. Experimental Result

Table 3 and Figure 4 show the losses and accuracies of the four different models: Figure 4a shows the Model 1.1. loss and accuracy; Figure 4b shows the Model 1-2. loss and accuracy; Figure 4c shows the Model 2-1. loss and accuracy; and Figure 4d shows the Model 2-2. loss and accuracy. The accuracy of the models with Dataset 1 is low for predicting the student group with obesity. This is due to the fact that the BMI 3 (overweight) data falls into the obese group. The students in BMI 3 presented similar walking movements to those in BMI 2. Therefore, the models using Dataset 1 distinguished the BMI 2 and BMI 3 groups at a lower rate. The accuracy rates of Model 1-1 presented 61.8% and 54.8% for Model 2-1. The models with Dataset 2 presented higher accuracy when compared to the models with Dataset 1. The students in BMI 4 presented more distinguishable walking movements than the students in the other BMI groups, BMI 1, 2, and 3. Model 1-2. displayed an accuracy of 90.5%, and there was a 79% accuracy for Model 2-2.
We divided the students in BMI 4 into two parts, one with BMI% < 97th percentile, and the other with BMI% ≥ 97th percentile. No student had an exact BMI % of the 97th percentile. A total of 17 students among 25 students in BMI 4 were over a BMI % of the 97th percentile. Among the 17 students with a BMI% > 97th percentile, 10 students were used to train the feedforward and convolutional neural networks, and 7 students were used for testing the neural networks. The students with a BMI % < 97th percentile, as well as those in BMI 1, 2, and 3, were merged and labeled "0". The students with a BMI % ≥ 97th percentile was labeled “1”. The feedforward and convolutional neural networks were trained with the new dataset coded in “0” and “1”. The feedforward and convolutional neural networks with the new dataset show the highest rate of accuracy among all the tested models. The accuracy of feedforward neural networks using the new dataset is 92.6%, as displayed in Figure 5a. As is shown in Figure 5b, the accuracy of convolutional neural networks using the new dataset is 87.1%.

5. Conclusions and Future Work

The major contribution of our study is to support individuals who retain healthy weights within the range by detecting obesity using the mHealth application in smartphones.
The nine vectors of rotation in the center of the human body were used for distinguishing a normal and an obese group, using a deep learning algorithm. The rotation vectors in the center of the human body of 244 students were measured in the PE room by the mHealth application that we developed. The student participants walked straight forward 78 feet, and returned back to their original place, walking approximately 157 feet.
The data of 170 students among 244 students were used for training and testing the feedforward neural network and the convolutional neural network. On the basis of the models built based on testing the student samples, the feedforward neural network successfully distinguished the nonobese from the obese group at 90.5%, and the accuracy of the convolutional neural network was 79%. Additionally, according to the testing of the models using the students with a BMI % of the 97th percentile, the students in the group with a BMI% ≥ 97th percentile show different walking movements than those students with a BMI% < 97th percentile.
Obesity in adolescents has a higher likelihood to persist, even into their adult lives [43]. To disconnect such a negative loop, we highlight the importance of offering adolescents’ real-time feedback of their current state of high BMI for self-cognition. By building a platform using an easily installed mHealth app and deep learning models, we may provide real-time feedback to the adolescents who present the walking patterns of higher BMI groups, without incurring special medical expenses. Moreover, with the help of the mHealth app, which detects walking patterns, the continuous real-time notification from the smartphones can support the customers in monitoring their BMI actively.
The present study has several limitations. The mHealth application and the data analysis were only verified with a small group. Nonetheless, as suggested by our results, the proposed mHealth can effectively capture differences in postural control during walking in healthy individuals vs. individuals with obesity. In further research, we will conduct feasibility and efficacy testing with larger pools of individuals with reduced physical mobility. In addition, any variables that may affect postural balance during walking, such as body habitus or the level of daily physical activities, will be considered in the data collection and analysis. We will also consider evaluating the impact of the application at the health system level, using outcomes such as health care utilization and medication use. For the evaluation of the health system level, we consider applying the research in polycystic ovary syndrome, which affects the lifestyles of women [44].
For future work, we plan to collect more student samples to increase the accuracy of the models and, especially, for the convolutional neural network. Moreover, the vectors of rotation are very different among go-straight-forward walking, return-straight-forward walking, and curve walking. However, we used the three different walking rotation data in the research to increase the number of the input data. The current research participants walked about 78 feet straightforward, there was a turning section, and they then walked an additional 78 feet to return to their starting point, which can be divided into three areas. In the future, by dividing the entire 157 feet into three sections, we will further increase the accuracy of the four models.

Author Contributions

Conceptualization, S.L. and E.J.; Data curation, J.J.M.; Formal analysis, H.L.; Investigation, S.L., E.H. and Y.K.; Methodology, F.D. and K.L.; Software, J.J.M.; Supervision, K.L.; Writing—original draft, S.L.; Writing—review & editing, K.L. All authors have read and agreed to the published version of the manuscript.

Funding

This research received no external funding.

Institutional Review Board Statement

The study was approved by the Institutional Review Board of Northern Illinois University IRB Committee on April 8, 2019 (Assurance # FWA-4025).

Informed Consent Statement

Not applicable.

Conflicts of Interest

The authors declare no conflict of interest.

References

  1. NIH. Why Obesity Is a Health Problem. NIH. 13 February 2013. Available online: https://www.nhlbi.nih.gov/health/educational/wecan/healthy-weight-basics/obesity.htm#:~:text=Health%20Problems%20Linked%20to%20Obesity,-Obesity%20in%20childhood&text=In%20adults%2C%20overweight%20and%20obesity,overweight%20or%20obese%20as%20adults (accessed on 6 July 2020).
  2. Lawrence, V.J.; Kopelman, P. Medical consequences of obesity. Clinics in Dermatology. Clin. Dermatol. 2004, 22, 296–302. [Google Scholar] [CrossRef] [PubMed]
  3. Allison, D.B.; Fontaine, K.R.; Manson, J.E.; Stevens, J.; VanItallie, T.B. Annual Deaths Attributable to Obesity in the United States. JAMA 1999, 282, 1530–1538. [Google Scholar] [CrossRef] [PubMed]
  4. Office of the Surgeon General (US); Office of Disease Prevention and Health Promotion (US); Centers for Disease Control and Prevention (US); National Institutes of Health (US). The Surgeon General’s Call To Action To Prevent and Decrease Overweight and Obesity. Rockville (MD): Office of the Surgeon General (US); 2001. Section 1: Overweight and Obesity as Public Health Problems in America. Available online: https://www.ncbi.nlm.nih.gov/books/NBK44210/ (accessed on 26 December 2011).
  5. Daniels, S.R.; Arnett, D.K.; Eckel, R.H.; Gidding, S.S.; Hayman, L.L.; Kumanyika, S.; Robinson, T.N.; Scott, B.J.; Jeor, S.S.; Williams, C.L. Overweight in Children and Adolescents: Pathophysiology, Consequences, Prevention, and Treatment. Circulation 2005, 111, 1999–2012. [Google Scholar] [CrossRef] [Green Version]
  6. Dehghan, M.; Akhtar-Danesh, N.; Merchant, A.T. Childhood obesity, prevalence and prevention. Nutr. J. 2005, 4, 1–8. [Google Scholar] [CrossRef] [PubMed] [Green Version]
  7. McMillan, A.G.; Auman, N.L.; Collier, D.N.; Blaise Williams, D.S. Frontal Plane Lower Extremity Biomechanics during Walking in. Pediatric Phys. Ther. 2009, 21, 187–193. [Google Scholar] [CrossRef]
  8. Dufeka, J.S.; Curriea, R.L.; Gouwsa, P.-L.; Candelab, L.; Gutierrezb, A.P.; Mercera, J.A.; Putney, G. Effects of Overweight and Obesity on Walking Characteristics in Adolescents. Hum. Mov. Sci. 2012, 31, 897–906. [Google Scholar] [CrossRef]
  9. DeVita, P.; Devita, T.H. Obesity Is Not Associated with Increased Knee Joint Torque and Power during Level Walking. J. Biomech. 2003, 36, 1355–1362. [Google Scholar] [CrossRef]
  10. Browning, R.C.; Kram, R. Effects of Obesity on the Biomechanics of Walking at Different Speeds. Med. Sci. Sports Exerc. 2007, 39, 1632–1641. [Google Scholar] [CrossRef]
  11. Wearing, S.C.; Hennig, E.M.; Byrne, N.M.; Steele, J.R.; Hills, A.P. The Impact of Childhood Obesity on Musculoskeletal Form. Obes. Rev. 2006, 7, 209–218. [Google Scholar] [CrossRef]
  12. Gaerlan, M.G. The Role of Visual, Vestibular, and Somatosensory Systems in Postural Balance. UNLV Dissertation, University of Nevada, Las Vegas, LV, USA, 2010. [Google Scholar]
  13. Paillard, T.; Noé, F. Techniques and Methods for Testing the Postural Function in Healthy and Pathological Subjects. BioMed Res. Int. 2015, 891390. [Google Scholar] [CrossRef] [Green Version]
  14. Bruttini, C.; Esposti, R.; Bolzoni, F.; Vanotti, A.; Mariotti, C.; Cavallari, P. Temporal Disruption of Upper-Limb Anticipatory Postural Adjustments in Cerebellar Ataxic Patients. Exp. Brain Res. 2014, 233, 197–203. [Google Scholar] [CrossRef] [PubMed]
  15. Tangen, G.G.; Engedal, K.; Bergland, A.; Moger, T.A.; Mengshoel, A.M. Relationships between Balance and Cognition in Patients with Subjective Cognitive Impairment, Mild Cognitive Impairment, and Alzheimer Disease. Phys. Ther. 2014, 94, 1126–1134. [Google Scholar] [CrossRef] [Green Version]
  16. Montecchi, M.G.; Muratori, A.; Lombardi, F.; Morrone, E.; Brianti, R. Recovery Scale: A New Tool to Measure Posture Control in Patients with Severe Acquired Brain Injury. A Study of the Psychometric Properties. Eur. J. Phys. Rehabil. Med. 2013, 49, 341–351. [Google Scholar] [PubMed]
  17. Dirnberger, G.; Jahanshahi, M. Executive Dysfunction in Parkinson’s Disease: A Review. J. Neuropsychol. 2013, 7, 193–224. [Google Scholar] [CrossRef] [PubMed]
  18. Chastan, N.; Do, M.C.; Bonneville, F.; Torny, F.; Bloch, F.; Westby, G.W.M.; Dormont, D.; Agid, Y.; Welter, M.-L. Gait and Balance Disorders in Parkinson’s Disease: Impaired Active Braking of the Fall of Centre of Gravity. Mov. Disord. 2009, 24, 188–195. [Google Scholar] [CrossRef] [PubMed]
  19. Tomomitsu, M.S.V.; Alonso, A.C.; Morimoto, E.; Bobbio, T.G.; Greve, J. Static and Dynamic Postural Control in Low-Vision and Normal-Vision Adults. Clinics 2013, 68, 517–521. [Google Scholar] [CrossRef]
  20. Huiying, L.; Sakari, L.; Iiro, H. A Heart Sound Segmentation Algorithm Using Wavelet Decomposition and Reconstruction. In Proceedings of the 19th Annual International Conference of the IEEE Engineering in Medicine and Biology Society, Chicago, IL, USA, 30 October–2 November 1997. [Google Scholar]
  21. Tsuruoka, R.S.Y. Spectral Analysis in Walking Balance by Elderly Subjects. In Proceedings of the 28th IEEE EMBS Annual International Conference, New York, NY, USA, 30 August–3 September 2006. [Google Scholar]
  22. Tsuruoka, M.; Tsuruoka, Y.; Shibasaki, R.; Yasuoka, Y. Spectral Analysis of Walking with Shoes and without Shoes. In Proceedings of the International Conference of the IEEE Engineering in Medicine and Biology Society, New York, NY, USA, 30 August–3 September 2006. [Google Scholar]
  23. Ali, N.S. Prediction of Coronary Heart Disease Preventive Behaviors in Women: A Test of the Health Belief Model. Women Health 2002, 35, 83–96. [Google Scholar] [CrossRef]
  24. Rosenstock, I.M.I. Historical Origins of the Health Belief Model. Health Educ. Monogr. 1974, 2, 328–333. [Google Scholar] [CrossRef]
  25. Sivalingam, S.K.; Ashraf, J.; Vallurupalli, N.; Friderici, J.; Cook, J.; Rothberg, M.B. Ethnic Differences in the Self-Recognition of Obesity and Obesity-Related Comorbidities: A Cross-Sectional Analysis. J. Gen. Intern. Med. 2011, 26, 616–620. [Google Scholar] [CrossRef] [Green Version]
  26. Sidorov, J.E.; Fitzner, K. Obesity Disease Management Opportunities and Barriers. Obesity 2006, 14, 645–649. [Google Scholar] [CrossRef] [Green Version]
  27. DrAnderson, J.W.; Konz, E.C. Obesity and Disease Management: Effects of Weight Loss on Comorbid Conditions. Obes. Res. 2001, 9, 326–334. [Google Scholar] [CrossRef] [PubMed] [Green Version]
  28. Lee, H.; Lee, S.; Salado, L.; Estrada, J.; White, J.; Muthukumar, V.; Lee, S.-P.; Mohapatra, S. Proof-of-Concept Testing of a Real-Time mHealth Measure to Estimate Postural Control during Walking: A Potential Application for Mild Traumatic Brain Injuries. Application for Mild Traumatic Brain Injuries. Asian/Pac. Isl. Nurs. J. 2018, 3, 177–189. [Google Scholar] [CrossRef] [PubMed] [Green Version]
  29. Developers, A. Motion Sensors. Available online: https://developer.android.com/guide/topics/sensors/sensors_motion (accessed on 10 December 2020).
  30. Developers, A. API Reference. Available online: https://developer.android.com/reference (accessed on 10 April 2020).
  31. BMI Percentile Calculator for Child and Teen: Results on a Growth Chart. Available online: https://www.cdc.gov/healthyweight/bmi/resultgraph.html?&method=english&gender=m&age_y=14&age_m=7&hft=5&hin=10&twp=200 (accessed on 20 July 2020).
  32. Data Table of BMI-for-age Charts. 2001. Available online: https://www.cdc.gov/growthcharts/html_charts/bmiagerev.htm (accessed on 4 August 2020).
  33. Lee, S.; Walker, R.M.; Kim, Y.; Lee, H. Measurement of Human Walking Movements by Using a Mobile Health App: Motion Sensor Data Analysis. JMIR mHealth uHealth 2021, 9, e24194. [Google Scholar] [CrossRef]
  34. Incel, O.D. Analysis of Movement, Orientation and Rotation-Based Sensing for Phone Placement Recognition. Sensors 2015, 15, 25474–25506. [Google Scholar] [CrossRef]
  35. Sabatini, A.M. Estimating Three-Dimensional Orientation of Human Body Parts by Inertial/Magnetic Sensing. Sensors 2011, 11, 1489–1525. [Google Scholar] [CrossRef] [Green Version]
  36. Davenport, P.B. Rotations about Non orthogonal Axes. Aeronaut. Astronaut. J. (AIAA) 1973, 11, 853–858. [Google Scholar] [CrossRef]
  37. RDocumentation. Random Samples and Permutations. Available online: https://www.rdocumentation.org/packages/base/versions/3.6.2/topics/sample (accessed on 21 May 2020).
  38. RStudio. Keras. Available online: https://keras.rstudio.com/ (accessed on 22 May 2020).
  39. TensorFlow. Available online: https://www.tensorflow.org/ (accessed on 4 June 2021).
  40. Glorot, X.; Bengio, Y. Understanding the Difficulty of Training Deep Feedforward Neural Networks. In Proceedings of the 13th International Conference on Artificial Intelligence and Statistics (AISTATS), Sardinia, Italy, 13–15 May 2010. [Google Scholar]
  41. Nair, V.; Hinton, G.E. Rectified Linear Units Improve Restricted Boltzmann Machines. In Proceedings of the 27th International Conference on Machine Learning, Haifa, Israel, 21 June 2010; pp. 807–814. [Google Scholar]
  42. Bishop, C.M. Pattern Recognition and Machine Learning; Springer AG: New York, NY, USA, 2012; Available online: https://link.springer.com/book/9780387310732 (accessed on 1 January 2022).
  43. Freedman, D.S.; Khan, L.K.; Serdula, M.K.; Dietz, W.H.; Srinivasan, S.R.; Berenson, G.S. The Relation of Childhood BMI to Adult Adiposity: The Bogalusa Heart Study. Pediatrics 2005, 115, 22–27. [Google Scholar] [CrossRef] [PubMed] [Green Version]
  44. Muscogiuri, G.; Palomba, S.; Laganà, A.S.; Orio, F. Current Insights into Inositol Isoforms, Mediterranean and Ketogenic Diets for Polycystic Ovary Syndrome: From Bench to Bedside. Curr. Pharm. Des. 2016, 22, 5554–5557. [Google Scholar] [CrossRef]
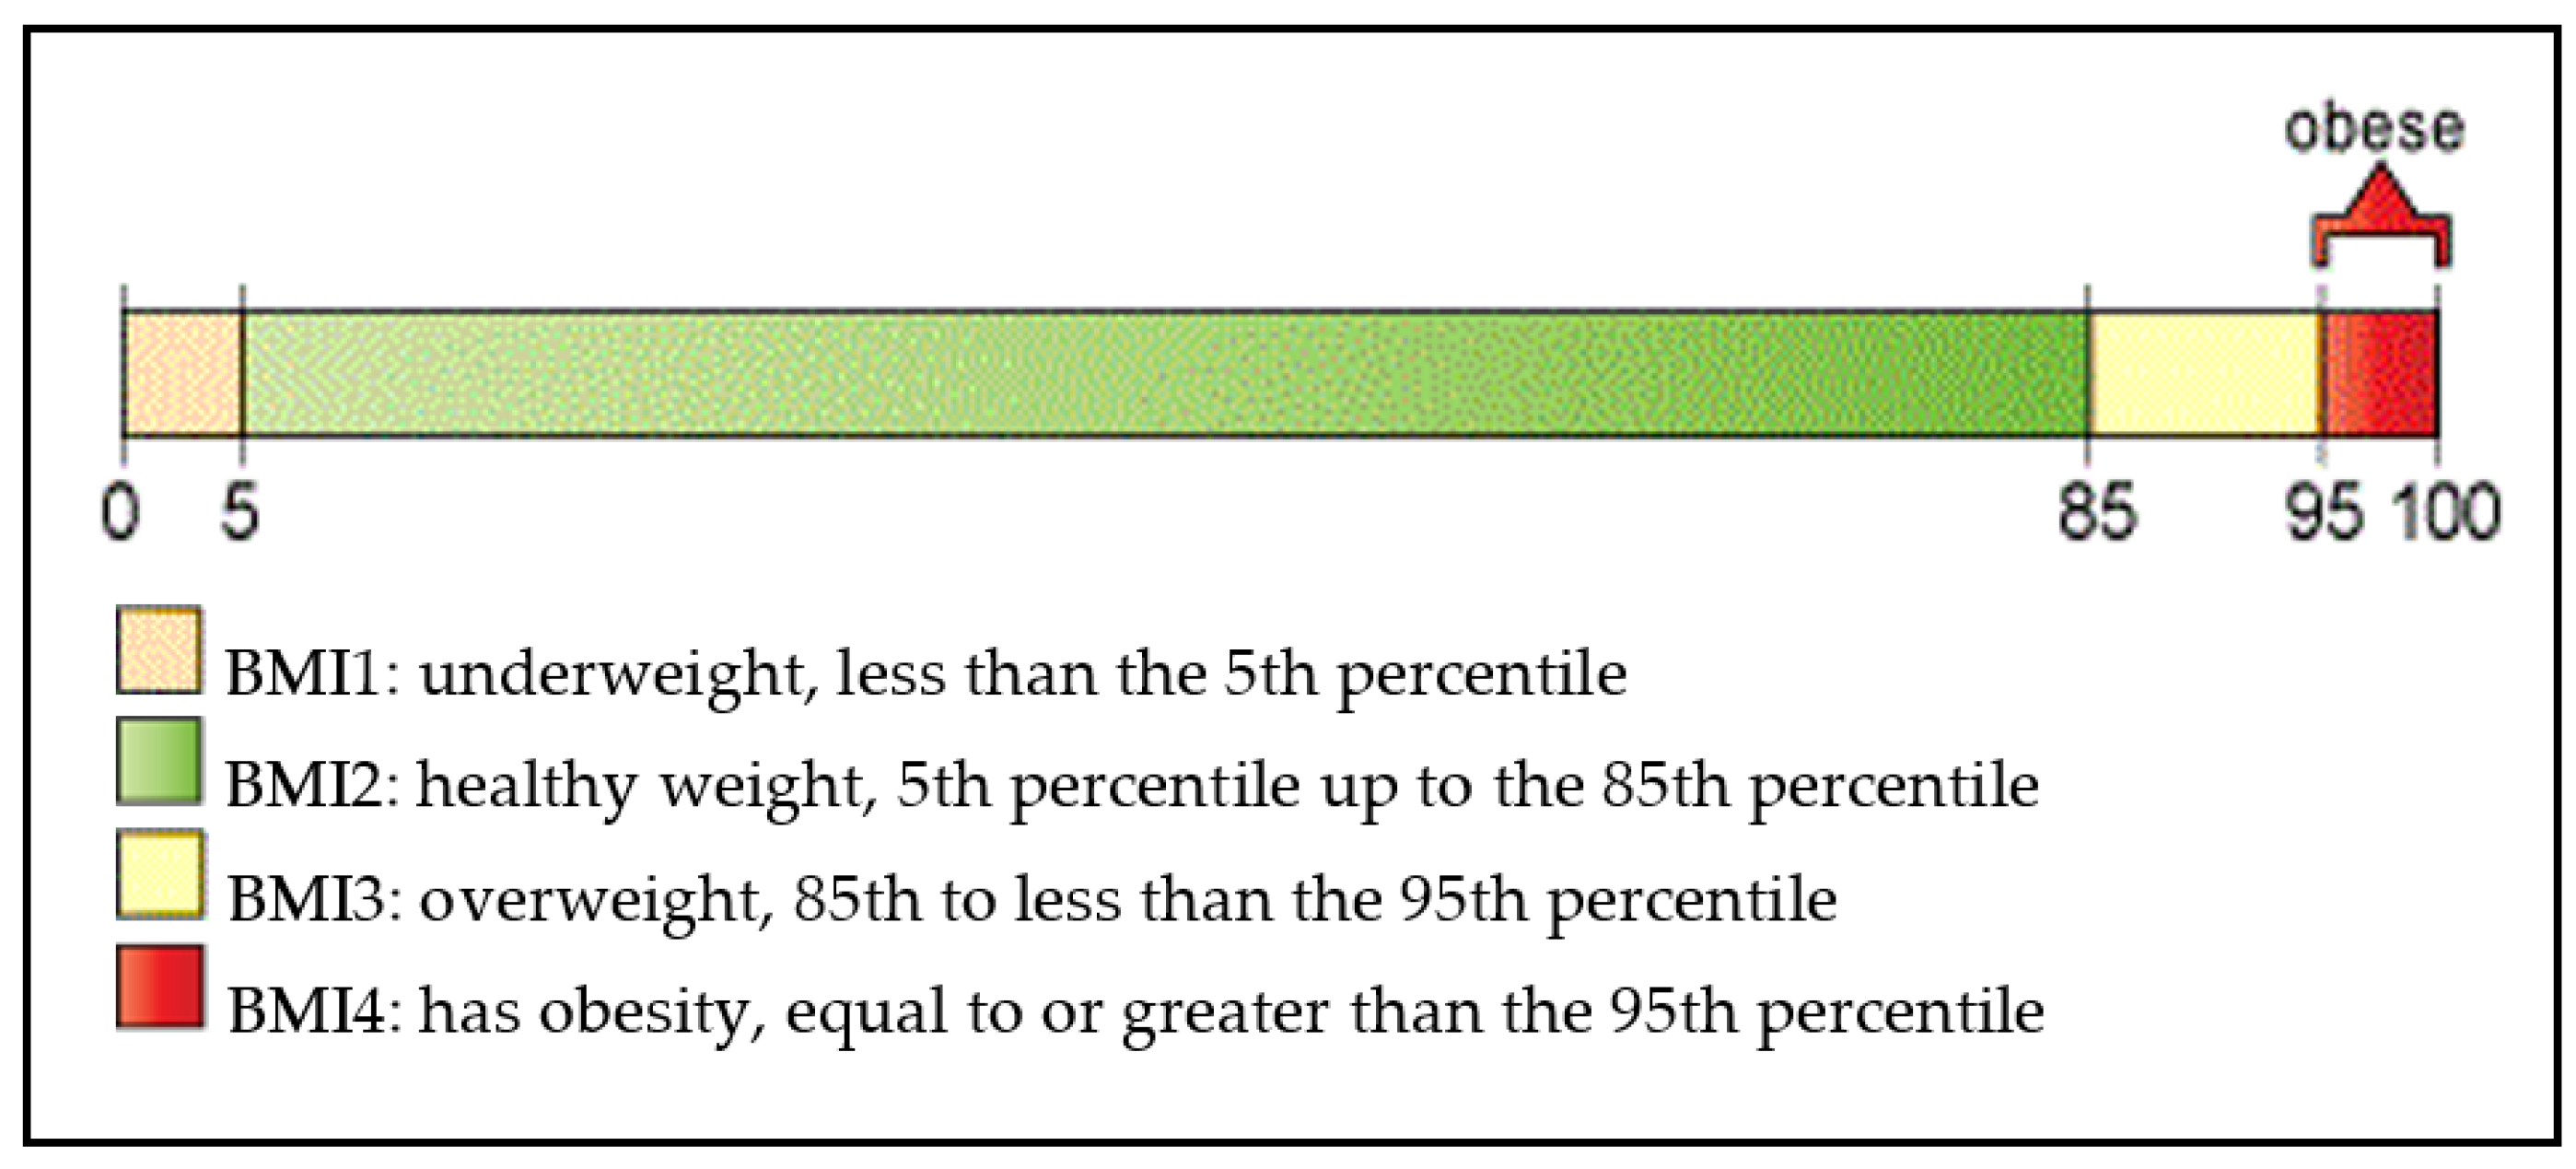
Figure 1. CDC BMI Percentile Calculator for Child and Teen [31].
Applsci 12 00850 g001
Figure 2. X-Y, and Z-axis orientations of the smartphone during the walking balance test. X-axis is the right (−) and the left (+) side of the participant. Y-axis is the upward (−) and the downward (+) of the participant. Z-axis is the forward (+) and the backward (−) of the participant. The participants wearing the smartphone with the mHealth application walk about a total of 157 feet. (a) A participant wearing a smartphone; (b) Indoor physical education (PE) room.
Applsci 12 00850 g002
Figure 3. Training the feedforward and the convolutional neural network models.
Applsci 12 00850 g003
Figure 4. Losses and Accuracies of the Four Models.
Applsci 12 00850 g004
Figure 5. Losses and Accuracies with 97% BMI dataset.
Applsci 12 00850 g005
Table 1. BMI percentages for 174.5 months old.
Gender3%5%10%25%50%75%85%90%95%97%
Female15.6916.0616.6817.9119.6522.0223.7125.1027.7028.27
Male15.9316.2716.8417.9519.5121.6023.0624.2526.4529.9
Table 2. Demographic information of the student participants.
CharacteristicOverall
(n = 170)
BMI 1
(<=5%)
BMI 2
(>5% & <=85%)
BMI 3
(>85% & <95%)
BMI 4
(>=95%)
Gender
Female86 (50.59%)2 (2.33%)55 (63.95%)21 (24.42%)8 (9.30%)
Male84 (49.41%)2 (2.38%)51 (60.71%)14 (16.67%)17 (20.24%)
Race
Hispanic18 (10.59%)0 13 (72.22%)4 (22.22%)1 (5.56%)
White133 (78.24%)4 (3.01%)83 (62.41%)26 (19.55%)20 (15.04%)
Black3 (1.76%)0 (0.00%)0 (0.00%)3 (100.00%)0 (0.00%)
Asian4 (2.35%)0 (0.00%)2 (50.00%)1 (25.00%)1 (25.00%)
Other12 (7.06%)0 (0.00%)5 (41.67%)4 (33.33%)3 (25.00%)
Total1704 (2.35%)106 (62.35%)35 (20.59%)25 (14.71%)
Table 3. Loss values and accuracies of models.
DatasetLoss (Feedforward)Accuracy (Feedforward)Loss (Convolutional)Accuracy (Convolutional)
Dataset 14.998 (Model 1-1)61.8% (Model 1-1)3.551 (Model 2-1)54.8% (Model 2-1)
Dataset 20.979 (Model 1-2)90.5% (Model 1-2)2.12 (Model 2-2)79% (Model 2-2)
Publisher’s Note: MDPI stays neutral with regard to jurisdictional claims in published maps and institutional affiliations.

