


Featured Application
This study provides a non-destructive evaluation to measure orthotropic material constants for additive manufacturing structures. The resonant frequencies obtained from experimental measurements were used to inversely calculate the engineering constants, Ex, Ey, Ez, Gyz, Gxz, and Gxy, from the eigenvalues of bending and torsion modes. The stiffness of the 3D-printed structure was determined by the dynamic testing method’s influence on layer height and raster angle. In the study, the stiffness can be designed in the 3D-printed structure as being manufactured.
Abstract
In this study, the orthogonal mechanical properties of additive manufacturing technology were explored. Firstly, six test pieces of different stacking methods were printed with a 3D printer, based on fused deposition modeling. The resonance frequency was measured by a laser Doppler vibrometer as the test piece was struck by a steel ball, which was used to calculate the orthotropic material constants. The accuracy of these orthotropic material constants was then verified using finite element software through a comparison of the experimental results from multiple natural modes. Thus, a set of methods for the measurement and simulation verification of orthotropic material constants were established. Only three specific test specimens are needed to determine the orthotropic material constants using the vibrating sensor technique, instead of a universal testing machine. We also analyzed the influence of different printing parameters, including raster angle and layer height, on the material constants of the test pieces. The results indicate that a raster angle of 0° leads to the highest Young’s modulus, a raster angle of 45° leads to the highest shear modulus G, and a layer height of 0.15 mm leads to the highest material strength. In various stack conditions, the mechanical properties of fuse deposition additive manufacturing can be measured by inversely calculating frequency domain transformation.
1. Introduction
Three-dimensional printing is also known as additive manufacturing, because objects are manufactured by stacking materials layer by layer. In addition to manufacturing hollow parts with complicated shapes, it also greatly reduces the manufacturing time, and simplifies the manufacturing process when compared to conventional manufacturing methods. Moreover, it allows for fast customization and production in small quantities, which is much in line with the development trend of Industry 4.0. In the past decade, various processes and manufacturing methods were invented as 3D printing technology continued to develop [1,2,3,4,5,6,7,8]. At present, the most widely used manufacturing processes include fused deposition modeling (FDM), stereolithography, and selective laser sintering [9,10,11,12,13]; their manufacturing cost was greatly reduced, making it possible to apply them in various fields, including aerospace, construction, mold making, dentistry, and healthcare. Simultaneously, various orthotropic materials were also studied and applied in additive manufacturing, including metals, plastics, ceramics, and concrete [14,15,16,17,18,19,20].
In FDM, the print head of the 3D printer is heated first, such that the wire material passing through the print head turns into a molten state and is stacked on the platform or the previously printed layer; the molten materials then fuse with each other during the printing process. Therefore, the layer thickness, width, and direction of the wire material are the main printing parameters affecting the properties of the part [21], and the deformation between layers is considered the cause of inferior mechanical properties [22]. Three-dimensional printed parts have the advantages of low cost and easy customization, but also the disadvantages of weak mechanical strength and uneven surfaces [23]. In particular, the fiber direction and void size are the main challenges for 3D-printed composites [24,25]. In 2002, Li and Sun [26] explored the influence of printing parameters on FDM. A total of four test pieces were printed with different fiber densities. The material constants were obtained through a tensile test and then compared. Subsequently, the test pieces were printed with different fiber directions, and the tensile test was also carried out. The results show that the test piece at [45°/−45°] led to the smallest Young’s modulus. Also in 2002, Ahn [27] used acrylonitrile butadiene styrene as the material for FDM, exploring the printing parameters including raster angle, line width, and air gap, and measuring the tensile and compressive strengths of the samples. In 2013, Martínez [28] performed tensile tests on test pieces with different printing directions to obtain the nine material constants, and simulated the force balance of the 3D-printed test pieces when stretched in all directions using a composite laminate in ABAQUS. In 2015, Domingo-Espin [29] determined the nine material constants, tensile stress at yield, and ultimate strength of orthotropic material by performing tensile tests on test pieces. A simple part was designed and made using polycarbonate, which was subjected to different bending moments and torques. The results indicate that the part should be printed in the same direction as the tensile stress for higher strength. In 2021, Yao [30] defined three material directions to describe the orthogonality of 3D-printed materials, based on the results of electron microscope observations. A total of 27 test pieces were printed for static tests, which reveal that the Young’s modulus notably varies in different material directions. A finite element model with different printing directions and different thickness layers was developed to simulate its natural resonance frequency. The error with respect to the test results is very small in the follow-up studies.
Three-dimensional printing technology is bound to greatly affect human life in the future. Therefore, the strength of objects manufactured by 3D printing is a critical issue. The influences on the printed parameters were discussed in connection with the strength and microstructure [31,32,33]. A thermal effect was modeled in the void density and filament orientation [31]. The microstructure [32] and the maximum tensile stress [33] were determined by scanning electron microscopy (SEM) and a universal testing machine. Overviewing the above reviewed literature, there are various key factors affecting mechanical properties of 3D-printed FDM structures, including density (relative to nozzle radius), filament orientation (relative to raster angle), heating treatment, extrusion in feeding rate, layer height, etc. In the past, most of the methods employed to test the strength of materials were based on destructive tests, such as tensile tests. In contrast, a non-destructive test method was used in the present study. Test pieces of different directions were printed. The traditional non-destructive test in ultrasonics cannot determine the material constants because of the 3D printed structural dispersity. Their vibration characteristics were employed to inversely calculate orthogonal material constants, which were input into a simulation to verify the results. As such, a set of orthogonal material constant measurements and a simulation verification method were developed, and then the influence of printing parameters on material constants was analyzed.
2. Inverse Calculation of Material Constant
In this section, the material constants are inversely calculated with the steel ball drop test, according to the bending and torsion modes of Bernoulli–Euler beams [34].
In the bending mode, when a cantilever beam is bent by shear force at the free end, its governing equation is
where y is the deflection, E is the Young’s modulus, I is the moment of inertia, ρ is the density, and A is the cross-sectional area.
Separation of variables gives
Substituting Equation (2) into Equation (1) leads to
which can be rewritten as
where
To solve Equation (4), the following cantilever beam boundary conditions
are substituted to obtain the characteristic equation:
In the torsion mode, when a cantilever beam is subjected to torsion at the free end, its governing equation is
where θ is the torsion angle, J is the polar moment of inertia, CT is the torque stiffness, b and h are the width and height of the cross section, respectively, and G is the shear elastic coefficient.
Let the diameter be
Substituting Equation (9) into Equation (8) we obtain
To solve Equation (10), the following torsional boundary conditions
are substituted to obtain the natural frequency of the torsion mode:
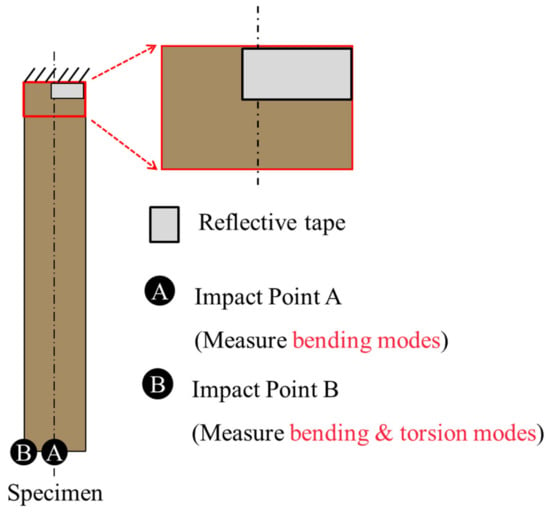
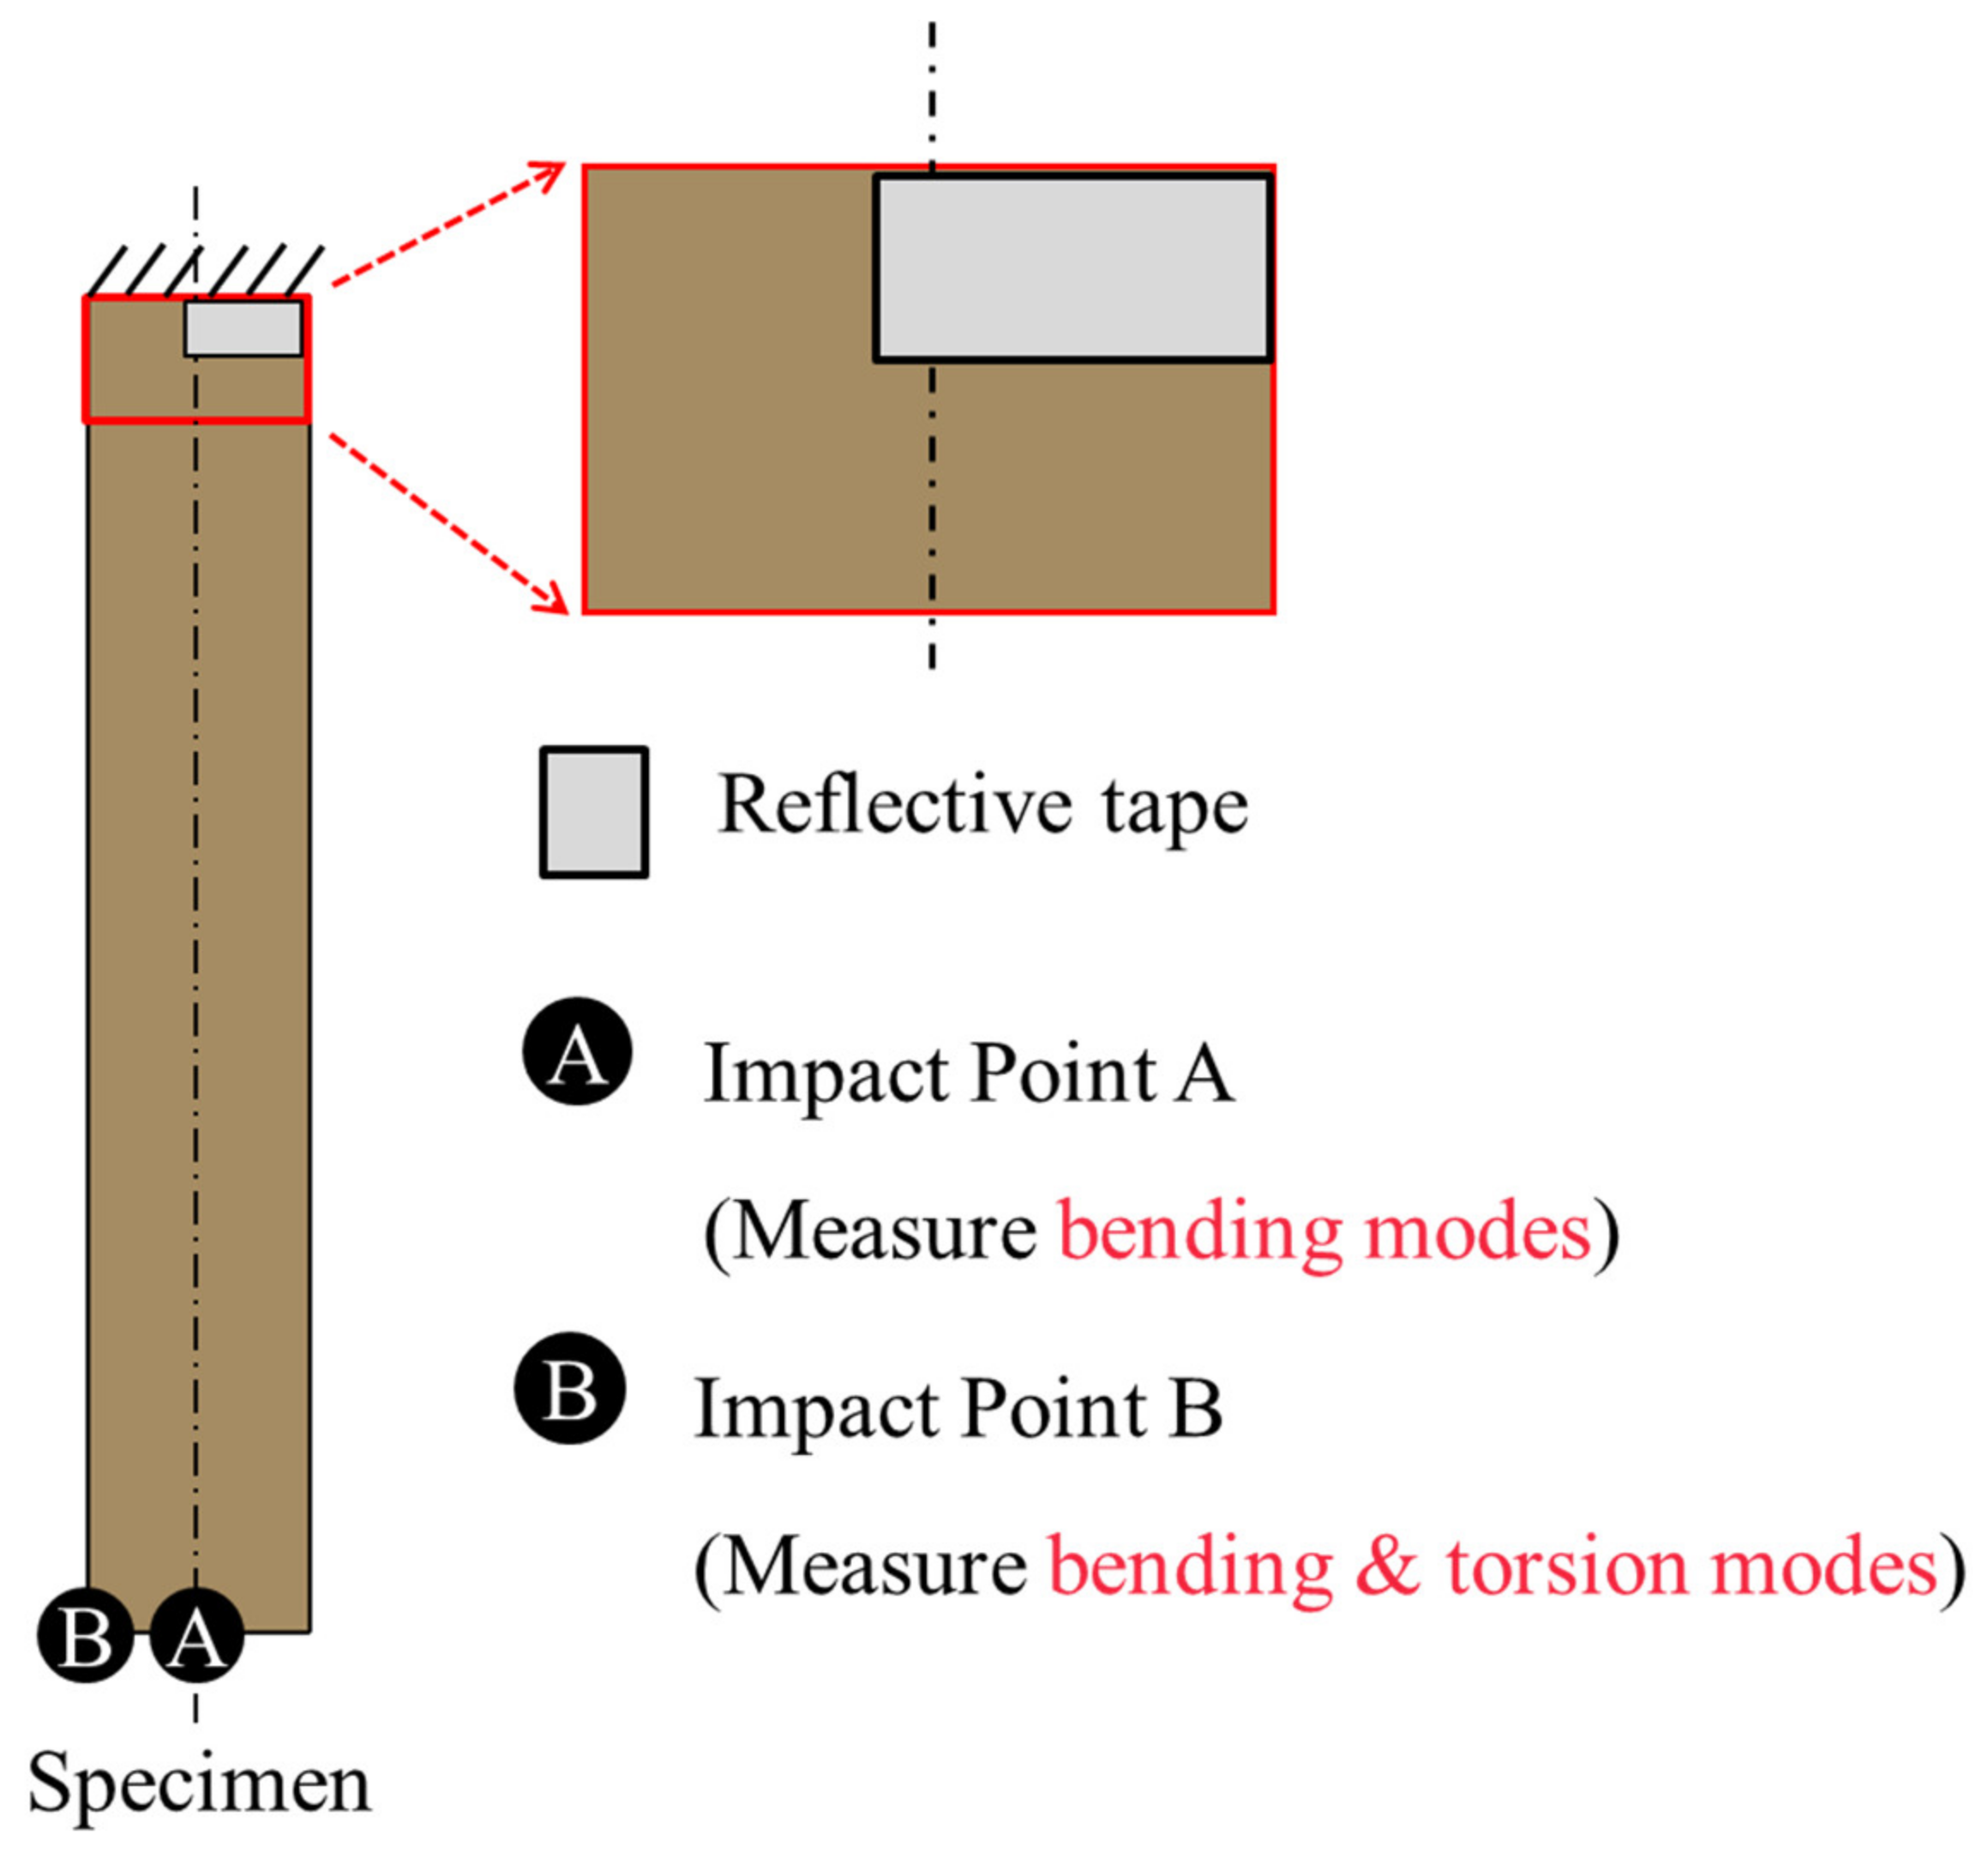
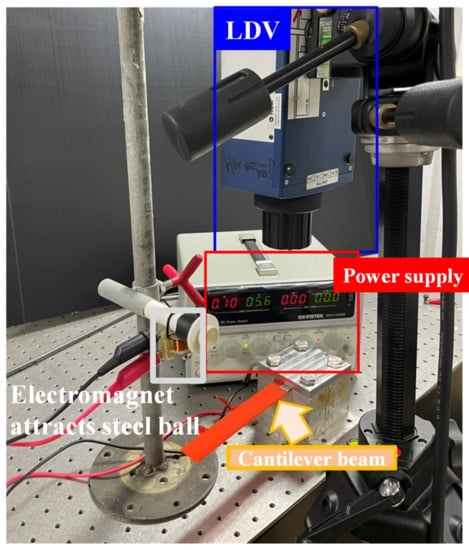
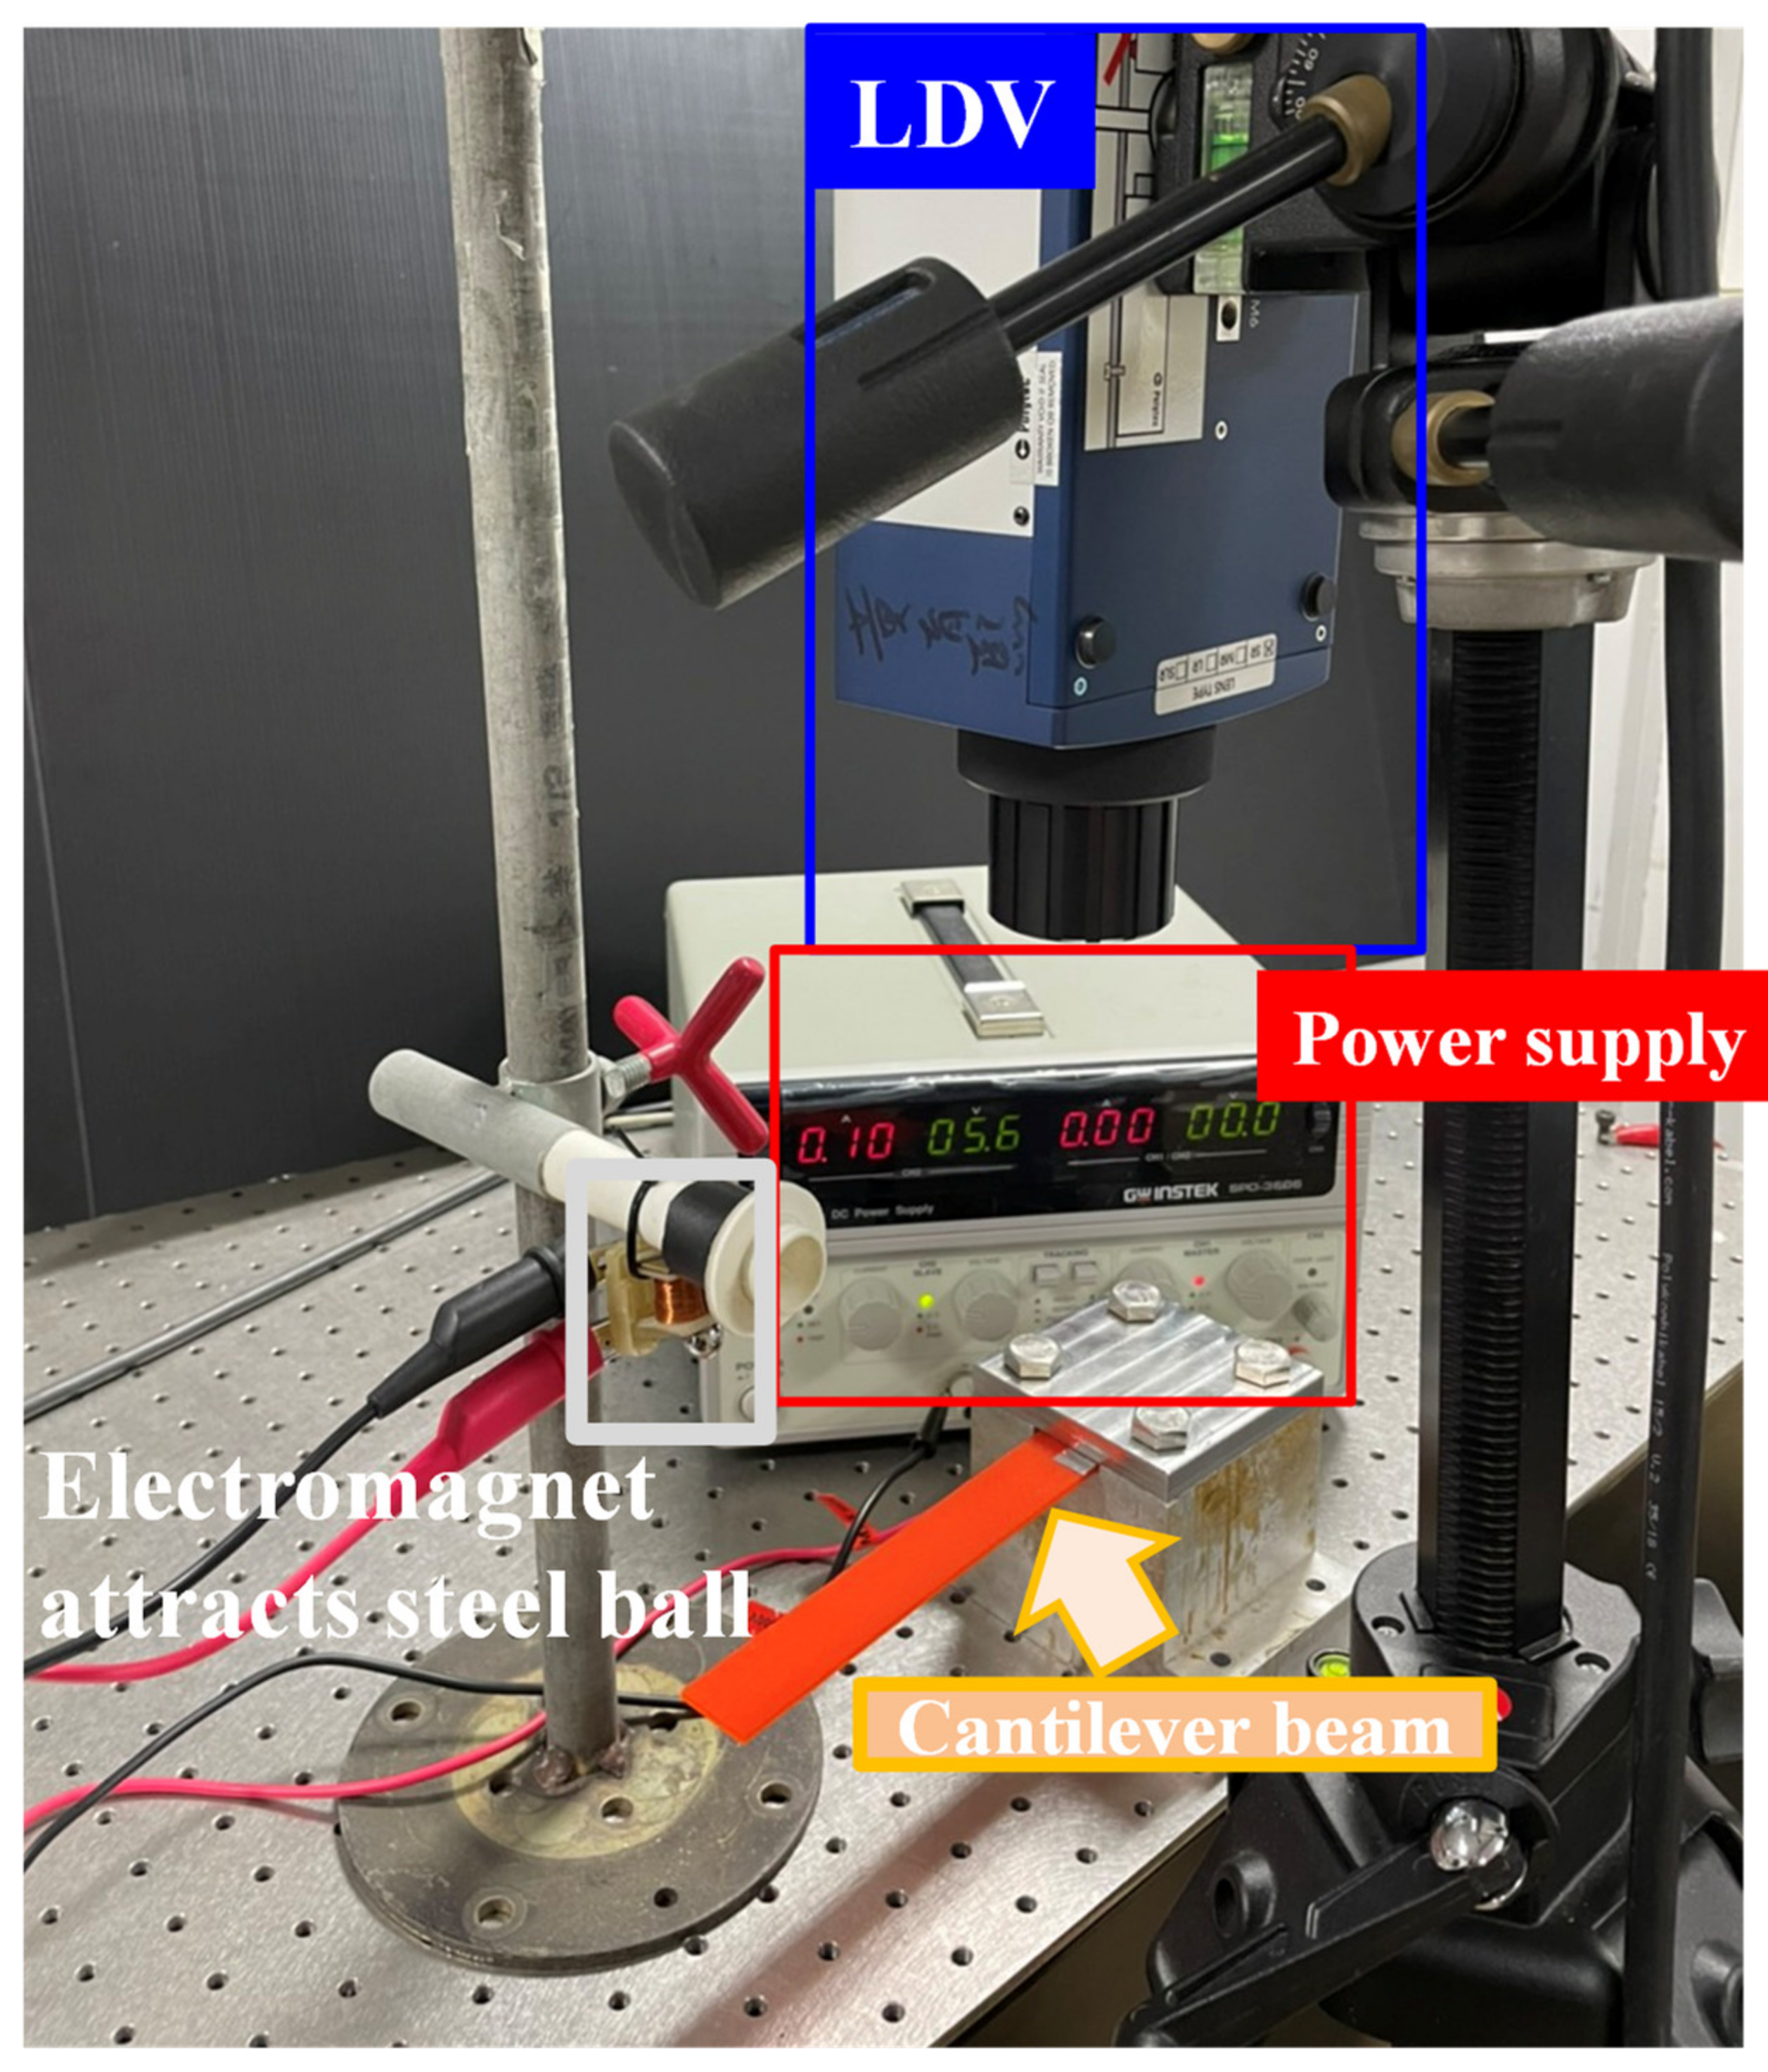
In the conducted steel ball drop test, one end of the test piece was clamped and fixed with a jig, the other end was suspended in the form of a cantilever beam, and then the steel ball hit points A and B of the cantilever beam, as shown in Figure 1. A photo of the test setup is shown in Figure 2. The vibration generated by the cantilever beam was measured by a laser Doppler vibrometer (LDV) to obtain time domain velocity–time plots. The obtained data were processed with the fast Fourier transform (FFT) to obtain the frequency domain plots, from which the natural resonance frequency of the test piece could be found. The resonance frequencies corresponding to the first-order bending and torsion modes were then substituted into Equations (5) and (12), respectively, to finally obtain the Young’s modulus E and shear modulus G of the test piece. Using the following relationship between the Young’s modulus and shear modulus,
the Poisson’s ratio ν can be obtained. Although Equation (13) is only applicable to isotropic materials, and we only considered orthotropic materials in this study, the material constants were measured only from the length dimension; therefore, Equation (13) can still be used to calculate the value of ν, which is only the input to the simulation based on finite element method; it was not used in theoretical calculations.
Figure 1.
Schematic of impact points on cantilever beam.
Figure 2.
Setup of steel ball drop test.
3. Orthogonal Material Properties of 3D Printing
In this study, parts were manufactured through extrusion molding, using 3D printing technology based on FDM. Composite material mechanics suggest that the stacking characteristics of FDM are similar to those of stacking fibers, and finished products of stacked fiber materials have anisotropic properties. Therefore, in this study we assumed that orthotropic materials also exhibit anisotropic properties with the following stress–strain relationship:
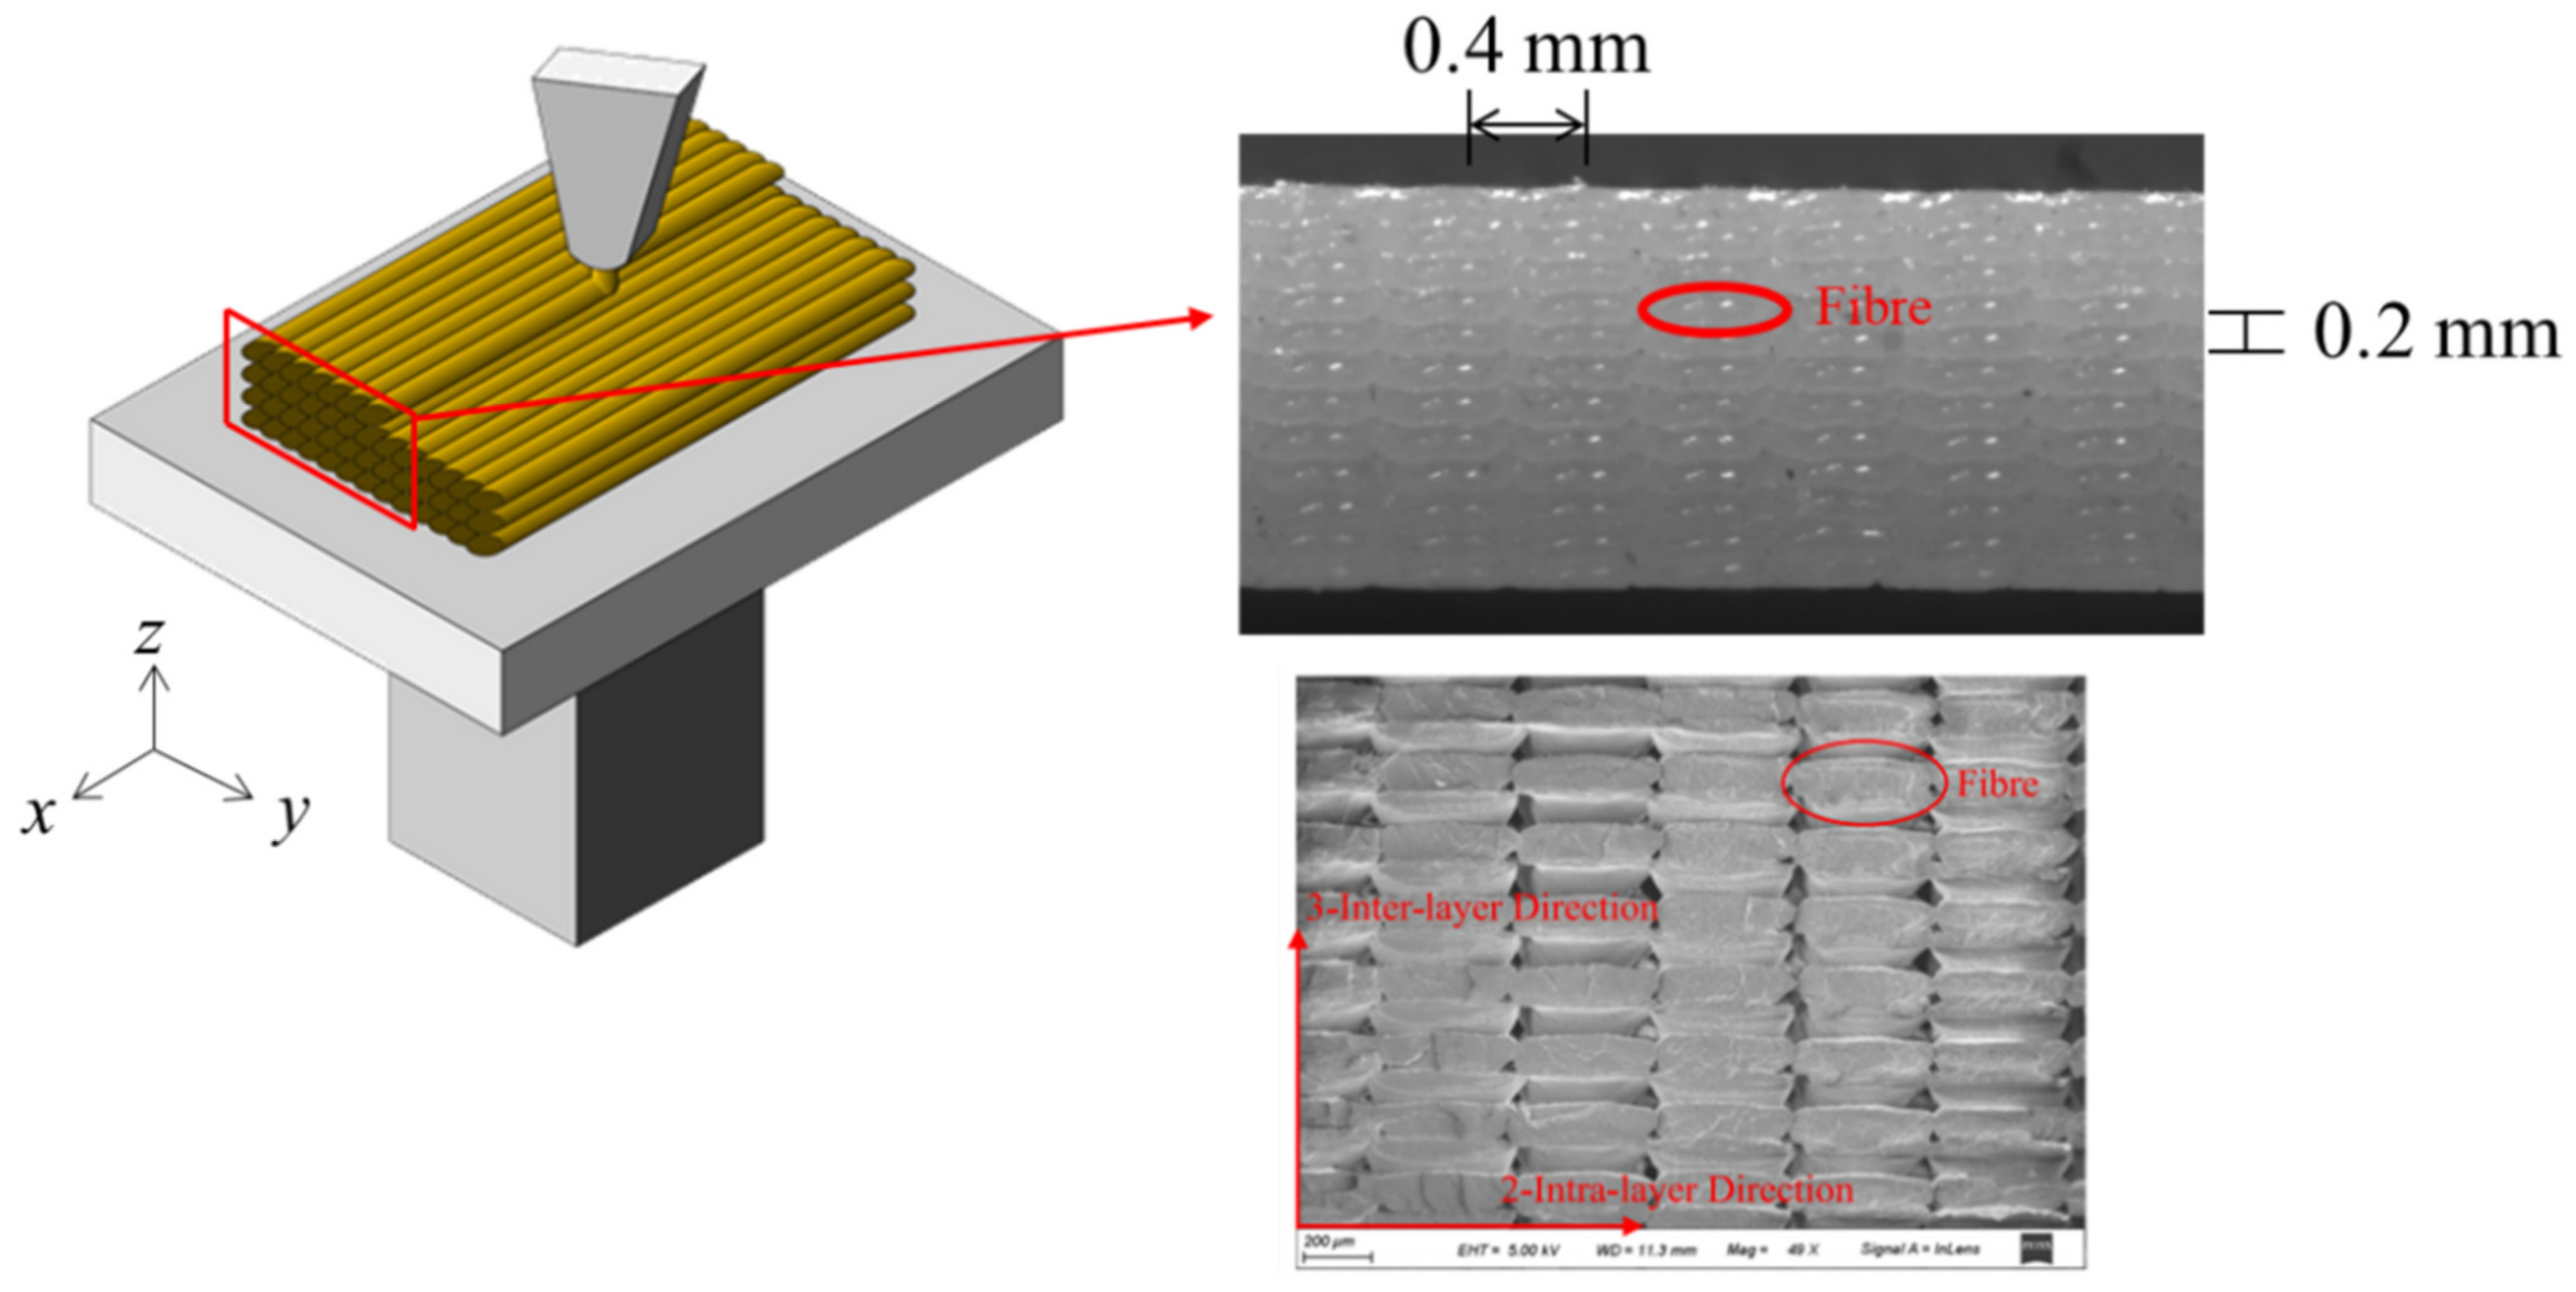
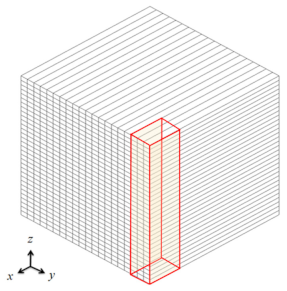
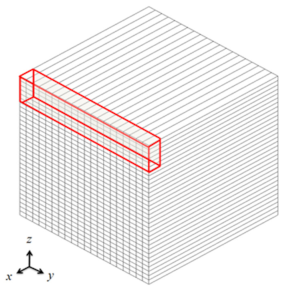
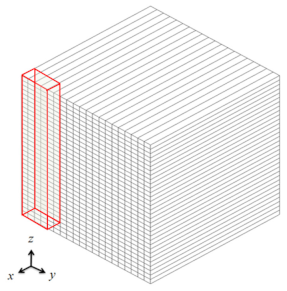
This section mainly explores the influence of stacking direction on the material properties in FDM. A high polymer, namely, polylactic acid (PLA), was used to manufacture the test pieces. In addition, G-code files were generated by the slicing software Cura, through which the placement position and raster angle of the 3D printer were adjusted to achieve different stacking directions. In terms of settings for the test pieces, the PLA material was printed with a spacing of 0.4 mm in the y-direction, and a spacing of 0.2 mm in the z-direction; the printing schematic and actual product are shown in Figure 3 [30]. Note that the finished product is symmetrical. Therefore, it is assumed to be orthotropic, and the nine material constants must be found.
Figure 3.
Printing direction and parameters.
With different placement positions and printing directions, a total of six test pieces with different stacking methods were printed, as shown in Table 1. Hereinafter, the test pieces are named according to the plane formed by the length and width of the test piece, followed by the direction in which the length of the test piece lies. Taking the first image in Table 1 as an example, its length and width forms the xy plane, and its length is in the x-direction; consequently, this test piece is named as xy plane–x direction. All the other test pieces are named in the same manner. It is noted that the specimens were directly printed strips to measure by drop test, not sliced from the large cube. The 3D-printed folding area influences the stiffness. In the study, the specific elastic modulus concerned the whole structure, ignoring the microstructure effect.
Table 1.
Schematic of test pieces in different directions.
Based on the inversely calculated material constants, it is known that each test piece corresponds to an E and a G, i.e., the six test pieces correspond to six Es and six Gs. However, given that orthotropic materials have only Ex, Ey, Ez, Gxy, Gxz, and Gyz, it is inferred that the Es and Gs obtained from the test are in pairs. Moreover, the subscript of E is the same as the second part of the name of the test piece, while the subscript of G is the same as the first part of the name of the test piece. For example, the material constants Ex and Gxy of the xy plane–x direction test piece were obtained from the steel ball drop test. In the follow-up, the material constants of the six test pieces were inversely calculated, and the accuracy of this inference was verified.
The xy plane–x direction test piece was printed first. The print head was set to a temperature of 190 °C, and the platform was set to a temperature of 55 °C. The test piece was 166 × 24 × 2.4 mm3 in size with a weight of 10.85 g. The boundary condition during the test was such that the cantilever beam was fixed on one end. The total length of the cantilever beam was reduced to 149.45 mm after deducting the part clamped at the fixed end. A reflective patch was attached to the fixed end in order to enhance the LDV signal. The steel ball used for the drop test was 10 mm in size, and points A and B on the test piece were under impact. The purpose of hitting point A was to stimulate the bending mode of the cantilever beam, while the purpose of hitting point B was to simultaneously stimulate both the bending and torsion modes, so that the results of both could be compared.
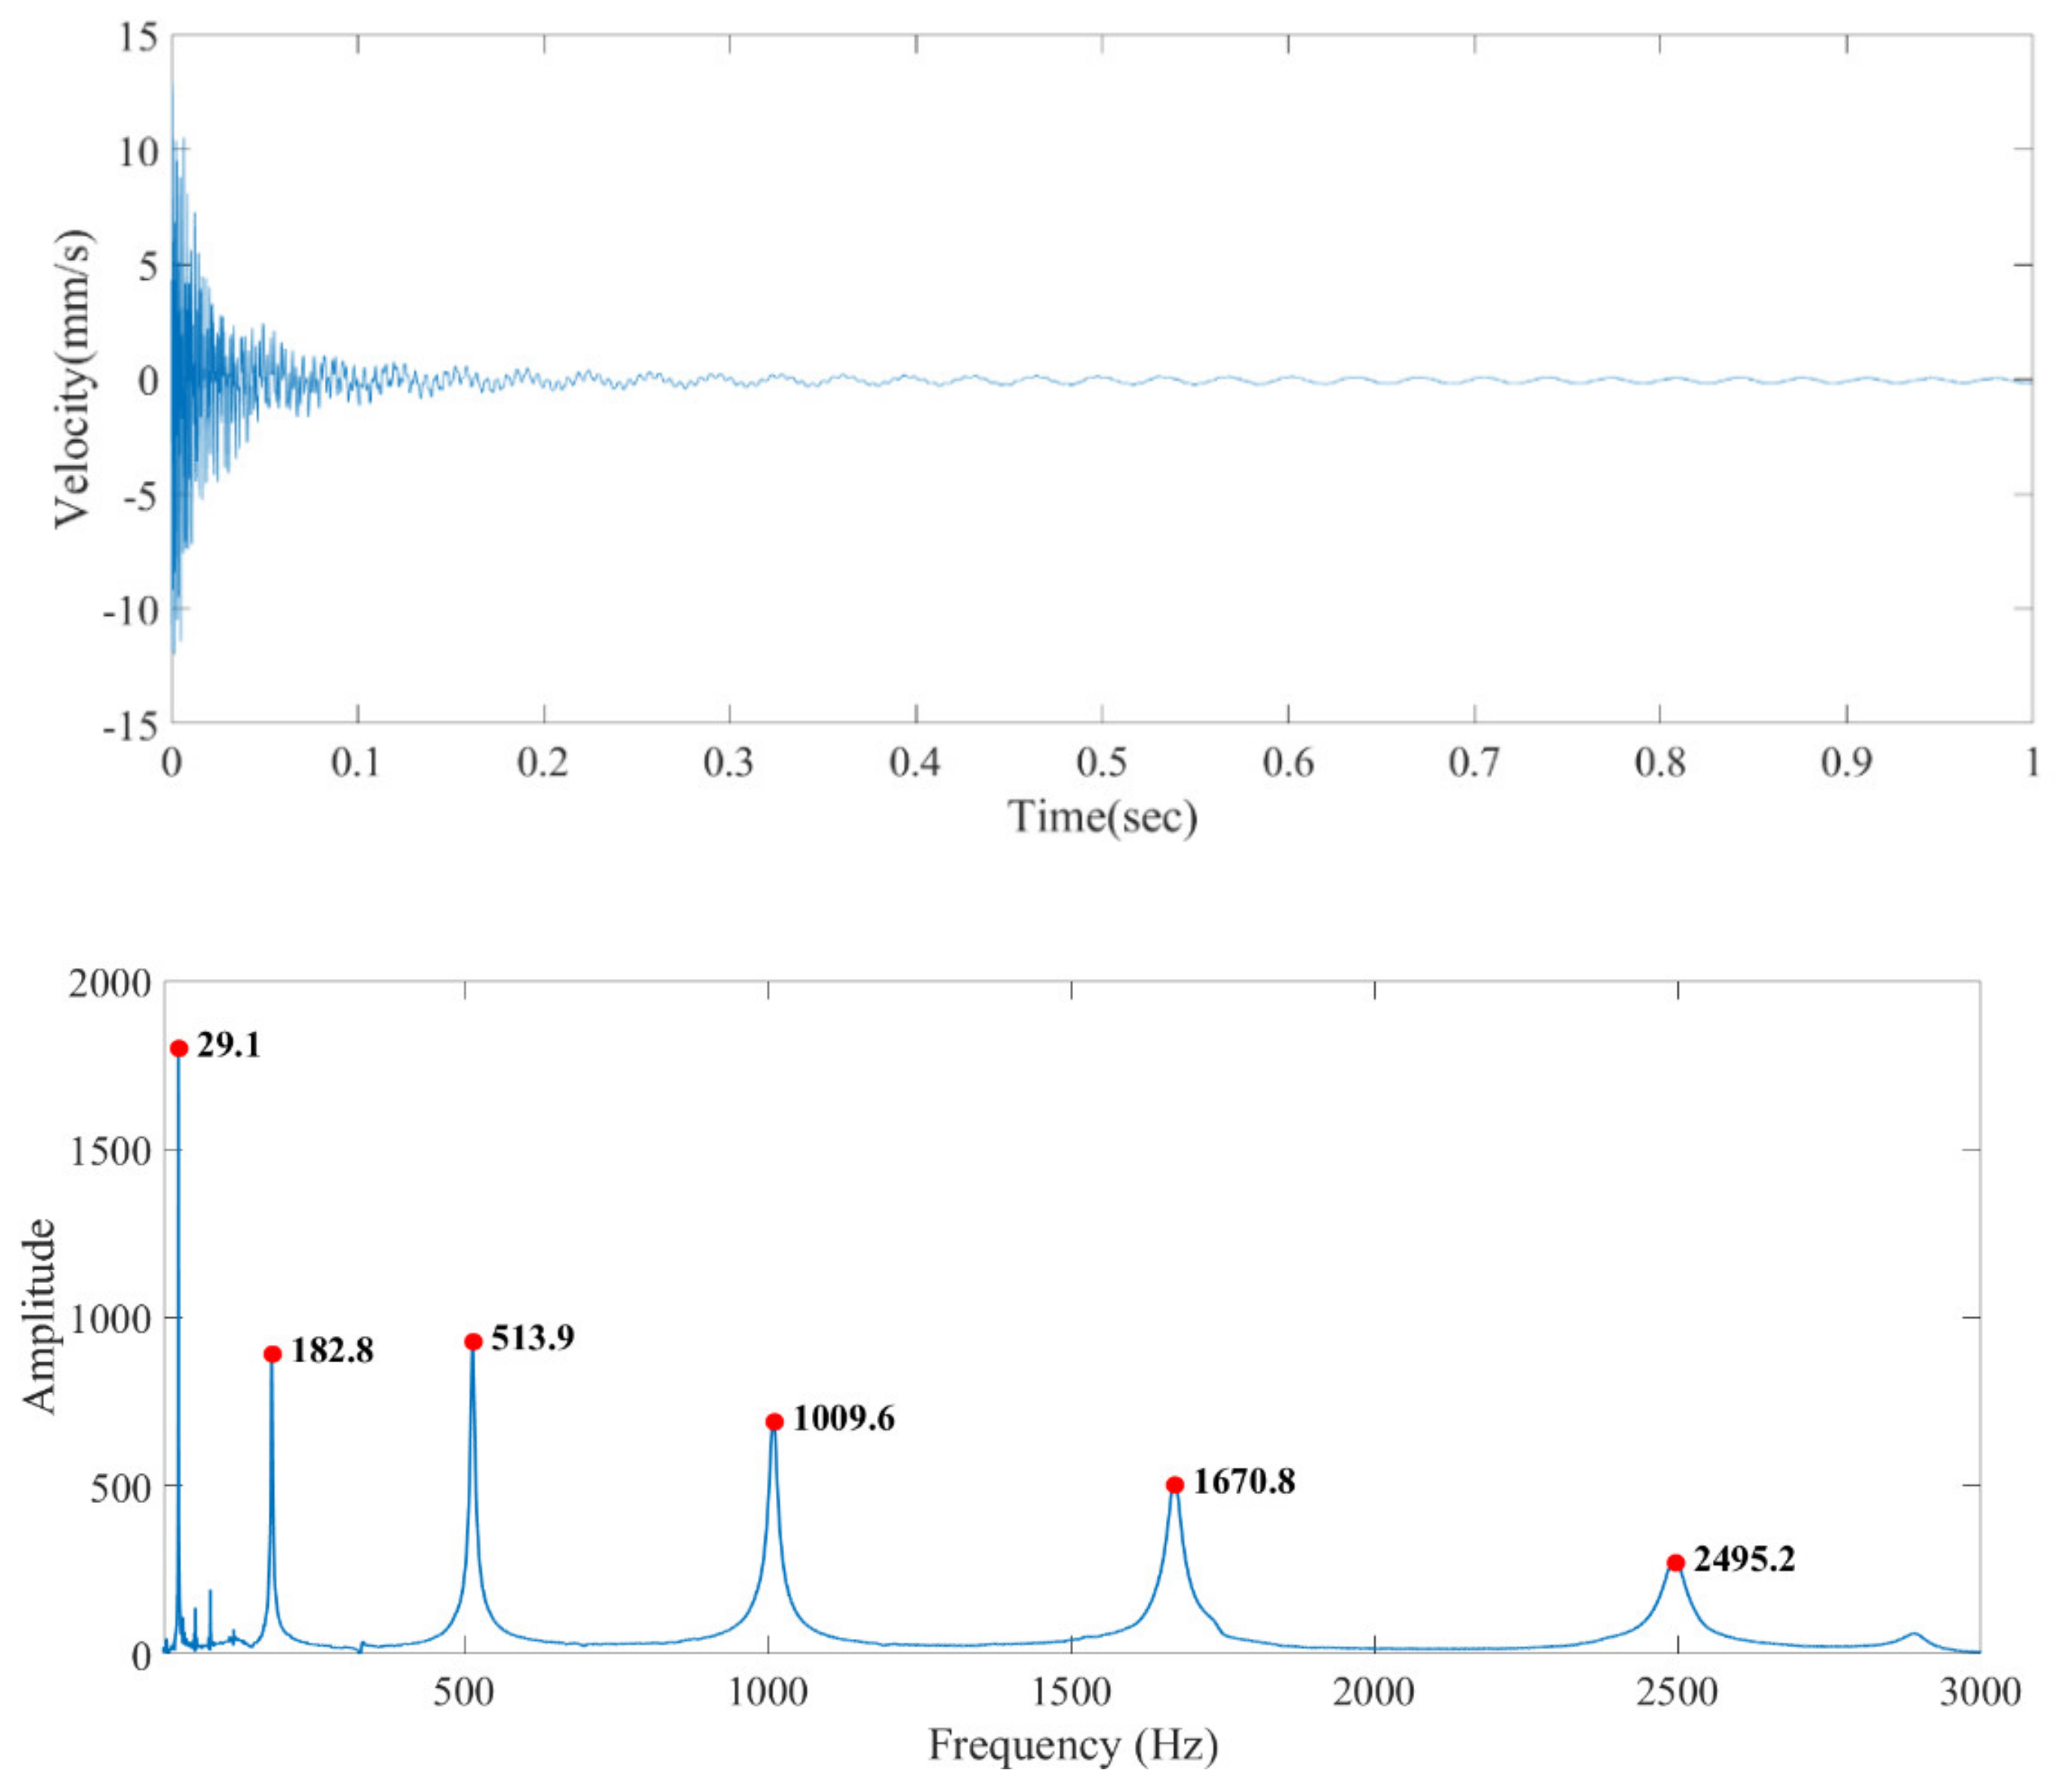
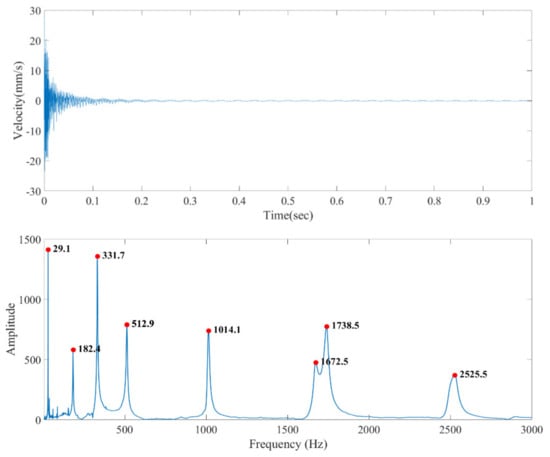
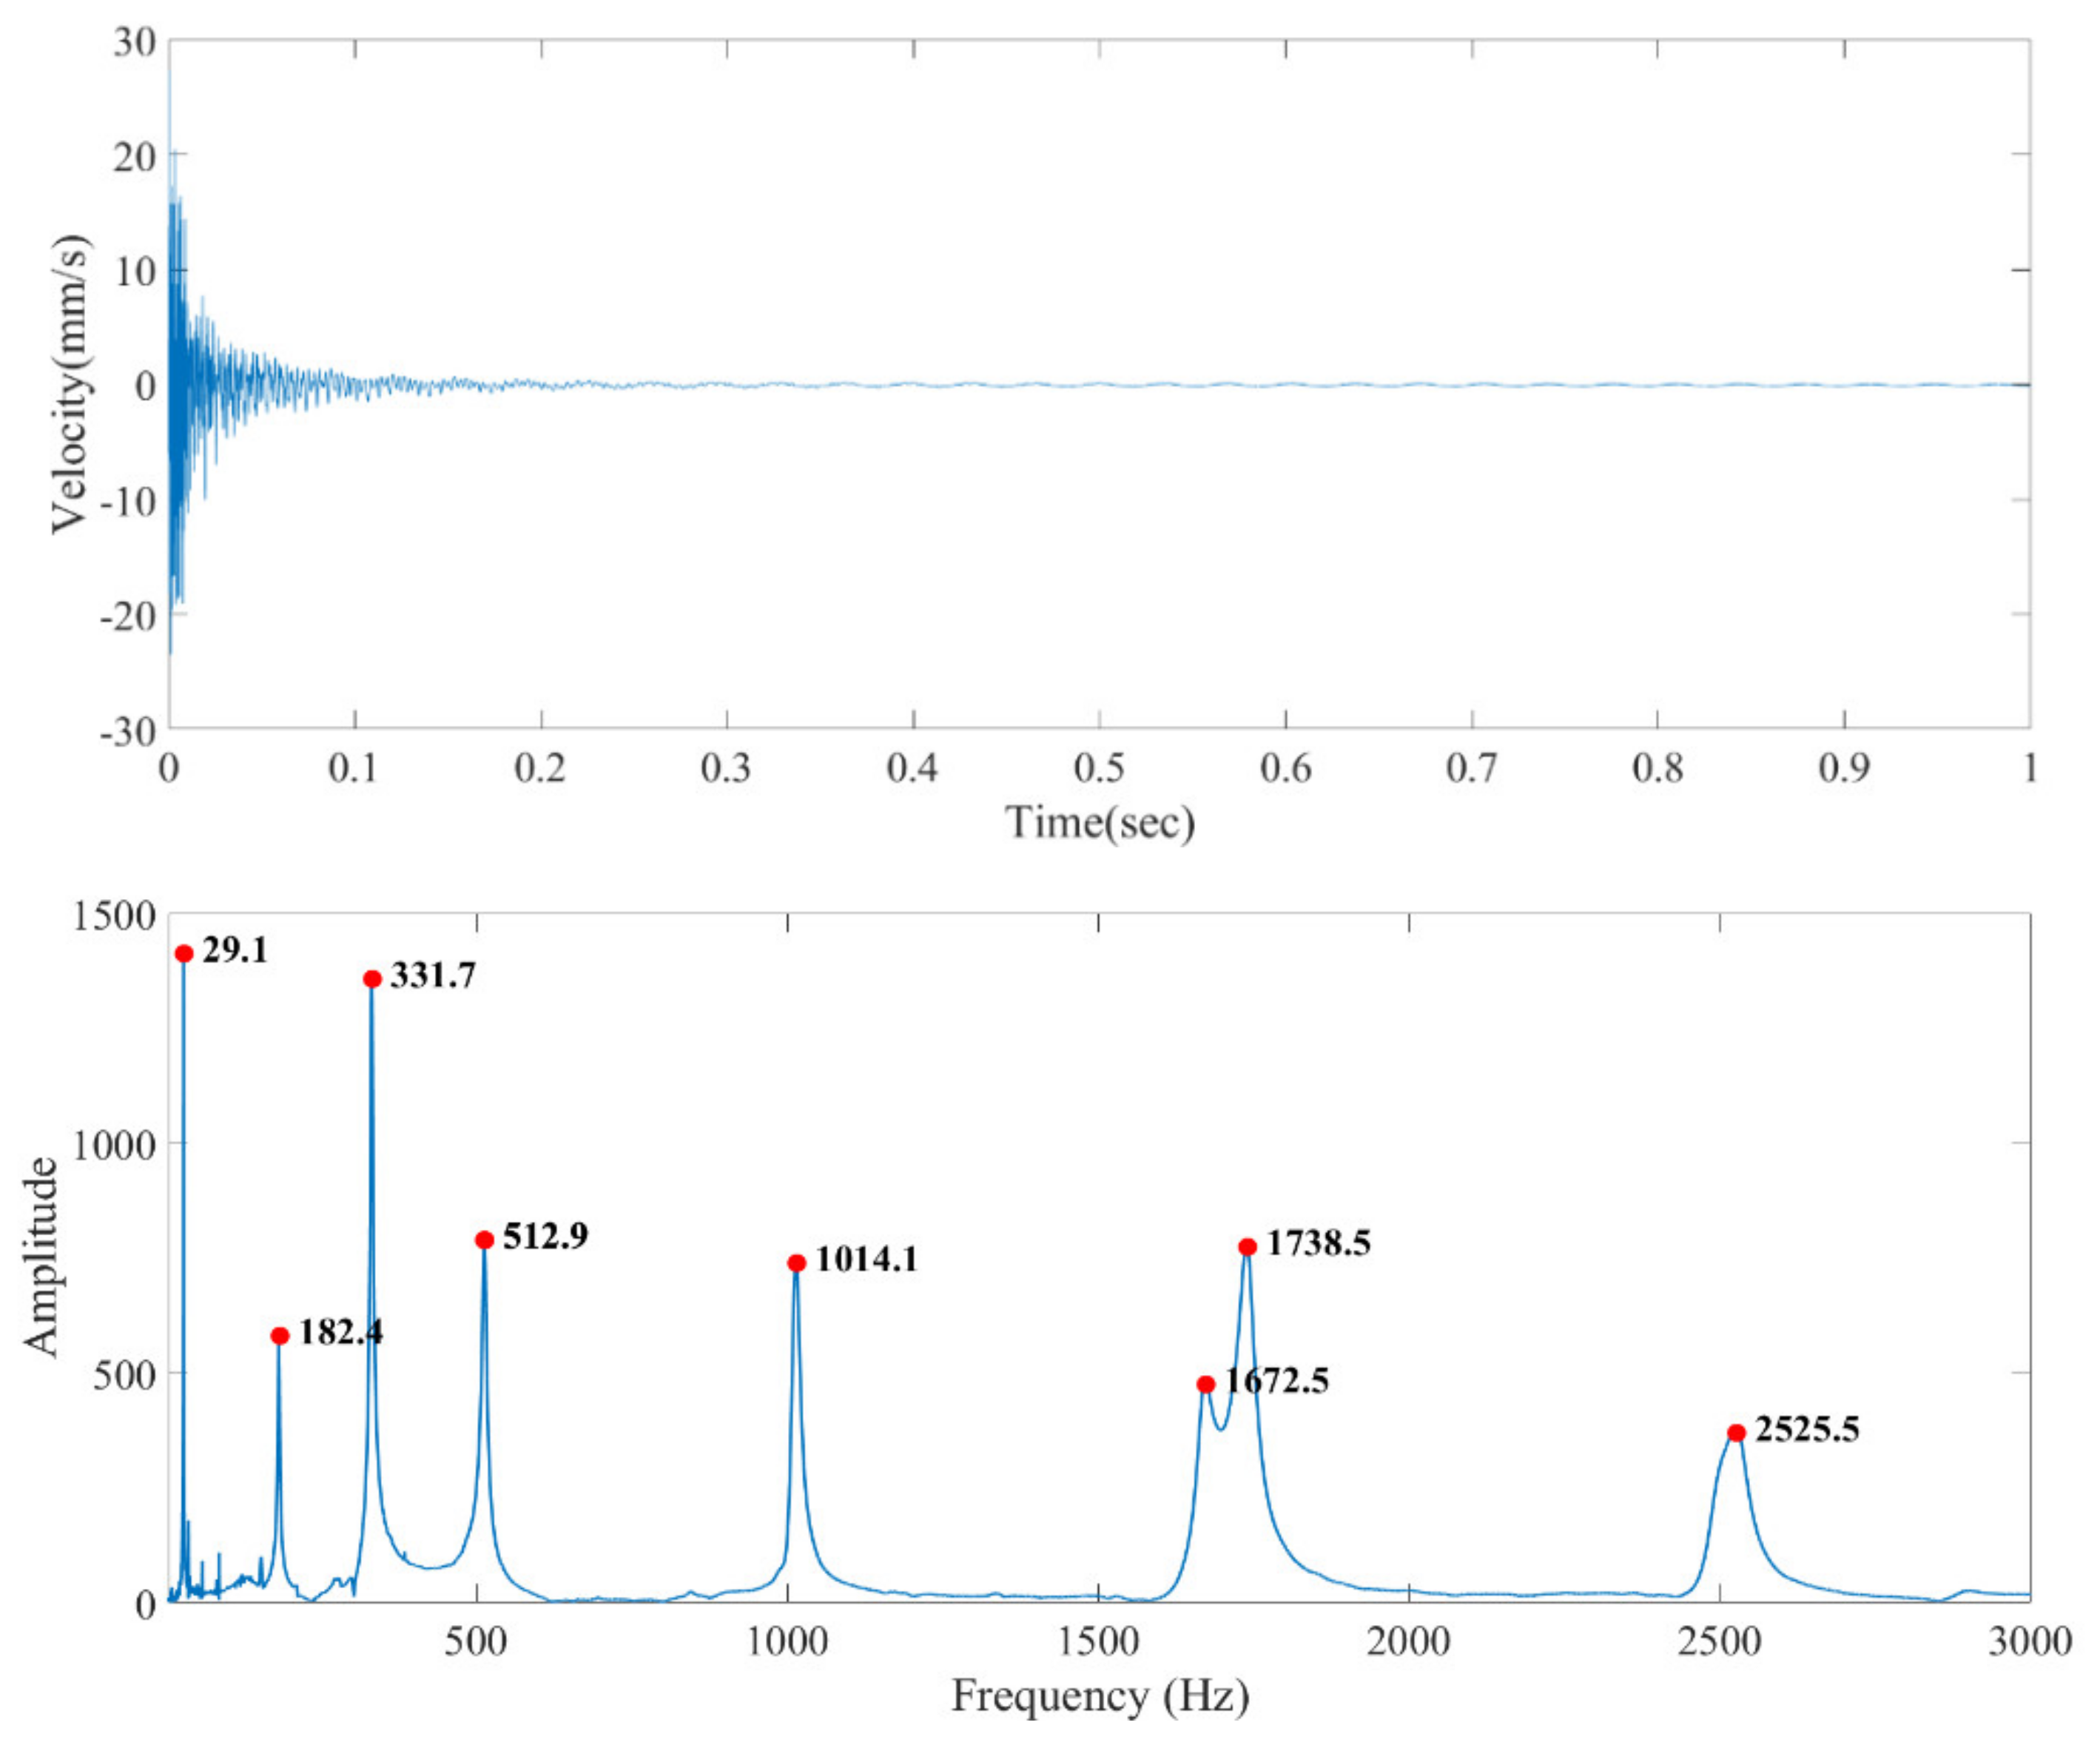
Figure 4 and Figure 5 show the time domain and FFT-based frequency domain signals after hitting at points A and B. The resonance frequencies measured are listed in Table 2 and Supplementary Materials. The symbol B in the mode column indicates the resonance frequency of the bending mode, while the symbol T indicates the resonance frequency of torsion mode. How to obtain the simulation values is explained subsequently. The first-order resonance frequency in the bending mode was then substituted into Equation (5) to obtain the Young’s modulus: Ex = 3.19 GPa; the first-order resonance frequency in the torsion mode was substituted into Equation (12) to obtain Gxy = 1.12 GPa. The elastic modulus and shear modulus obtained by inverse calculation were input into theoretical solutions to obtain the several natural frequencies sequentially, in comparison with the experimental results. Therefore, the first natural frequency in bending and torsional modes has zero errors in theoretical solutions. The error with respect to the test results is mostly within 2%, indicating that the experiments and theory are in good agreement. The values of Ex and Gxy were then substituted into Equation (13), to obtain νxy = 0.429.
Figure 4.
Time domain and frequency domain signals of xy plane–x direction test piece when hitting point A.
Figure 5.
Time domain and frequency domain signals of xy plane–x direction test piece when hitting point B.
Table 2.
Natural resonance frequency of xy plane–x direction test piece.
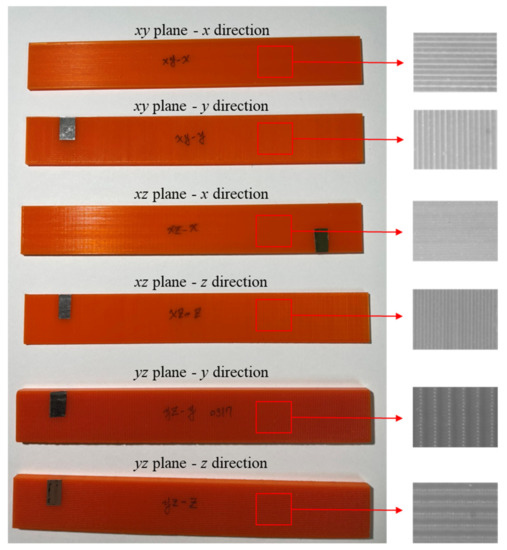
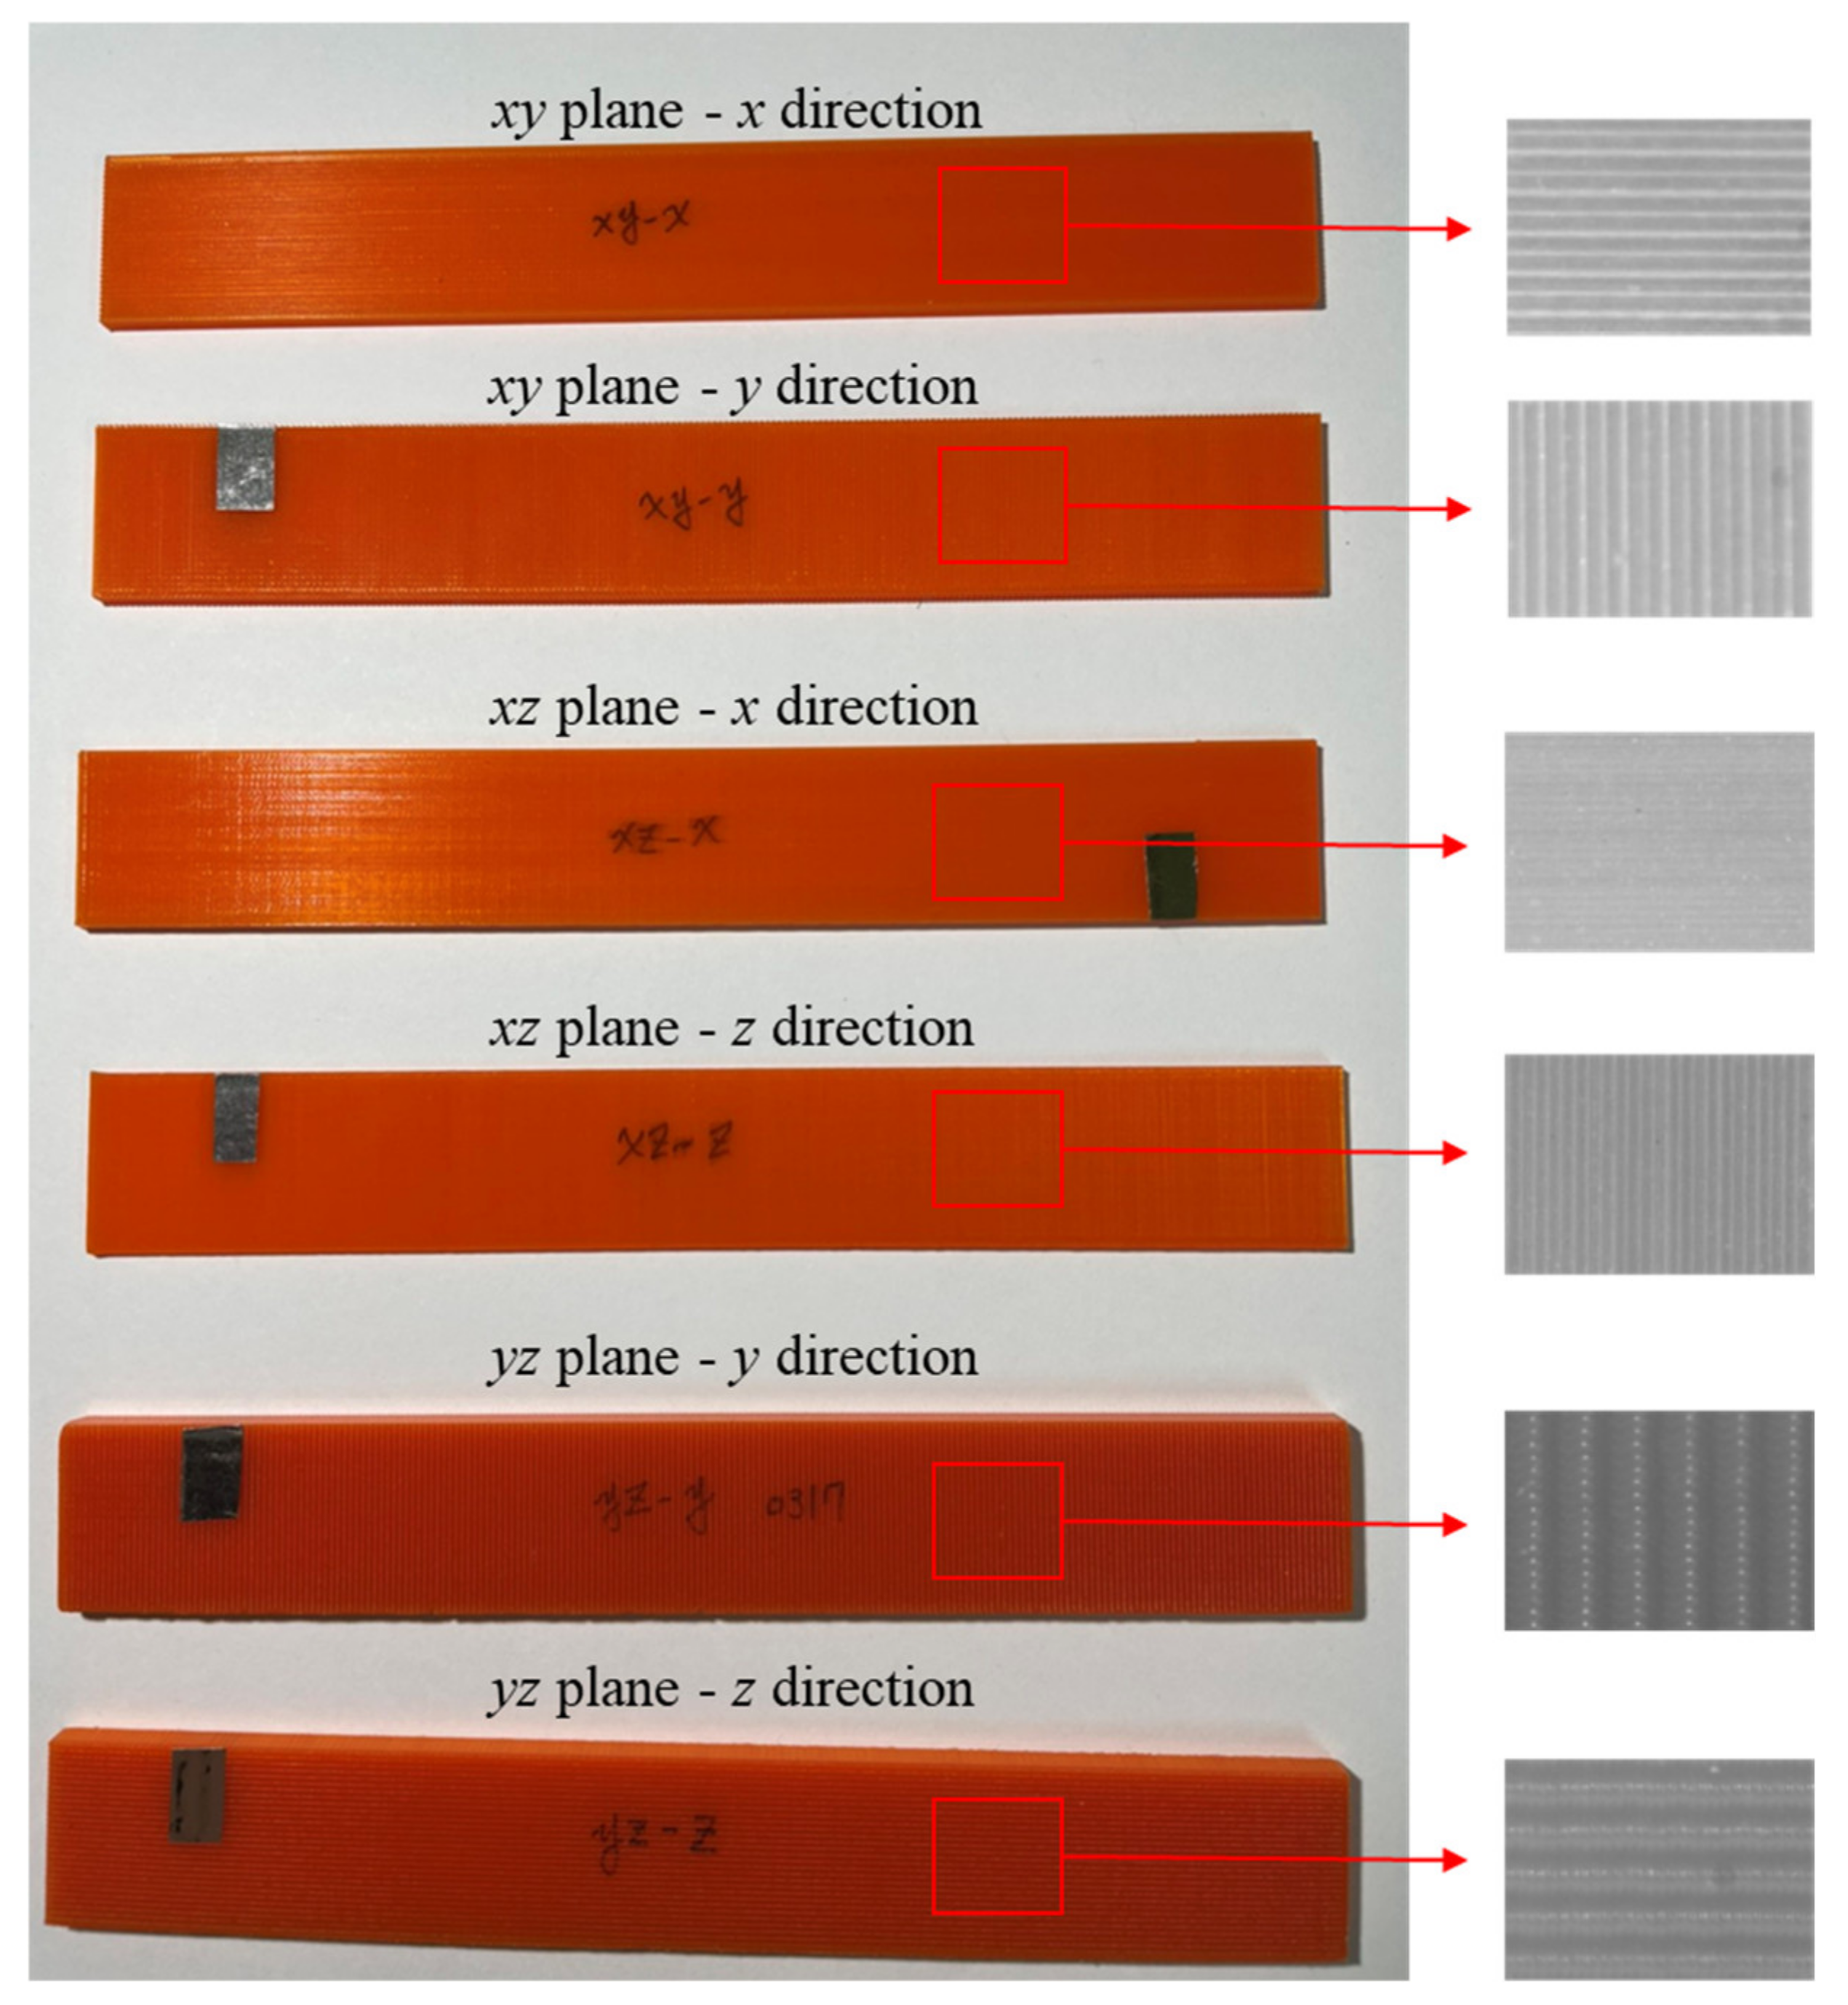
The above process was repeated, and the steel ball drop test was performed with the remaining test pieces. The material constants of all test pieces are listed in Table 3, and photos of the test pieces are shown in Figure 6. The values of E and G measured from the tests verify the above inference that test pieces of the same direction lead to the same E, and test pieces of the same plane lead to the same G. The material constants of the xy plane–x direction test piece, xz plane–z direction test piece, and yz plane–y direction test piece, i.e., Ex, Ey, Ez, Gxy, Gxz, Gyz, νxy, νzx, and νyz, were used as the nine material constants of the orthotropic material, as shown in Table 4. It is shown that the various printing directions cause the void and defect on different levels. The similar stacking planes with the same longitudinal direction have the approximate values of moduli. Therefore, for the sake of convenience and for saving time, the material constants of the orthotropic material can be determined by measuring only these three test pieces in the future, instead of measuring six test pieces. Table 2 and Supplementary Materials list the FEM results, with he natural frequencies obtained by the orthotropic material constants, to verify the experimental measurement and eigenvalues in vibrating theory. In addition to the results in Table 2 of the xy plane-x direction test piece, the other five test pieces are also verified in the Supplementary Materials. The difference in FEM is smaller than 5.3% by inputting the orthotropic material constants.
Table 3.
Measured results of test pieces with different directions.
Figure 6.
Photos of test pieces in different directions.
Table 4.
Material constants of orthotropic material.
The simulated values in Table 2 and Supplementary Materials were obtained with the actual dimensions of the test pieces. The nine material constants listed in Table 4 were input into the finite element analysis software ABAQUS. The material was set to be orthotropic, the grid type was set to be C3D20R (3D 20 node quadratic brick, reduced integration) elements, and the assign material orientation command was used to specify the fiber strength direction of the test piece. After completing the above settings, the resonance frequency under each vibration mode was simulated, and the error between the simulation results and the theoretical and experimental values was calculated. The simulation shows good agreement with both theory and experiments, and the error between the simulations and experiments is smaller than that between simulations and theory. This is probably due to the fact that Bernoulli–Euler beam theory was used to estimate the material constant in a single direction of the orthotropic material, which caused some error. In contrast, the simulation results and experimental values are similar, and closer to expectation because they are obtained based on the orthotropic material. All in all, a complete set of orthotropic material constant measurement and simulation methods were described in this section.
4. Influence of Printing Parameters on Material Properties
After the non-destructive evaluation is established in the dynamic test, the printing parameters that influence the stiffness are determined by the inverse calculation of resonant frequency. This section mainly discusses the influence of printing parameters on material properties, including raster angle and layer height.
4.1. Raster Angle
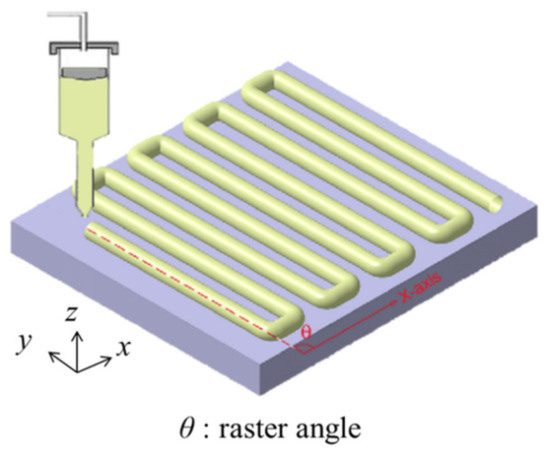
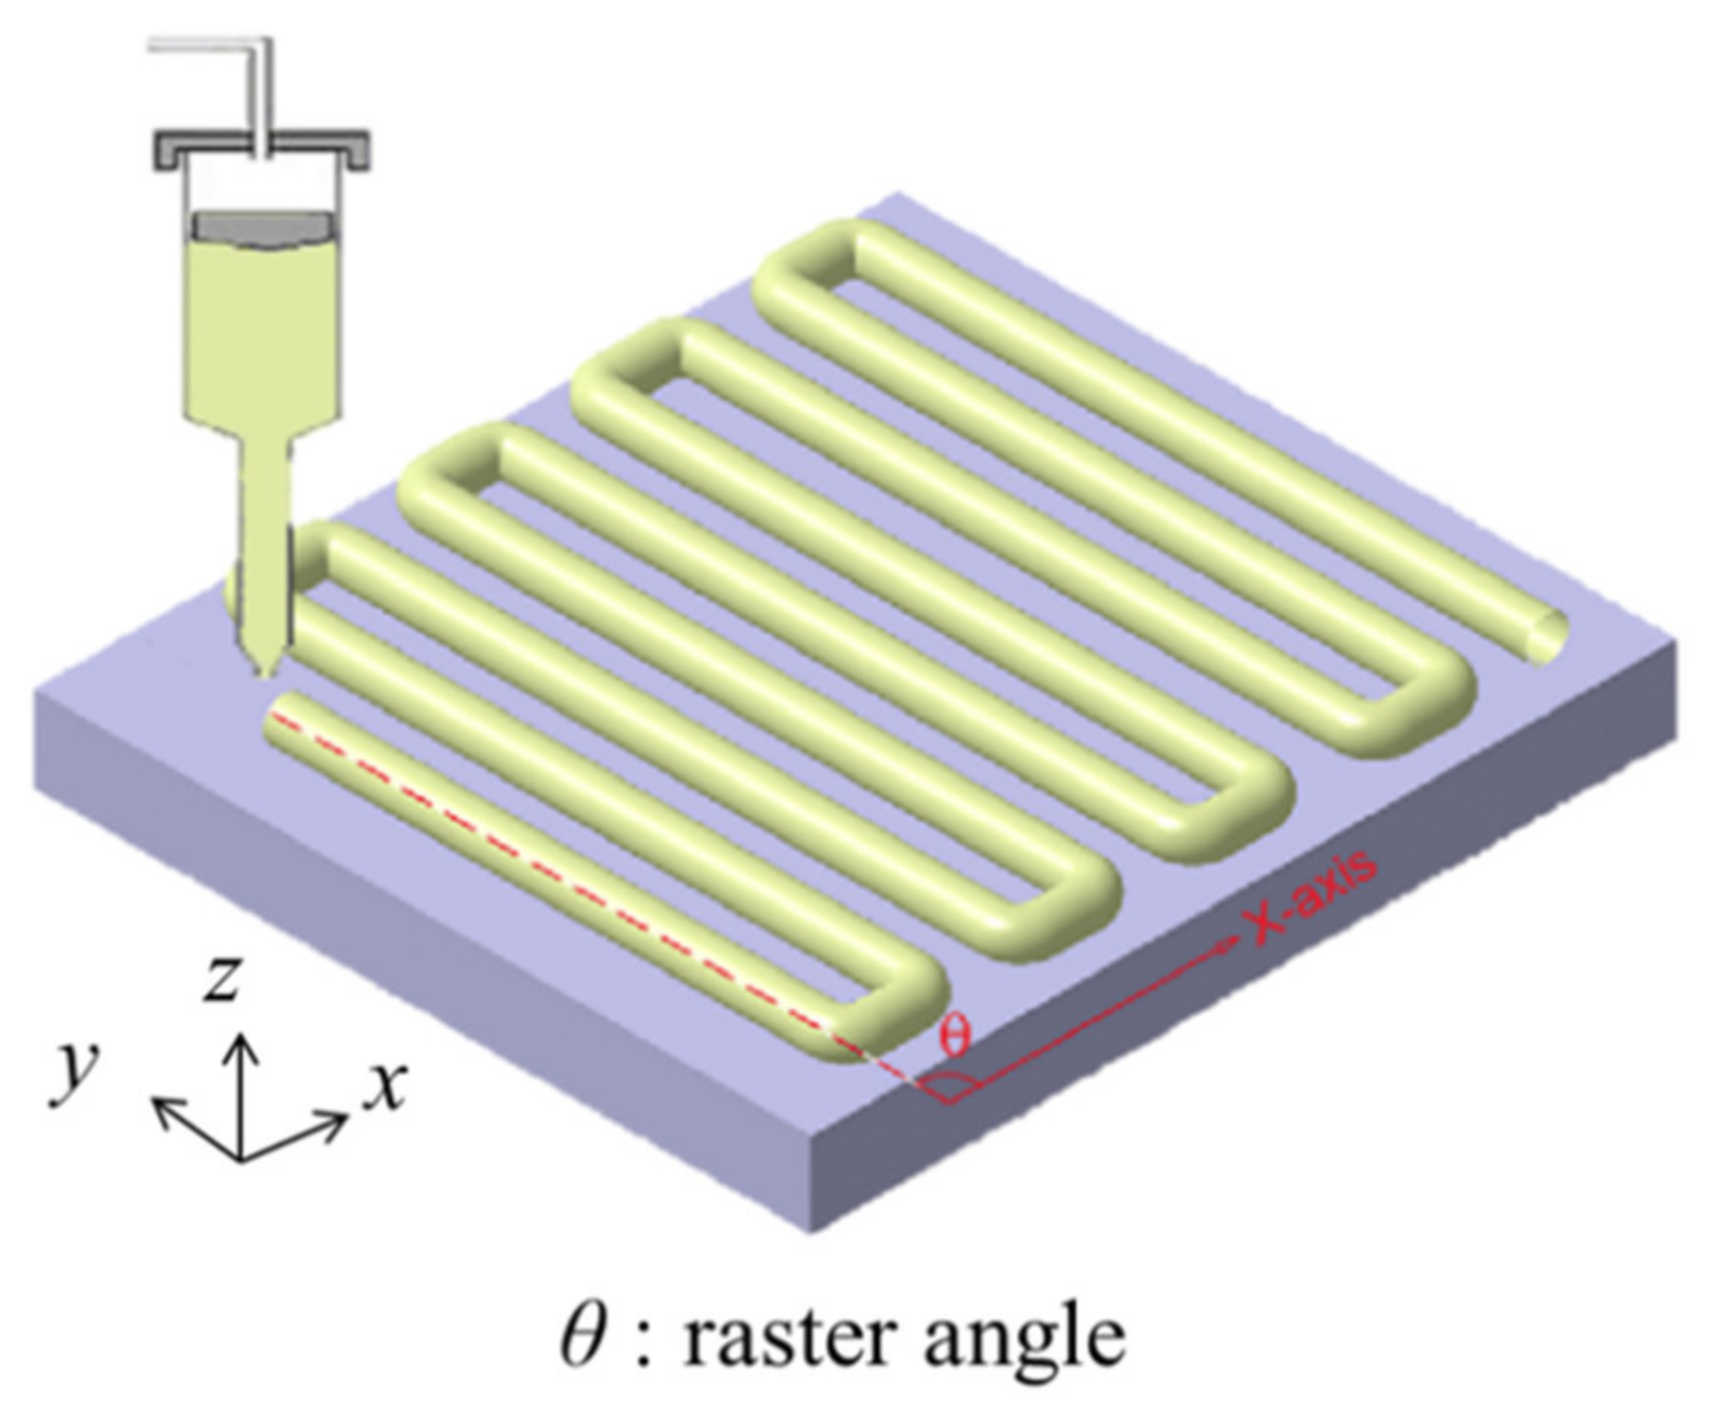
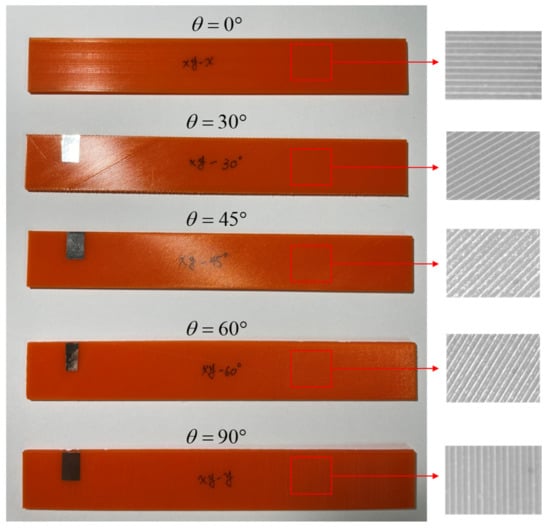
The raster angle is defined as the angle between the printing direction and the x-axis (θ), as shown in Figure 7. If θ = 0°, the print head prints along the x-axis, i.e., the aforementioned x direction; if θ = 90°, the print head prints along the y-axis, i.e., the aforementioned y direction. The 3D printer was used to print five test pieces with θ = 0°, 30°, 45°, 60°, and 90°, as depicted in Figure 8. These test pieces were subjected to the steel ball drop test to measure the changes in E and G.
Figure 7.
Schematic of raster angle.
Figure 8.
Photos of test pieces with different raster angles.
In terms of printing parameters, the spacing between each printed line of material is set to be 0.4 mm, and the spacing between each layer in the height direction is set to be 0.2 mm. The x-axis and y-axis correspond to the length and width of the test piece, respectively, which is166 × 24 × 2.4 mm3 in size. Therefore, the test piece with θ = 0° in this section is the same as the xy plane–x direction test piece in Section 3, while the test piece with θ = 90° is the same as the xy plane–y direction test piece in Section 3.
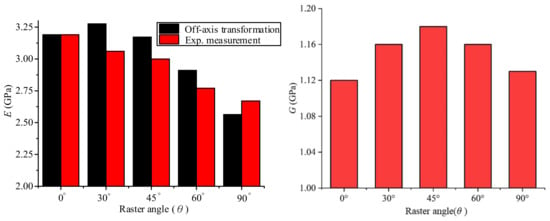
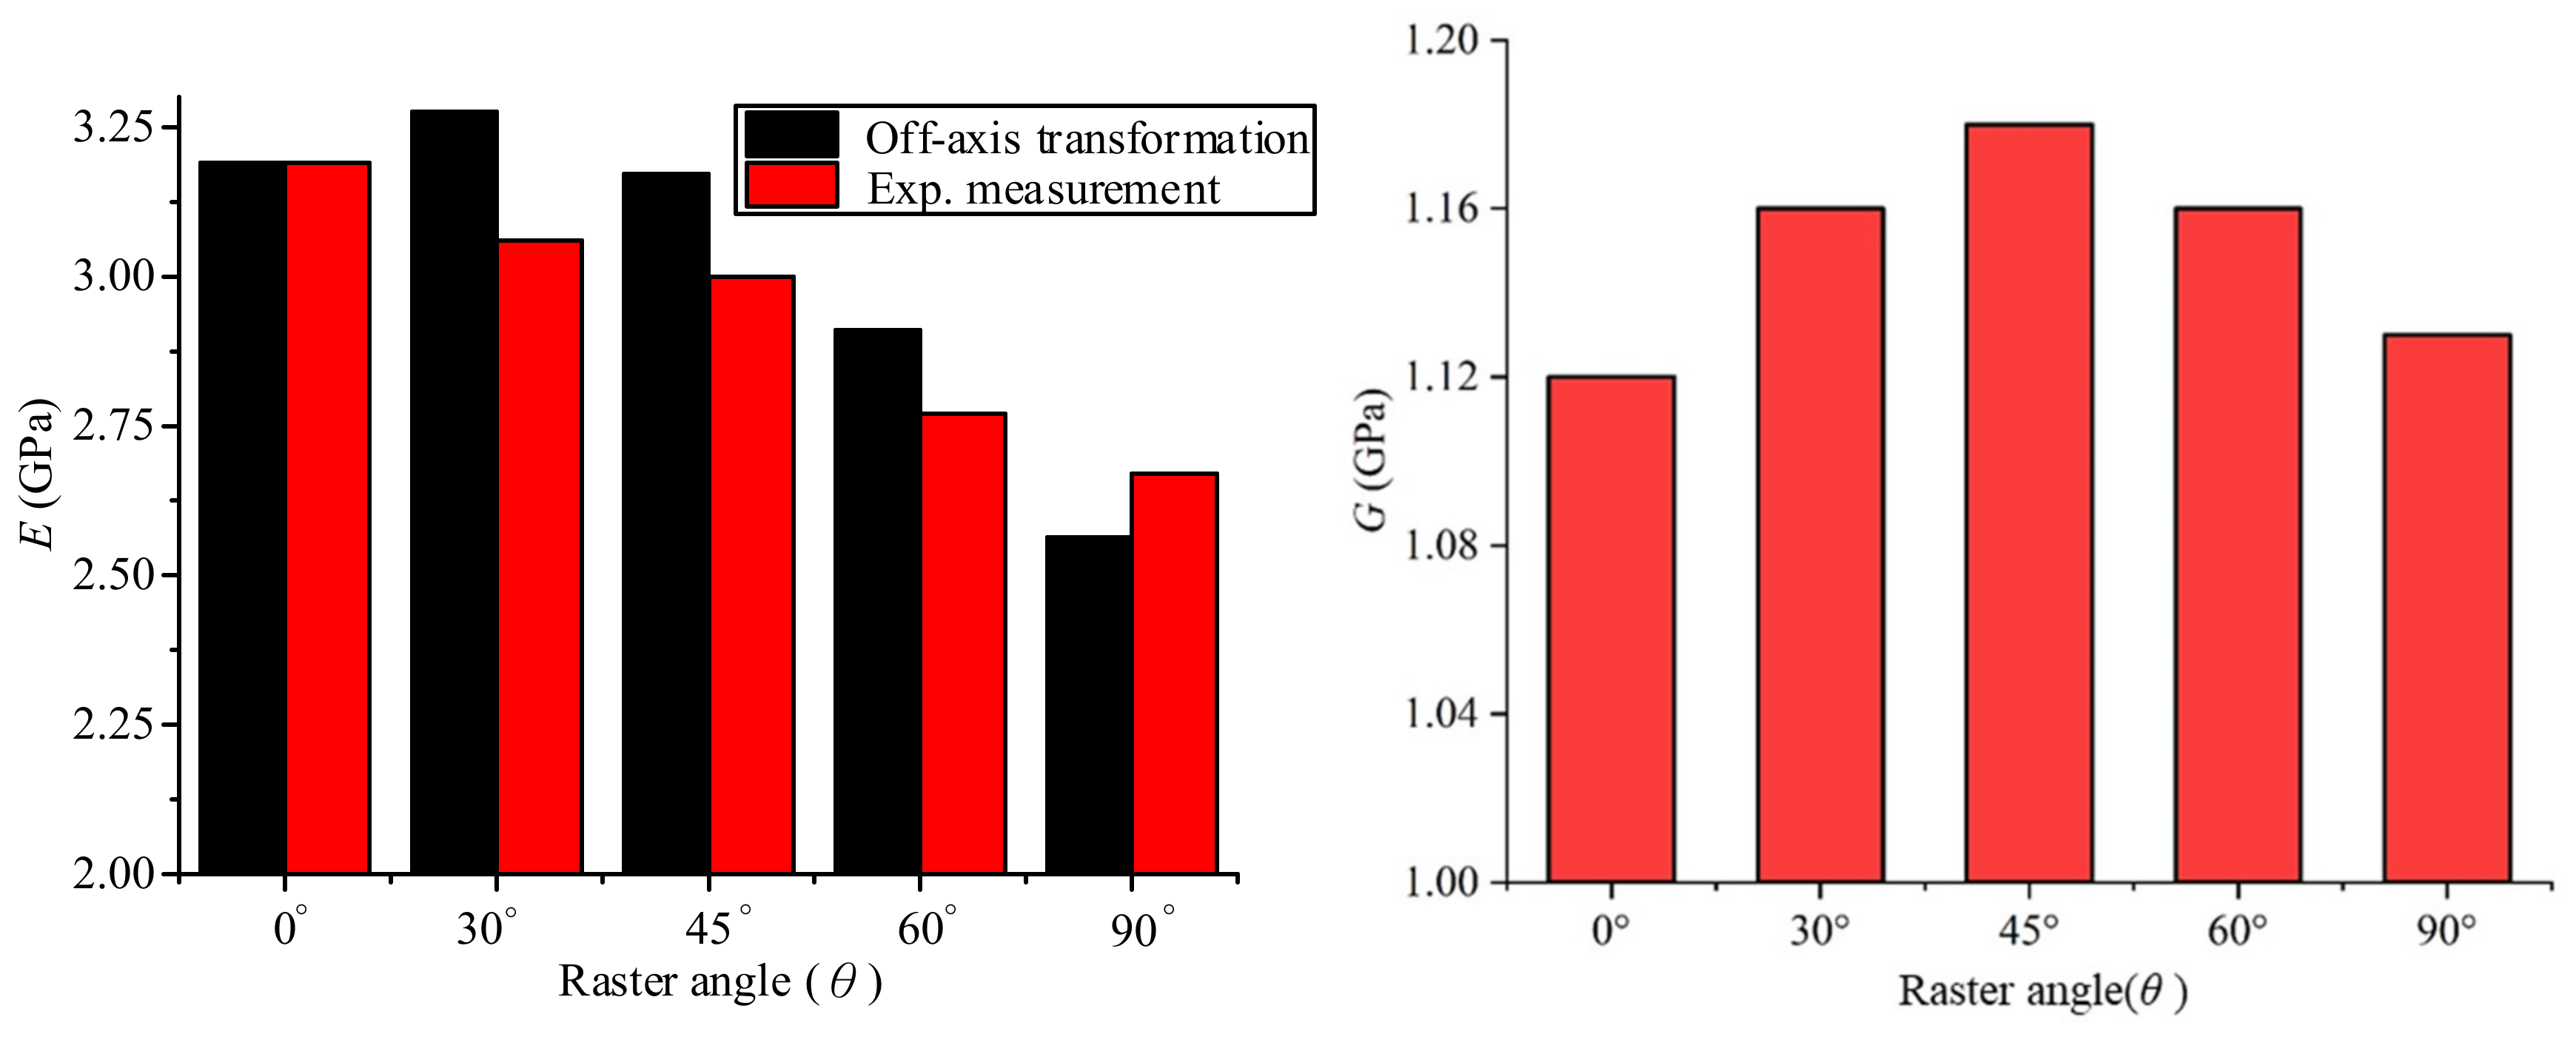
The values of E and G corresponding to each test piece can be obtained by the inverse calculation of material constants, as shown in Table 5. Using the corresponding cross-ply angle, the elastic constants are calculated from the off-axis transformation by the nine orthotropic material constants listed in Table 4. The longitudinally elastic constant, Ex′x′, is listed in Table 5 as the Eoff-axis. In addition, Figure 9 displays the comparison between Ex′x′, E, and G among the five test pieces. It can be seen from Figure 9 that E decreases as the raster angle (θ) increases. Given that the material constants indicate Ex = 3.19 GPa and Ey = 2.56 GPa, the value of E measured with θ = 0°–90° falls between Ex and Ey, and it is reasonable that the value decreases as the raster angle increases. Moreover, from a microscopic point of view, the test piece with θ = 0° under steel ball impact draws its stiffness from the wire material strength, while the test piece with θ = 90° under steel ball impact draws its stiffness from the binding force between the wire materials, which is much lower in comparison. As such, the measured value of E is indeed lower in the latter case. Similarly, the stiffness of the test piece, initially drawn from the wire material strength, becomes gradually more dependent on the binding force between the wire materials as θ increases, causing the stiffness and the measured value of E to decrease.
Table 5.
Material constants with different raster angles.
Figure 9.
Material constants of test pieces with different raster angles.
It is also seen in Figure 9 that G is maximum when θ = 45°, and shows a symmetrical distribution, i.e., the value of G with θ = 30° is very close to that with θ = 60°, and the value of G with θ = 0° is very close to that with θ = 90°. It is, thus, speculated that the material is generally subject to the maximum shear stress in the direction of 45° under torsion. Therefore, the test piece printed at a raster angle of 45° can withstand the maximum torsional force, i.e., the stronger the material under torsion, the greater the value of G that is measured. The off-axis transformation cannot calculate the reasonable values corresponding with the beam’s experimental test. The inaccuracy might occur from Poisson’s ratio. In addition, Mohr’s circle indicates that the test piece with θ = 30° and that with θ = 60° are subject to the same torsional force, resulting in similar values of G with symmetrical distribution.
4.2. Layer Height
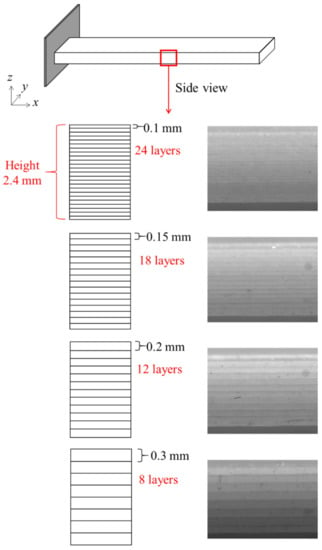
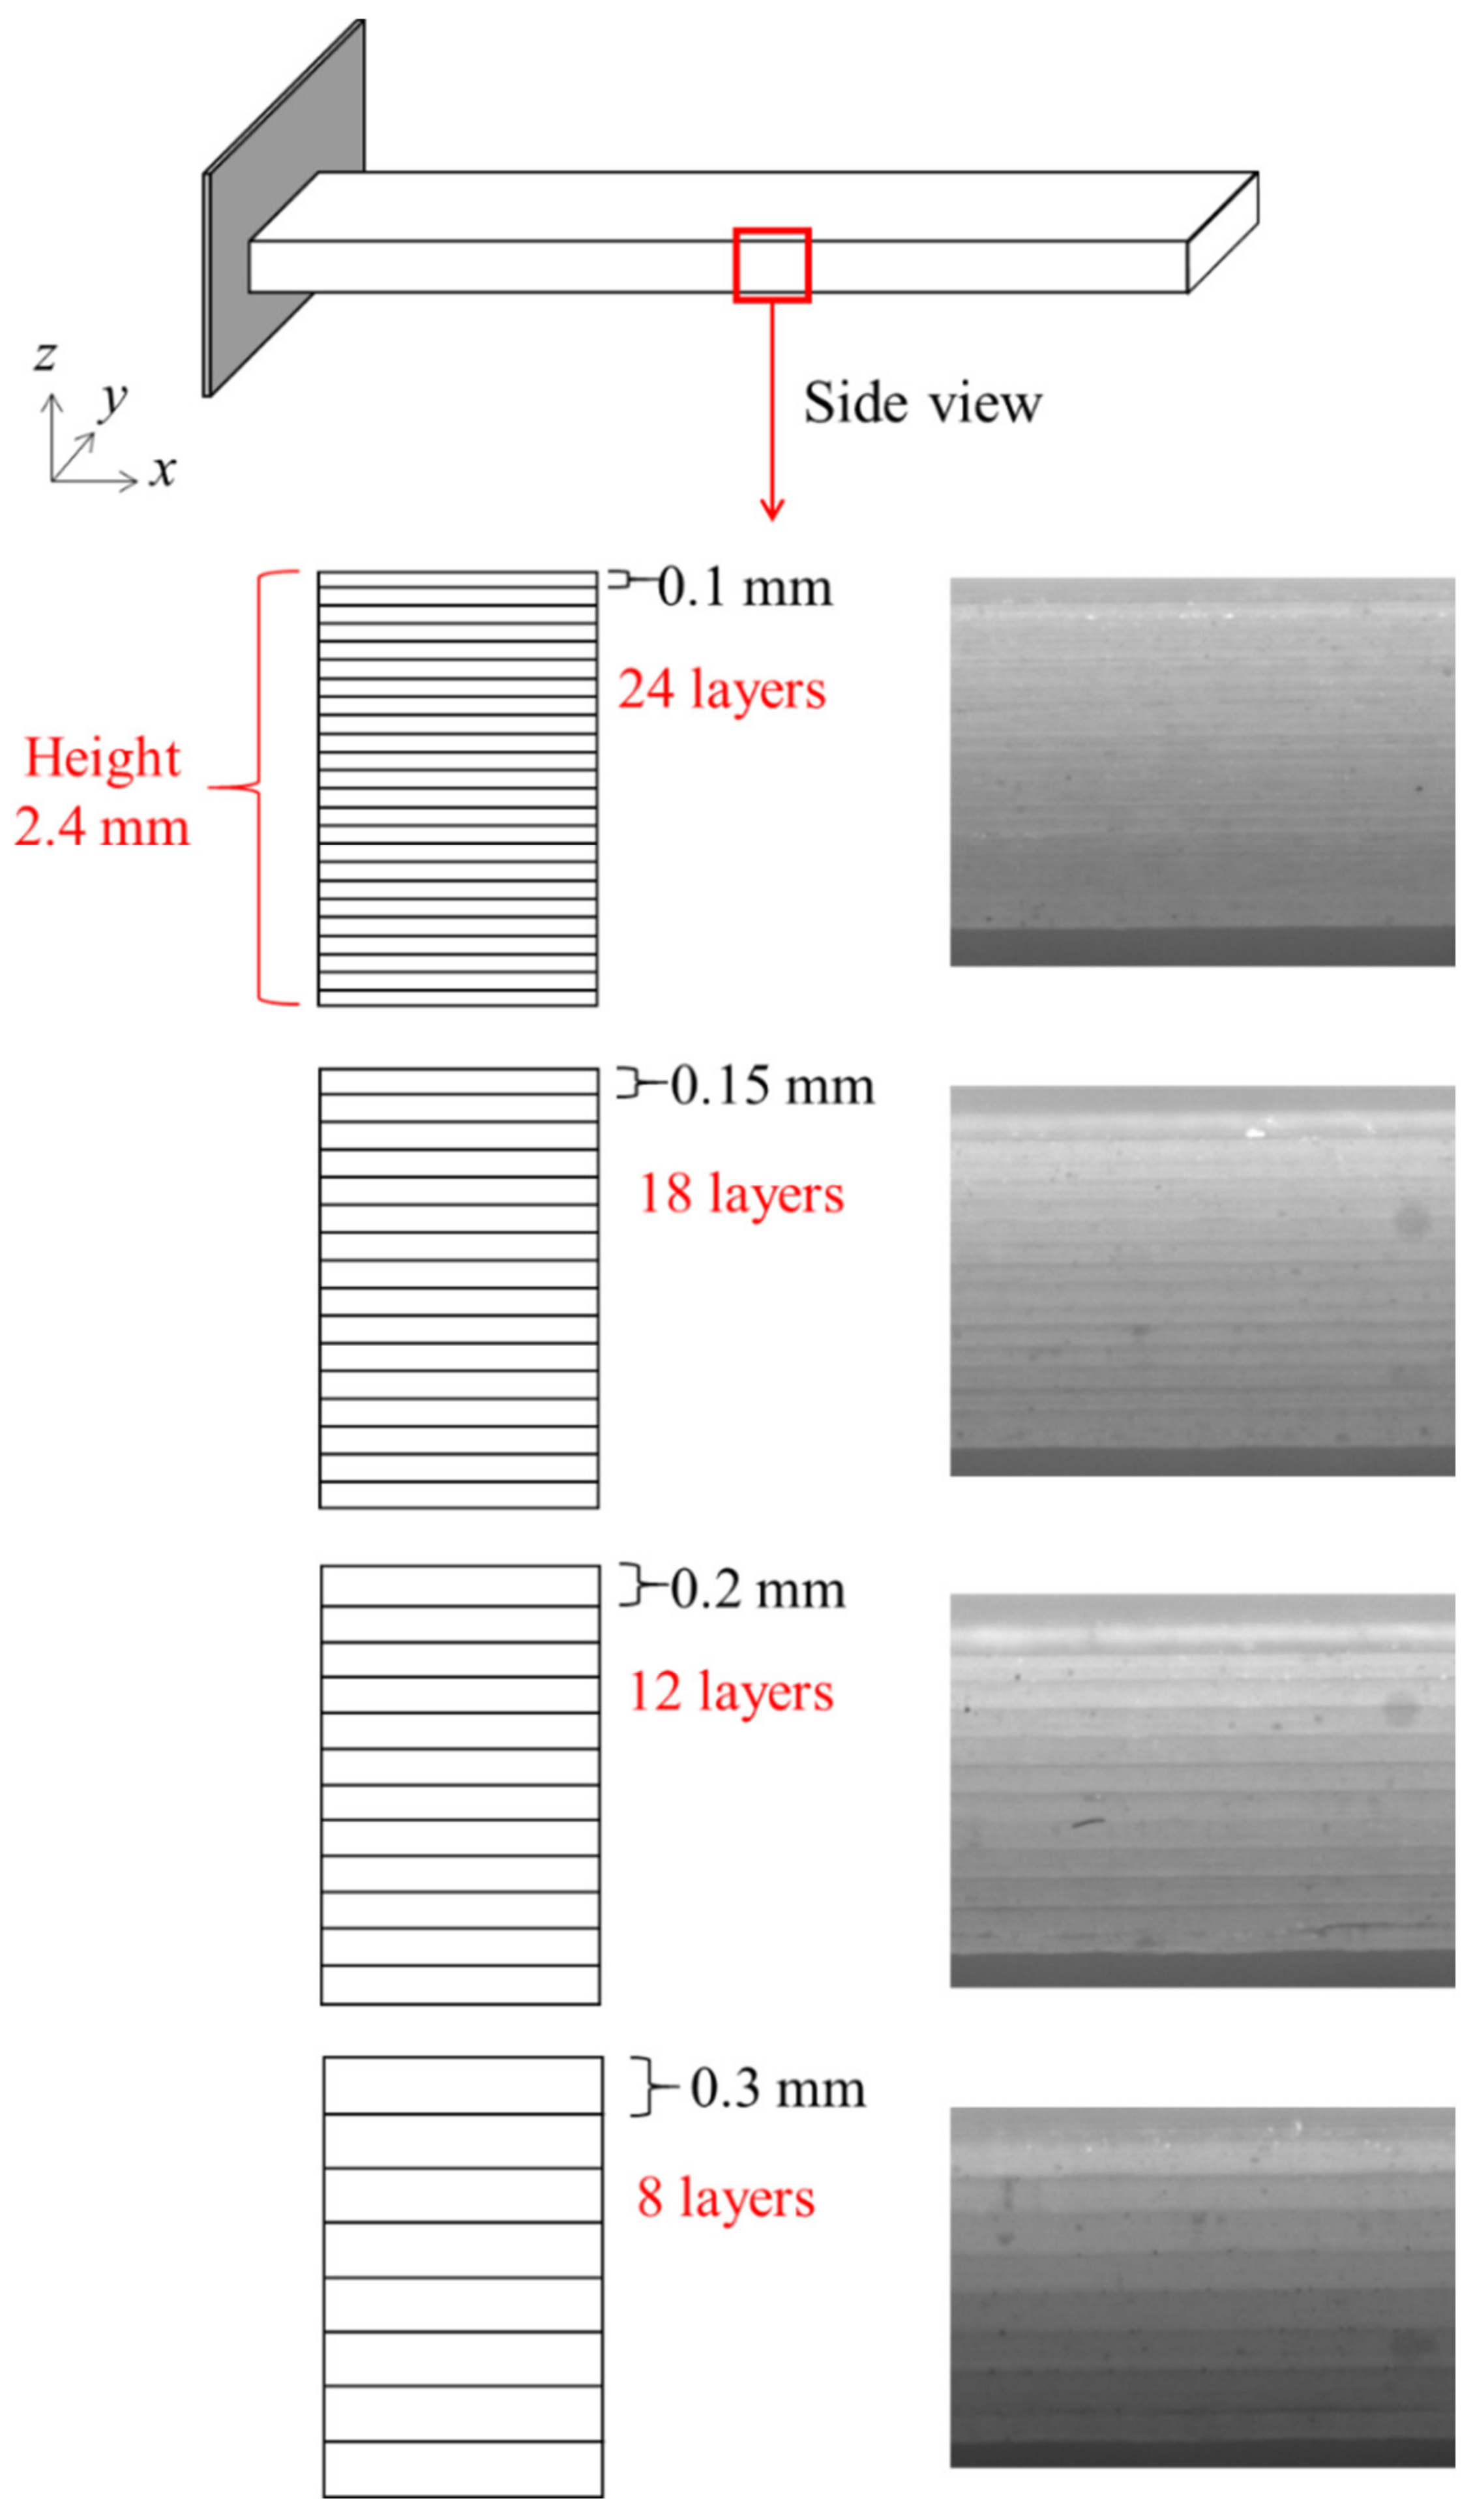
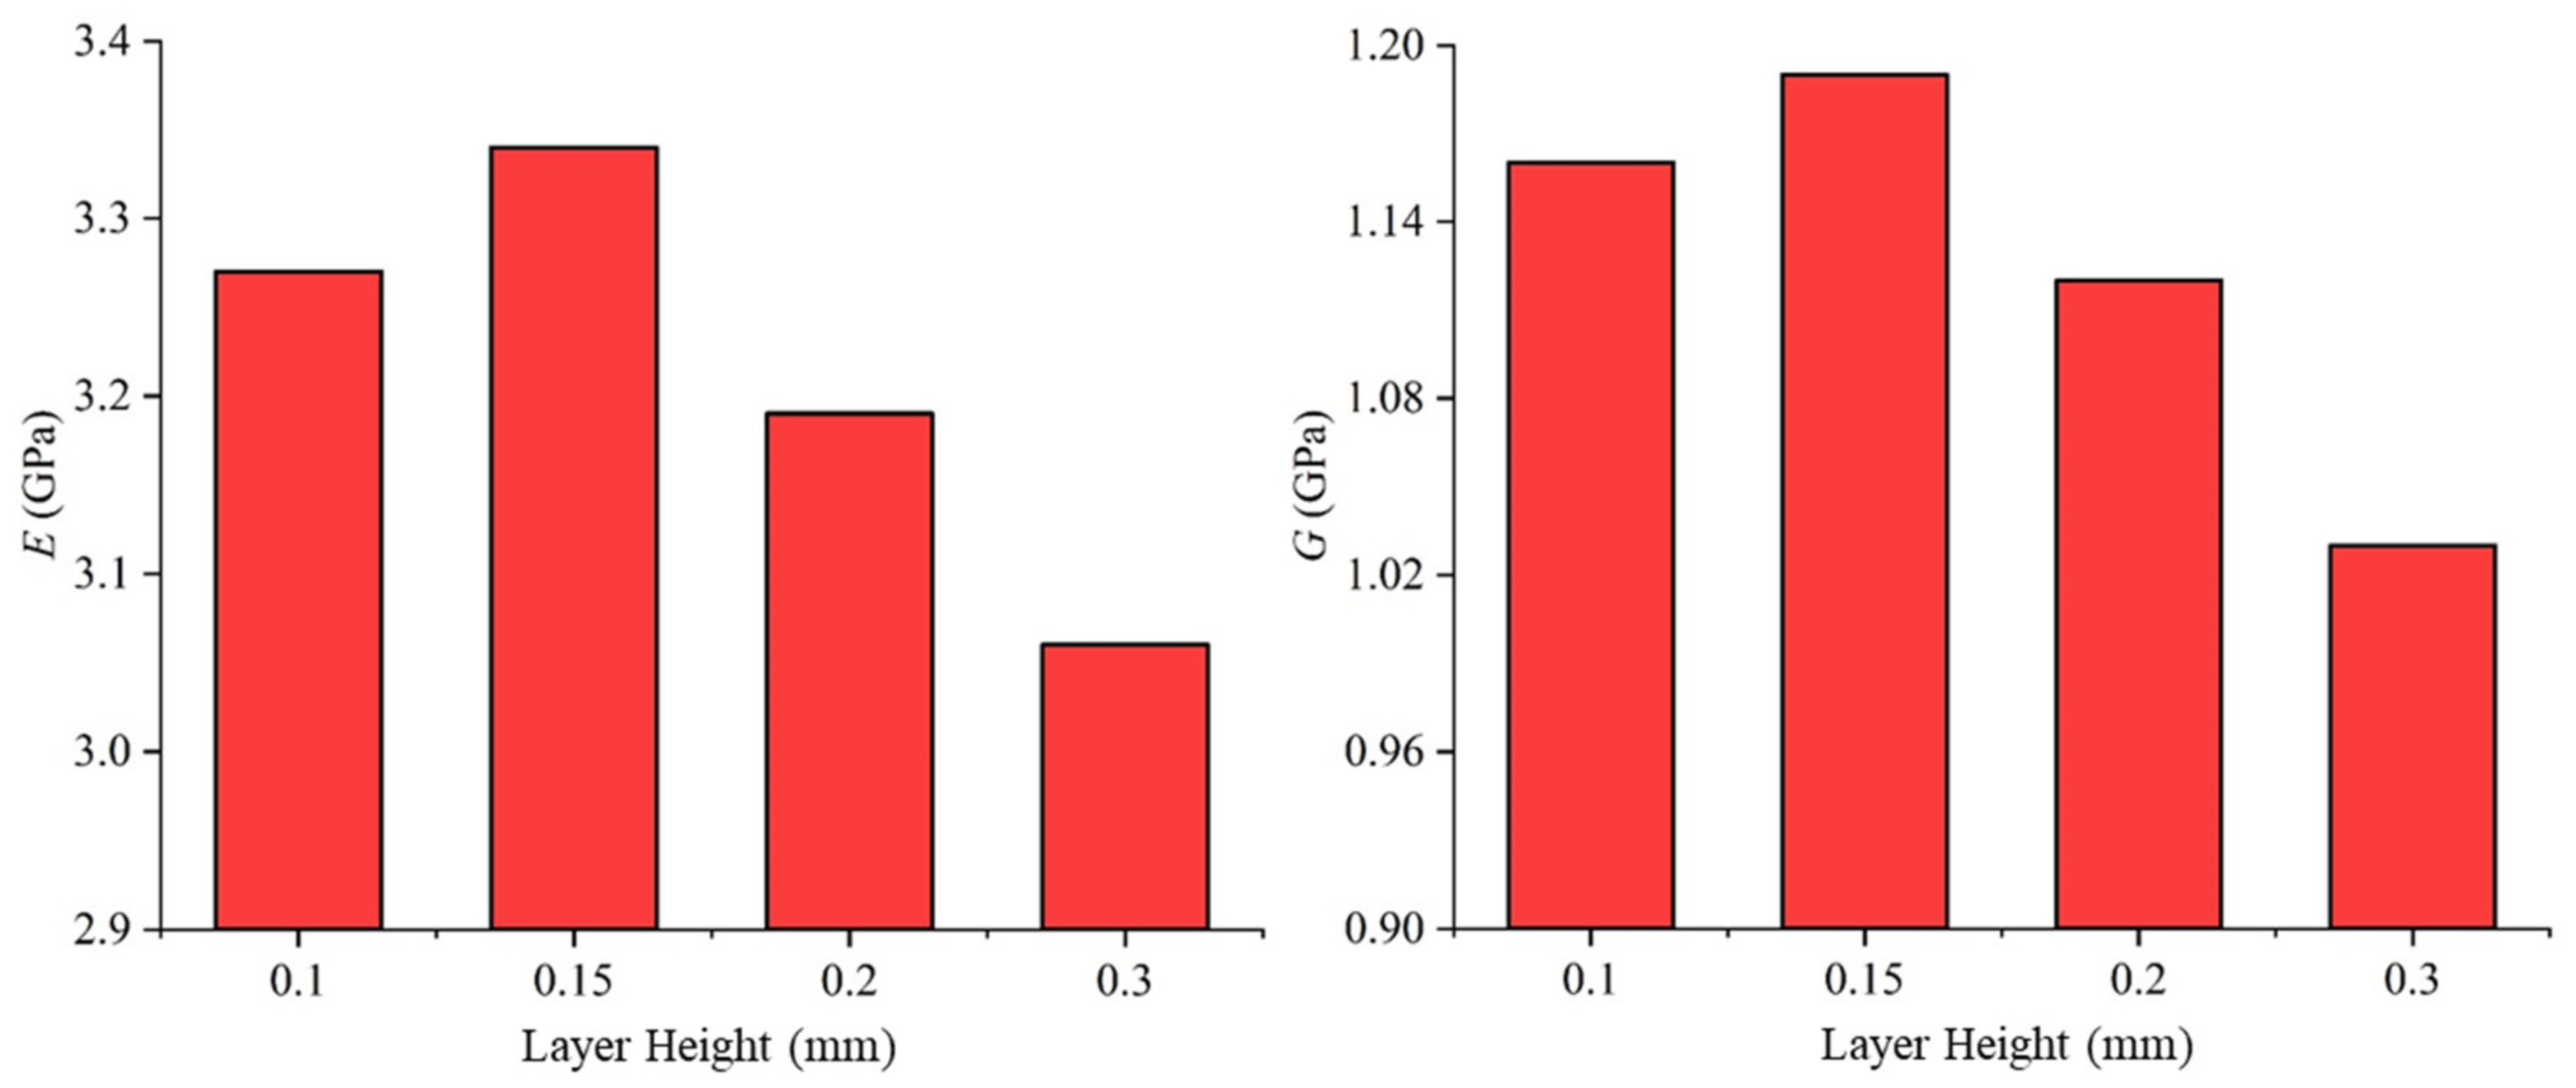
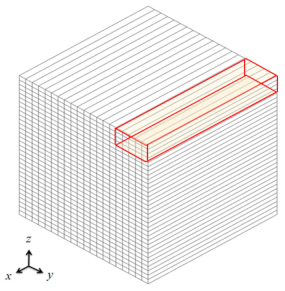
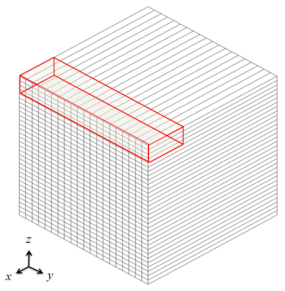
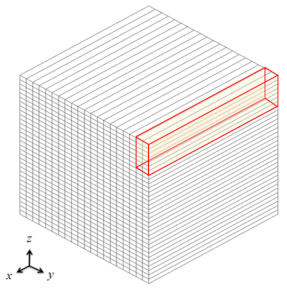
The layer height is defined as the spacing between adjacent layers in the z-direction, which is 0.2 mm, as shown in Figure 3. The 3D printer was then used to print four test pieces with layer heights of 0.1 mm, 0.15 mm, 0.2 mm, and 0.3 mm, as depicted in Figure 10. The steel ball drop test was performed on these test pieces, and the changes in the measured values of E and G were determined.
Figure 10.
Schematic and photos of test pieces with different layer heights.
In terms of printing parameters, the spacing between wire materials is set to be 0.4 mm. The x-axis and y-axis correspond to the length and width of the test piece, respectively. The raster angle is set to be θ = 0°, while the test piece is 166 × 24 × 2.4 mm3 in size. As such, the test piece with a layer height of 0.2 mm mentioned in this section is the same as the xy plane–x direction test piece mentioned in Section 3.
The values of E and G are based on the inversely calculated material constants of these four test pieces, as shown in Table 6. The extrusion amount in the table represents the feed length of the feed material in order to print 1 mm of wire material through the print head; this amount is a dimensionless parameter that is directly related to the diameters of the feed material and print head. In this study, the feed material has a diameter of 1.75 mm, whereas the print head has a diameter of 0.4 mm. The values of E and G are plotted in Figure 11, for the sake of comparison.
Table 6.
Material constants with different layer heights.
Figure 11.
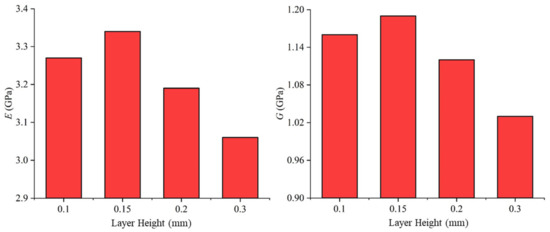
Material constants of test pieces with different layer heights.
It can be seen from Figure 11 that, for a layer height between 0.3 mm and 0.15 mm, both E and G increase as the layer height decreases. At a layer height of 0.15 mm, E and G reach their respective maximum. However, when the layer height is further reduced to 0.1 mm, both E and G decrease. From a microscopic point of view, a smaller layer height implies a smaller spacing between the adjacent layers in the z-direction, i.e., greater compactness of stacking and smaller gaps between wire materials, corresponding to the higher strength of the printed test piece. In contrast, a smaller layer height set in the slicing software leads to a smaller extrusion amount per unit length. The extrusion amount must decrease to keep the geometric dimension, otherwise the fused filament deposited easily distort or collapse. The microstructure might be changed by the density, void, and heating treatment variation. Under the influence of both the layer height and the extrusion amount, the material strength does not increase continuously as the layer height decreases. From the conducted tests, it is found that when the layer height is approximately 0.15 mm, the maximum material strength is achieved.
5. Conclusions
In this study, six strip-like test pieces with different stacking methods were manufactured, based on FDM. Their material constants were inversely calculated. We observe a pairwise relationship because the Young’s modulus is related to the printing direction, and the shear modulus is related to the plane. A total of nine material constants were input into ABAQUS to simulate the natural resonance frequency of the orthotropic material. Test pieces with different stacking methods were simulated by setting diverse directions of the test pieces. The simulation results are highly consistent with theoretical and experimental values, proving the accuracy of the inversely calculated material constants based on test results. This establishes a complete set of methods for measuring and simulating orthotropic material constants. Only the oscilloscope and sensor, e.g., strain gauge or piezoelectric film, are needed to measure the dynamic signal. Then, the mechanical property is measured by inversely calculating the frequency domain transformation.
Subsequently, the influence of changing printing parameters, such as the raster angle and layer height, on the material properties was studied. It is found that when θ increases, the measured value of E decreases, because the stiffness of the test piece becomes more dependent on the binding force between the wire materials, rather than the strength of these materials themselves; this reduces the stiffness. The maximum value of G is achieved when θ = 45°, which shows a symmetrical distribution. This is because when subjected to torsional force, materials generally experience the maximum shear stress in the direction of 45°. In other words, the test piece printed along the 45° direction can withstand the maximum torsional force. In addition, Mohr’s circle indicates that the torsional forces at θ = 30° and θ = 60° are the same, thus, leading to symmetrical distribution.
Finally, the influence of the layer height was discussed. It is found that for layer heights between 0.3 mm and 0.15 mm, both E and G increase as the layer height decreases. However, when the layer height is further reduced to 0.1 mm, both E and G decrease. A smaller layer height indicates a higher degree of compactness of the stacked layers in the z-direction, thus, resulting in higher strength. However, when the set layer height is smaller, the extrusion amount per unit length of wire is also reduced, leading to the optimal value of the layer height at approximately 0.15 mm.
Supplementary Materials
The following supporting information can be downloaded at: https://www.mdpi.com/article/10.3390/app12136812/s1.
Author Contributions
This study was initiated and designed by Y.-H.H., while C.-Y.L. set-up the experimental platform and conducted the experiments. C.-Y.L. was also responsible for the numerical simulations. Y.-H.H. wrote the paper. All authors contributed to analyzing the simulation and experimental results. All authors have read and agreed to the published version of the manuscript.
Funding
This research was funded by Ministry of Science and Technology (Republic of China) under grant MOST 107-2221-E-002-193-MY3.
Institutional Review Board Statement
Not applicable.
Informed Consent Statement
Not applicable.
Data Availability Statement
A part of Figure 3 presented in this study are openly available in ScienceDirect at DOI: 10.1016/j.compstruct.2021.113970, reference number [30].
Acknowledgments
The authors gratefully acknowledge the financial support of this research from the Ministry of Science and Technology (Republic of China) under grant MOST 107-2221-E-002-193-MY3.
Conflicts of Interest
The authors declare no conflict of interest.
References
- Williams, S.W.; Martina, F.; Addison, A.C.; Ding, J.; Pardal, G.; Colegrove, P. Wire+ arc additive manufacturing. Mater. Sci. Technol. 2016, 32, 641–647. [Google Scholar] [CrossRef] [Scilit]
- Wong, K.V.; Hernandez, A. A review of additive manufacturing. Int. Sch. Res. Not. 2012, 2012, 208760. [Google Scholar] [CrossRef] [Scilit]
- Frazier, W.E. Metal additive manufacturing: A review. J. Mater. Eng. Perform. 2014, 23, 1917–1928. [Google Scholar] [CrossRef] [Scilit]
- Gebhardt, A. Understanding Additive Manufacturing; Carl Hanser: Munich, Germany, 2012. [Google Scholar]
- Murr, L.E.; Gaytan, S.M.; Ramirez, D.A.; Martinez, E.; Hernandez, J.; Amato, K.N.; Shindo, P.W.; Medina, F.R.; Wicker, R.B. Metal fabrication by additive manufacturing using laser and electron beam melting technologies. Mater. Sci. Technol. 2012, 28, 1–14. [Google Scholar] [CrossRef] [Scilit]
- Balla, V.K.; Bose, S.; Bandyopadhyay, A. Processing of bulk alumina ceramics using laser engineered net shaping. Int. J. Appl. Ceram. Technol. 2008, 5, 234–242. [Google Scholar] [CrossRef] [Scilit]
- Vaupotič, B.; Brezočnik, M.; Balič, J. Use of PolyJet technology in manufacture of new product. J. Achiev. Mater. Manuf. Eng. 2006, 18, 319–322. [Google Scholar]
- Singh, R. Process capability study of polyjet printing for plastic components. J. Mech. Sci. 2011, 25, 1011–1015. [Google Scholar] [CrossRef] [Scilit]
- Salmoria, G.V.; Paggi, R.A.; Lago, A.; Beal, V.E. Microstructural and mechanical characterization of PA12/MWCNTs nanocomposite manufactured by selective laser sintering. Polym. Test. 2011, 30, 611–615. [Google Scholar] [CrossRef] [Scilit]
- Krznar, M.; Dolinsek, S. Selective Laser Sintering of Composite Materials Technologies; Annals of DAAAM for 2010 & Proceedings of the 21st International DAAAM Symposium; DAAAM International: Vienna, Austria, 2011; Volume 21, ISSN 1726-9679. [Google Scholar]
- Melchels, F.P.; Feijen, J.; Grijpma, D.W. A review on stereolithography and its applications in biomedical engineering. Biomaterials 2010, 31, 6121–6130. [Google Scholar] [CrossRef] [Scilit]
- Huang, J.; Qin, Q.; Wang, J. A review of stereolithography: Processes and systems. Processes 2020, 8, 1138. [Google Scholar] [CrossRef] [Scilit]
- Bellini, A.; Güçeri, S. Mechanical characterization of parts fabricated using fused deposition modeling. Rapid Prototyp. J. 2003, 9, 252–264. [Google Scholar] [CrossRef] [Scilit]
- Herzog, D.; Seyda, V.; Wycisk, E.; Emmelmann, C. Additive manufacturing of metals. Acta Mater. 2016, 117, 371–392. [Google Scholar] [CrossRef] [Scilit]
- Guo, N.; Leu, M.C. Additive manufacturing: Technology, applications and research needs. Front. Mech. Eng. 2013, 8, 215–243. [Google Scholar] [CrossRef] [Scilit]
- Melchels, F.P.; Domingos, M.A.; Klein, T.J.; Malda, J.; Bartolo, P.J.; Hutmacher, D.W. Additive manufacturing of tissues and organs. Prog. Polym. Sci. 2012, 37, 1079–1104. [Google Scholar] [CrossRef] [Scilit]
- Zarringhalam, H.; Majewski, C.; Hopkinson, N. Degree of particle melt in Nylon-12 selective laser-sintered parts. Rapid Prototyp. J. 2009, 15, 126–132. [Google Scholar] [CrossRef] [Scilit]
- Caulfield, B.; McHugh, P.E.; Lohfeld, S. Dependence of mechanical properties of polyamide components on build parameters in the SLS process. J. Mater. Process. Technol. 2007, 182, 477–488. [Google Scholar] [CrossRef] [Scilit]
- Rangarajan, S.; Qi, G.; Venkataraman, N.; Safari, A.; Danforth, S.C. Powder processing, rheology, and mechanical properties of feedstock for fused deposition of Si3N4 ceramics. J. Am. Ceram. Soc. 2000, 83, 1663–1669. [Google Scholar] [CrossRef] [Scilit]
- Agarwala, M.; Weeren, R.V.; Bandyopadhyay, A.; Whalen, P.; Safari, A.; Danforth, S. Fused deposition of ceramics and metals: An overview. In 1996 International Solid Freeform Fabrication Symposium; The University of Texas at Austin: Austin, TX, USA, 1996. [Google Scholar]
- Mohamed, O.A.; Masood, S.H.; Bhowmik, J.L. Optimization of fused deposition modeling process parameters: A review of current research and future prospects. Adv. Manuf. 2015, 3, 42–53. [Google Scholar] [CrossRef] [Scilit]
- Sood, A.K.; Ohdar, R.K.; Mahapatra, S.S. Parametric appraisal of mechanical property of fused deposition modelling processed parts. Mater. Des. 2010, 31, 287–295. [Google Scholar] [CrossRef] [Scilit]
- Chohan, J.S.; Singh, R.; Boparai, K.S.; Penna, R.; Fraternali, F. Dimensional accuracy analysis of coupled fused deposition modeling and vapour smoothing operations for biomedical applications. Compos. Pt. B-Eng. 2017, 117, 138–149. [Google Scholar] [CrossRef] [Scilit]
- Parandoush, P.; Lin, D. A review on additive manufacturing of polymer-fiber composites. Compos. Struct. 2017, 182, 36–53. [Google Scholar] [CrossRef] [Scilit]
- Wang, X.; Jiang, M.; Zhou, Z.; Gou, J.; Hui, D. 3D printing of polymer matrix composites: A review and prospective. Compos. Part B-Eng. 2017, 110, 442–458. [Google Scholar] [CrossRef] [Scilit]
- Li, L.; Sun, Q.; Bellehumeur, C.; Gu, P. Composite modeling and analysis for fabrication of FDM prototypes with locally controlled properties. J. Manuf. Process. 2002, 4, 129–141. [Google Scholar] [CrossRef] [Scilit]
- Ahn, S.H.; Montero, M.; Odell, D.; Roundy, S.; Wright, P.K. Anisotropic material properties of fused deposition modeling ABS. Rapid Prototyp. J. 2002, 8, 248–257. [Google Scholar] [CrossRef] [Scilit]
- Martínez, J.; Diéguez, J.; Ares, E.; Pereira, A.; Hernández, P.; Pérez, J. Comparative between FEM models for FDM parts and their approach to a real mechanical behaviour. Procedia Eng. 2013, 63, 878–884. [Google Scholar] [CrossRef] [Scilit]
- Domingo-Espin, M.; Puigoriol-Forcada, J.M.; Garcia-Granada, A.-A.; Llumà, J.; Borros, S.; Reyes, G. Mechanical property characterization and simulation of fused deposition modeling Polycarbonate parts. Mater. Des. 2015, 83, 670–677. [Google Scholar] [CrossRef] [Scilit]
- Yao, T.; Ouyang, H.; Dai, S.; Deng, Z.; Zhang, K. Effects of manufacturing micro-structure on vibration of FFF 3D printing plates: Material characterisation, numerical analysis and experimental study. Compos. Struct. 2021, 268, 113970. [Google Scholar] [CrossRef] [Scilit]
- Garzon-Hernandeza, S.; Garcia-Gonzaleza, D.; Jérusalemb, A.; Arias, A. Design of FDM 3D printed polymers: An experimental-modelling methodology for the prediction of mechanical properties. Mater. Des. 2020, 188, 108414. [Google Scholar] [CrossRef] [Scilit]
- Dou, H.; Cheng, Y.; Ye, W.; Zhang, D.; Li, J.; Miao, Z.; Rudykh, S. Effect of process parameters on tensile mechanical properties of 3D printing continuous carbon fiber-reinforced pla composites. Materials 2020, 13, 3850. [Google Scholar] [CrossRef] [Scilit]
- Christiyan, K.G.J.; Chandrasekharb, U.; Venkateswarluc, K. A study on the influence of process parameters on the mechanical properties of 3D printed ABS composite. 2016 IOP Conf. Ser. Mater. Sci. Eng. 2016, 114, 012109. [Google Scholar] [CrossRef] [Scilit]
- Ma, C.C.; Huang, Y.H.; Pan, S.-Y. Investigation of the transient behavior of a cantilever beam using PVDF sensors. Sensors 2012, 12, 2088–2117. [Google Scholar] [CrossRef] [Scilit] [PubMed]


Publisher’s Note: MDPI stays neutral with regard to jurisdictional claims in published maps and institutional affiliations. |
© 2022 by the authors. Licensee MDPI, Basel, Switzerland. This article is an open access article distributed under the terms and conditions of the Creative Commons Attribution (CC BY) license (https://creativecommons.org/licenses/by/4.0/).