Abstract
Smoke back-layering length is an important aspect of tunnel fire research, and the influence of metro train blockage cannot be ignored. In previous studies, less attention has been paid to the phenomenon of back-layering caused by the same train blocked in tunnels with different cross-sections. This paper investigates this point through dimensionless analysis and fire dynamic simulator (FDS) numerical simulation. Several full-scale model tunnels (300 m in length), with different tunnel cross-sections, were constructed in FDS. According to the FDS simulation result, the smoke back-layering length was compared and analyzed. To investigate the effect of the tunnel cross-sections on smoke back-layering length under metro train blocking, the headroom ratio ε was proposed. Then, the influence of the tunnel cross-section on the smoke back-layering length was discussed in detail. Based on the dimensional analysis and FDS simulation results, a new model for predicting the smoke back-layering length was proposed. The prediction model obtained in this paper was compared with the FDS simulation results and the prediction model proposed by our predecessors. It is proven that the proposed model can better predict the length of smoke back-layering when metro trains are blocked in tunnels with different cross-sections. The outcomes of this work are expected to provide theoretical guidance for fire smoke control in metro tunnels with different cross-sections.
1. Introduction
As part of city infrastructure, a rail transit system play a pivotal role in transportation [1]. The development of the metro has greatly facilitated the travel of people, but it has also brought many safety problems. Due to the large flow of people and the metro tunnel’s special elongated building structure, tunnel fires are attracting widespread research attention as a serious threat to the safety of metro tunnels [2]. In the event of a tunnel fire, the longitudinal ventilation system is often used to create a smoke-free and safe environment upstream for evacuation and firefighting. If the ventilation rate is low, the smoke generated during a fire can propagate upstream against the direction of the ventilation air; the opposite direction of flow is called “back-layering” [3]. The length of the back layer is defined as the length of the reverse smoke flow upstream of the fire [4].
In previous studies, less attention has been paid to the phenomenon of back layering caused by the same train blocked in tunnels with different sections. Since soil conditions vary from soft clay to hard rock, tunnel construction methods are different [5]. Thus, even within the same metro line, the tunnel cross-section is not always the same, but the same type of metro train has the same cross-sectional shape, which will lead to different blocking ratios. Most of the previous studies on the effect of metro trains on the smoke back-layering length only considered one blocking ratio. When studying the influence of different blocking ratios on the flow of smoke, the focus is mainly aimed at the situation of road tunnel fires, when different vehicles are blocked. Compared with the blockage of cars in road tunnels, metro trains have a larger cross-sectional area and longer length, and the metro trains have a greater impact on the flow of fire smoke. Therefore, this article aims to study the influence of the same metro train on the control of tunnel fire smoke under different tunnel cross-sections, in order to provide theoretical guidance for the control of metro tunnel fire smoke.
In this work, the effect of the metro train on the smoke back-layering in metro tunnel fires with different cross-sections was investigated. Following the dimensional analysis and FDS simulation results, the length of smoke back-layering was analyzed and compared with previous studies. To further investigate the influence of metro trains on smoke back-layering length in metro tunnel fires with different tunnel cross-sections, the headroom ratio , defined as the ratio of the metro train blocking the upper space height to the tunnel height was proposed. Then, the influence of the metro train on the smoke back-layering was discussed in detail, and a new prediction model based on the simulation results was developed. Further, Figure 1 shows the research framework of the paper.
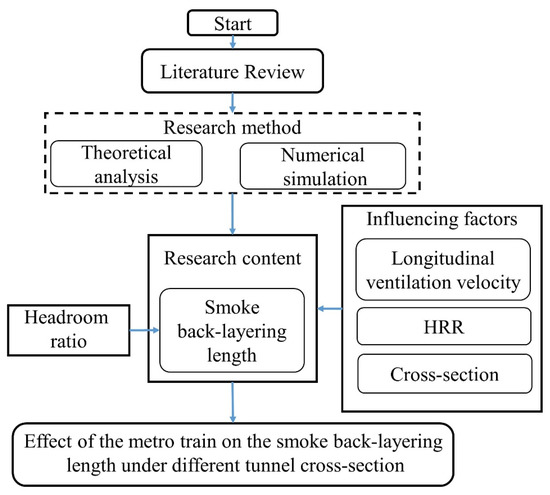
Figure 1.
The research framework.
2. Literature Review
The back layer of smoke is an important aspect of fire research in longitudinal ventilation tunnels. It has been extensively studied by researchers [4,6,7,8].
Thomas [6] proposed an equation to predict the back-layering length based on theoretical analysis and the results of small-scale experiments.
Based on the theoretical analysis, Hu et al. [7] proposed the back-layering length model by conducting full-scale experiments and FDS simulations results.
Li et al. [4] and Weng et al. [8] proposed prediction models for back-layering length based on dimensionless analysis. The model proposed by Li et al. [3] is expressed as
The model proposed by Weng et al. [8], considering the sectional coefficient (), is expressed as,
Following these studies, many researchers have studied the effects of several other factors on the back-layering length, and proposed a series of new prediction models, such as tunnel slope [9], cross section [10], turning radius [11], ceiling extraction [12,13,14], branched tunnel [15], and ambient pressure [16,17,18].
In recent years, benefiting from the evolutions of artificial intelligence (AI) and big data, data-driven methods, especially artificial neural networks (ANNs) [19], have been increasingly applied in fire safety research. Wu et al. [20] applied the framework of artificial intelligence (AI) and big data to predict fire sources in a numerical model of tunnels. Hong et al. [21] proposed a method to automatically control fire-induced smoke by coupling a full-field CFD model and a PID algorithm. The ventilation system is controlled by the PID algorithm to automatically adjust the ventilation speed, so that the smoke back-layering is controlled within a certain range.
Additionally, many scholars [22,23,24,25,26,27,28] have studied the influence of blockage on the smoke back-layering length. Haddad et al. [29] reviews recent research advances relating to critical velocity and the back-layering length of tunnel fires, mainly analyzing the experimental and theoretical studies on the effects of blockage, inclination, and fire source location. Chaabat et al. [30] studied the effect of solid barriers and blockages on the length of smoke back-layering and critical velocity for a fire in a longitudinally ventilated tunnel. Tang et al. [22] investigated the effect of (upstream) blockage-fire distance on the smoke back-layering length using experiments in a model tunnel, and a model for predicting the reverse layer was proposed, taking into account the distance coefficient between the fire and the obstacle. Zhang et al. [24,25] considered the effect of metro trains on smoke back-layering. They found that the influence of metro trains on fires in tunnels cannot be neglected, and they proposed a new smoke back layer prediction model based on theoretical analysis through small scale experiments and numerical simulation results, respectively. The model proposed by the experiments is represented as [25],
where ,.
The model proposed by numerical simulation is expressed as [18],
where ,.
3. Dimensionless Analysis
3.1. Without Metro Train Blockage in Tunnel
Previous research [4,5,8] showed that the governing parameters for smoke back-layering length are the heat release rate, longitudinal ventilation velocity, tunnel geometry, air density, ambient temperature, the thermal capacity of the air, and gravitational acceleration. Wu and Bakar [3] demonstrated with experiments that for tunnels with the same height, the critical ventilation velocity varies depending on the tunnel width, and the tunnel height cannot fully reflect the influence of tunnel geometry on the smoke flow. Given the tunnel cross-section geometry, the hydraulic diameter of the tunnel was used as the characteristic length. For the sake of simplicity, a horizontal tunnel was assumed. Therefore, the smoke back-layering length can be expressed as [4]:
Based on dimensional analysis, this function can be expressed as:
The first and second terms on the right side of Equation (8) can also be incorporated. A dimensionless longitudinal ventilation velocity was defined as:
Then, the above equation can be transformed into:
where .
According to previous studies [4,5,8], when there is no blockage in the tunnel, the dimensionless smoke back-layering length can be expressed as:
3.2. With Metro Train Blockage in Tunnel
If the obstruction of the vehicle is generally long, for example when the metro train is stopped in the tunnel, the effect of the length of the obstruction will increase. By then, the enhanced heat convection loss from smoke to ventilated air turns out to be detectably high, and it can never be ignored [25]. The longitudinal ventilation that passes through the train blockage will be accelerated due to the decrease in the tunnel cross-section area. Assuming the ventilation flow and smoke flow as incompressible flows, the velocity in the blockage area will become times the longitudinal ventilation velocity [25,26,31]. The ventilation flow field upstream of the fire source of the metro tunnel will be divided into two regions [24,25], namely: (A) an upstream area with low ventilation velocity, and (B) a train blockage area with high ventilation velocity, as shown in Figure 2a.
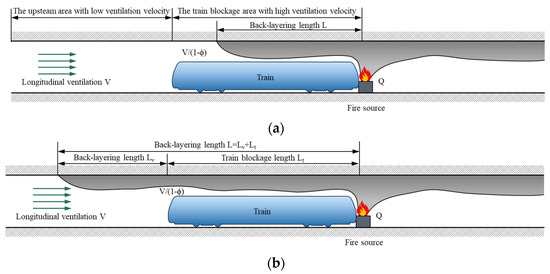
Figure 2.
The smoke back-layering in the tunnel with metro train blockage: (a) smoke is restricted to the length of the metro train; (b) smoke spreads beyond the length of the metro train.
At different longitudinal ventilation velocities, the smoke back-layering length will be different for the same heat release rate. When the longitudinal ventilation velocity is lower than the critical ventilation velocity, smoke back-layering will occur, which can be divided into two cases due to the influence of the long metro train [24,25]: (1) smoke is restricted to the length of the metro train; (2) smoke spread exceeds the length of the metro train, as shown in Figure 2.
3.2.1. Smoke Is Restricted to the Length of the Metro Train
In this case, as shown in Figure 2a, previous studies [4,24,25] have shown that this blockage effect can be represented by the blockage ratio . Thus, the dimensionless smoke back-layering length can be described as follows:
As the longitudinal ventilation velocity decreases, the smoke back-layering length increases. When the longitudinal ventilation velocity drops to a certain value , the smoke back-layering length is exactly equal to the length of the metro train, namely:
3.2.2. Smoke Spread Exceeds the Length of the Metro Train
Once the longitudinal ventilation velocity is lower than , smoke gas from the back-layer will break through the blockage zone and may be stopped in the upstream region with a low velocity, as shown in Figure 2b. Due to the difference in local ventilation velocities in regions (A) and (B), the dimensionless back-layer length cannot be described as in the previous equations. The whole region of back-layering can be divided into two parts. The first is the train blockage area, with high ventilation velocity; the second is the upstream area, with low ventilation velocity. As shown in Figure 3, the total smoke back-layering length is , while the smoke back-layering length () of the upstream area with low ventilation velocity can be described using a model with a virtual fire source (), similar to the case without blockage [24,25]. The dimensionless smoke back-layering length, , can be expressed as,
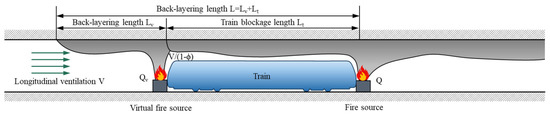
Figure 3.
The smoke back-layering in the tunnel with a virtual fire source.
Assume,
For the virtual fire source , is the critical ventilation velocity in the upstream area without the metro train blocking. Based on the previous research by Weng et al. [8], the critical ventilation velocity prediction model for non-blocking metro tunnels with different cross-section is as follows:
Thus, the following formula can be obtained,
Equation (16) can be converted to,
where .
By combining Equations (14), (18) and (19), it is obtained:
4. Numerical Simulation
The NIST fire dynamic simulator (FDS) is used in this study to perform the physical model configuration [32]. FDS is a computational fluid dynamics (CFD) model of fire-driven fluid flow. It is often used to study tunnel fires [33,34,35,36,37,38,39]. FDS numerically solves the form of the Navier–Stokes equations suitable for low-speed (Ma < 0.3), thermally-driven, with an emphasis on smoke and heat transport from fires [32]. The turbulence models used in FDS are based on the large eddy simulation (LES) model and the direct numerical simulation model (DNS). The LES model was adopted as the turbulence model in all the simulation cases.
4.1. FDS Model
In FDS, several full-scale metro tunnels (300 m in length), with different cross-sections, were built. These different cross-sections are derived from the study of Liu and Weng [5,8,40], which are common cross-section forms used in practical engineering, as shown in Figure 4. The model of a steel metro train (60 m in length, 3.8 m in height, and 2.8 in width) is located 200 m away from the longitudinal ventilation portal. A series of thermocouples was installed at 0.1 m below the central ceiling axis, and the distance between the two thermocouples along the centerline of the ceiling was 0.5 m.
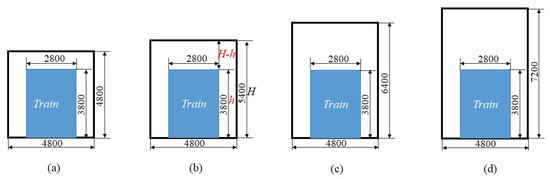
Figure 4.
Cross-sections of model tunnels (unit: mm): (a) Tunnel A; (b) Tunnel B; (c) Tunnel C; (d) Tunnel D.
4.2. Fire Source
The fire source was placed at the centerline of the tunnel floor and 200 m away from the portal. Fire source dimensions were 2 m (length) × 2 m (width) × 1 m (height). According to the study of the heat release rate in the metro tunnel fire, previous studies [5,8] have shown that the maximum heat release rate (HRR) of the metro tunnel fire was 5 MW. A safety factor of 1.5 was adopted. In this paper, we set HRR as 5 MW and 7.5 MW. Considering the most unfavorable conditions, all simulations considered quasi-steady state conditions with fixed HRR [41]. Several typical HRR curves, which are under 0.6 m/s wind speed in Tunnel A, are presented in Figure 5.
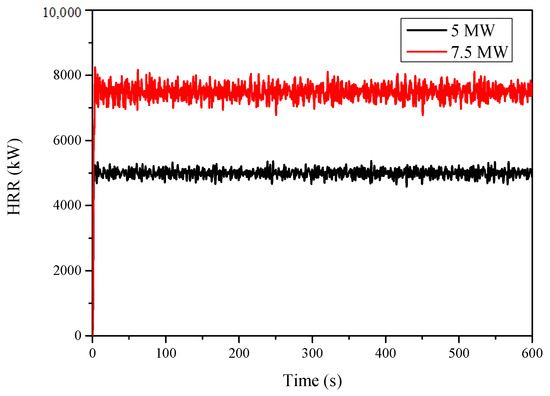
Figure 5.
Typical HRR curves for the simulation cases under 0.6 m/s wind speed in Tunnel A.
4.3. Boundary Condition
Each tunnel had entrances and exits. We set the tunnel exit to “OPEN” and the tunnel entrance to “SUPPLY” to provide different longitudinal ventilation inside the tunnel. Table 1 shows the longitudinal ventilation velocity for all simulation cases. The upper surface of the fire was set as “BURNER”. Heptane was used as the fuel. The surface material of the tunnel, including walls, ceilings, and floors, was designated as “CONCRETE.” The initial ambient temperature was set at 20 °C, the pressure was set at an atmospheric pressure of 101.325 kPa, and the smoke concentration was zero. The simulation time was 600 s.

Table 1.
A Summary of scenarios in numerical investigations.
4.4. A Sensitivity Study on the Mesh System
In the FDS simulation, the grid size is one of the important parameters, and the appropriate grid size should be chosen to ensure the reliability of the simulation. The ratio of the characteristic fire diameter to grid size , recommended in the range of 4–16, is widely used to evaluate the grid resolution. is expressed as:
For the smallest fire size of 5 MW in this paper, the characteristic fire diameter is 1.82 m, and the recommended grid size range is about 0.11–0.46 m. For comparison, three grid sizes are chosen, from 0.15 m to 0.3 m. Figure 6 shows the vertical distribution of the average temperature and velocity obtained in the steady-state period, located at 40 m downstream from the fire source in Tunnel A, with a ventilation velocity of 0.6 m/s. As the grid size decreases, the temperature and velocity curves tend to be uniform. It can be considered that when the mesh size is less than 0.2 m, there is no significant improvement, but the calculation time is increased. Thus, 0.2 m is chosen as the grid size in this paper.
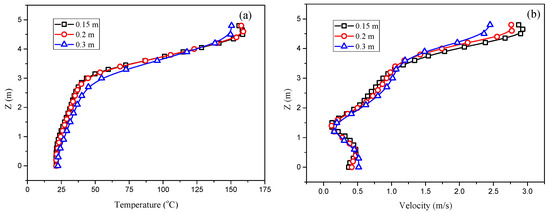
Figure 6.
The vertical distribution of temperature and velocity is located 40 m downstream from the fire source; (a) temperature distribution; (b) velocity distribution.
4.5. Validation
In the case of a tunnel fire problem, validation of FDS capabilities should be carried out to evaluate the smoke back-layering length with a metro train blockage. In Zhang’s [25] study, the length of the smoke back-layering using the metro train blockage effect was verified. Zhang conducted a series of 1:4 small-scale experiments in a model tunnel with a dimension of 72 m × 1.5 m × 1.3 m. The tunnel ceiling and floor are made of fireproof boards, while the sidewalls are made of reinforced glass. Three different lengths (6 m, 12 m, and 18 m) of the metro train model are made of steel, with a cross-sectional geometry of 1 m × 1 m. The square gas burner, which uses propane gas as fuel, with dimensions of 0.30 m × 0.30 m × 0.35 m (length × width × height), is located in the middle of the model tunnel, and the distance from the left end is 50 m. The gas temperature below the tunnel ceiling was measured by K-type thermocouples with a diameter of 0.5 mm, which are set at a distance of 3 cm beneath the ceiling at intervals of 0.5 m. Experiments with an HRR of 120 kW were selected for validation. We simulated the same experiments in FDS. Figure 7 shows the comparison of obtained smoke back-layering lengths from the FDS simulations with Zhang’s [25] experimental results. It can be seen that the FDS simulation results are in good harmony with the experimental results. Therefore, FDS is reliable for the prediction of smoke back-layering length with metro train blockage in tunnel fire simulations.
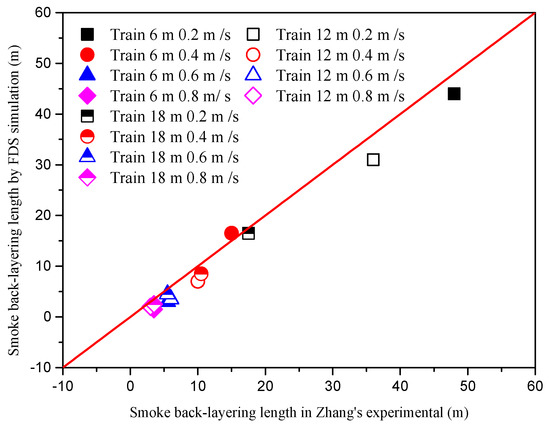
Figure 7.
Comparison of back-layering lengths obtained from the FDS with Zhang’s [25] experimental results.
5. Results and Discussions
5.1. Smoke Back-Layering Length at Different Cross-Sections
5.1.1. Simulation Results of Smoke Back-Layering Length
Figure 8 shows the typical smoke temperature distribution beneath the ceiling in Tunnel C with a ventilation velocity of 1.1 m/s. The smoke back-layering length is determined by the first point upstream of the fire source, indicating the ambient temperature value according to the temperature distribution of the smoke under the ceiling. In Figure 6, the total smoke back-layering length exceeds the train length and can be divided into two parts, one of which is the length of the train (Lt) and the other is the part that exceeds the length of the train (Lv). The total smoke back-layering length for all simulation cases is shown in Figure 9. It can be seen that at the same HRR and ventilation velocity, the smoke back-layering length increases as the blocking rate increases. For example, when the HRR is 7.5 MW and the ventilation velocity is 1.1 m/s, the smoke back-layering length increases from 35.5 m (shorter than the metro train length) for Tunnel A, with , to 105 m (longer than the metro train length) for Tunnel D, with . In each case, the smoke back-layering length decreases as the longitudinal ventilation velocity increases, and each curve has an inflection point at the blockage length of the metro train, which divides the curve of smoke back-layering length into two parts: (1) smoke is restricted to the length of the metro train; (2) smoke spread exceeds the length of the metro train.
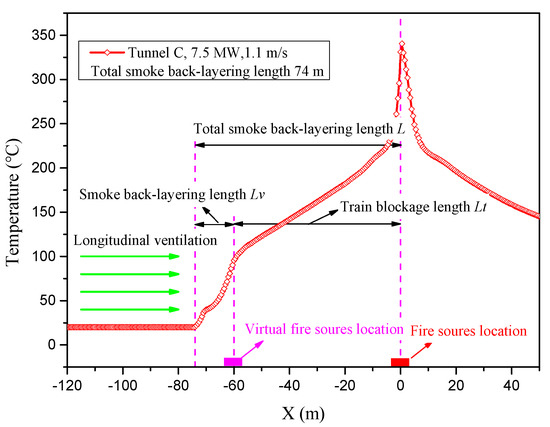
Figure 8.
The temperature distribution underneath the ceiling in Tunnel C.
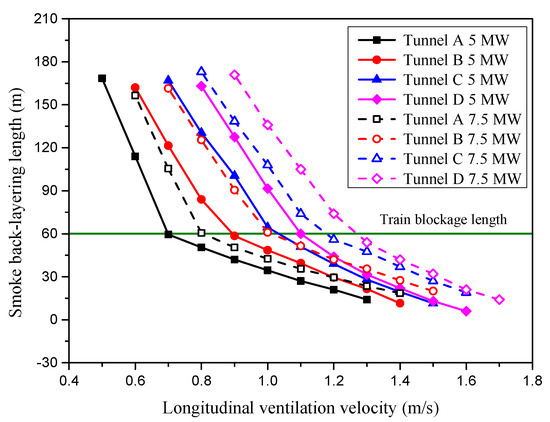
Figure 9.
All the simulation results of the total smoke back-layering length.
5.1.2. Smoke Is Restricted to the Length of the Metro Train
When the smoke is restricted to the length of the metro train, based on the previous studies [4,24,25] and also mentioned in Section 3.2.1, the metro train blockage effect can be represented by the blockage ratio , and the dimensionless smoke back-layering length has a relation to the dimensionless variable of . Therefore, the results obtained by the different cross-sections of the tunnels were sorted in this way and presented in Figure 10. In the tunnel of each different cross-sectional shape, the relationship between and can be well described by straight lines with different slopes. However, the relationship cannot be well described by one formula when only the block ratio is considered in the tunnels with different cross-sectional shapes.
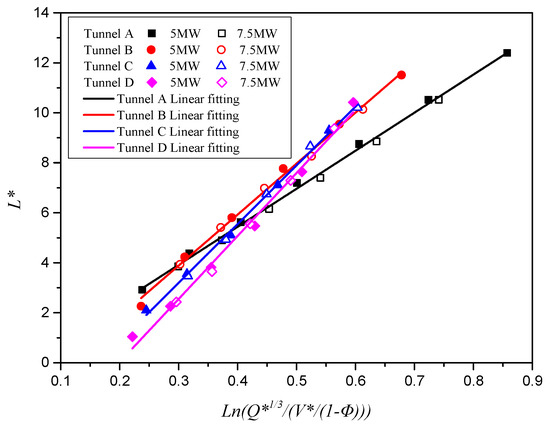
Figure 10.
Relationship between dimensionless back-layering length and .
To investigate the influence of the cross-section on the smoke back-layering length, the headroom ratio is defined as the ratio of the metro train blocking the upper space height to the tunnel height (as shown in Figure 4b), and it is expressed as:
Figure 11 presents the relationship between the dimensionless back-layering length and the variable of in tunnels with different cross-section shapes, respectively. Table 2 summarizes the details for these correlations shown in Figure 11; the headroom ratio ε is also listed. All these relationships can be expressed by one equation:
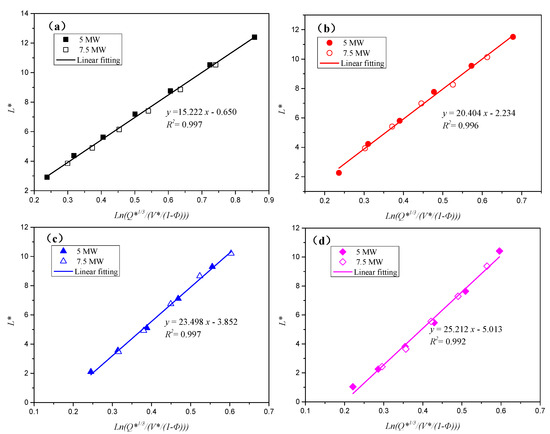
Figure 11.
Relationship between dimensionless back-layering length and with different cross-sections: (a) Tunnel A, (b) Tunnel B, (c) Tunnel C, (d) Tunnel D.
Table 2.
Fitting results of back-layering length with different cross-sections.
Based on the above Equation (24), when the dimensionless longitudinal ventilation velocity is as follows, the smoke back-layering length is exactly equal to the length of the metro train .
For those fitting lines shown in Figure 11, the slopes and intercepts are correlated with the headroom ratio , respectively, as shown in Figure 12. The correlations can be expressed by:
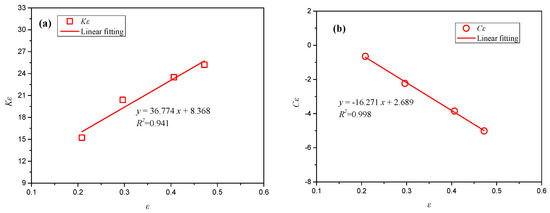
Figure 12.
The correlations of slope and intercept with the headroom ratio . (a), (b).
For the slope :
For the intercept :
Substitute Equations (26) and (27) into Equation (24), and the prediction model for smoke back-layering length can be described as follows:
Similarly, Equation (25) can be transformed into:
5.1.3. Smoke Spread Exceeds the Length of the Metro Train
Once the longitudinal ventilation velocity is slower than , the back-layer smoke gas will break through the blockage area and the total smoke back-layering length can be divided into two parts (as shown in Figure 3). The dimensionless smoke back-layering length can be calculated using the following formula.
Table 3 lists the result of dimensionless smoke back-layering length in the simulation cases. Based on the theoretical analysis of Section 3.2.2, by combining Equations (18), (19), and (29), it is obtained:
Table 3.
The dimensionless heat release rate and the dimensionless smoke back-layering length .
The dimensionless heat release rate , calculated according to Equation (32), is listed in Table 3. Figure 13 shows the plot of the dimensionless smoke back-layering length against the dimensionless variable of . All the data can be correlated into a linear equation with a correlation coefficient of 0.99.
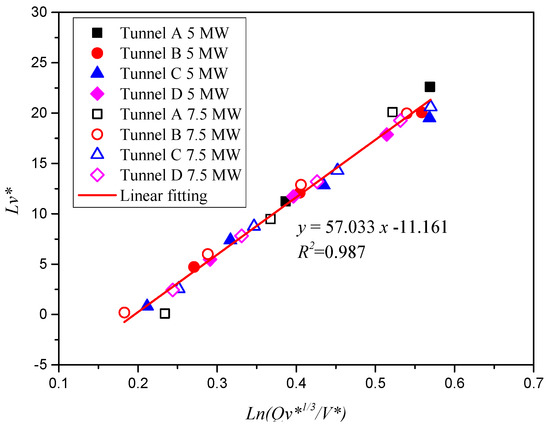
Figure 13.
Relationship between dimensionless back-layering length and .
Based on the above analysis, the prediction model of the fire smoke back-layering length under different cross-sections of tunnels with metro train blockage can be obtained, as follows:
where ,,,
5.2. Model Validation and Comparison
Since the length of the smoke back-layering is shorter than the length of the metro train, the dimensionless smoke back-layering length, represented by Equation (35), was compared with those reported by Zhang et al. [24,25] in Figure 14. The simulation is also shown in Figure 14. It can be seen from Figure 14 that Zhang’s model cannot predict the results of the simulation well because it does not take into account the influence of different cross-sections of the tunnel, while the simulation results of FDS agree well with the prediction model using Equation (35). The influence of the metro train on the smoke back-layering length is according during different tunnel sections, and the influence of the section shape cannot be ignored. In this case, the effect of different sections can be well defined by the headroom ratio.
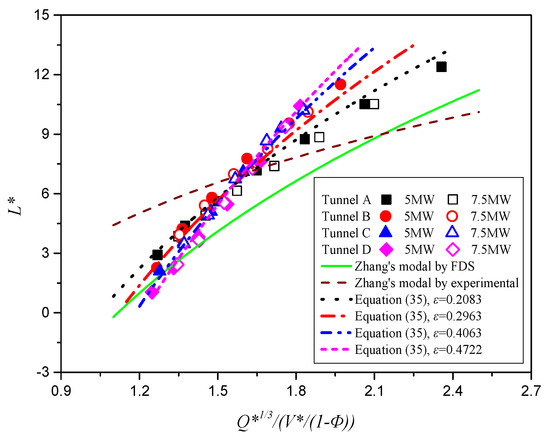
Figure 14.
Comparison of dimensionless back-layering length between results from FDS simulation and previous model: smoke back-layering is shorter than the metro train length.
When the smoke back-layering length is longer than the metro train length, the total smoke back-layering length can be divided into two parts. The dimensionless smoke back-layering length in the upstream tunnel, without train blockage, was selected for comparison. Figure 15 shows the comparison between the calculation results of the numerical simulation and the prediction model proposed in this paper. The results of experiments and simulations by Zhang et al. [24,25], as well as the prediction model proposed by Li et al. [4] and Weng et al. [5], are also plotted on the graph. From the figure, it can be seen that the simulation results of this paper and the simulation results of Zhang et al. [24] agree well with the prediction model proposed in this paper. The experimental results of Zhang et al. [25] are slightly smaller than those from the prediction model. This may be due to the sidewall of the small-sized model tunnel of Zhang et al., made of reinforced glass, which leads to more heat loss and makes the smoke back-layering length shorter. The prediction model proposed by Li et al. [4] and Weng et al. [5] is quite different from the model proposed in this paper and its subsequent simulation results. This is mainly because their model is a prediction model for the smoke back-layering length without train blocking. Although the simulation results here are for the smoke back-layering length in the upstream section without train blockage, they are still affected by train blockage. It also illustrates the necessity of the new prediction model proposed in this paper.
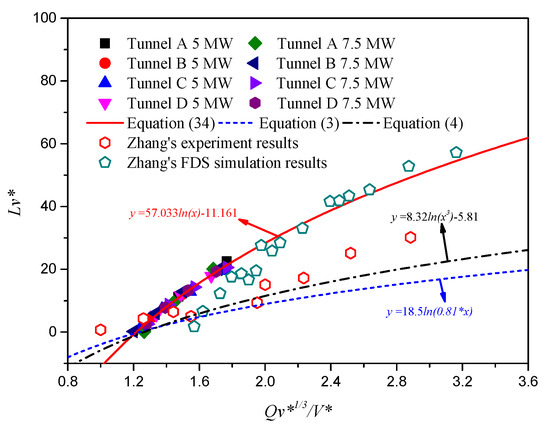
Figure 15.
Comparison of dimensionless back-layering length between results from FDS simulation and those from the previous study: smoke back-layering if longer than the metro train length.
6. Conclusions
This paper investigates the effect of the metro train on the smoke back-layering length in tunnel fires with different tunnel cross-sections. A series of large eddy simulations are performed correspondingly using the fire dynamic simulator. Based on the result of the FDS simulation and dimensionless analysis, we compared the smoke back-layering length of the metro train located in different cross-sections of the tunnels. The following can be concluded:
- (1)
- The impact of metro trains on the length of smoke back-layering is significant at all different tunnel cross-sections. The blockage ratio alone cannot well characterize the blockage effect of metro trains on the smoke back-layering length in tunnels with different cross-sections.
- (2)
- Based on the blockage ratio, the headroom ratio ε was proposed to more accurately characterize the effect of metro trains on the length of the smoke back-layering in tunnels with different cross-sections.
- (3)
- A new prediction model was proposed to take into account the effect of metro trains stopped in a tunnel with different tunnel cross-sections to predict the length of back-layering in metro tunnels. The superiority of the proposed model for predicting the length of smoke back-layering from metro trains in tunnels with different cross-sections was demonstrated by comparing it with previous prediction models and experimental results.
Author Contributions
Funding acquisition, M.W. (Miaocheng Weng); investigation, M.W. (Meng Wang), H.L. and L.S.; methodology, M.W. (Meng Wang) and H.L.; project administration, M.W. (Meng Wang); resources, M.W. (Meng Wang); software, H.L., F.W. and L.S.; supervision, M.W. (Miaocheng Weng); writing—original draft, H.L.; writing—review and editing, F.W. and M.W. (Miaocheng Weng). All authors have read and agreed to the published version of the manuscript.
Funding
This research was supported by the National Natural Science Foundation of China (Grant No. 52178064), the Chongqing Science and Technology Commission (Grant No. cstc2021jcyj-msxmX0677, cstc2019jscx-msxmX0243), and the Chongqing Construction Science and Technology Planning Project (Grant No. 2019-1-5-5).
Institutional Review Board Statement
Not applicable.
Informed Consent Statement
Not applicable.
Data Availability Statement
Data are contained within this article.
Acknowledgments
The authors thank the reviewers for their great help with the article during the review process.
Conflicts of Interest
The authors declare that they have no known competing financial interest or personal relationships that could have appeared to influence the work reported in this paper.
Nomenclature
| Smoke back-layering length (m) | |
| Tunnel height (m) | |
| Tunnel cross-sectional area (m2) | |
| Heat release rate (kW) | |
| Ambient air density (kg/m3) | |
| Thermal capacity of air (kJ/(kg K)) | |
| Smoke temperature (K) | |
| Ambient temperature (K) | |
| Acceleration of gravity (m/s2) | |
| Longitudinal ventilation velocity (m/s) | |
| Coefficient in Equation (2) | |
| Dimensionless heat release rate | |
| and | Coefficient in Equation (2) |
| Froude number | |
| Dimensionless back-layering length | |
| Dimensionless ventilation velocity | |
| Hydraulic diameter of the tunnel (m) | |
| Metro train length (m) | |
| Dimensionless metro train length | |
| Blockage ratio | |
| Dimensionless heat release rate of the virtual fire source at the rear of the metro train in Equation (5) | |
| Dimensionless critical heat release rate of the fire source in Equation (5) | |
| Dimensionless heat release rate of the equivalent fire source at the front of the train in Equation (6) | |
| Critical value of ventilation velocity in Equation (13) | |
| Dimensionless critical value of ventilation velocity in Equation (14) | |
| Smoke back-layering length in the upstream region of the tunnel without blockage | |
| Heat release rate of the virtual fire source at the rear of the metro train (kW) | |
| Dimensionless smoke back-layering length in the upstream region of the tunnel without blockage | |
| Dimensionless heat release rate of the virtual fire source at the rear of the metro train | |
| Dimensionless critical ventilation velocity | |
| Coefficient in Equation (16) | |
| Characteristic fire diameter (m) | |
| Headroom ratio | |
| Coefficient in Equation (24) | |
| Coefficient in Equation (24) |
References
- El-khateeb, L.; Mohammed Abdelkader, E.; Al-Sakkaf, A.; Zayed, T. A hybrid multi-criteria decision making model for defect-based condition assessment of railway infrastructure. Sustainability 2021, 13, 7186. [Google Scholar] [CrossRef]
- Meng, N.; Liu, B.; Li, X.; Jin, X.; Huang, Y.; Wang, Q. Effect of blockage-induced near wake flow on fire properties in a longitudinally ventilated tunnel. Int. J. Therm. Sci. 2018, 134, 1–12. [Google Scholar] [CrossRef]
- Wu, Y.; Bakar, M.Z.A. Control of smoke flow in tunnel fires using longitudinal ventilation systems—A study of the critical velocity. Fire Saf. J. 2000, 35, 363–390. [Google Scholar] [CrossRef]
- Li, Y.Z.; Lei, B.; Ingason, H. Study of critical velocity and backlayering length in longitudinally ventilated tunnel fires. Fire Saf. J. 2010, 45, 361–370. [Google Scholar] [CrossRef]
- Weng, M.-C.; Lu, X.-l.; Liu, F.; Du, C.-X. Study on the critical velocity in a sloping tunnel fire under longitudinal ventilation. Appl. Therm. Eng. 2016, 94, 422–434. [Google Scholar] [CrossRef]
- Thomas, P.H. The movement of buoyant fluid against a stream and the venting of underground fires. Fire Saf. Sci. 1958, 351, 1–7. [Google Scholar]
- Hu, L.H.; Huo, R.; Chow, W.K. Studies on buoyancy-driven back-layering flow in tunnel fires. Exp. Therm. Fluid Sci. 2008, 32, 1468–1483. [Google Scholar] [CrossRef]
- Weng, M.-C.; Lu, X.-l.; Liu, F.; Shi, X.-P.; Yu, L.-X. Prediction of backlayering length and critical velocity in metro tunnel fires. Tunn. Undergr. Space Technol. 2015, 47, 64–72. [Google Scholar] [CrossRef]
- Zhu, K.; Shi, L.; Yao, Y.; Zhang, S.; Cheng, X. Smoke movement in a sloping subway tunnel under longitudinal ventilation with blockage. Fire Technol. 2017, 53, 1985–2006. [Google Scholar] [CrossRef]
- Zhao, S.; Liu, F.; Wang, F.; Weng, M.; Zeng, Z. A numerical study on smoke movement in a metro tunnel with a non-axisymmetric cross-section. Tunn. Undergr. Space Technol. 2018, 73, 187–202. [Google Scholar] [CrossRef]
- Zhang, S.G.; Yang, H.; Yao, Y.Z.; Zhu, K.; Zhou, Y.; Cheng, X.D.; Shi, L. Numerical investigation of back-layering length and critical velocity in curved subway tunnels with different turning radius. Fire Technol. 2017, 53, 1765–1793. [Google Scholar] [CrossRef]
- Chen, L.F.; Hu, L.H.; Tang, W.; Yi, L. Studies on buoyancy driven two-directional smoke flow layering length with combination of point extraction and longitudinal ventilation in tunnel fires. Fire Saf. J. 2013, 59, 94–101. [Google Scholar] [CrossRef]
- Chen, L.F.; Hu, L.H.; Zhang, X.L.; Zhang, X.Z.; Zhang, X.C.; Yang, L.Z. Thermal buoyant smoke back-layering flow length in a longitudinal ventilated tunnel with ceiling extraction at difference distance from heat source. Appl. Therm. Eng. 2015, 78, 129–135. [Google Scholar] [CrossRef]
- Wang, J.; Yuan, J.; Fang, Z.; Tang, Z.; Qian, P.; Ye, J. A model for predicting smoke back-layering length in tunnel fires with the combination of longitudinal ventilation and point extraction ventilation in the roof. Tunn. Undergr. Space Technol. 2018, 80, 16–25. [Google Scholar] [CrossRef] [Green Version]
- Huang, Y.; Li, Y.; Li, J.; Wu, K.; Li, H.; Zhu, K.; Li, J. Experimental investigation of the thermal back-layering length in a branched tunnel fire under longitudinal ventilation. Int. J. Therm. Sci. 2022, 173, 107415. [Google Scholar] [CrossRef]
- Wu, F.; Zhou, R.; Shen, G.; Jiang, J.; Li, K. Effects of ambient pressure on smoke back-layering in subway tunnel fires. Tunn. Undergr. Space Technol. 2018, 79, 134–142. [Google Scholar] [CrossRef]
- Guo, F.; Gao, Z.; Wan, H.; Ji, J.; Yu, L.; Ding, L. Influence of ambient pressure on critical ventilation velocity and backlayering distance of thermal driven smoke in tunnels with longitudinal ventilation. Int. J. Therm. Sci. 2019, 145, 105989. [Google Scholar] [CrossRef]
- Zhang, S.; Wang, J.; He, K.; Yao, Y.; Peng, M. Study on the smoke back-layering and critical ventilation in the road tunnel fire at high altitude. Fire Mater. 2019, 43, 422–429. [Google Scholar] [CrossRef]
- El-Zahab, S.; Al-Sakkaf, A.; Mohammed Abdelkader, E.; Zayed, T. A machine learning-based model for real-time leak pinpointing in buildings using accelerometers. J. Vib. Control 2022. [Google Scholar] [CrossRef]
- Wu, X.; Park, Y.; Li, A.; Huang, X.; Xiao, F.; Usmani, A. Smart detection of fire source in tunnel based on the numerical database and artificial intelligence. Fire Technol. 2020, 57, 657–682. [Google Scholar] [CrossRef]
- Hong, Y.; Kang, J.; Fu, C. Tunnel fire smoke control based on the pid method: A numerical study. Tunn. Undergr. Space Technol. 2022, 124, 104450. [Google Scholar] [CrossRef]
- Tang, W.; Hu, L.H.; Chen, L.F. Effect of blockage-fire distance on buoyancy driven back-layering length and critical velocity in a tunnel: An experimental investigation and global correlations. Appl. Therm. Eng. 2013, 60, 7–14. [Google Scholar] [CrossRef]
- Gannouni, S.; Maad, R.B. Numerical study of the effect of blockage on critical velocity and backlayering length in longitudinally ventilated tunnel fires. Tunn. Undergr. Space Technol. 2015, 48, 147–155. [Google Scholar] [CrossRef]
- Zhang, S.; Yao, Y.; Zhu, K.; Li, K.; Zhang, R.; Lu, S.; Cheng, X. Prediction of smoke back-layering length under different longitudinal ventilations in the subway tunnel with metro train. Tunn. Undergr. Space Technol. 2016, 53, 13–21. [Google Scholar] [CrossRef]
- Zhang, S.; Cheng, X.; Yao, Y.; Zhu, K.; Li, K.; Lu, S.; Zhang, R.; Zhang, H. An experimental investigation on blockage effect of metro train on the smoke back-layering in subway tunnel fires. Appl. Therm. Eng. 2016, 99, 214–223. [Google Scholar] [CrossRef]
- Meng, N.; Liu, X.; Li, X.; Liu, B. Effect of blockage ratio on backlayering length of thermal smoke flow in a longitudinally ventilated tunnel. Appl. Therm. Eng. 2018, 132, 1–7. [Google Scholar] [CrossRef]
- Wang, Y.; Wu, F.; Wu, P. Effects of passenger blockage on smoke flow properties in longitudinally ventilated tunnel fires. Fire Mater. 2019, 44, 283–295. [Google Scholar] [CrossRef]
- Wang, F.; Weng, M.; Han, J.; Obadi, I.; Liu, F. Effect of metro train on the critical driving force for preventing smoke back-layering in tunnel fires. Fire Mater. 2021. [Google Scholar] [CrossRef]
- Haddad, R.K.; Maluk, C.; Reda, E.; Harun, Z. Critical velocity and backlayering conditions in rail tunnel fires: State-of-the-art review. J. Combust. 2019, 2019, 3510245. [Google Scholar] [CrossRef] [Green Version]
- Chaabat, F.; Creyssels, M.; Mos, A.; Wingrave, J.; Correia, H.; Marro, M.; Salizzoni, P. The effects of solid barriers and blocks on the propagation of smoke within longitudinally ventilated tunnels. Build. Environ. 2019, 160, 106207. [Google Scholar] [CrossRef]
- Lee, Y.-P.; Tsai, K.-C. Effect of vehicular blockage on critical ventilation velocity and tunnel fire behavior in longitudinally ventilated tunnels. Fire Saf. J. 2012, 53, 35–42. [Google Scholar] [CrossRef]
- McGrattan, K.; Hostikka, S.; McDermott, R.; Floyd, J.; Weinschenk, C.; Overholt, K. Fire Dynamics Simulator User’s Guide; NIST Special Publication: Gaithersburg, MD, USA, 2016. [Google Scholar]
- Zhao, S.; Li, Y.Z.; Kumm, M.; Ingason, H.; Liu, F. Re-direction of smoke flow in inclined tunnel fires. Tunn. Undergr. Space Technol. 2019, 86, 113–127. [Google Scholar] [CrossRef]
- Han, J.; Liu, F.; Wang, F.; Weng, M.; Wang, J. Study on the smoke movement and downstream temperature distribution in a sloping tunnel with one closed portal. Int. J. Therm. Sci. 2020, 149, 106165. [Google Scholar] [CrossRef]
- Tan, T.; Yu, L.; Ding, L.; Gao, Z.; Ji, J. Numerical investigation on the effect of ambient pressure on mechanical smoke extraction efficiency in tunnel fires. Fire Saf. J. 2020, 120, 103136. [Google Scholar] [CrossRef]
- Yao, Y.; Li, Y.Z.; Ingason, H.; Cheng, X. Numerical study on overall smoke control using naturally ventilated shafts during fires in a road tunnel. Int. J. Therm. Sci. 2019, 140, 491–504. [Google Scholar] [CrossRef]
- Liu, C.; Zhong, M.; Tian, X.; Zhang, P.; Xiao, Y.; Mei, Q. Experimental and numerical study on fire-induced smoke temperature in connected area of metro tunnel under natural ventilation. Int. J. Therm. Sci. 2019, 138, 84–97. [Google Scholar] [CrossRef]
- Yan, G.; Wang, M.; Yu, L.; Tian, Y.; Guo, X. Study of smoke movement characteristics in tunnel fires in high-altitude areas. Fire Mater. 2020, 44, 65–75. [Google Scholar] [CrossRef]
- Zhang, S.; Shi, L.; Li, X.; Huang, Y.; He, K.; Wang, J. Critical ventilation velocity under the blockage of different metro train in a long metro tunnel. Fire Mater. 2020, 44, 497–505. [Google Scholar] [CrossRef]
- Liu, F.; Yu, L.X.; Weng, M.C.; Lu, X.L. Study on longitudinal temperature distribution of fire-induced ceiling flow in tunnels with different sectional coefficients. Tunn. Undergr. Space Technol. 2016, 54, 49–60. [Google Scholar] [CrossRef]
- Wang, F.; Liu, F.; Obadi, I.; Weng, M. Study on the smoke propagation characteristics of metro tunnel fire under the effects of piston wind. Indoor Built Environ. 2021. [Google Scholar] [CrossRef]
Publisher’s Note: MDPI stays neutral with regard to jurisdictional claims in published maps and institutional affiliations. |
© 2022 by the authors. Licensee MDPI, Basel, Switzerland. This article is an open access article distributed under the terms and conditions of the Creative Commons Attribution (CC BY) license (https://creativecommons.org/licenses/by/4.0/).