Abstract
The prevalence of chronic kidney disease (CKD) is estimated to be 13.4% worldwide and 15% in the United States. CKD has been recognized as a leading public health problem worldwide. Unfortunately, as many as 90% of CKD patients do not know that they already have CKD. Ultrasonography is usually the first and the most commonly used imaging diagnostic tool for patients at risk of CKD. To provide a consistent assessment of the stage classifications of CKD, this study proposes an auxiliary diagnosis system based on deep learning approaches for renal ultrasound images. The system uses the ACWGAN-GP model and MobileNetV2 pre-training model. The images generated by the ACWGAN-GP generation model and the original images are simultaneously input into the pre-training model MobileNetV2 for training. This classification system achieved an accuracy of 81.9% in the four stages of CKD classification. If the prediction results allowed a higher stage tolerance, the accuracy could be improved by up to 90.1%. The proposed deep learning method solves the problem of imbalance and insufficient data samples during training processes for an automatic classification system and also improves the prediction accuracy of CKD stage diagnosis.
1. Introduction
According to an estimate by the U.S. Centers for Disease Control and Prevention (CDC) in 2021, 37 million adults in the United States suffer from chronic kidney disease (CKD) [1]. In addition to blood and urine tests, ultrasound is the most commonly used imaging diagnostic tool by nephrologists for the early detection of chronic kidney disease. Ultrasonography is a suitable approach for diagnosing kidney disease because the renal cortex and medulla tissues possess different densities and hence the difference between the tissues can be easily observed [2]. Though magnetic resonance angiography (MRA) and computed tomography angiography (CTA) can display clearer vascular images with higher resolution than ultrasonography, and advanced machines can even provide 3D images directly. However, compared with MRA and CTA medical imaging, ultrasonography has the advantages of non-ionizing radiation, is non-invasive, safe, portable, inexpensive, and can be easily operated by medical staff [3,4]. Therefore, ultrasonography has become the most commonly used and indispensable imaging tool in nephrology.
With the increasing popularity of inexpensive portable ultrasound scanners coupled with professional training guidelines for renal ultrasonography, nephrologists can operate ultrasound imaging equipment and easily interpret the diagnosed results [5]. Ultrasonography can currently assist nephrologists in the diagnosis of all aspects of nephrology, including acute and chronic renal failure, renal blood vessels, kidney stones, tumors, infections, renal trauma, and guiding percutaneous biopsy, etc. [6]. This non-invasive diagnosis approach is a low-cost and safe investigation suitable for outpatient visits and can be used as the first-line investigation for the preliminary diagnosis of kidney diseases [4]. However, the presence of speckle noise in ultrasound images degrades the image quality. Interpretation of renal sonograms is highly dependent on the experience of nephrologists in correctly diagnosing a patient’s condition. While making a CKD diagnosis, different nephrologists may have different interpretations of CKD stages from an identical ultrasound image or even the same nephrologist may have inconsistent interpretation at different times [7].
Ultrasonography is an important investigation for patients with chronic kidney disease. Nephrologists can evaluate kidney function based on measuring length, volume, cortical thickness, and cortical echogenicity of the kidney through a sonogram, and make a final decision on whether to proceed with a kidney biopsy or not [5,6]. Multiple studies have found that kidney length and partial renal cortical echogenicity are significantly correlated with overall sclerosis, focal tubular atrophy, and the number of glomeruli [8,9]. According to a study by Päivänsalo et al., 67% of patients with renal parenchymal diseases can be diagnosed with corresponding abnormalities using ultrasonography [10]. According to a research report by Manley et al., the highest echo intensity of renal cortical echogenicity is 62% higher than that of a normal kidney, which is several times larger than the margin of error of ultrasonic instruments [11]. Cheong et al. measured the length and volume of the kidneys using magnetic resonance imaging (MRI). The length of male and female kidneys was 12.4 ± 0.9 cm and 11.6 ± 1.1 cm, respectively, while the volume of male and female kidneys was 202 ± 36 mL, and 154 ± 33 mL, respectively [12]. The study by Mazzotta et al. showed that with the progression of renal failure, the length and volume of renal parenchyma were significantly reduced in patients with CKD from stage 1 to stage 3. For patients at stages 4 to 5, the volume of the kidney parenchyma was significantly reduced [13]. According to Mustafiz et al. and Beland et al., the correlation coefficients of kidney length and Estimated Glomerular Filtration Rate (eGFR) were only 0.34 and 0.36, respectively [14,15]. However, Lucisano et al. found that using the patient’s height to adjust the renal parenchymal thickness and kidney length, the correlation coefficients against eGFR could be improved to 0.537 and 0.510, respectively. The product of adjusted renal parenchymal thickness and length showed the highest correlation of 0.560 with the eGFR [16].
These sonographic parameters are highly correlated with eGFR, and ultrasonography can be applied as an investigation method to diagnose CKD and its stage progression. Yaprak et al. developed a CKD scoring system that integrated three ultrasound parameters, kidney length, parenchymal thickness, and echo intensity, and a correlation coefficient of 0.587 was obtained [17]. Chen et al. developed a CKD scoring system that applied machine learning technologies to extract features, including 11 parameters such as visceral length, parenchymal thickness, and echogenicity, and the accuracy of CKD stage predictions reached 70.05% [7]. Kuo et al. developed a CNN-based deep learning CKD scoring system based on a model architecture that included 33 residual blocks and three fully connected layers for continuous eGFR prediction. The model achieved a correlation of 0.741 and a mean absolute error (MAE) of 17.605 on the testing dataset. The gradient-boosting tree model for classifying eGFR with a threshold of 60 mL/min/1.73 m2 could achieve an accuracy of 85.6% and an area under the curve (AUC) of 0.904 [18].
At present, most accurate image classification systems usually apply CNN deep learning algorithms, which surpass human experts in a variety of image classification applications. The data for these successful studies were balanced and sufficient. Unfortunately, it is comparatively difficult to obtain sufficient and balanced datasets in real medical image classification applications. Researchers usually face the problem of insufficient and imbalanced datasets for medical image classification. At present, medical imaging-related research must first obtain the IRB agreement and informed consent from patients in advance to perform the research, and the cost of acquiring and storing medical images is not low, which is the main reason why the number of medical images is insufficient.
Therefore, this research aims to solve the data imbalance problem and to generate sufficient kidney ultrasound images through the generative adversarial network (GAN) [19] and use the generated additional images to solve the problem of data imbalance. GAN captures features from the original dataset and generates new samples that share the same distribution as the original samples. Since the first publication of GAN, various derivative GAN models have been proposed and widely used in many fields. Related studies were introduced in the next section.
In this study, we proposed an auxiliary diagnosis system based on deep learning for renal ultrasound images for CKD stage classification. The training data used a collection of 798 kidney ultrasound images from 205 patients with CKD. The deep learning model applied ACWGAN-GP [20,21] and transfer learning [22] to assist doctors in categorizing CKD subjects at different stages based on the obtained ultrasound images. As long as the GAN model learns the potential probability distribution of the collected samples from the training dataset, it can provide a large amount of newly generated training data to improve the prediction accuracy of the classifier. This system provides an effective, objective, and consistent method for CKD stage classification and provides medical staff with a reference basis for practical clinical diagnosis.
2. Related Works
For a training dataset containing a small number of samples and unbalanced condition, it can be solved by label-preserving transformations [23]. Common data augmentation approaches include rotating, shifting, zooming, and flipping images within the original dataset to increase the number of synthesized samples for training procedures [24]. These methods not only improve the accuracy of deep learning methods but also improve generalization abilities. Usually, image classification tasks applied the traditional data augmentation method to improve the performance of a trained model. In addition, adopting synthetic data examples created by a GAN can achieve more variability and further improve training effectiveness for deep learning classification. Since GAN was first published in 2014, various derivative GAN models have been proposed and widely used in various fields. Radford et al. proposed a deep convolution GAN (DCGAN) for image synthesis in 2015 [25]. In order to solve the problem of mode collapse and vanishing or exploding gradients in GAN, Arjovsky et al. proposed Wasserstein GAN (WGAN) and used Wasserstein distance instead of Jensen-Shannon (JS) divergence to solve instability problems in GAN training [26]. Odena et al. proposed an auxiliary classifier GAN (ACGAN) model to generate high-resolution images with labels based on a set of random vectors and labels [27]. Gulagani et al. proposed an improved Wasserstein GAN (WGAN-GP) which applied a gradient penalty to limit the maximum norm of a gradient to 1, and which can ensure the discriminator as a Lipschitz function [28]. Li et al. proposed an auxiliary classifier Wasserstein GAN (ACWGAN-GP) with gradient penalty, and which can be applied to imbalanced datasets to generate new samples for classes with fewer samples [21].
Recently, much medical imaging research has begun applying GAN models. Frid-Adar et al. trained a GAN model to synthesis medical images to improve the performance of CNN in liver lesion classification [29]. Farias et al. proposed that the GAN-CIRCLE framework generates images with better texture and sharper edges around the lesion [30]. Nie et al. proposed a GAN with a 3D FCN structure to solve the tasks of generating CT from MRI and generating 7 Tesla (7T) MRI from 3 Tesla (3T) MRI images [31]. Armanious et al. proposed MedGAN for medical image translation without any application-specific modifications [32]. Bowles et al. used a GAN augmentation method to introduce GAN synthesized data into the training set in two brain segmentation tasks, thereby increasing the Dice Similarity Coefficient (DSC) by 1 to 5 percentage points [33]. Rubin et al. proposed TOP-GAN, which combined transfer learning and GAN to classify cancer cells without staining. After the initial training of TOP-GAN, the last layer of the discriminator is replaced with three new untrained fully connected layers to transfer it into a new classifier network [34]. All these papers utilized GAN models to increase the amount of training datasets and improve the classification performance in medical-related applications.
3. Dataset
Keelung Chang Gung Memorial Hospital in Taiwan collected a kidney ultrasound image dataset, which contained a total of 798 kidney ultrasound images from 205 patients. All subjects agreed to the ultrasound image collection, and the study was approved by the Institutional Review Board of Chang Gung Memorial Hospital (IRB No. CGMH-99-0029B). The acquired dataset was de-identified to protect the patient’s privacy. Subjects with diabetes, acute renal failure, polycystic kidney disease, and hydronephrosis were excluded from this study, and the subjects were aged between 18 and 75 years. The ultrasound kidney images were obtained using a Toshiba PowerVision 7000 SSA-380A ultrasound scanner, equipped with 3.5 MHz and 5.0 MHz linear array or convex scanning probes, and the images were acquired under the same environmental settings. Among the 798 kidney ultrasound images, five images were obtained from the left kidney, right kidney, and different directions of the same patient at the same time. In addition to these five images, only the images of the left or right kidney of the patients were taken. After removing the marks, borders, length, and width information, and other additional marks in the images annotated by the doctors, the dataset contains 607 different images in total.
All subjects underwent blood tests and renal ultrasound examinations simultaneously, and a collective diagnosis by two experienced nephrologists for CKD stage classification of each subject was performed based on both eGFR index and renal ultrasound images. The eGFR threshold settings were defined as 15, 30, 60, and 90 mL/min/1.73 m2 for five different CKD stages. According to the settings, from the first to the fifth CKD stage, the remaining ultrasound images contained 231, 134, 91, 108, and 43 images, respectively [35]. However, the number of images in the fifth stage was relatively small; we combined the fourth and fifth stages into the fourth stage and represented it as a serious condition stage. Several examples of kidney images are shown in Figure 1. From the left to right columns, the images were diagnosed from the first to the fourth categories.
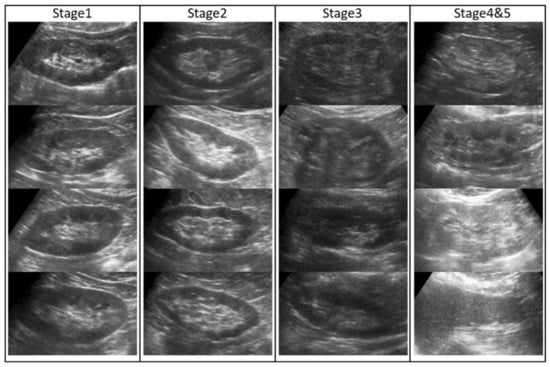
Figure 1.
Kidney ultrasound image data collection. The images of different CKD stages are displayed from left to right columns.
4. Methodology
This study applied TensorFlow tools to design all deep learning models. To expand the training data and improve the classification of CKD stages, in addition to the traditional methods of augmented images, such as rotation, mirroring, shifting, etc., this study proposed a novel method that combined ACWGAN-GP and transfer learning.
4.1. ACWGAN-GP
ACWGAN-GP is a variant of the GAN [19] proposed by Goodfellow et al. in 2014. It is a combination of ACGAN [27] and WGAN-GP [28], and explores the advantages of both approaches simultaneously. The structure is illustrated in Figure 2. It can generate images with labels and use the Wasserstein loss function and gradient penalty to train the GAN models. The potential distribution can be learned from a small set of CKD images and generates new images for training purposes. The critical loss function of ACWGAN-GP is represented by a combination of Equations (1)–(3) and shown in Equation (4), and the generator loss function of ACWGAN-GP is shown in Equation (5).
where is the real data distribution, is the generator model distribution that is implicitly defined by , . Random samples sampling uniformly along straight lines between pairs of points sampled from the Pr and Pg. Each real sample and generated sample have a corresponding class label . Penalty coefficients were set as , ,.
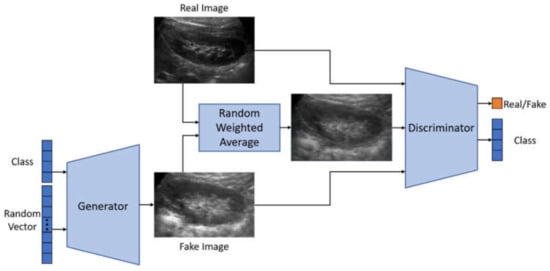
Figure 2.
ACWGAN-GP architecture.
4.1.1. Discriminator Architecture
Owing to the small number of medical images collected, only a few convolutional layers were applied for constructing a discriminator model to avoid overfitting problems. Grayscale images with an image size of 80 × 128 pixels within an intensity range of [−1, 1] [−1, 1] were required. The classifier consists of four convolutional layers, and its stride of the sliding windows was set as 2, and the leaky ReLU was used as an activation function. The model has approximately 1.6 million parameters in total. To reduce the occurrence of overfitting, a dropout layer with a probability of 0.2 is added after each convolutional layer. Finally, a flattened layer is used to laminate and then output to two fully connected layers. One of the fully connected layers outputs the probability that the image is true, and the other fully connected layer applies the softmax function to output the corresponding probabilities of the four CKD stages.
4.1.2. Generator Architecture
The images with annotated CKD stage information and a 100-dimensional random vector were input to the generator model, and the size of the output image was assigned to 80 × 128 pixels. First, the CKD images in different stages were constructed as 100-dimensional vectors after the embedding layer. Second, it was combined with the previous random vector through the fusion layer to form another 100-dimensional vector. Third, we input a fully connected layer of 20,480 nodes and reshape the 20,480 nodes into 5 × 8 × 512 pixels. Finally, upsampling was performed through four deconvolution layers, and a batch normalization layer was added after each deconvolution layer. After each pass through the deconvolution layer, an image with a larger resolution was created. Finally, after four deconvolution layers, a new image of 80 × 128 pixels was obtained.
4.1.3. ACWGAN-GP Hyperparameter
Before entering the image into the ACWGAN-GP model, subtraction of 127.5 and division by 127.5 would be performed to normalize image intensity within a range of [−1, 1]. To split the original dataset with 607 images into 9:1 for training and validation, we set 61 images in each batch and applied the Adam optimizer with a learning rate of 0.0002.
4.2. Transfer Learning
The ACWGAN-GP-generated images and real images were simultaneously input into the pre-trained model as training data. The model architecture is illustrated in Figure 3. The pre-trained model applied MobileNetV2 [36] and ResNet50 [37] models that have been trained on ImageNet with an accuracy of more than 90%. MobileNetV2 is a convolutional neural network suitable for mobile devices published by Sandler et al. It is an inverted residual structure with a linear bottleneck layer. Its residual connection was not used for expansion layers but connected between linear bottleneck layers. The intermediate expansion layer applied depth-wise separable convolutions to disassemble the general convolution into two steps including depth-wise convolution that only performed convolution and pointwise convolution that increased channel size.
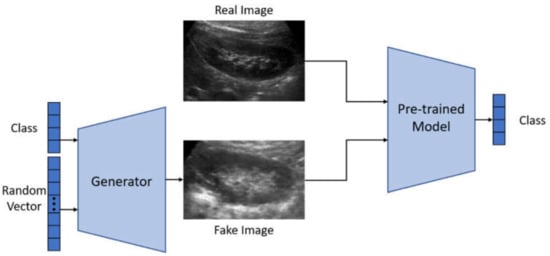
Figure 3.
Transfer learning architecture.
In addition, the ResNet won the 2015 ImageNet Large Scale Visual Recognition Challenge and 2016 CVPR best paper. Simply increasing the number of layers in the network, the accuracy could be saturated and degraded immediately. He et al. proposed the residual block method, which could achieve the effect of identity mapping when a shallower network was already optimal, and a deeper network could achieve the effect of identity mapping. The weights were fine-tuned by synthesized images and real images, and a lower learning rate was applied in this experiment. A transfer learning model from the ImageNet classification task to the CKD stage classification model was finally developed in this study.
The pre-trained model was achieved using an RMSProp Optimizer, the learning rate was set to 0.00002, and the attenuation was set to 0.9. Before the image data were input into the pre-trained model, subtraction of 127.5 for each image pixel and division by 127.5 were performed for intensity normalization within the range of [−1, 1]. To split the original dataset with 607 images into 9:1 for training and validation, we set 61 images in each batch.
The comparison of six different approaches including 4-layer CNN, ResNet50, MobileNetV2, ACWGAN-GP, ACWGAN-GP + ResNet50, and ACWGAN-GP + MobileNetV2, were performed as follows. The 4-layer CNN model was trained on the original dataset. ResNet50 and MobileNetV2 pre-trained models were fine-tuned using the original dataset. ACWGAN-GP is a generative adversarial network that performs generation and classification simultaneously. ACWGAN-GP + ResNet50, ACWGAN-GP + MobileNetV2 fine-tuned the pre-trained model with the original and synthetic image datasets.
5. Results and Discussion
To verify the transfer learning with the ACWGAN-GP method described in Section 4, we applied several different classification methods to automatically classify the four-stage CKD ultrasound images to obtain the prediction accuracy of each method. The eGFR threshold settings for the four CKD stages were defined as 15, 30, 60 mL/min/1.73 m2. The classification was evaluated in two ways. The first method is based on evaluating whether the predicted stage is the same as the annotated stage by two professional doctors, while the second method refers to a more flexible verification approach in which the predicted CKD stage could be allowed for one higher-level tolerance. For example, when a subject is diagnosed in the second stage, if the prediction system returns either the second or third stage, both predictions would be considered as acceptable predictions. Essentially, it would be helpful for both patients and doctors to carefully evaluate and re-examine the true condition of patients. In other words, it might be beneficial for early processes regarding precision prevention and treatment.
TensorFlow was applied to perform training procedures for all the designed models. Six different training modules including 4-layer CNN, ResNet50, MobileNetV2, ACWGAN-GP, ACWGAN-GP + ResNet50, and ACWGAN-GP + MobileNetV2, were performed. The first 4-layer CNN was trained from scratch using the original dataset, ResNet50 and MobileNetV2 pre-trained models fine-tuned with the original dataset; ACWGAN-GP is a generative adversarial network that constructs generators and classifiers simultaneously; ACWGAN-GP + ResNet50, ACWGAN-GP + MobileNetV2 adopted pre-trained models and applied the original images and generated images (Figure 4) for fine-tuning. The prediction results and a comparison of each prediction model are presented in Table 1.
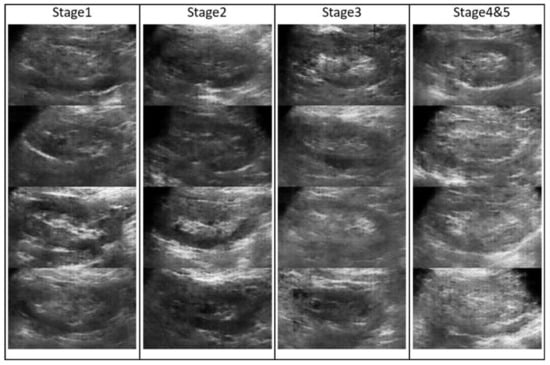
Figure 4.
Fake images generated by ACWGAN-GP.

Table 1.
Comparison of the prediction accuracy rates of six different prediction models used in the stage classification of chronic kidney disease.
It can be noticed that after the ACWGAN-GP training, the generated images and real images were sent to a pre-trained model MobileNetV2. The proposed ACWGAN-GP + MobileNetV2 model reached an average specificity of 93.6%, average sensitivity of 80.3%, average positive predictive value (precision) of 81.8%, average F1-score of 81.0%, and an accuracy of 81.9%. While allowing a higher stage tolerance prediction of CKD stages, the prediction accuracy can be increased to 90.1%. In other words, if a subject was diagnosed in the first stage condition, it was allowed to be predicted as the first or the second stage; a subject annotated as the second stage is allowed to be predicted as the second or the third stage; a subject annotated as the third stage is allowed to be predicted as the third or the fourth stage. All these higher stage tolerances are counted as correct predictions. The main reason for allowing such a higher stage tolerance prediction is that a severe condition prediction can effectively remind patients and doctors that they should notice the warning message as early as possible, and provide early diagnosis and treatment for precise prevention.
As shown in the confusion matrix in Table 2, we observed that the MobileNet model showed a relatively good accuracy rate in the first CKD stage, which was mainly due to a greater number of samples in the first stage than in other stages. The results of this classification model showed that more than 50% of the misclassified samples only hold a one-stage difference, which confirms the effectiveness of the kidney ultrasound images generated from the proposed GAN model for CKD stage classification.
Table 2.
Performance of prediction results by using fake images generated by ACWGAN-GP.
Kidney ultrasound imaging has always been a convenient and fast diagnostic tool in nephrology. At present, the clinical diagnosis of CKD stages highly depends on the experience of nephrologists. Most nephrologists evaluate the renal function and CKD stages based on the thickness of the kidney parenchyma and the intensity of renal echo. However, different nephrologists might provide different diagnoses of CKD stages from an identical ultrasound image, and even the same nephrologist might give inconsistent diagnoses of CKD stages at different times. To provide a consistent assessment of CKD stages, this study proposed a prediction model based on a deep learning algorithm to predict a patient’s CKD stage. The proposed method is an objective, rapid, and non-invasive CKD staging assessment.
To improve the prediction accuracy of neural network classification, this study established an effective method to classify CKD patients in different stages based on kidney ultrasound images. The proposed method not only applies the CNN network but also provides data augmentation, generative adversarial networks, transfer learning, and other technologies to obtain superior prediction performance. Data augmentation and GAN technologies generated more kidney ultrasound images to increase the number of training samples. The transfer learning technology retained the low-level features learned from the ImageNet dataset. The MobileNet learned from the original training samples and the generated training samples through fine-tuning and constructed a highly accurate CKD ultrasound image prediction model. The non-invasive kidney ultrasound examination can further provide accurate and stable predictions for CKD stages, assisting doctors to quickly diagnose and activate the prognostic treatment or an early warning mechanism for CKD patients. Although the CKD stage prediction by the proposed model cannot be used as a clinical diagnosis alone, this model can provide decision-making support for facilitating doctors’ diagnosis or precise treatment for patients at various stages of CKD. It can even discover whether a subject is a potential CKD patient at an early stage so that nephrologists can quickly provide appropriate personal treatment and precision healthcare for patients.
In this study, the ROIs of all kidney ultrasound images for training were cropped. Therefore, kidney segmentation from an ultrasound image must be manually cropped before entering it into the training system. Although nephrologists are supposed to mark down kidney locations from severely degraded ultrasound images, this still requires an extra step of manual segmentation for the prediction system. We have demonstrated that kidney ultrasound images could provide a high degree of accuracy for CKD stage classification, and we hope that the precise location of the kidneys within an ultrasound image could be automatically allocated through R-CNN, SSD, YOLO, and other object detection methods. Automatic kidney object recognition can provide and facilitate nephrologists with a simplified approach for consistent and accurate CKD stage classification.
6. Conclusions
We proposed a CKD stage classification system based on integrating the ACWGAN-GP model and MobileNetV2 pre-training model. The additional training images generated by the ACWGAN-GP generation model incorporated with the original images were simultaneously pre-trained by MobileNetV2. This classification system achieved an accuracy of 81.9% for the four stages of CKD classification, and an accuracy of 90.1% for a higher stage tolerance prediction. Source codes of the proposed method can be downloaded in the Supplementary Materials. Our proposed deep learning method could solve the problem of imbalance and insufficient data samples during training processes for an automatic classification system. The proposed GAN model for increasing synthesized samples in data augmentation procedures demonstrated a significant improvement in CKD stage classification, especially for kidney ultrasound images with very poor image quality. Our proposed methods can be applied to different medical imaging applications, especially under imbalanced dataset conditions.
Supplementary Materials
The following supporting information can be downloaded at: https://www.mdpi.com/article/10.3390/app12010352/s1, Programming codes: Codes.zip.
Author Contributions
Conceptualization, C.-P.C. and T.-W.P.; methodology, Y.-T.L.; software, Y.-T.L.; validation, C.-H.L. and K.-S.C.; formal analysis, Y.-T.L.; investigation, T.-W.P.; resources, C.-H.L. and K.-S.C.; data curation, C.-H.L. and K.-S.C.; writing—original draft preparation, Y.-T.L.; writing—review and editing, C.-P.C. and T.-W.P.; visualization, Y.-T.L.; supervision, C.-P.C. and T.-W.P.; project administration, T.-W.P.; funding acquisition, C.-H.L. and T.-W.P. All authors have read and agreed to the published version of the manuscript.
Funding
This research was funded by National Taipei University of Technology and Mackay Memorial Hospital Joint Research Program, NTUT-MMH-108-02.
Institutional Review Board Statement
The study was conducted according to the guidelines of the Declaration of Helsinki, and approved by the Institutional Review Board of Chang Gung Memorial Hospital (IRB No.: CGMH-99-0029B).
Informed Consent Statement
Informed consent was obtained from all subjects involved in the study.
Data Availability Statement
Not applicable.
Conflicts of Interest
The authors declare no conflict of interest.
References
- Centers for Disease Control and Prevention. Chronic Kidney Disease in the United States, 2021; US Department of Health and Human Services, Centers for Disease Control and Prevention: Atlanta, GA, USA, 2021.
- O’Neill, W.C. Sonographic evaluation of renal failure. Am. J. Kidney Dis. 2000, 35, 1021–1038. [Google Scholar] [CrossRef]
- Liu, S.; Wang, Y.; Yang, X.; Lei, B.; Liu, L.; Li, S.X. Deep Learning in Medical Ultrasound Analysis: A Review. Engineering 2019, 5, 261–275. [Google Scholar] [CrossRef]
- Spyridopoulos, T.; Kaziani, K.; Balanika, A.; Kalokairinou-Motogna, M.; Bizimi, V.; Paianidi, I.; Baltas, C. Ultrasound as a first line screening tool for the detection of Renal Artery Stenosis: A comprehensive review. Med. Ultrason. 2010, 12, 228–232. [Google Scholar] [PubMed]
- O’Neill, W.C. Renal Relevant Radiology: Use of Ultrasound in Kidney Disease and Nephrology Procedures. Clin. J. Am. Soc. Nephrol. 2014, 9, 373–381. [Google Scholar] [CrossRef]
- O’Neill, W.C. Atlas of Renal Ultrasonography; Saunders: Philadelphia, PA, USA, 2001. [Google Scholar]
- Chen, C.J.; Pai, T.W.; Hsu, H.H.; Lee, C.H.; Chen, K.S.; Chen, Y.C. Prediction of chronic kidney disease stages by renal ultrasound imaging. Enterp. Inf. Syst. 2020, 14, 178–195. [Google Scholar] [CrossRef]
- Ahmed, S.; Bughio, S.; Hassan, M.; Lal, S.; Ali, M. Role of ultrasound in the diagnosis of chronic kidney disease and its correlation with serum creatinine level. Cureus 2019, 11, e4241. [Google Scholar] [CrossRef] [Green Version]
- Hricak, H.; Cruz, C.; Romanski, R.; Uniewski, M.H.; Levin, N.W.; Madrazo, B.L.; Sandler, M.A.; Eyler, W.R. Renal parenchymal disease: Sonographic-histologic correlation. Radiology 1982, 144, 141–147. [Google Scholar] [CrossRef]
- Päivänsalo, M.; Huttunen, K.; Suramo, I. Ultrasonographic Findings in Renal Parenchymal Diseases. Scand. J. Urol. Nephrol. 1985, 19, 119–123. [Google Scholar] [CrossRef] [PubMed]
- Manley, J.A.; O’Neill, W. How echogenic is echogenic? Quantitative acoustics of the renal cortex. Am. J. Kidney Dis. 2001, 37, 706–711. [Google Scholar] [CrossRef]
- Cheong, B.; Muthupillai, R.; Rubin, M.F.; Flamm, S.D. Normal Values for Renal Length and Volume as Measured by Magnetic Resonance Imaging. Clin. J. Am. Soc. Nephrol. 2007, 2, 38–45. [Google Scholar] [CrossRef] [PubMed]
- Mazzotta, L.; Sarteschi, L.M.; Carlini, A.; Antonelli, A. Comparison of renal ultrasonographic and functional biometry in healthy patients and in patients with chronic renal failure. Arch. Ital. Urol. Androl. Organo Uff. Soc. Ital. Ecogr. Urol. Nefrol. 2002, 74, 206–209. [Google Scholar]
- Mustafiz, M.; Rahman, M.; Islam, M.; Mohiuddin, A. Correlation of ultrasonographically determined renal cortical thickness and renal length with estimated glomerular filtration rate in chronic kidney disease patients. Bangladesh Med. Res. Counc. Bull. 2013, 39, 91–92. [Google Scholar] [CrossRef]
- Beland, M.D.; Walle, N.L.; Machan, J.T.; Cronan, J.J. Renal Cortical Thickness Measured at Ultrasound: Is It Better Than Renal Length as an Indicator of Renal Function in Chronic Kidney Disease? Am. J. Roentgenol. 2010, 195, W146–W149. [Google Scholar] [CrossRef]
- Lucisano, G.; Comi, N.; Pelagi, E.; Cianfrone, P.; Fuiano, L.; Fuiano, G. Can Renal Sonography Be a Reliable Diagnostic Tool in the Assessment of Chronic Kidney Disease? J. Ultrasound Med. 2015, 34, 299–306. [Google Scholar] [CrossRef] [PubMed]
- Yaprak, M.; Çakır, Ö.; Turan, M.N.; Dayanan, R.; Akın, S.; Değirmen, E.; Yıldırım, M.; Turgut, F. Role of ultrasonographic chronic kidney disease score in the assessment of chronic kidney disease. Int. Urol. Nephrol. 2017, 49, 123–131. [Google Scholar] [CrossRef] [PubMed]
- Kuo, C.C.; Chang, C.M.; Liu, K.T.; Lin, W.K.; Chiang, H.Y.; Chung, C.W.; Ho, M.R.; Sun, P.R.; Yang, R.L.; Chen, K.T. Automation of the kidney function prediction and classification through ultrasound-based kidney imaging using deep learning. NPJ Digit. Med. 2019, 2, 29. [Google Scholar] [CrossRef]
- Goodfellow, I.; Pouget-Abadie, J.; Mirza, M.; Xu, B.; Warde-Farley, D.; Ozair, S.; Courville, A.; Bengio, Y. Generative adversarial nets. Adv. Neural Inf. Processing Syst. 2014, 27, 2672–2680. [Google Scholar]
- Iyer, A.; Dey, B.; Dasgupta, A.; Chen, W.; Chakraborty, A. A Conditional Generative Model for Predicting Material Microstructures from Processing Methods. arXiv 2019, arXiv:1910.02133. [Google Scholar]
- Li, Z.; Zheng, T.; Wang, Y.; Cao, Z.; Guo, Z.; Fu, H. A Novel Method for Imbalanced Fault Diagnosis of Rotating Machinery Based on Generative Adversarial Networks. IEEE Trans. Instrum. Meas. 2021, 70, 1–17. [Google Scholar] [CrossRef]
- Pan, S.J.; Yang, Q. A Survey on Transfer Learning. IEEE Trans. Knowl. Data Eng. 2010, 22, 1345–1359. [Google Scholar] [CrossRef]
- Krizhevsky, A.; Sutskever, I.; Hinton, G.E. Imagenet classification with deep convolutional neural networks. Adv. Neural Inf. Processing Syst. 2012, 25, 1097–1105. [Google Scholar] [CrossRef]
- Hussain, Z.; Gimenez, F.; Yi, D.; Rubin, D. Differential Data Augmentation Techniques for Medical Imaging Classification Tasks. AMIA Annu. Symp. 2018, 2017, 979–984. [Google Scholar]
- Radford, A.; Metz, L.; Chintala, S. Unsupervised Representation Learning with Deep Convolutional Generative Adversarial Networks. arXiv 2015, arXiv:1511.06434. [Google Scholar]
- Arjovsky, M.; Chintala, S.; Bottou, L. Wasserstein Generative Adversarial Networks. In Proceedings of the 34th International Conference on Machine Learning, Sydney, Australia, 6–11 August 2017; Volume 70, pp. 214–223. [Google Scholar]
- Odena, A.; Olah, C.; Shlens, J. Conditional Image Synthesis with Auxiliary Classifier GANs. In Proceedings of the 34th International Conference on Machine Learning, Sydney, Australia, 6–11 August 2017; Volume 70, pp. 2642–2651. [Google Scholar]
- Gulrajani, I.; Ahmed, F.; Arjovsky, M.; Dumoulin, V.; Courville, A. Improved Training of Wasserstein GANs. In Proceedings of the 31st International Conference on Neural Information Processing Systems; Curran Associates Inc.: Red Hook, NY, USA, 2017; pp. 5769–5779. [Google Scholar]
- Frid-Adar, M.; Diamant, I.; Klang, E.; Amitai, M.; Goldberger, J.; Greenspan, H. GAN-based synthetic medical image augmentation for increased CNN performance in liver lesion classification. Neurocomputing 2018, 321, 321–331. [Google Scholar] [CrossRef] [Green Version]
- De Farias, E.C.; di Noia, C.; Han, C.; Sala, E.; Castelli, M.; Rundo, L. Impact of GAN-based lesion-focused medical image super-resolution on the robustness of radiomic features. Sci. Rep. 2021, 11, 21361. [Google Scholar] [CrossRef]
- Nie, D.; Trullo, R.; Lian, J.; Wang, L.; Petitjean, C.; Ruan, S.; Wang, Q.; Shen, D. Medical Image Synthesis with Deep Convolutional Adversarial Networks. IEEE Trans. Biomed. Eng. 2018, 65, 2720–2730. [Google Scholar] [CrossRef]
- Armanious, K.; Jiang, C.; Fischer, M.; Küstner, T.; Hepp, T.; Nikolaou, K.; Gatidis, S.; Yang, B. MedGAN: Medical image translation using GANs. Comput. Med. Imaging Graph. 2020, 79, 101684. [Google Scholar] [CrossRef]
- Bowles, C.; Chen, L.; Guerrero, R.; Bentley, P.; Gunn, R.; Hammers, A.; Dickie, D.A.; Hernández, M.V.; Wardlaw, J.; Rueckert, D. GAN Augmentation: Augmenting Training Data using Generative Adversarial Networks. arXiv 2018, arXiv:1810.10863. [Google Scholar]
- Rubin, M.; Stein, O.; Turko, N.A.; Nygate, Y.; Roitshtain, D.; Karako, L.; Barnea, I.; Giryes, R.; Shaked, N.T. TOP-GAN: Stain-free cancer cell classification using deep learning with a small training set. Med. Image Anal. 2019, 57, 176–185. [Google Scholar] [CrossRef] [PubMed] [Green Version]
- KDIGO. Clinical Practice Guideline for the Management of Blood Pressure in Chronic Kidney Disease. Kidney Int. 2021, 99, S1–S87. [Google Scholar] [CrossRef]
- Sandler, M.; Howard, A.; Zhu, M.; Zhmoginov, A.; Chen, L.C. MobileNetV2: Inverted Residuals and Linear Bottlenecks. In Proceedings of the IEEE Conference on Computer Vision and Pattern Recognition (CVPR), Salt Lake City, UT, USA, 18–23 June 2018; pp. 4510–4520. [Google Scholar]
- He, K.; Zhang, X.; Ren, S.; Sun, J. Deep Residual Learning for Image Recognition. In Proceedings of the IEEE Conference on Computer Vision and Pattern Recognition (CVPR), Las Vegas, NV, USA, 27–30 June 2016; pp. 770–778. [Google Scholar]
Publisher’s Note: MDPI stays neutral with regard to jurisdictional claims in published maps and institutional affiliations. |
© 2021 by the authors. Licensee MDPI, Basel, Switzerland. This article is an open access article distributed under the terms and conditions of the Creative Commons Attribution (CC BY) license (https://creativecommons.org/licenses/by/4.0/).