Article

Lipid Remodeling in the Mitochondria upon Ageing during the Long-Lasting Cultivation of Endomyces magnusii

by
Elena P. Isakova
1,*,
Natalya N. Gessler
1,
Daria I. Dergacheva
1,
Vera M. Tereshina
2,
Yulia I. Deryabina
1 and
Marek Kieliszek
3
1
Research Center of Biotechnology of the Russian Academy of Sciences, A.N. Bach Institute of Biochemistry, bld 33-2, Leninsky Prospect, 119071 Moscow, Russia
2
Research Center of Biotechnology of the Russian Academy of Sciences, Winogradsky Institute of Microbiology, bld 33-2, Leninsky Prospect, 119071 Moscow, Russia
3
Department of Food Biotechnology and Microbiology, Institute of Food Sciences, Warsaw University of Life Sciences—SGGW, Nowoursynowska 159c, 02-776 Warsaw, Poland
*
Author to whom correspondence should be addressed.
Appl. Sci. 2021, 11(9), 4069; https://doi.org/10.3390/app11094069
Submission received: 25 February 2021 / Revised: 20 April 2021 / Accepted: 28 April 2021 / Published: 29 April 2021
(This article belongs to the Special Issue Recent Advances in Applied Microbiology and Food Sciences)

Abstract

:
In this study, we used Endomyces magnusii yeast with a complete respiratory chain and well-developed mitochondria system. This system is similar to the animal one which makes the yeast species an excellent model for studying ageing mechanisms. Mitochondria membranes play a vital role in the metabolic processes in a yeast cell. Mitochondria participate in the metabolism of several pivotal compounds including fatty acids (FAs) metabolism. The mitochondria respiratory activity, the membrane and storage lipids composition, and morphological changes in the culture during the long-lasting cultivation (for 168 h) were under investigation. High metabolic activity of E. magnusii might be related to the active function of mitochondria increasing in the 96- and 168-h growth phases. Cardiolipin (CL), phosphatidylethanolamine (PE), phosphatidylcholine (PC), and sterols (St) were dominant in the membrane lipids. The St and sphingolipids (SL) shares increased by a lot, whereas the CL and phosphatidylinositol (PI) + PE ones decreased in the membrane lipids. This was the main change in the membrane lipid composition during the cultivation. In contrast, the amount of PE and phosphatidylserine (PS) did not change. Index of Hydrogen Deficiency (IHD) of phospholipids (PL) FAs significantly declined due to a decrease in the linoleic acid share and an increase in the amount of palmitic and oleic acid. There were some storage lipids in the mitochondria where free fatty acids (FFAs) (73–99% of the total) dominated, reaching the highest level in the 96-h phase. Thus, we can conclude that upon long-lasting cultivation, for the yeast assimilating an “oxidative” substrate, the following factors are of great importance in keeping longevity: (1) a decrease in the IHD reduces double bonds and the peroxidation indices of various lipid classes; (2) the amount of long-chain FFAs declines. Moreover, the factor list providing a long lifespan should include some other physiological features in the yeast cell. The alternative oxidase activity induced in the early stationary growth phase and high mitochondria activity maintains intensive oxygen consumption. It determines the ATP production and physiological doses of reactive oxygen species (ROS), which could be regarded as a trend favoring the increased longevity.

1. Introduction

Mitochondria participate in numerous cellular processes being critical for cell survival and death. Besides their best-known function of ATP generation, the mitochondria are entirely involved in cellular metabolism, partly maintaining calcium homeostasis and regulating cell adaption to various stresses. They are implicated in ROS signaling modulation, maintenance of oxidative homeostasis, and apoptosis regulation under stress conditions [1,2]. Indeed, mitochondria are involved in free radicals generation, with the respiratory chain as the leading ROS producer. Excessive ROS production is supposed to result from mitochondria dysfunction [3]. Mitochondria are indispensable organelles of any eukaryotic cell, determining the organism’s fitness and physiology [4]. The damage of mitochondrial function is a universal sign of ageing in a eukaryotic cell [4,5]. Some mechanisms causing damage to mitochondria bioenergetics include the accumulation of mutations and deletions in mtDNA, oxidation of mitochondria proteins, destabilization of macromolecular super-complexes in the respiratory chain, some changes in the lipid composition of the membranes, and modulation in mitochondria dynamics due to imbalance in organelle fusion, fission, and mitophagy [5]. The major ROS sources are mitochondrial respiratory chain, non-enzymatic reactions involving oxygen, phagocytosis, prostaglandin synthesis, the P450 cytochrome system, and ionizing radiation (in mammals). Thus, an increase in ROS generation due to an increased metabolic rate is considered the lifespan’s principal determiner.
Not only the abundant ROS generated in pathological mitochondria but also ROS produced in the normal ones can lead to oxidative damage of the cells causing the ageing process. The hypothesis known as the “free radical theory” of ageing (FRTA) [6] declares the major statements of ageing in any aerobes, which later result in the mitochondrial theory of ageing. The theory supposes that mitochondria are the primary ROS sources in a cell and consequently participate in ageing and lifespan regulation [7]. Nevertheless, some new data have led to a more thorough overview of mitochondria ROS function, which is now considered to be signaling molecules in numerous pivotal biological processes, including ageing and lifespan [8].
The molecular mechanisms of the response to oxidative stress and the role of ROS in ageing have been widely and keenly studied for a long time. Hence, using simple eukaryotic models, namely yeast organisms, can be helpful. The Saccharomyces cerevisiae yeast is widely used in research on ageing mechanisms, and it contributes to understanding basic cellular and molecular processes [9]. Budding yeast research largely contributed to comprehending the ageing process and age-related diseases [10]. Yeasts, being the simplest unicellular eukaryotes, have many features in common with mammalian and human cells that permit studying both chronological and replicative ageing [11]. Moreover, the response of the yeast cell to oxidative stress is similar to that of mammals, including the sites of ROS generation in the electron transport chain and the performance of the major antioxidant enzyme complex [12].
Until recently, it was unknown if the composition of the mitochondrial membrane lipids during ageing in yeast can result in mitochondrial dysfunction. However, recent studies showed that in the S. cerevisiae yeast, a metabolic pathway of ceramide and sphingolipid synthesis is an essential node of the signaling network to determine the replicative and chronological lifespan [13,14,15]. High content of triacylglycerols (TAGs) is another aspect of lipid metabolism defining the lifespan of chronologically senescent yeast cells [15,16]. The neutral lipids are synthesized in the endoplasmic reticulum (ER) and then accumulate into lipid bodies (Lb), which determines the longevity of senescent yeast cells regardless of any other signaling pathways [15]. Their lipid composition can also distinguish mitochondrial inner and outer membranes. The outer mitochondrial membrane is a smooth lipid-rich envelope with pore-forming proteins. In contrast, the highly folded inner mitochondrial membrane is protein-rich harboring mainly enzymes of the respiratory chain [15]. PI is present in the outer mitochondrial membrane at a considerable amount. By contrast, CL and PE are enriched in the inner mitochondrial membrane. The presence of high CL levels in the mitochondrial membranes suggests that this PL is essential for efficient oxidative phosphorylation. The unsaturation degree of membrane lipids was found to influence respiratory properties and cytochrome content of mitochondria from S. cerevisiae. It was shown that a decrease in the amount of unsaturated FAs also declined the activity of several mitochondrial enzymes.
Vladimir Titorenko’s team has methodically studied the relationship between the mitochondria lipidome and the life span of the yeast. The authors declared that ageing changes of the mitochondria lipid composition in the yeast include. (1) The levels of PE, CL and monolysocardiolipin (MLCL) decrease in the mitochondrial membranes. (2) the levels of phosphatidic acid (PA), PS, PC and phosphatidylglycerol (PG) increase in the mitochondrial membranes [17,18]. The applied lithoholic bile acid was reported to penetrate into the mitochondria and accumulate in the inner mitochondria membrane. This leads to changes in the phospholipid composition of the mitochondria membranes [17,18,19]. The remodeling of mitochondrial phospholipids intensifies while a yeast culture ages and finally causes substantial changes in mitochondria membrane lipidome.
The composition of the mitochondria’s respiratory chain in traditional yeast species, namely S. cerevisiae is quite invariable. In particular, their mitochondria have no complex I [20]. By contrast, the Endomyces magnusii yeast being an obligate aerobe possesses a complete respiratory system similar in its mitochondrial system to the animal one. The E. magnusii cannot grow in the presence of the inhibitors of the mitochondria transcription (ethidium bromide) and mitochondria translation (erythromycin). Under these conditions, the growth should undergo only at the expense of substrate and glycolytic phosphorylation. In our experiments, the glycerol-containing medium-low concentrations of ethidium bromide (5–15 µg/mL) led to the complete inhibition of the growth. We assayed the number of generations (Figure S3B). We could see similar results in the experiments with erythromycin, which in low concentration (5 mg/mL) blocked the growth of the E. magnusii (Figure S3A).
In the yeast with fermentative metabolism types such as S. cerevisiae, the membrane and mitochondrial apparatus are ill-developed. There are only scanty large mitochondria with small cristae. Their mitochondria have much fewer cristae and trend to irregularity in their shape, structure, and packing. However, the yeast of strongly-pronounced aerobic metabolism, namely E. magnusii, possesses well-developed membrane apparatus with abundant complex mitochondria with numerous cristae [21]. According to the above-mentioned statement, we consider that the E. magnusii species is a unique model close to the animal in the mitochondrial system that makes it a convenient model for studying some mechanisms, including ageing.
Previously, we demonstrated high viability capacity in the E. magnusii yeast upon chronological ageing [22]. For the 20-day cultivation of the strain in glycerol-containing (1%) medium, there were no signs of growth culture inhibition. The analysis of cell survival during culture ageing showed that after 168 h of growth (7 days), it decreased by not more than 10–15% compared to the logarithmic growth stage [22]. The yeast population in the stationary growth stage consists of long-lived quiescent cells, which can enter the cycle of cell fission cycle, and non-quiescent cells, which are short-lived and incapable of dividing, similar to the phenotype of ageing mammalian cells [13,23].
Considering the hypothesis of yeast population heterogeneity upon its shift into the stationary growth phase, our data, and the key role of the mitochondria in the ageing regulation, we wanted to systematically study the alterations in the lipid amount and composition, assayed the mitochondria metabolic activity, and the changes in cell morphology of E. magnusii mitochondria during long-term cultivation.

2. Results

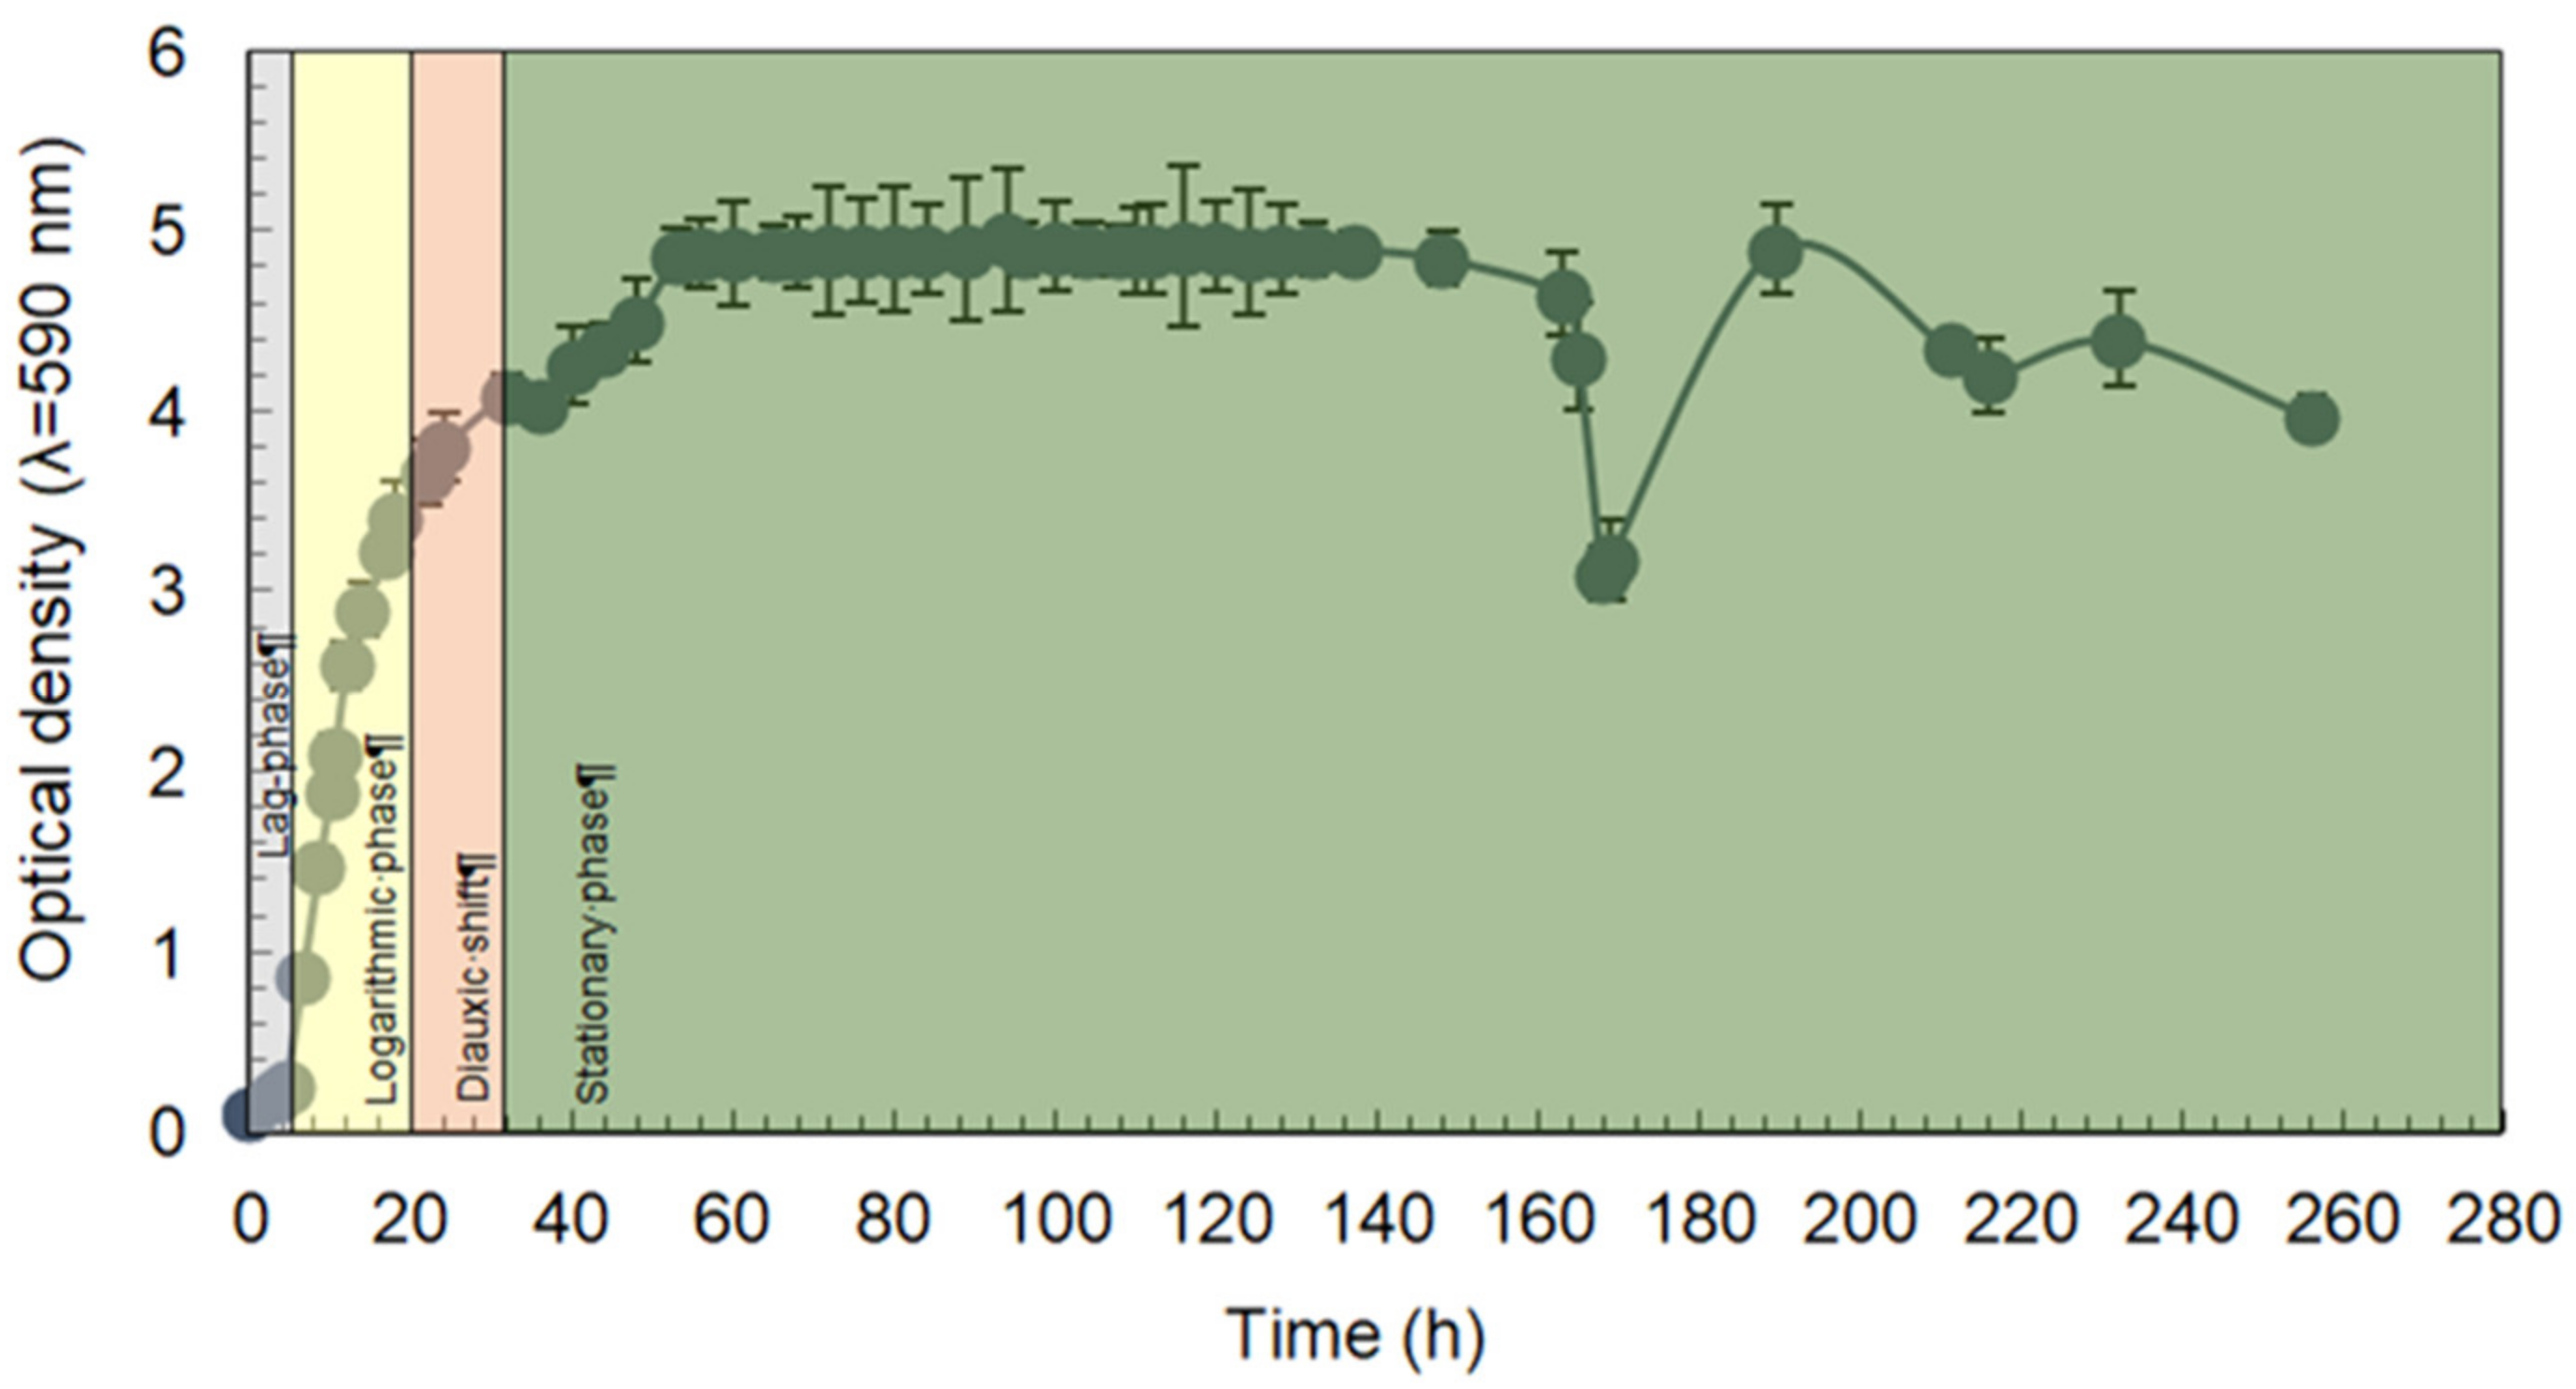
2.1. Long-Lasting Growth of the E. magnusii Yeast

Figure 1 shows the growth curve of E. magnusii yeast upon assimilating 1% glycerol. The dynamics of cell growth displayed classical logarithmic dependence with a well-pronounced lag phase (from 0 to 6 h of cultivation), a phase of logarithmic (exponential) growth (from 6 to 20 h of cultivation), a diauxic shift phase defining the transition of the population into the stationary growth phase (from 22 to 30 h of cultivation), early stationary growth phase (from 30 to 48 h of cultivation), and late (48 h) and stationary phase (from 48 to 200 h of cultivation) (Figure 1).
Microscopic analysis of the morphology of E. magnusii cells in various growth stages showed that it varies greatly. In the logarithmic growth stage, the cells are round and oval, sometimes fusiform or pear-shaped, either with well-visible buds (in the process of division) or budded daughter cells (Figure 2A), whereas in the stationary stage (after 30 h of cultivation) the number of daughter cells decreased to 5% of the total number (Figure 2B). The population of the exponential phase had about 4% actively dividing cells with buds at the poles, about 10% cells with detached immature buds, and about 20% young daughter cells, which are smaller and regularly spherical (Figure 2A). In the stationary growth phase, the number of actively budding and young cells nearly halved, there was some heterogeneity in the cell population, some cells changed their shape, and some single pseudomycelial and mycelial forms appeared (Figure 2B). It should be noted that during long-lasting cultivation, the nuclei of E. magnusii cells changed their shape (increased by 1.5 times). In the stationary phase, the nuclei increased in their volume and became more round (Figure 2C,H). The morphometric features of this growth stage indicated the intensive growth and fission of E. magnusii cells (Table S1 in the Supplementary Section). At the same time, the population was highly heterogeneous without any signs of pathological changes or inclusions (Figure 2D). Moreover, the cells at this stage got a distinct thickened cell wall, large vacuoles, and small dense cytoplasmic inclusions, which are likely to be autophagic vacuoles or bodies (Figure 2H). It should be emphasised that the energy status of the cells in the logarithmic and stationary growth phases, confirmed by potentiometric staining, was maintained at a high level (Figure 2E,F).
Summarising all the obtained results including the changes in morphology, along with the functional heterogeneity of the E. magnusii culture, shown before [21], we studied the lipid amount and composition in the mitochondria at different growth stages upon ageing.

2.2. Respiratory Activity of E. magnusii Yeast Mitochondria

We designed a unique method for mitochondria isolation modified especially for the yeast. The test for fraction contamination included electron microscopy of the organelles and the polarographic assay of the mitochondria function: (1) the electron microscopy images of the E. magnusii yeast (Figure S1 in the Supplementary Section) showed that the mitochondria fraction was pure and free from any inclusions and other organelles. Moreover, the mitochondria in the photos had a regular structure with well-developed cristae and intact outer and inner membranes; (2) the mitochondria could oxidize the respiratory substrates (pyruvate+malate) (Figure S2A in the Supplementary Section) and generate a high membrane potential without any co-factors application (NAD(P)H, cytochrome c) (Figure S2B in the Supplementary Section); (3) the assay of the mitochondria activity showed no endogenous respiration (without any substrate application), indicating neither other membranes nor enzymes (Figure S2A (a) in the Supplementary Section); (4) the mitochondria demonstrated high respiratory rates and phosphorylation, ADP/O ratios close to the theoretically expected maxima (Table S1 in the Supplementary Section) upon oxidation of NAD-dependent substrates. It says about good mitochondria integrity after the isolation. We could detect the activity of adenilate kinase, which is in the inter-membrane mitochondria space and synthesizes ADP from AMP and ATP (Figure S2C in the Supplementary Section). The enzyme cannot work if the membrane is damaged. However, its activity was observed even in the hypotonic incubation medium. We are also sure that the mitochondria fraction was pure because we modified the method of isolation of the mitochondria, especially, to bind and remove the lipid fraction from the suspension. In the mitochondrial isolation and washing medium, we use 1% bovine serum albumin (FAs free fraction V), which binds FAs in the medium. Moreover, the high degree of mitochondria coupling indicates no lipid contamination, as any lipid compounds lead to powerful uncoupling of respiration and phosphorylation [24]. We get live mitochondria with respiratory controls close to the maximum that is impossible if the fraction is contaminated (Table 1, Table S2 in the Supplementary Section).
Changes in respiratory activity is the main indicator of the cellular energy status. The mitochondria of most plants, fungi, and yeasts possess an alternative pathway of electron transport that is induced if the main (cytochrome) pathway is inhibited by KCN, azide, or antimycin A [25,26]. The electron flux is switched off at the reduced ubiquinone site and is specifically inhibited by hydroxamic acid derivatives. The dynamics of the oxygen uptake rate by E. magnusii mitochondria showed that it varied significantly during the growth and ageing of the culture (Table 1).
The respiration rate in the state 4 (initial respiration) was minimal at the logarithmic growth stage, slightly increased at the 24-h stage, increased threefold in the 48-h phase, and reached its peak by 96 h of growth. The respiration rate of mitochondria in the third state (phosphorylation after the ADP addition) was also altered, similar to that in the second one. However, the coupling degree of the mitochondria insignificantly decreased at the 24-h growth stage compared to that in the log-stage.
The proportion of the alternative electron transfer pathway showed that the mitochondria respiration at the mid-logarithmic stage was extremely sensitive to the inhibitor KCN. However, in the 24- and 48-h phases, we observed the induction of AO upon inhibiting the main (cytochrome) pathway. The level of the KCN-resistant respiration was 12–13% being blocked by the specific AO inhibitor salicylhydroxamic acid (SHAM). At the 96 -h and 168- h phases of cultivation the share of cyanide resistance increased up to about 30 and 50%, respectively.
According to the model proposed by Bahr and Bonner [27], the alternative pathway becomes active only if the main pathway of electron transport cannot work (in case of inhibition or electron saturation), i.e., the activity of the KCN-resistant pathway is regulated by the main cytochrome chain. It can be assayed by its participation in the total cell respiration. The AO level indicates the respiration inhibited by the KCN + SHAM system, and its contribution into the total cell respiration is defined as the respiration share inhibited by SHAM only without KCN [27]. The attempts to assess the proportion of the alternative pathway in vivo corroborated no hypothesis of constitutive induction of AO. SHAM did not induce the respiratory rate inhibition in any experiments significantly (Table 1). Based on the data, we could suppose that during the growth and ageing of E. magnusii, the alternative pathway induction triggers; however, it is not likely to be related to the decrease in the cytochrome pathway activity.
To comprehend the mechanism of high energy activity of yeast mitochondria for 20 days, we tried to determine the alterations in the main lipid components of the E. magnusii mitochondria during long-lasting cultivation.

2.3. Storage Lipids Profile of E. magnusii Yeast in the Different Growth Phases

Figure 3 shows the total content and composition of neutral lipids in E. magnusii mitochondria. The major lipid fractions were presented by FFAs and diacylglycerols (DAGs). The FFAs level was high in all the mitochondria samples and reached 73–99% of the total lipids (Figure 3A). The maximum DAGs amount was found in the logarithmic growth phase. Of note that a certain share of them (10–15% of the total lipids) was also revealed at the later growth stages. The minority comprised TAGs and sterol esters (ESt). TAGs were detected only in the early growth stages (17 h of growth) while ESt appeared in the late stationary stages and their amount nearly doubled by 168 h of cultivation compared to that in the 96-h phase.
The amount of total storage lipids remained relatively stable during the growth culture up to 96 h when it increased nearly twofold with a concurrent decrease by 168 h of cultivation (Figure 3B).
In the next step of the study, we assayed the membrane lipids profile in the E. magnusii mitochondria.

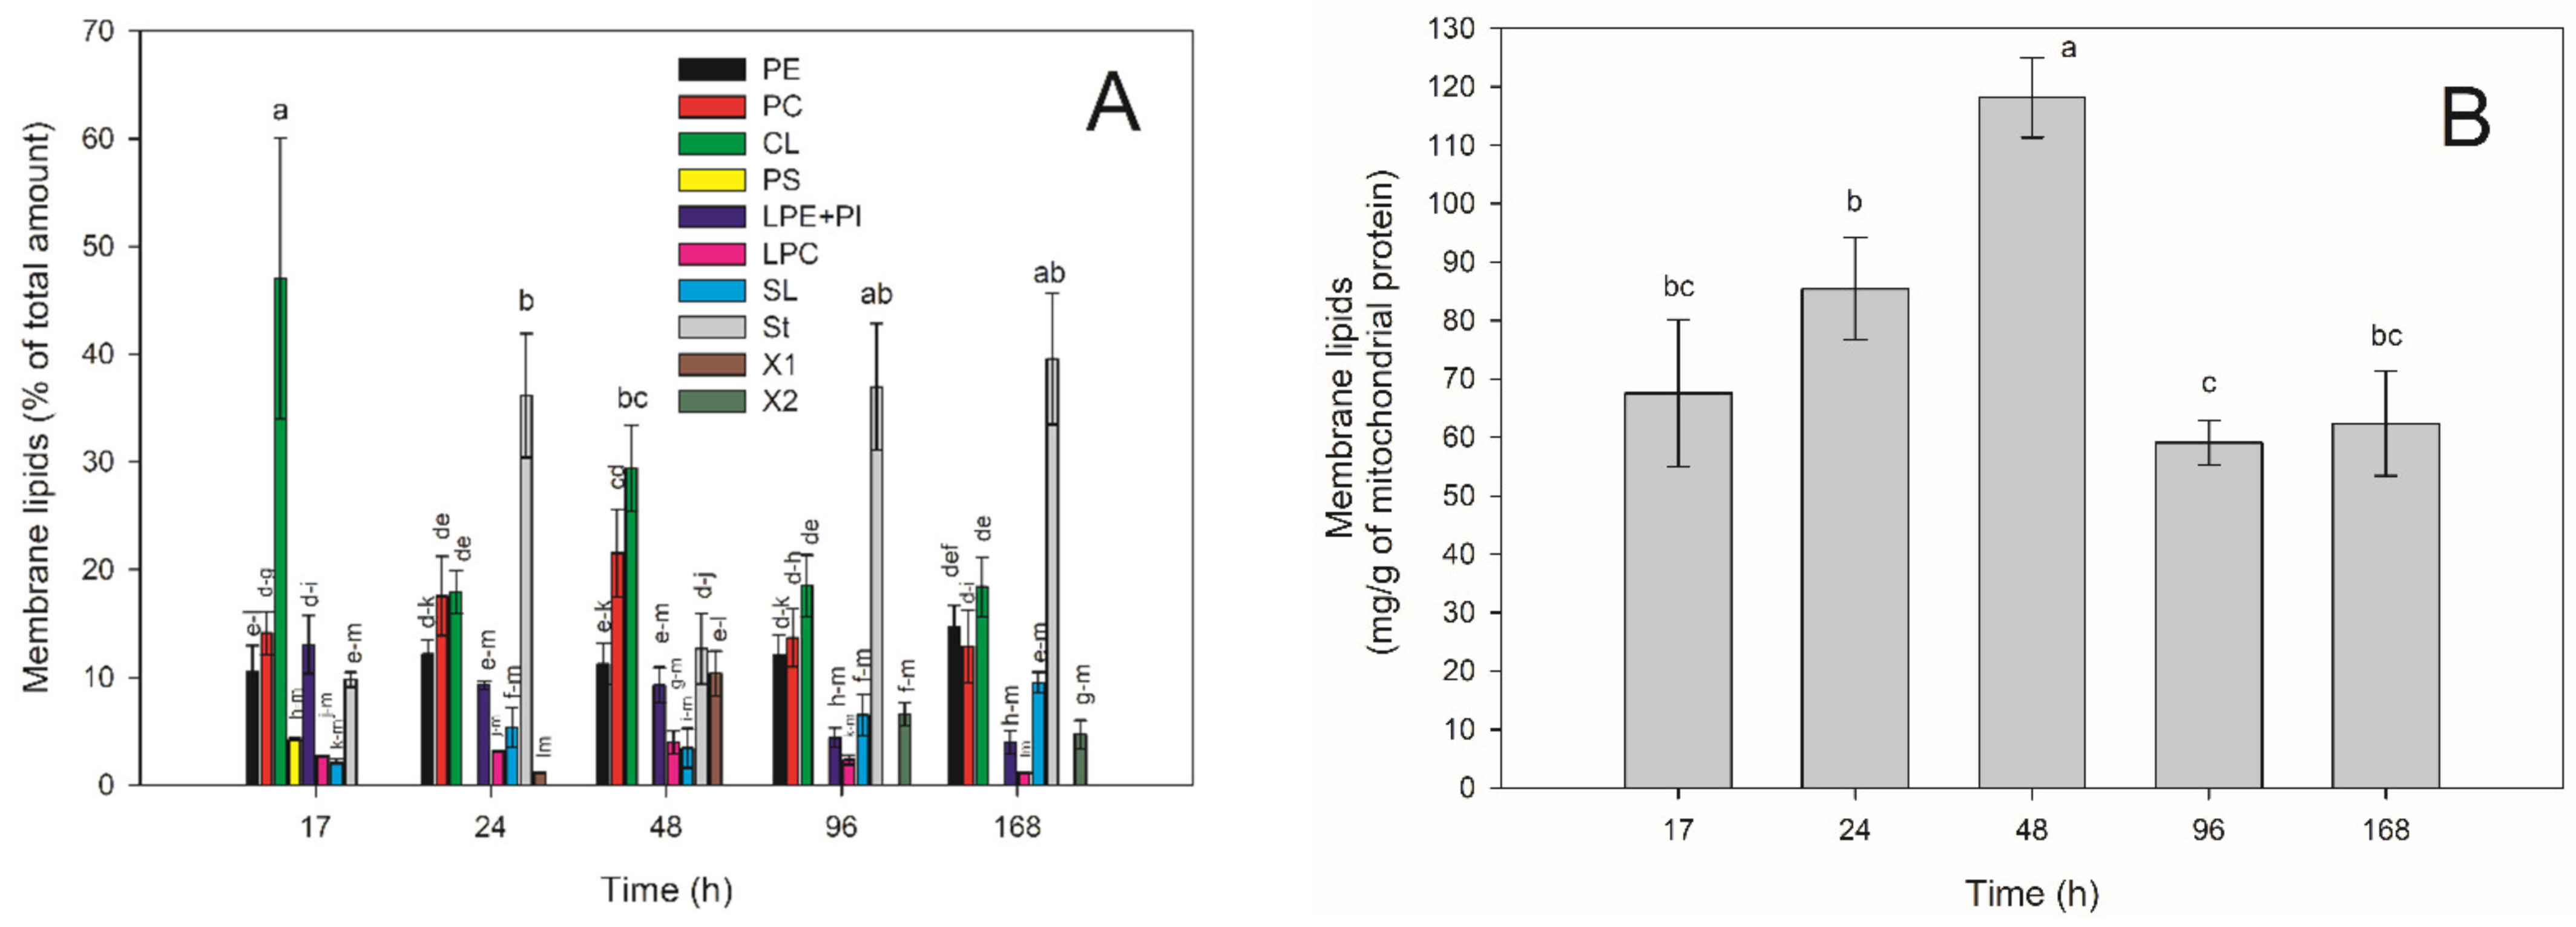
2.4. Membrane Lipids Profile of E. magnusii Mitochondria during Long-Lasting Cultivation

The amount and composition of the mitochondrial membrane lipids also changed significantly during growth and ageing of the culture. The membrane lipid amount reached its peak of 118.120 mg/g mitochondrial protein in the early growth stationary stage (48 h of cultivation) (Figure 4B), whereas the minimum content of 59.086 mg/g mitochondrial protein was in the deep stationary phase (96 h). The dynamics of the mitochondria membrane lipids showed a gradual increase by 48 h of cultivation with a nearly twofold drop in the deep stationary phase. The main fractions were sterols St (10–40%), PE (10–15%), PC (13–22%), CL (47%), and lysophosphatidylethanolamines + PI (up to 13%) (Figure 4A).
The PE fraction remained constant at the level of about 10% throughout the experiment with a concurrent increase up to 15% in the late stationary phase (168 h of cultivation). The PC fraction gradually increased up to 22% in the 48-h growth stage and nearly halved in the 168-h growth stage while the CL content reached its peak in the logarithmic growth stage (47%), decreased by more than two times in the 24-h stage (up to 18%) with a slight increase in the 48-h growth phase (up to 29.4%), and stabilized in the late stationary phase at 18%.
The LPE + PI fraction decreased during the cultivation from 13% to 4%. The St level changed in waves in different growth phases, reaching its maximum of 36–39% in the 24-h, 96-h, and 168-h growth phases (Figure 4A). The minor components of the lipid spectrum with the share of less than 10%, comprised lysophosphatidylcholines (LPC) and sphingolipids (SL). It is noteworthy that two unidentified lipid components were revealed: X1 was in the 24- and 48-h growth phases, and X2 was in 96- and 168-h growth stages.
The overall degree of acyl residue unsaturation, Index of Hydrogen Deficiency (IHD) in phospholipids determines the fluidity of the membrane lipid bilayer, which in turn may affect the adaptation and survival of the yeast under stress conditions, including ageing. Thus, we next assayed the FFAs composition and amount of the membrane lipids.

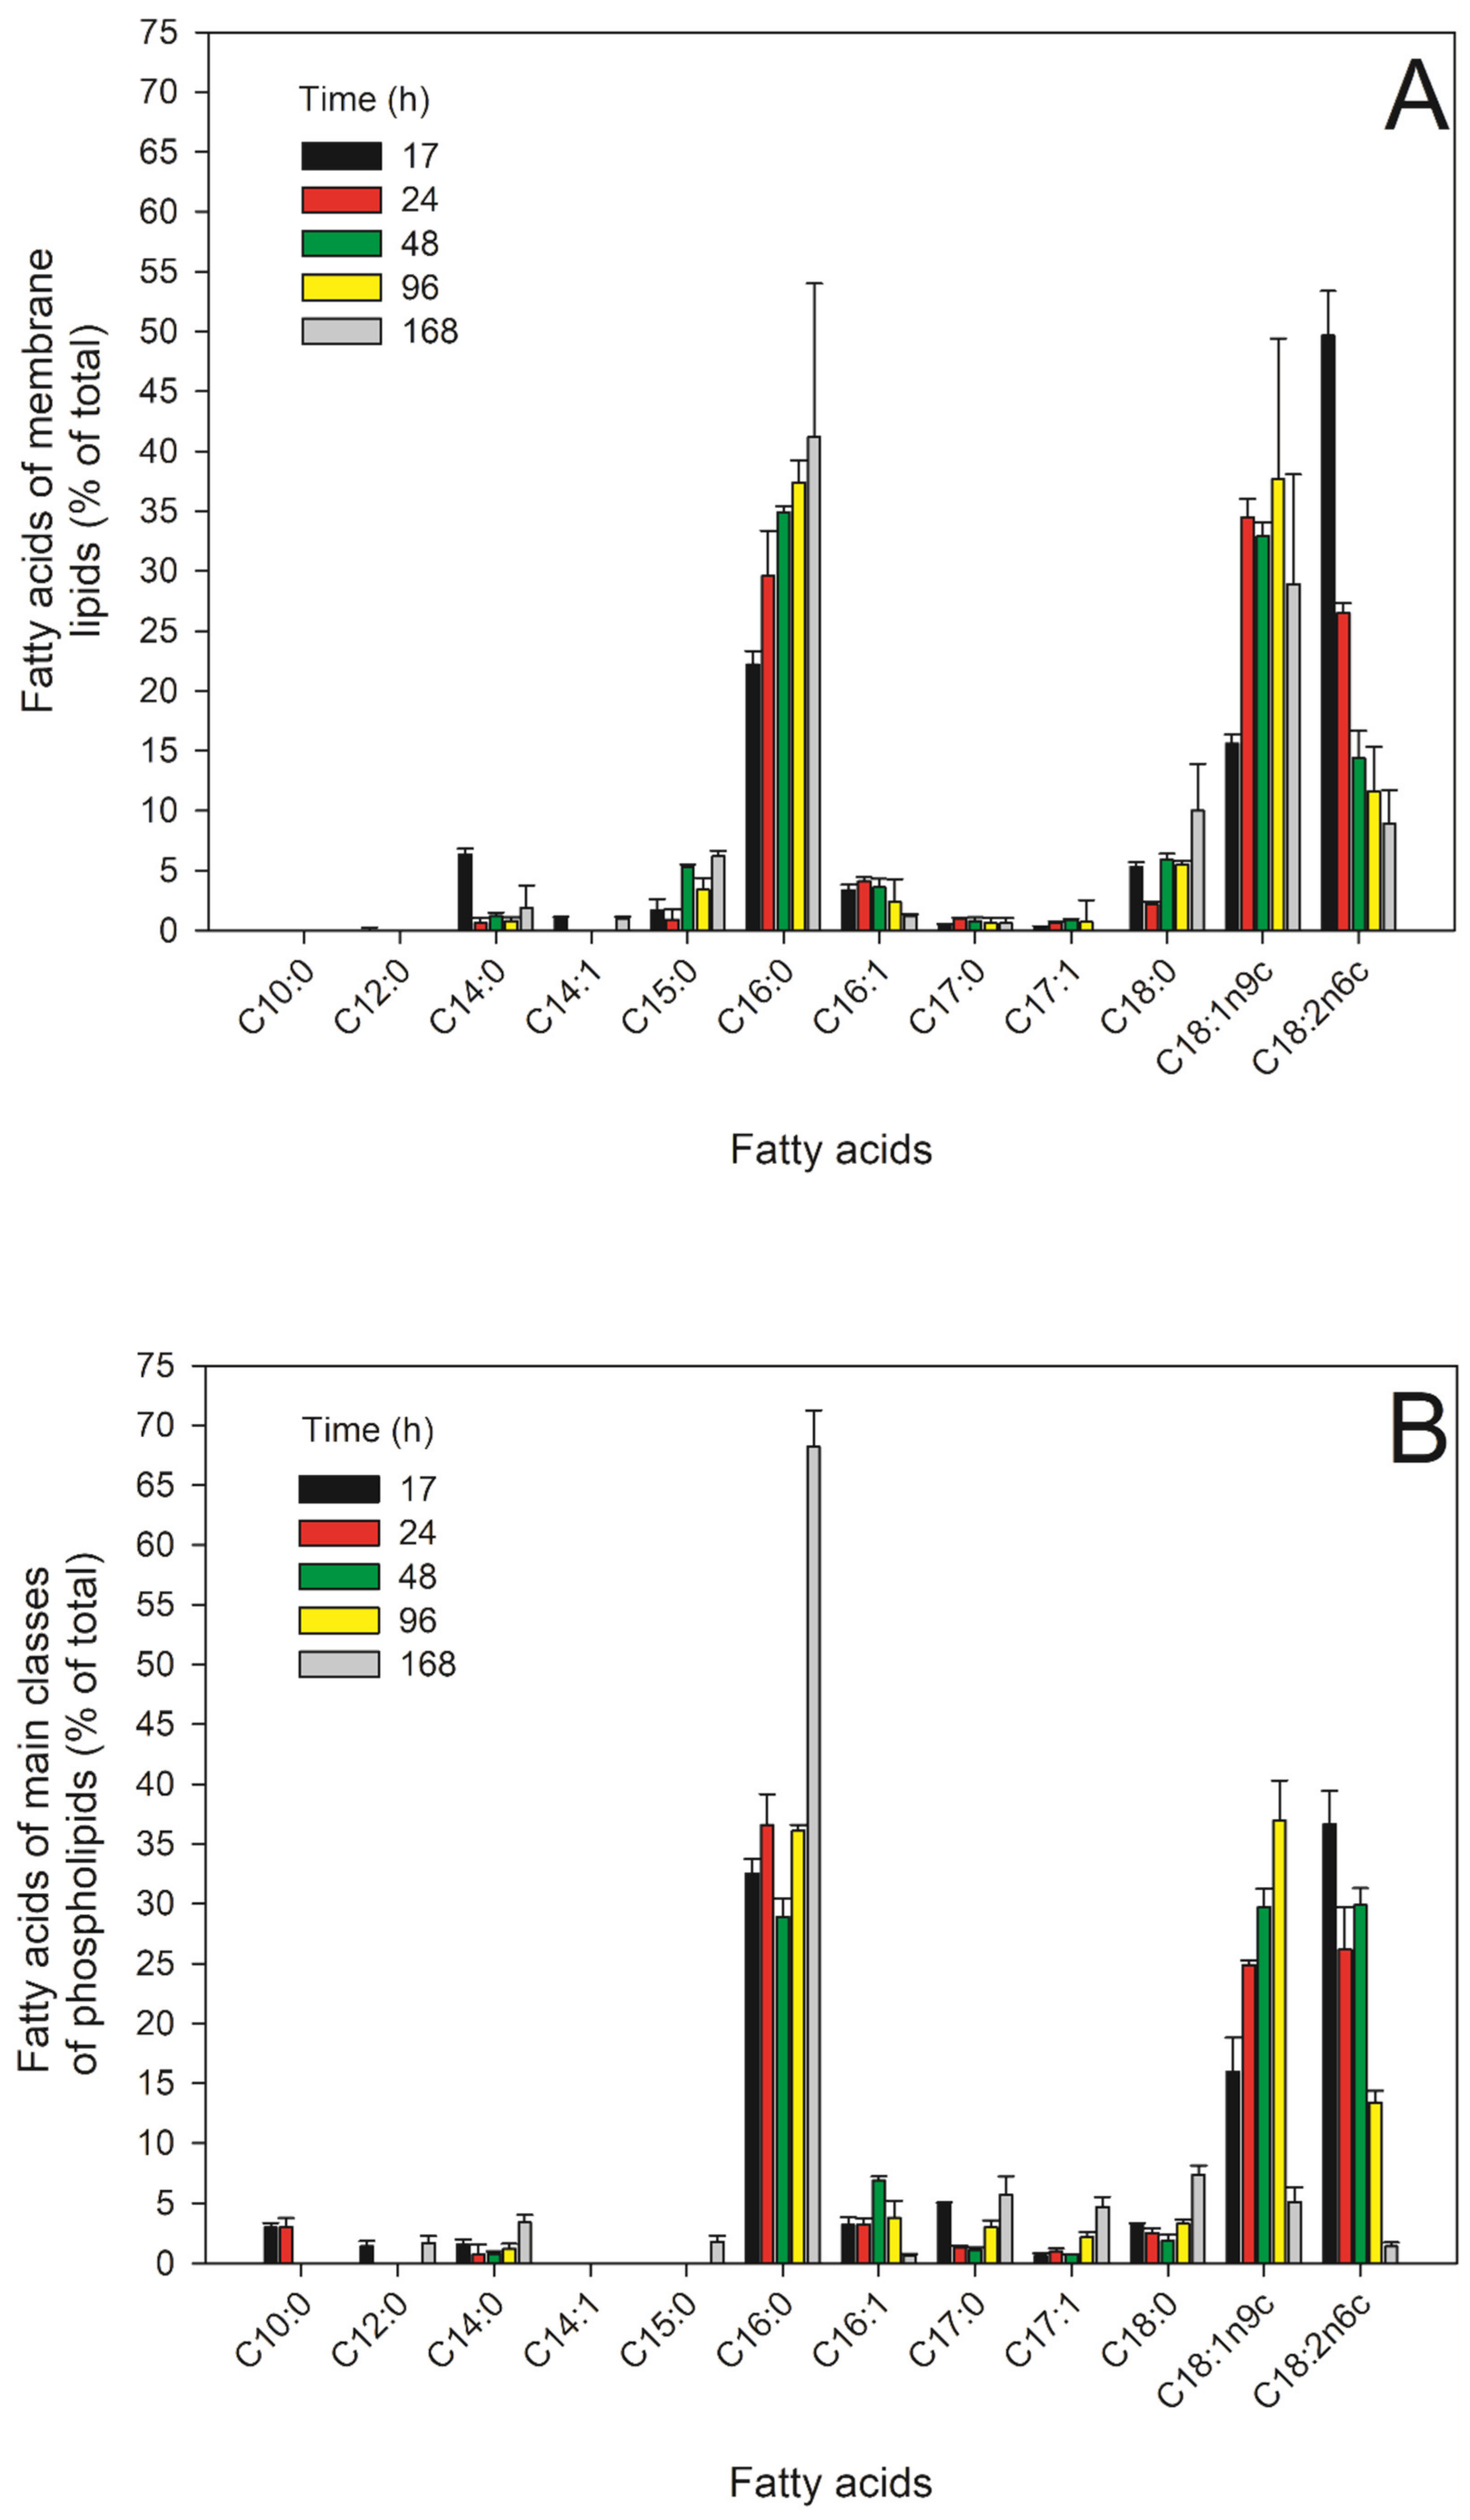
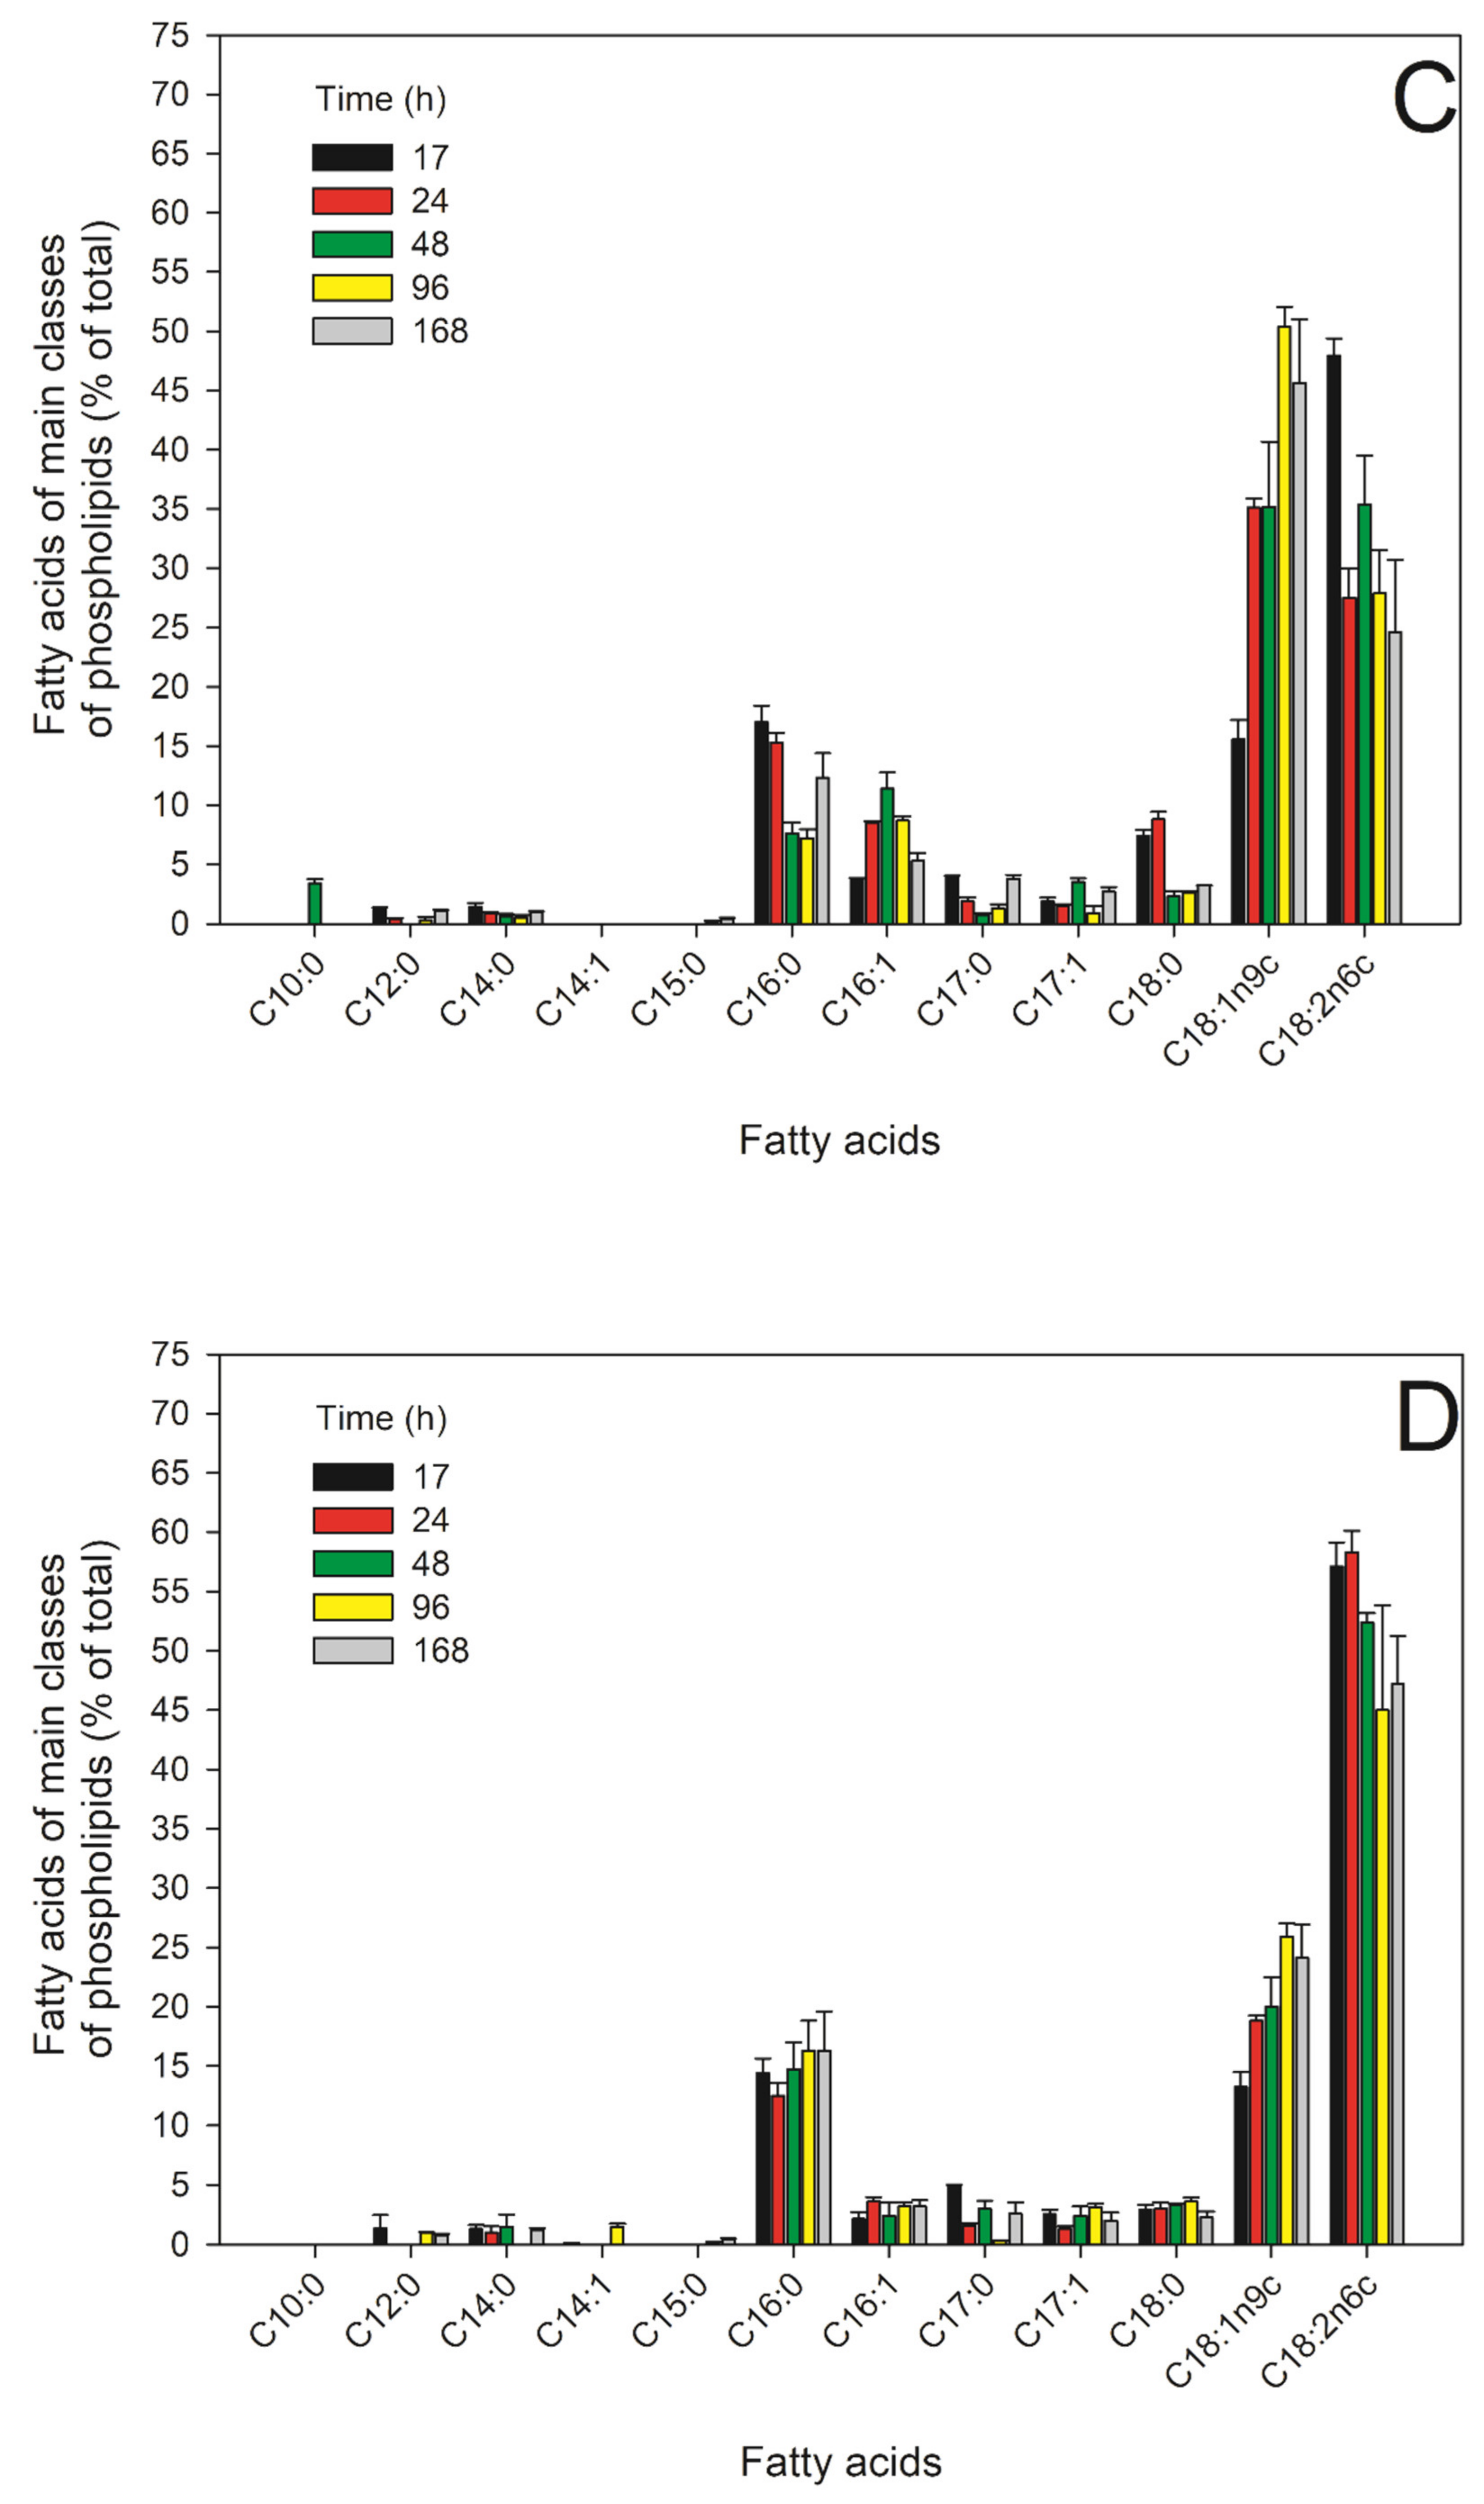
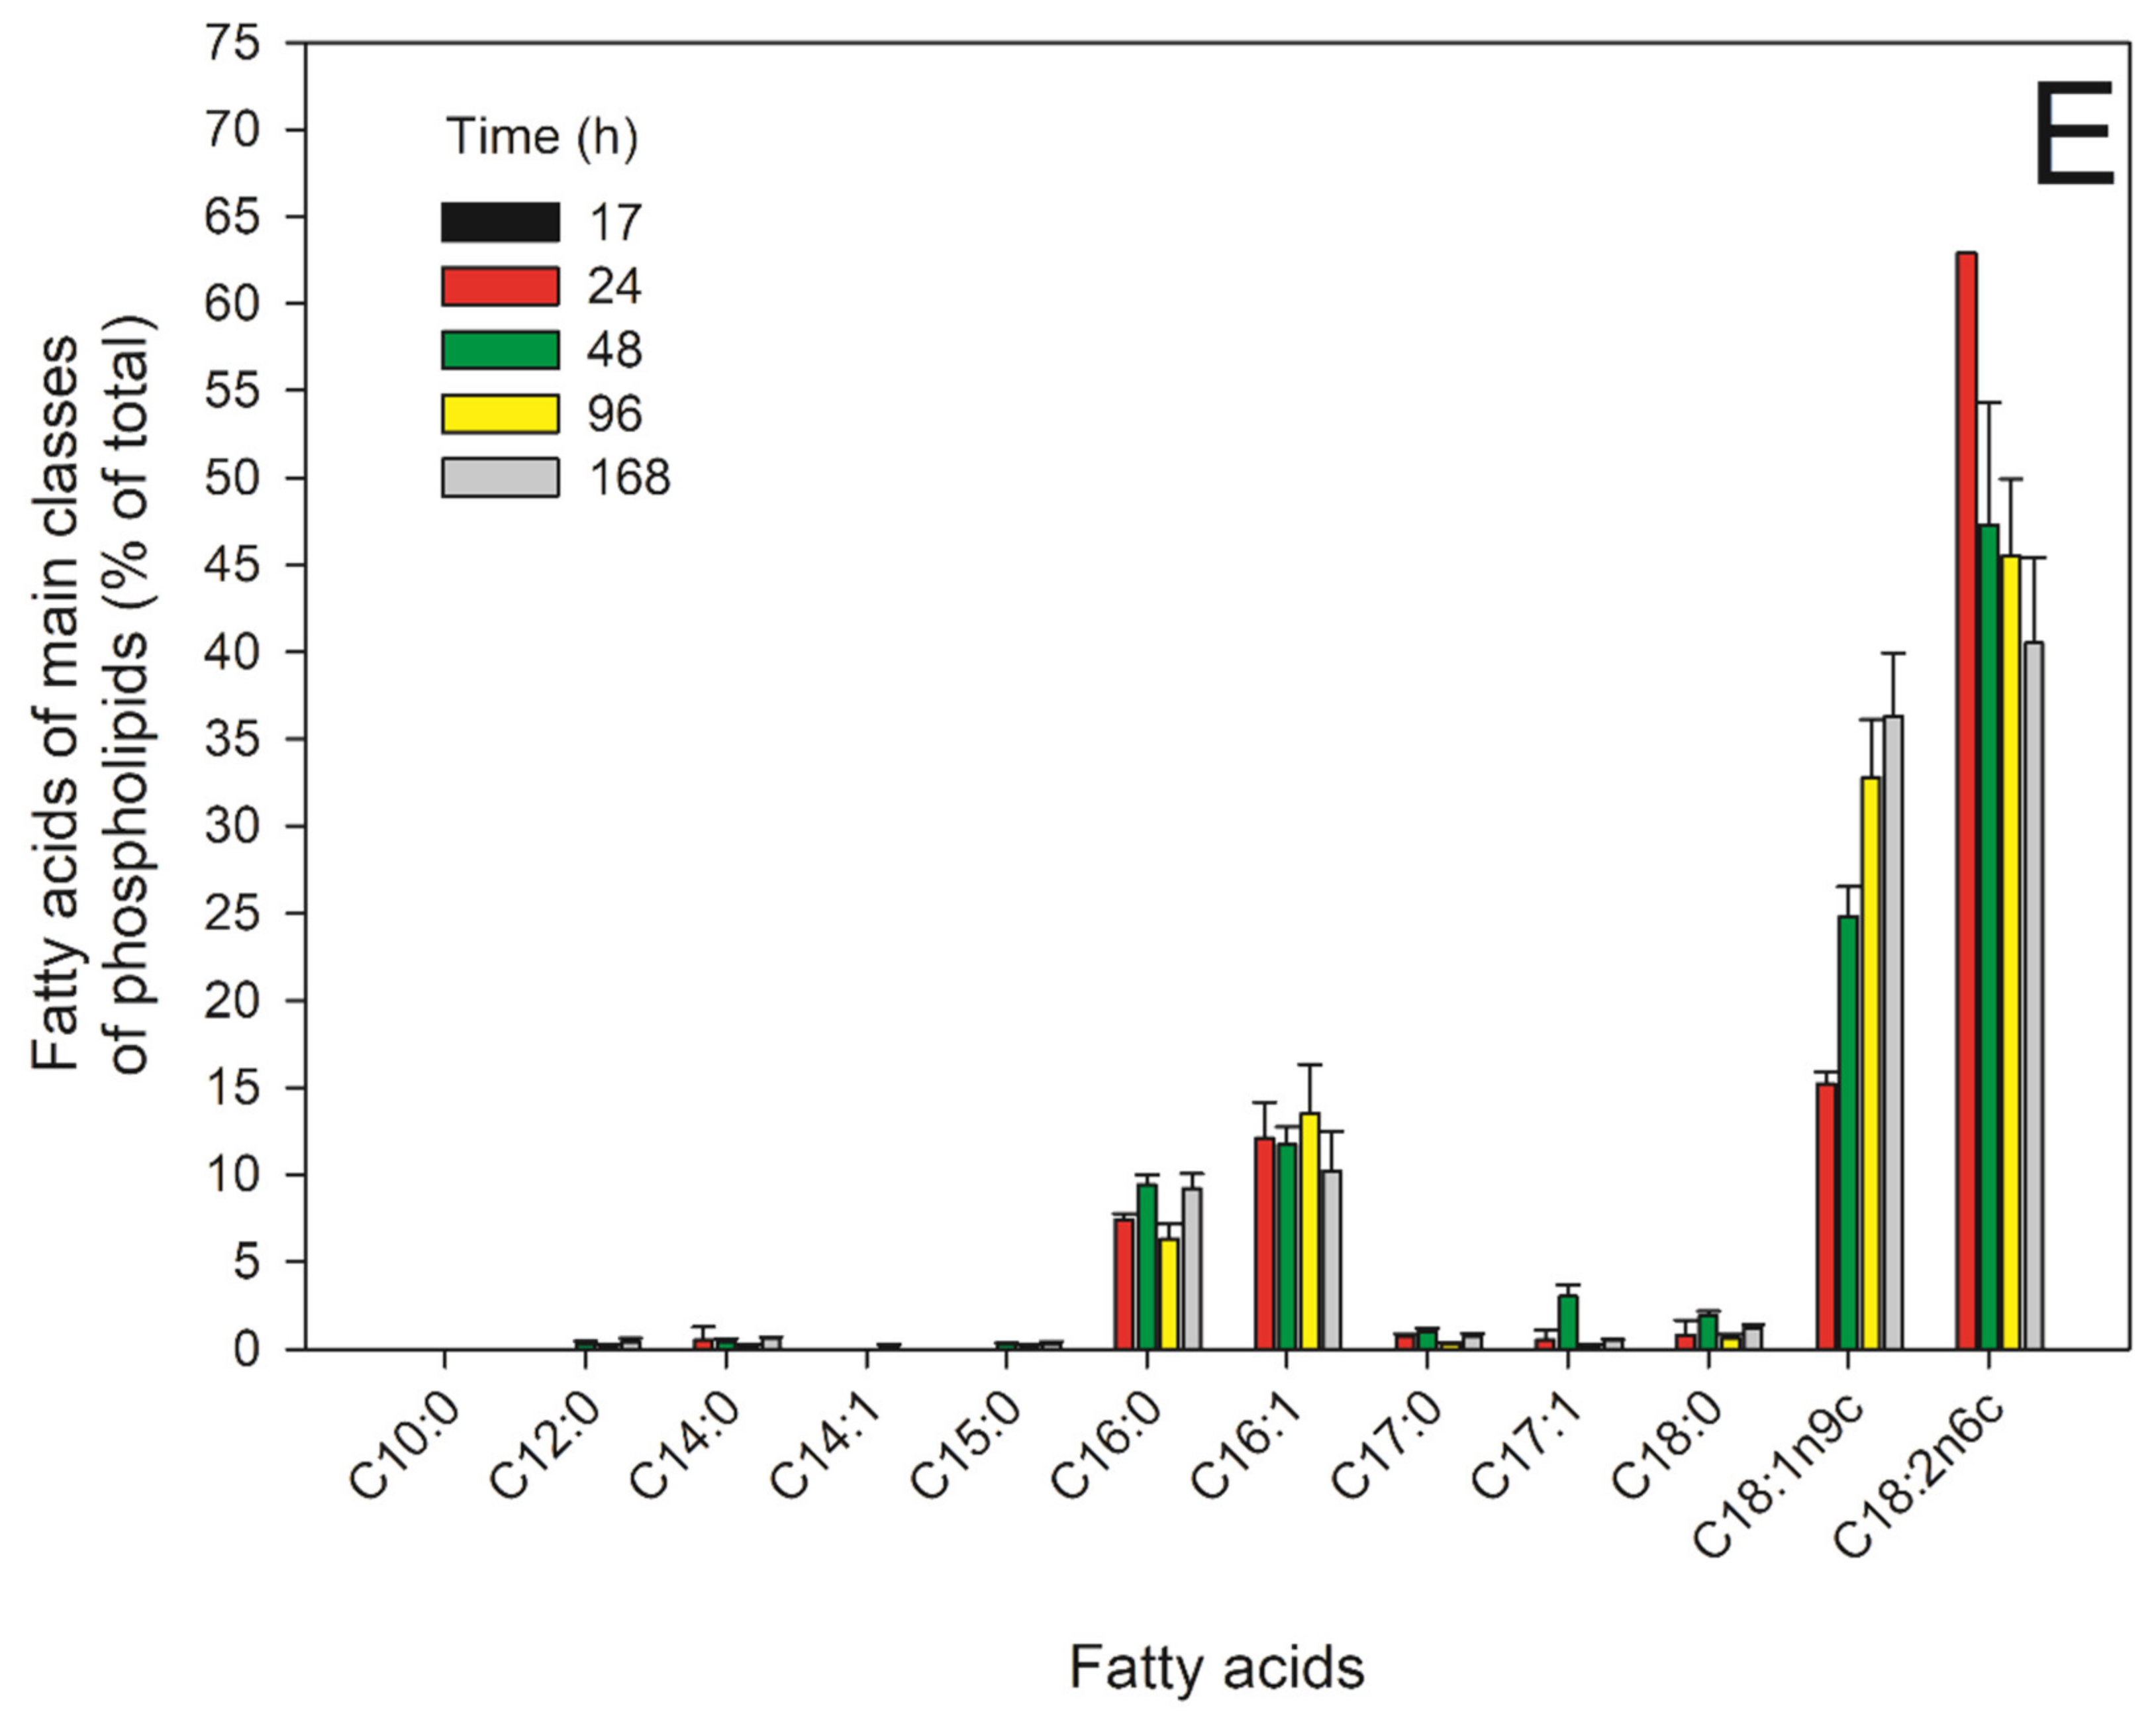
2.5. FAs of the Main PLs in the Different Growth Phases

To determine the degree of unsaturation, four main PLs fractions (PE, PC, CL, and PA), the share of which in the membrane lipids comprised more than 6%, were chromatographically isolated, and their FAs composition was analyzed. Figure 5 and Figure 6 show the changes in the FAs composition and IHD of the mitochondrial membrane lipids in E. magnusii. The overall IHD in the membrane lipids was below 1.0 during the whole experiment. At the same time, the degree of unsaturation reached its maximum in the 48-h growth stage and its minimum at the 24-h growth stage (Figure 5B). Moreover, in the late stationary phase, the IHD was a bit higher than 0.6.
During long-lasting cultivation, the IHD changed due to significant alterations in the unsaturation of some fractions of the membrane lipids. Thus, IHD of PE remained at the same level in all the growth stages except for the 168-h stage, where it decreased sevenfold (Figure 5A). However, it was extremely stable in the PC and CL fractions, which dominate in the PLs of the mitochondrial membranes.
Dominating FAs in the mitochondrial PLs were palmitic (C16:0), oleic (C18:1), and linoleic (C18:2) acids (Figure 6A). In general, during the seven-day cultivation, we could observe the following consistent pattern: (1) palmitic acid (16:0) increased while the level of palmitoleic acid (C16:1) decreased; (2) oleic acid (C18:1) gradually increased with a sharp drop in the 168-h growth stage; and (3) the level of linoleic acid significantly decreased during cultivation being the highest in the early logarithmic stage (Figure 6A).
The linoleic acid level in the PE fraction compared to that in the logarithmic stage decreased by 30%, 20%, and 63% in the 24-, 48-, and 96-h growth stages, respectively. Furthermore, by 168 h of cultivation, its level decreased by 26 times. On the contrary, the oleic acid level increased by 1.5, 1.96, and 2.3 times in the 24-, 48-, and 96-h growth stages, respectively, followed by more than a threefold decline in the 168-h growth stage (Figure 6B–E). The palmitic acid level in the PE fraction compared to that in the logarithmic stage doubled in the 168-h stage, but the palmitic acid level in the CL fraction remained constant of about 14–16% throughout the experiment. As for the oleic acid in the CL fraction, its level increased nearly twofold as the culture was ageing and reached 24–25% of the total fatty acid amount in the late stationary phase (Figure 6B–E).
At the same time, the linoleic acid level in the CL fraction decreased during the growth and ageing by about 10% (Figure 6B–E). As for PC, the palmitic acid level decreased by about two times in the 48-h stage and remained the same until the 96-h growth stage compared to that in the logarithmic stage. The amount of the oleic acid in the PC fraction increased by 2.3, 3.2, and 2.9 times in the 24-, 48-, and 96-h growth stages, respectively. Meanwhile, the linoleic acid level in the PC nearly halved during the growth and ageing of the culture. It is noteworthy that these FAs levels in the phosphatidic acids (PA) fraction also varied significantly. For example, the linoleic acid level decreased by more than 20% while the amount of the oleic acid doubled during the cultivation.
In the stage of the shift to the stationary growth phase, rather significant changes in the heptadecenoic acid (C17:1) level in the PE fraction were observed. Its amount increased by 6–8 times in the 96-h and 168-h growth stages compared to that in the logarithmic phase. Moreover, the main membrane PLs comprised negligibly small amounts of short-chain FAs, namely lauric acid (C12:0), myristoleic acid (C14:1), and pentadecenoic acid (C15:0).

3. Discussion

E. magnusii is a classical lower eukaryote of aerobic metabolism. It has a well-developed mitochondria system with a complete respiratory chain containing the invariable first coupling point [28]. It is capable of assimilating lots of substrates, including those substrates that determine the oxidative type of metabolism. The physiological features make significant advantages for the strain compared to the traditional S. cerevisiae yeast, used as a convenient tool to simulate processes in the unicellular eukaryotes model.
Earlier, we performed a systematic assay of the redox status of the E. magnusii yeast cultivated using two different types of substrates: a so-called “respiratory” substrate of glycerol and “fermentation” type substrate of glucose [22]. We revealed a significant difference in the survival of E. magnusii culture grown in glucose-containing medium, which showed a gradual decrease from 85% in the early stationary growth phase to 55% in the 168-h phase. The culture grown using glycerol showed a consistently high level of viability [22].
The data obtained suggest that the survival of the yeast culture during long-term cultivation and their high metabolic activity may be related to the active function of mitochondria. Their biogenesis is observed upon aerobic growth on non-fermentable substrates [22]. The yeast is capable of aerobic growth while using glycerol as a carbon source. The transition from “fermentative” to “respiratory” growth requires significant transcriptional rearrangements [29,30], which triggers the genes encoding the respiratory chain components, the elements of oxidative, osmotic, and general anti-stress responses, the enzymes of protein synthesis, glycerol assimilation and so on [20,31]. The mechanisms of yeast adaptation to various types of metabolism have been thoroughly studied, and it has been shown that 176 proteins of the S. cerevisiae mitochondria change while shifting from the fermentation type of metabolism (glucose, galactose) to the respiratory one (lactate) [32].
Analysis of the dynamics of the respiratory activity in E. magnusii mitochondria using the “oxidative” glycerol showed that it was maintained at a high level during the experiment (Table 1). It should be noted that the coupling parameters a bit decreased, however, the overall mitochondria functions kept up at a high level. The mitochondria AO is activated in the 96- and 168-h growth phases. The results agreed well with our published data on the dynamics of the ROS generation with the maximum in the 96-h growth stage [22]. Thus, the high ROS level in our studies could provoke the induction of the alternative cyanide-resistant pathway, which, in turn, is an element of the antioxidant defense system. This was shown in some papers [33,34,35]. The cyanide-resistant pathway of electron transport is not known to be related to energy storage and leads to a decrease in the ROS generation in the respiratory system, reducing the impact of the stress on the cell. Thus, this pathway induction is one of the ways for the cell to avoid excessive ROS generation under oxidative stress [36,37]. A large amount of storage lipids in the mitochondria, namely FFAs and DAGs, are considered as the second aspect of the high adaptation of E. magnusii upon long-lasting cultivation (Figure 3A,B). Abundant Lb in the yeast cells in the logarithmic (5–6 per a cell) and early stationary growth phases (6–7 per a cell), forming a structural complex with the mitochondria and nucleus (Figure 7A,B) testify to this.
The protective role of storage lipids, particularly TAGs and unsaturated FAs, is well known. TAGs can inhibit the yeast chronological ageing due to their accumulation in the Lb, which allows most of the unsaturated FAs to be deposited in TAGs by esterification [16,38]. In addition, the esterification of unsaturated FAs into TAGs slows down yeast chronological ageing by eliciting the liponecrotic cells. Some neutral lipids serve as a source of energy and precursors for membrane lipids synthesis [39]. The “model of secretory vesicles” based on the development of Lb from the secretory vesicles filled with TAGs is one of the possible models for forming Lb in a yeast cell. Lbs are usually about 300–400 nm in diameter and covered with a PL monolayer containing few proteins [39], mainly the enzymes of lipid metabolism [40]. Of note, the ratio of TAGs to ESt in Lbs from S. cerevisiae is usually 1:1 [41], and their TAGs core is surrounded by several ESt envelopes [42].
In our studies, we found TAGs as a minority (about 4% of the total lipids) only in the mitochondria of the logarithmic growth stage (Figure 2A). During cultivation, they were replaced by FFAs with the highest level in the 24-h stage. DAGs kept up at about the same level (about 10–15%) throughout the experiment. It is probable that such an alteration in the storage lipids composition in the mitochondria is due to the depletion of the storage lipid resource during growth. In a yeast cell, there are three main pathways for synthesis of DAGs: (1) PA removal by phosphatidate phosphatase (PAH1); (2) degradation of phospholipids by phospholipases (LRO1, DGA1, ARE1/2); and (3) deacetylation of TAGs (TGL2/3/4/5, AYR1) [39]. We suppose that upon intensive growth, the third pathway of DAGs formation seems preferable, taking into account the disappearance of TAGs in the stationary growth phase.
At the same time, the high FFAs level in the E. magnusii mitochondria could be related to the presence of a minority of ESt (Figure 2A). The FFAs synthesis in yeast occurs via three main pathways: (1) de novo synthesis, (2) the complex and storage lipid degradation, and (3) external uptake [39]. Taking our data altogether, including the growing conditions of E. magnusii, we posit that in our experiments, the FFAs synthesis occurs de novo in the cytosol and mitochondria with a concurrent elongation and desaturation in the ER. The initial stage of the FFA synthesis is triggered by the acetyl-CoA carboxylase (the cytosolic enzyme is encoded by ACC1, the mitochondrial one is by HFA1). In this reaction, acetyl-CoA is carboxylated and forms malonyl-CoA serving as a two-carbon building block for the next FFAs synthesis reactions [39].
CL performs a lot of cell functions, being associated with all the major proteins of the mitochondrial respiratory system, and thereby increases the efficacy of the electron flux and the ADP/ATP exchange [40]. This PL corrects the catalytic activity and stability of the interactive proteins [41], is crucial for the biogenesis of mitochondria proteins [42], promotes mitochondrial fission/fusion [38], and participates in the cristae structure and morphology formation [43]. According to some researchers’ data [43,44], the CL amount in the mitochondrial fraction of S. cerevisiae reaches 7.2% of the total membrane PL one, while for the mitochondria from E. magnusii, its level was much higher. In the logarithmic growth stage, the CL fraction made up about 50%, and in the stationary ones, it was not less than 18–20% (Figure 3A). It is probable that such a permanently high level of the CL fraction provides the high mitochondrial activity. In 2012, Rostovtseva and Bezrukov [45] showed that CL-rich areas of the outer mitochondrial membrane exhibited a higher activity of the mitochondrial VDAC porin involved in eliminating the ROS from the mitochondria. The CL fatty acids composition impacts VDAC activity greatly. This fact can be considered as the third most important point of the lipid composition adaptation in the yeast mitochondrial upon long-term cultivation.
Nevertheless, it is noteworthy that the PLs composition of the mitochondria in E. magnusii differs significantly from that in Saccharomycetes, where the dominating PLs fractions were PC, PE, and PI. Their shares made up 40.4% (PC), 26.7% (PE), and 14.6% (PI) [46,47]. In the E. magnusii mitochondria, these fractions are not dominating and reach no more than 10–20% of the total PLs amount (Figure 3A). However, among the major components, besides the CL fraction, the St share made up 40% in some samples. St are essential for supporting membrane integrity and eukaryotic cell viability. Taking into account our results on the “LB + MITO + Nucleus” complex in E. magnusii cells (Figure 7), we could speculate that the St fraction plays a crucial role in the functional interaction of the organelles upon ageing (Figure 2F–D).
Finally, the composition of FFAs in PLs is another important point of the lipid profile adaptation in the yeast mitochondria to the ageing processes. The main findings while assaying the FFAs composition of the mitochondria membrane lipids upon ageing were: (1) a smooth increase in the level of the palmitic acid (C16:0) against a fall in the palmitoleic acid (C16:1); (2) a gradual increase in the oleic acid amount (C18:1) with a sharp drop in the 168-h growth phase; and (3) a significant increase in the stearic acid level (C18:0) with a simultaneous decrease in the linoleic acid level (C18:2) throughout the whole experiment (Figure 5A).
Earlier, Kieliszek et al. [48] and his team showed a significant increase in the margarine (C17:0) and heptadecenoic (C17:1) acids level in the Candida utilis yeast grown either using 5% glycerol as a carbon source or enriched with selenium (20 mg/L) by two times and by 25%, respectively. Additionally, abundant margarine (C17:0; 12.19%) and heptadecenoic (C17:1; 9.31%) FAs were found in the Yarrowia lipolytica yeast when it was cultivated in batches using glycerol as a carbon source. Our findings showed that in the extremophilic Y. lipolytica cells under alkaline stress, the CL fraction had similar changes, namely the amount of saturated acyl residues in it increased [49]. An increase in the saturated FAs amount in the mitochondria of the culture under stress is likely to provide the integrity and rigidity of the membranes according to the homeoviscous adaptation hypothesis, which suggests these changes in the membrane lipid profile should facilitate its necessary fluidity [50].

4. Materials and Methods

4.1. Yeast Strain and Culture Conditions

E. magnusii yeast VKM Y261 strain was grown in batches of 100 mL in glycerol- (1%) containing media of the following composition (g/l): MgSO4-0.5, (NH4)2SO4-0.3, KH2PO4-8.6, NaCl-0.1, CaCl2-0.05, yeast extract–2.0, L-histidine–2.75 mg, L-methionine–2.75 mg, and L-tryptophan–2.75 mg at 28 °C as described previously [51]. Absorbance was assessed in cell suspension at the wavelength of 590 nm (A590) using a Specol-11 spectrophotometer (Carl Zeiss, Oberkochen, Germany). Cells were harvested at different stages of growth: logarithmic (A590 = 2.6–2.7), early stationary (24 h of growth, A590 = 4.0–4.1), late stationary (48 h of growth, A590 = 4.5–4.6), deep stationary 1 (96 h of growth, A590 = 4.4–4.7), deep stationary 2 (168 h of growth, A590 = 4.4–4.7).

4.2. Potential-Dependent Staining

Potential-dependent staining of mitochondria in the E. magnusii cells raised in the different growth phase by JC-1. Cells were incubated with 0.5 µM JC-1 and examined in 0, 15, 20, and 30 min. Incubation medium contained 0.01 M PBS, pH 7.4; 1% glycerol or glucose, respectively. Regions of high mitochondrial polarization are indicated by red fluorescence due to the concentrated dye. To examine the JC-1-stained preparations, filters 02, 15 (Zeiss, Oberkochen, Germany) were used (magnification ×100). The photos were taken using an AxioCam MRC camera (Microvisioneer, Esslingen am Neckar, Germany)

4.3. Staining with Neutral Red

Yeast cells were suspended in PBS, and a 200 µL sample of the cell suspension was mixed with 100 µL neutral red (0.1 mg/mL stock solution, dissolved in a 2% dihydrate sodium citrate solution) and incubated for 5 min at room temperature. Viability was examined under a light microscope using Gorjaev’s chamber (×400) from at least 1.000 cells in one biological replicate. Viable cells were colorless, and dead ones were red.

4.4. Transmission Electron Microscopy (TEM)

TEM analysis of untreated E. magnusii yeast cells was performed as described previously [15]. Briefly, the yeast cells were raised in the logarithmic or stationary (24 h) growth phase, precipitated, fixed with 2.5% glutaraldehyde in 0.1 M sodium phosphate buffer (pH 7.2) for 2 h, and then post-fixed in 1% OsO4 for an hour at room temperature. After dehydration, the samples were embedded in Epon 812. Ultrathin sections were prepared with an LKB-8800 ultratome using diamond knives. Thereafter, the sections were stained with uranyl acetate for 60 min and post-stained as described previously, and examined with a Jeol (JEM-100B) and Hitachi U-12 electron microscopes (Hitachi, Tokyo, Japan).

4.5. Isolation of Mitochondria

Mitochondria were isolated using the method described in [52] with minor modifications. The mitochondria thus obtained met all known criteria of physiological intactness, as inferred from high respiratory rates and ADP/O ratios close to their theoretically expected maxima. Mitochondria were fully active for at least 4 h after being isolated when kept on ice. Briefly, cells were harvested at different growth phases, washed twice with ice-cold water, resuspended (0.1 g wet cells/mL) in pre-spheroplast buffer (50 mM Tris-HCl buffer; pH 8.6, 4 mM dithiothreitol), incubated at room temperature for 10–15 min, then diluted with ice-cold water, pelleted at 3000× g for 10 min, washed twice to remove excess dithiothreitol, and incubated at 28 °C using gentle stirring for 15–20 min in spheroplast buffer (10 mM HEPES-buffer, pH 7.2, 1.1 M sorbitol) with Novozym 20 T from Trichoderma harzianum (Sigma-Aldrich, St. Louis, MO, USA) (2.5 mg/g cells) and lytic enzymes from snail gut juice (50 mg/g cells). Spheroplast formation was monitored by measuring the osmotic fragility in distilled water. The spheroplasts were rapidly cooled, pelleted by centrifugation at 3.000× g for 10 min, washed gently twice in post-spheroplast buffer (1.2 M sorbitol, 5 mM MgSO4, pH adjusted to 7.2), resuspended (0.1 g wet cells/mL) in grinding buffer (10 mM Tris-HCl, pH 7.2, containing 0.4 M mannitol, 1 mM EDTA, 0.05 mM EGTA, and 4 mg/mL BSA), and disrupted in an all-glass Dounce homogenizer (Kontes, Vineland, NJ, USA) with a low clearance pestle. The suspension was diluted with isolation buffer (10 mM Tris-HCl, pH 7.2, 0.6 M mannitol, 0.05 mM EDTA, 0.05 mM EGTA, and 4 mg/mL BSA) and centrifuged at 2000× g for 10 min. The supernatant was centrifuged once more at 7000× g for 20 min. The resulting pellet was washed in 10 mM Tris-HCl; pH 7.2, containing 0.6 M mannitol and 4 mg/mL BSA, resuspended in a smaller volume of the same buffer, and used immediately.
Mitochondrial protein was assayed by the method of Bradford with bovine serum albumin as the standard.

4.6. Respiration Assessment

Oxygen consumption by the yeast cells was assessed in vitro at 25 °C using electrodes covered by fluoroplastic film at a constant potential of 660 mV. Analysis of respiratory activity was performed using a multichannel microelectrode polarograph with data-analysis software Record-4 (Institute of Cell Biophysics of the Russian Academy of Sciences, Puschino, Russia). Oxygen consumption in mitochondrial suspensions was monitored polarographically with a Clark-type electrode in a medium containing 0.6 M mannitol, 1 mM Tris phosphate (pH 7.4), 1 mM EDTA, 20 mM pyruvate, 5 mM malate, and mitochondria corresponding to 0.4 mg protein/mL. All shown data traces are representative of four to six replicates.

4.7. Preparation and Analysis of Lipids

The lipids were extracted from the mitochondria by the Nichols method described in [53], which involved extraction with isopropanol and the isopropanol–chloroform mixture (1:1 and 1:2) at 70 °C, evaporation in a rotary evaporator, and extraction of the residue with chloroform-methanol (1:1) supplemented with 5% sodium chloride solution and water to remove water-soluble substances. After separating the mixture with a vortex, we dried the chloroform layer by passing it through water-free sodium sulphate, evaporated, and desiccated with a vacuum pump. The resulting pellet dissolved in a small amount of chloroform-methanol (2:1) was stored at −21 °C. The composition of storage lipids was assayed using an ascending thin layer chromatography on glass plates with silica gel 60 (Merck KGaA, Darmstadt, Germany). To separate storage lipids, the hexane: sulphuric ether: acetic acid (85:15:1) system [54] was used. To separate PLs and SLs SI60 Silica thin layer chromatography plates were activated and developed in two dimensions, first with chloroform/methanol/water (65/25/4, by volume) and second with chloroform/acetone/methanol/acetic acid/water 50/20/10/10/5, by volume) [55]. The lipids (100–200 μg) were applied to a plate. Lipid quantities were determined using the following standards: PC (Sigma, Saint-Luis, MO, USA) for PLs, a glycoceramide mixture (Larodan, Solna, Sweden) for SLs, and ergosterol (Sigma, Saint-Luis, MO, USA) for St. Samples of glycoceramides (5 and 10 µg) and PC (10 and 20 µg) were applied on the plates in the second direction. To develop the stains, the chromatograms were sprayed with 5% sulfuric acid in ethanol, followed by heating up to 180 °C. Quantitative densitometric analysis of the lipids was performed using the Dens software package (Lenkhrom, Sankt Peterburg, Russia) in the linear approximation regime using the calibration curves constructed with the standard solutions. Lipid data are presented in μg/g mitochondrial protein. PLs were identified using individual markers and qualitative tests for amino groups (with ninhydrin), choline-containing phospholipids (with the Dragendorff reagent), and glycolipids (with α-naphthol). Neutral lipids were identified with individual markers for MAGs, DAGs, and TAGs, St (ergosterol), FFAs, and hydrocarbons (Sigma, Saint-Luis, MO, USA). SLs were detected in the glycolipid fraction by the saponification method [56].
To assess the FAs composition of PLs, separate PLs were isolated using TLC with two plates, eluted with chloroform/methanol (1/1, v/v) for a night. Then, the supernatant was decanted, evaporated, 1 mL toluene and 2 mL of 2.5% H2SO4 dissolved in methanol and kept for two hours at +70 °C. FAs methyl ethers were extracted with hexane, dried, and analyzed by a Kristall 5000.1 gas chromatograph (Chromatek, Moscow, Russia) using an Optima-240 (60 m × 0.25 mm) capillary column (Macherey-Nagel GmbH and Co., Dueren, Germany). The temperature program was set from +130 to +240 °C. Eluting FAs were identified using the Supelco 37 Component FAME Mix (a mixture of FA methyl esters) (Supelco, Bellefonte, PA, USA). The degree of unsaturation was calculated by the equation: Δ/mole = 1.0 × (% monoene)/100 + 2.0 × (% dienes)/100 + 3.0 × (% trienes)/100 [57].

4.8. Statistical analysis

The experiments were performed in biological triplicates with a standard error of less than 5%. The influence of pH and temperatures on soluble carbohydrates and lipids was estimated using one-way ANOVA with R (R Core Team 2016). The significance of differences between the mean values in each group was tested by Tukey’s test. Values were considered significant at p < 0.05.

5. Conclusions

The recent review by Medkour et al. [15], using the correlation profiling of lipidomes in various tissues of long- and short-lived mammalian species, stated the following tendencies of so-called “lipidomic signature” for increasing longevity and delayed ageing in mammals and humans: (1) A decrease in the degree of FAs unsaturation, which reduces both double bonds and the peroxidation indices of various lipid classes. (2) Declined concentrations of long-chain FFAs. (3) An increased ratio of monounsaturated (MUFA) to polyunsaturated (PUFA) FAs. (4) Decreased levels of some SLs, some LPCs, and PCs, as well as highly polyunsaturated TAGs and DAGs (5). An increased amount of some sphingomyelins and cholesterol esters, as well as TAGs and DAGs with low IHD. The authors concluded that identifying the key trends in the lipidomic signature is an essential first step towards the detection of lipid biomarkers for healthy ageing and extended life span. However, whether any of the trends mentioned above have a cause-and-effect relationship in slowing the ageing process and increase in life expectancy should be determined. Summarizing the obtained results, we can conclude that, with respect to yeast mitochondria, the first and second statements, and partially the fifth one, are doubtlessly true for the long-lasting cultivation and the initial stages of ageing in the lower eukaryotes using an “oxidative” type glycerol. Moreover, the list of the factors favoring a long lifespan should include some other physiological parameters of yeast cells. The mitochondrial AO activity induced in the early stationary growth phase and high mitochondrial activity maintaining intensive mitochondrial respiration, which in turn determines the ATP production and physiological doses of ROS that should be added to the list of the trends providing increased longevity.

Supplementary Materials

The following are available online at https://www.mdpi.com/article/10.3390/app11094069/s1. Table S1: The dinamics of different cell types, Figure S1: Micro images of transmission electron microscopy of the E. magnusii mitochondria fraction, Figure S2: A - Amperometric recording of oxygen consumption by the E. magnusii mitochondria respiring on pyruvate + malate. Numbers adjacent to traces are respiration rates in ng-atoms of O/min/mg of mitochondrial protein. The incubation medium contained 0.6 M mannitol, 0.2 mM Tris-phosphate, pH 7.2; 20 mM pyruvate + 5 mM malate as respiratory substrates, and mitochondria corresponding to 0.5 mg mitochondrial protein, added at MITO. The frame in the Figure (a) shows the curve of oxygen consumption without substrate application (endogenous respiration). B - Recording of ΔΨ generated by the E. magnusii mitochondria respiring on a 20 mM pyruvate + 5 mM malate. The incubation medium contained 0.4 M mannitol, 0.1 M KCl, 20 mM Tris-acetate, 0.4 mg of mitochondria protein, pH 7.4. C – the demonstration of the adenilate kinase activity in the intact mitochondria (the incubation medium composition is as in A), Table S2: The phosphorylating activities of the mitochondria using different substrates, Figure S3: Effect of erythromycin (A) and ethidium bromide (B) on the E. magnusii cell growth.

Author Contributions

Conceptualization: E.P.I.; methodology: E.P.I., N.N.G., and D.I.D.; validation: V.M.T.; formal analysis: M.K.; resources: E.P.I. and V.M.T.; writing—original draft preparation: E.P.I.; writing—review and editing: M.K.; supervision: Y.I.D.; project administration: E.P.I. and Y.I.D. All authors have read and agreed to the published version of the manuscript.

Funding

This research received no external funding.

Institutional Review Board Statement

Not applicable.

Informed Consent Statement

Not applicable.

Data Availability Statement

Not applicable.

Conflicts of Interest

The authors declare no conflict of interest.

References

  1. Spinelli, J.B.; Haigis, M.C. The multifaceted contributions of mitochondria to cellular metabolism. Nat. Cell Biol. 2018, 20, 745–754. [Google Scholar] [CrossRef]
  2. Rogov, A.G.; Goleva, T.N.; Epremyan, K.K.; Kireev, I.I.; Zvyagilskaya, R.A. Propagation of Mitochondria-Derived Reactive Oxygen Species within the Dipodascus magnusii Cells. Antioxidants 2021, 10, 120. [Google Scholar] [CrossRef]
  3. Nunnari, J.; Suomalainen, A. Mitochondria: In sickness and in health. Cell 2012, 148, 1145–1159. [Google Scholar] [CrossRef] [PubMed] [Green Version]
  4. Annesley, S.J.; Fisher, P.R. Mitochondria in Health and Disease. Cells 2019, 8, 680. [Google Scholar] [CrossRef] [PubMed] [Green Version]
  5. López-Otín, C.; Blasco, M.A.; Partridge, L.; Serrano, M.; Kroemer, G. The hallmarks of aging. Cell 2013, 153, 1194–1217. [Google Scholar] [CrossRef] [PubMed] [Green Version]
  6. Harman, D. Aging: Overview. Ann. N. Y. Acad. Sci. 2001, 928, 1–21. [Google Scholar] [CrossRef] [PubMed]
  7. Jang, J.Y.; Blum, A.; Liu, J.; Finkel, T. The role of mitochondria in aging. J. Clin. Investig. 2018, 128, 3662–3670. [Google Scholar] [CrossRef] [PubMed] [Green Version]
  8. Akbari, M.; Kirkwood, T.B.L.; Bohr, V.A. Mitochondria in the signaling pathways that control longevity and health span. Ageing Res. Rev. 2019, 54, 100940. [Google Scholar] [CrossRef]
  9. Eleutherio, E.; Brasil, A.A.; França, M.B.; de Almeida, D.S.G.; Rona, G.B.; Magalhães, R.S.S. Oxidative stress and aging: Learning from yeast lessons. Fungal Biol. 2018, 122, 514–525. [Google Scholar] [CrossRef]
  10. Kaeberlein, M. Lessons on longevity from budding yeast. Nature 2010, 464, 513–519. [Google Scholar] [CrossRef] [PubMed] [Green Version]
  11. Oliveira, A.V.; Vilaça, R.; Santos, C.N.; Costa, V.; Menezes, R. Exploring the power of yeast to model aging and age-related neurodegenerative disorders. Biogerontology 2017, 18, 3–34. [Google Scholar] [CrossRef]
  12. Herrero, E.; Ros, J.; Bel, G.; Cabiscol, E. Redox control and oxidative stress in yeast cells. Biochim. Biophys. Acta 2008, 1780, 1217–1235. [Google Scholar] [CrossRef] [PubMed]
  13. Huang, X.; Withers, B.R.; Dickson, R.C. Sphingolipids and lifespan regulation. Biochim. Biophys. Acta 2014, 1841, 657–664. [Google Scholar] [CrossRef] [PubMed] [Green Version]
  14. Jazwinski, S.M. Mitochondria to nucleus signaling and the role of ceramide in its integration into the suite of cell quality control processes during aging. Ageing Res. Rev. 2015, 23, 67–74. [Google Scholar] [CrossRef] [PubMed] [Green Version]
  15. Medkour, Y.; Dakik, P.; McAuley, M.; Mohammad, K.; Mitrofanova, D.; Titorenko, V.I. Mechanisms underlying the essential role of mitochondrial membrane lipids in yeast chronological aging. Oxid. Med. Cell. Longev. 2017, 2017, 2916985. [Google Scholar] [CrossRef] [PubMed] [Green Version]
  16. Handee, W.; Li, X.; Hall, K.W.; Deng, X.; Li, P.; Benning, C.; Williams, B.L.; Kuo, M.-H. An energy-independent pro-longevity function of triacylglycerol in yeast. PLoS Genet. 2016, 12, e1005878. [Google Scholar] [CrossRef] [Green Version]
  17. Beach, A.; Richard, V.R.; Leonov, A.; Burstein, M.T.; Bourque, S.D.; Koupaki, O.; Juneau, M.; Feldman, R.; Iouk, T.; Titorenko, V.I. Mitochondrial membrane lipidome defines yeast longevity. Aging 2013, 5, 551–574. [Google Scholar] [CrossRef] [PubMed] [Green Version]
  18. Burstein, M.T.; Titorenko, V.I. A mitochondrially targeted compound delays aging in yeast through a mechanism linking mitochondrial membrane lipid metabolism to mito-chondrial redox biology. Redox Biol. 2014, 2, 305–307. [Google Scholar] [CrossRef] [PubMed] [Green Version]
  19. Leonov, A.; Arlia-Ciommo, A.; Bourque, S.D.; Koupaki, O.; Kyryakov, P.; Dakik, P.; McAuley, M.; Medkour, Y.; Mohammad, K.; Di Maulo, T.; et al. Specific changes in mitochondrial lipidome alter mitochondrial proteome and increase the geroprotective efficiency of lithocholic acid in chronologically aging yeast. Oncotarget 2017, 8, 30672–30691. [Google Scholar] [CrossRef]
  20. Roberts, G.G.; Hudson, A.P. Rsf1p is required for an efficient metabolic shift from fermentative to glycerol-based respiratory growth in S. cerevisiae. Yeast 2009, 26, 95–110. [Google Scholar] [CrossRef] [Green Version]
  21. Deryabina, Y.; Isakova, E.; Sekova, V.; Antipov, A.; Saris, N.E. Inhibition of free radical scavenging enzymes affects mitochondrial membrane permeability transition during growth and aging of yeast cells. J. Bioenerg. Biomembr. 2014, 46, 479–492. [Google Scholar] [CrossRef] [PubMed]
  22. Isakova, E.P.; Matushkina, I.N.; Popova, T.N.; Dergacheva, D.I.; Gessler, N.N.; Klein, O.I.; Semenikhina, A.V.; Deryabina, Y.I.; La Porta, N.; Saris, N.L. Metabolic remodeling during long-lasting cultivation of the Endomyces magnusii yeast on oxidative and fermentative substrates. Microorganisms 2020, 8, 91. [Google Scholar] [CrossRef] [PubMed] [Green Version]
  23. Werner-Washburne, M.; Roy, S.; Davidson, G.S. Aging and the survival of quiescent and non-quiescent cells in yeast stationary-phase cultures. In Aging Research in Yeast; Subcellular Biochemistry; Breitenbach, M., Jazwinski, S., Laun, P., Eds.; Springer: Dordrecht, The Netherlands, 2011; Volume 57. [Google Scholar] [CrossRef]
  24. Polcic, P.; Sabová, L.; Kolarov, J. Fatty acids induced uncoupling of Saccharomyces cerevisiae mitochondria requires an intact ADP/ATP carrier. FEBS Lett. 1997, 412, 207–210. [Google Scholar] [CrossRef] [Green Version]
  25. Medentsev, A.G.; Arinbasarova, A.Y.; Akimenko, V.K. Regulation and physiological role of cyanide-resistant oxidases in fungi and plants. Biochemistry 1999, 64, 1230–1243. [Google Scholar]
  26. Rogov, A.G.; Zvyagilskaya, R.A. Physiological role of alternative oxidase (from yeasts to plants). Biochemistry 2015, 80, 400–407. [Google Scholar] [CrossRef] [PubMed]
  27. Bahr, J.T.; Bonner, W.D., Jr. Cyanide-insensitive respiration. II. Control of the alternate pathway. J. Biol. Chem. 1973, 248, 3446–3450. [Google Scholar] [CrossRef]
  28. Zelenshchikova, V.A.; Burbaev, D.S.; Zviagil’skaia, R.A. Reverse electron transfer in mitochondria of the yeast Endomyces magnusii grown on glycerol. Biokhimiia 1983, 48, 186–192. [Google Scholar]
  29. DeRisi, J.L.; Iyer, V.R.; Brown, P.O. Exploring the metabolic and genetic control of gene expression on a genomic scale. Science 1997, 278, 680–686. [Google Scholar] [CrossRef] [PubMed] [Green Version]
  30. Roberts, G.G.; Hudson, A.P. Transcriptome profiling of Saccharomyces cerevisiae during a transition from fermentative to glycerol-based respiratory growth reveals extensive metabolic and structural remodeling. Mol. Genet. Genom. 2006, 276, 170–186. [Google Scholar] [CrossRef]
  31. Ohlmeier, S.; Kastaniotis, A.J.; Hiltunen, J.K.; Bergmann, U. The yeast mitochondrial proteome, a study of fermentative and respiratory growth. J. Biol. Chem. 2004, 279, 3956–3979. [Google Scholar] [CrossRef] [Green Version]
  32. Renvoisé, M.; Bonhomme, L.; Davanture, M.; Valot, B.; Zivy, M.; Lemaire, C. Quantitative variations of the mitochondrial proteome and phosphoproteome during fermentative and respiratory growth in Saccharomyces cerevisiae. J. Proteom. 2014, 106, 140–150. [Google Scholar] [CrossRef] [Green Version]
  33. Veiga, A.; Arrabaça, J.D.; Loureiro-Dias, M.C. Cyanide-resistant respiration, a very frequent metabolic pathway in yeasts. FEMS Yeast Res. 2003, 3, 239–245. [Google Scholar] [CrossRef] [Green Version]
  34. Vanlerberghe, G.C. Alternative oxidase: A mitochondrial respiratory pathway to maintain metabolic and signaling homeostasis during abiotic and biotic stress in plants. Int. J. Mol. Sci. 2013, 14, 6805–6847. [Google Scholar] [CrossRef] [PubMed]
  35. Saha, B.; Borovskii, G.; Panda, S.K. Alternative oxidase and plant stress tolerance. Plant Signal Behav. 2016, 11, e1256530. [Google Scholar] [CrossRef]
  36. Van Aken, O.; Giraud, E.; Clifton, R.; Whela, J. Alternative oxidase: A target and regulator of stress responses. Physiol. Plant 2009, 137, 354–361. [Google Scholar] [CrossRef]
  37. Lushchak, V.I. Adaptive response to oxidative stress: Bacteria, fungi, plants, and animals. Comp. Biochem. Physiol. C Toxicol. Pharmacol. 2011, 153, 175–190. [Google Scholar] [CrossRef] [PubMed]
  38. Li, X.; Handee, W.; Kuo, M.H. The slim, the fat, and the obese: Guess who lives the longest? Curr. Genet. 2017, 63, 43–49. [Google Scholar] [CrossRef]
  39. Klug, L.; Daum, G. Yeast lipid metabolism at a glance. FEMS Yeast Res. 2014, 14, 369–388. [Google Scholar] [CrossRef] [PubMed] [Green Version]
  40. Baile, M.G.; Lu, Y.W.; Claypool, S.M. The topology and regulation of cardiolipin biosynthesis and remodeling in yeast. Chem. Phys. Lipids 2014, 179, 25–31. [Google Scholar] [CrossRef] [Green Version]
  41. Wenz, T.; Hielscher, R.; Hellwig, P.; Schagger, H.; Richers, S.; Hunte, C. Role of phospholipids in respiratory cytochrome bc (1) complex catalysis and supercomplex formation. Biochim. Biophys. Acta 2009, 1787, 609–616. [Google Scholar] [CrossRef] [Green Version]
  42. Joshi, A.S.; Zhou, J.; Gohil, V.M.; Chen, S.; Greenberg, M.L. Cellular functions of cardiolipin in yeast. Biochim. Biophys. Acta 2009, 1793, 212–218. [Google Scholar] [CrossRef] [Green Version]
  43. Joshi, A.S.; Thompson, M.N.; Fei, N.; Huttemann, M.; Greenberg, M.L. Cardiolipin and mitochondrial phosphatidylethanolamine have overlapping functions in mitochondrial fusion in Saccharomyces cerevisiae. J. Biol. Chem. 2012, 287, 17589–17597. [Google Scholar] [CrossRef] [Green Version]
  44. Mileykovskaya, E.; Dowhan, W. Cardiolipin membrane domains in prokaryotes and eukaryotes. Biochim. Biophys. Acta 2009, 1788, 2084–2091. [Google Scholar] [CrossRef] [Green Version]
  45. Rostovtseva, T.K.; Gurnev, P.A.; Chen, M.; Bezrukov, S.M. Membrane lipid composition regulates tubulin interaction with mitochondrial voltage-dependent anion channel. J. Biol. Chem. 2012, 287, 29589–29598. [Google Scholar] [CrossRef] [PubMed] [Green Version]
  46. Zinser, E.; Sperka-Gottlieb, C.D.; Fasch, E.V.; Kohlwein, S.D.; Paltauf, F.; Daum, G. Phospholipid synthesis and lipid composition of subcellular membranes in the unicellular eukaryote Saccharomyces cerevisiae. J. Bacteriol. 1991, 173, 2026–2034. [Google Scholar] [CrossRef] [PubMed] [Green Version]
  47. Horvath, S.E.; Wagner, A.; Steyrer, E.; Daum, G. Metabolic link between phosphatidylethanolamine and triacylglycerol metabolism in the yeast Saccharomyces cerevisiae. Biochim. Biophys. Acta 2011, 1811, 1030–1037. [Google Scholar] [CrossRef] [PubMed] [Green Version]
  48. Kieliszek, M.; Błażejak, S.; Bzducha-Wróbel, A.; Kot, A.M. Effect of selenium on lipid and amino acid metabolism in yeast cells. Biol. Trace Elem. Res. 2019, 187, 316–327. [Google Scholar] [CrossRef] [Green Version]
  49. Sekova, V.Y.; Dergacheva, D.I.; Isakova, E.P.; Gessler, N.N.; Tereshina, V.M.; Deryabina, Y.I. Soluble sugar and lipid readjustments in the Yarrowia lipolytica yeast at various temperatures and pH. Metabolites 2019, 9, 307. [Google Scholar] [CrossRef] [PubMed] [Green Version]
  50. Glatz, A.; Pilbat, A.M.; Németh, G.L.; Vince-Kontár, K.; Jósvay, K.; Hunya, Á.; Udvardy, A.; Gombos, I.; Péter, M.; Balogh, G.; et al. Involvement of small heat shock proteins, trehalose, and lipids in the thermal stress management in Schizosaccharomyces pombe. Cell Stress Chaperones 2016, 21, 327–333. [Google Scholar] [CrossRef] [PubMed] [Green Version]
  51. Deryabina, Y.I.; Zvyagilskaya, R.A. The Ca2+-Transport system of Yeast (Endomyces magnusii) mitochondria: Independent pathways for Ca2+ uptake and release. Biochemistry 2000, 65, 1352–1356. [Google Scholar] [CrossRef] [PubMed]
  52. Bazhenova, E.N.; Saris, N.E.; Zvyagilskaya, R.A. Stimulation of the yeast mitochondrial calcium uniporter by hypotonicity and by ruthenium red. Biochim. Biophys. Acta 1998, 1371, 96–100. [Google Scholar] [CrossRef] [Green Version]
  53. Nichols, B.W. Separation of the lipids of photosynthetic tissues: Improvements in analysis by thin-layer chromatography. Biochim. Biophys. Acta 1963, 70, 417–422. [Google Scholar] [CrossRef]
  54. Kates, M. Techniques of lipidology: Isolation, analysis and identifcation of lipids. In Laboratory Techniques in Biochemistry and Molecular Biology; Work, T.S., Work, E., Eds.; North-Holland: Amsterdam, The Netherlands, 1972; pp. 267–610. [Google Scholar]
  55. Benning, C.; Huang, Z.H.; Gage, D.A. Accumulation of a novel glycolipid and a betaine lipid in cells of Rhodobacter sphaeroides grown under phosphate limitation. Arch. Biochem. Biophys. 1995, 317, 103–111. [Google Scholar] [CrossRef] [PubMed]
  56. Kates, M. Techniques of Lipidology: Isolation, Analysis, and Identification of Lipids, 2nd ed.; Elsevier: Amsterdam, The Netherlands, 1988; Volume 464. [Google Scholar] [CrossRef]
  57. Weete, J.D. Introduction to fungal lipids. In Fungal Lipid Biochemistry; Kritchevsky, D., Ed.; Springer: Berlin/Heidelberg, Germany, 1974. [Google Scholar]
Figure 1. The growth curve of E. magnusii yeast in glycerol-containing medium grown for 260 h. Absorbance was assayed every two hours in cell suspension at the wavelength of 590 nm. The curve is representative of four biological experiments. (The figure was partially used in the article [Microorganisms 2020, 8, 91; doi:10.3390/microorganisms8010091]).
Applsci 11 04069 g001
Figure 2. Micro images of the E. magnusii cells in the logarithmic (A,C,E,G) and late stationary (B,D,F,H) growth stages. (A,B)—The cells were stained with neutral red; (C,D). Fluorescent micro-images of the cells, labelled with 0.3 μM DAPI for DNA. (E,F) the potential-dependent stain of the mitochondria in E. magnusii cells by 5 mM JC-1. The regions of high mitochondrial polarization are bright yellow due to the concentrated dye. The cells were examined after 30 min. The incubation medium contained 0.01 M phosphate buffer saline (PBS) and 1% glycerol, pH 7.4. To examine the Rh123-stained preparations, filters 02, 15 (Zeiss) were used (magnification 100×). Photos were taken using an AxioCam MRc camera. (G,H)-ultrastructure of E. magnusii cells. Nu—nucleus; V—vacuole; Mt–mitochondria; CW–cell wall.
Applsci 11 04069 g002
Figure 3. The storage lipid composition in E. magnusii yeast in the different growth phases during long-lasting cultivation. (A)—the share of each storage lipid fraction,%; TAGs—triacylglycerols; DAGs—diacylglycerols; FFAs—free fatty acids; ESt—sterol esters; Y1—unknown fraction (B)—the share of each storage lipid fraction (mg/g). a−h Means with the same letter did not differ significantly. Values are mean ± S.E.M from three independent experiments and three analytical replicates.
Applsci 11 04069 g003
Figure 4. Membrane lipid composition of the mitochondria from E. magnusii cells raised in the different growth phases upon ageing during the seven-day cultivation. (A)—the share of each membrane lipid fraction; PE—phosphatidylethanolamines; PC—phosphatidylcholines; CL—cardiolipins; PS—phosphatidylserine; LPE + PI—lysophosphatidylethanolamine + phosphatidylinositols; LPC—lysophosphatidylcholines; SL—sphingolipids; St—sterols; X1, X2—unknown; (B)—the total membrane lipid content. a–m Means with the same letter did not differ significantly.
Applsci 11 04069 g004
Figure 5. The unsaturation degree of the E.magnusii mitochondria from the cells raised in different growth phases (B). The unsaturation degree in the main PLs fractions of the E. magnusii mitochondria from the cells raised in different growth phases (A); PE— phosphatidylethanolamines; PC—phosphatidylcholines; CL—cardiolipins. a–h Means with the same letter did not differ significantly. Values are mean ± S.E.M from three independent experiments and three analytical induction replicates.
Applsci 11 04069 g005
Figure 6. Fatty acid composition of the main membrane PLs in E. magnusii mitochondria in the different growth phases (A); PE—phosphatidylethanolamines (B); PC—phosphatidylcholines (C); CL—cardiolipins (D); PA—phosphatidic acids fraction (E). Values are mean ± S.E.M from three independent experiments and three analytical replicates.
Applsci 11 04069 g006aApplsci 11 04069 g006bApplsci 11 04069 g006c
Figure 7. Image of E. magnusii yeast cells in the logarithmic (A) and early stationary growth phases (B). Nu—nucleus; Mt—mitochondria; Lb—lipid bodies.
Applsci 11 04069 g007aApplsci 11 04069 g007b
Table 1. Respiratory activity and the inhibitory analysis of the E. magnusii yeasts mitochondria in different growth phases upon ageing.
Time, hRespiration Rate, ng-Atom Consumed O per 1 mg of Protein
V41 *V3 **V42 *+KCN ***
Inhibition
(% of Control)
+KCN + SHAM ****
Inhibition
(% of Control)
1719.6 ± 0.63 f58.1 ± 0.08 b16.95 ± 1.23 f100100
2427.9 ± 1.68 f164.8 ± 1.82 c65.28 ± 4.67 e87.26100
4870.19 ± 1.68 e205.19 ± 1.82 b70.28 ± 4.67 e88.79100
96140.0 ± 14.14 cd311.18 ± 18.59 a139.26 ± 15.7 cd72.68100
16860.85 ± 4.6 e127.14 ± 18.13 d72.68 ± 14.18 e50.72100
* V41, V42-the respiration rate in the second state (initial respiration) before and after the phosphorylation cycle. ** V3-the respiration rate in state 3 (the phosphorylation after the ADP addition). *** KCN was added in the concentration of 4 mM. **** SHAM was added in the concentration of 2 mM. The incubation medium for the experiments contained 0.6 M mannitol, 1 mM Tris-phosphate (pH 7.4); 1 mM EDTA, 20 mM pyruvate, 5 mM malate, and mitochondria corresponding to 0.4 mg protein/mL. a–f Means with the same letter did not differ significantly. Values are mean ± S.E.M from five independent experiments and three analytical replicates.
Publisher’s Note: MDPI stays neutral with regard to jurisdictional claims in published maps and institutional affiliations.

