Article

Evaluation of Cracks on the Welding of Austenitic Stainless Steel Using Experimental and Numerical Techniques

1
IT-Based Real-Time NDT Center, Chosun University, Gwangju 61452, Korea
2
Department of Electronics Engineering, Chosun University, Gwangju 61452, Korea
3
Interdisciplinary Program in IT-Bio Convergence System, Chosun University, Gwangju 61452, Korea
*
Authors to whom correspondence should be addressed.
Appl. Sci. 2021, 11(5), 2182; https://doi.org/10.3390/app11052182
Submission received: 22 January 2021 / Revised: 22 February 2021 / Accepted: 25 February 2021 / Published: 2 March 2021
(This article belongs to the Special Issue Novel Approaches for Nondestructive Testing and Evaluation)

Abstract

:
This paper deals with investigation and characterization of weld circumferential thin cracks in austenitic stainless steel (AISI 304) pipe with eddy current nondestructive testing technique (EC-NDT). During welding process, the heat source applied to the AISI 304 was not uniform, accompanied by a change of the physical property. To take into consideration this change, the relative magnetic permeability was considered as a gradiently changed variable in the weld and the heat affected zone (HAZ), which was generated by the Monte Carlo Method based on pseudo random number generation (PRNG). Numerical simulations were performed by means of MATLAB software using 2D finite element method to solve the problem. To verify, results from the modeling works were conducted and contrasted with findings from experimental ones. Indeed, the results of comparison agreed well. In addition, they show that considering this changing of this magnetic property allows distinguishing the thin cracks in the weld area.

1. Introduction

The austenitic stainless steel 304 is suitable for large field applications, such as heat exchangers, power plants, oil and gas industry, chemical engineering and especially in nuclear power plants, because of its useful characteristics, such as high temperature service and environment, corrosion resistance, weldability, formability and mechanical properties [1,2]. Pipes are exposed to a variety of environmental influences, and high temperature and high pressure that cause severe corrosive and environmental deterioration as results in fatigue cracks and flaws in pipes that can appear and grow. A pipe failure can lead to serious ecological disasters, human casualties and financial loss. To predict and avoid such threats and maintain the safety and integrity of pipes, periodic nondestructive testing inspections are necessary [3,4,5].
Eddy-current testing (ECT) is adapted to solve such problems. Applied to inspect conductive and ferromagnetic devices to examine their structural integrity [6,7,8,9], it has certain advantages in terms of safety as a testing tool—rapid inspection, high sensitivity, and minimizing contact with the specimen. It is efficiently associated with automatic detection in various work [10,11]. The ECT technique is frequently used for nondestructive defect inspection of tubes welders and circumferential welds [5,12,13].
Many welding processes are presented in several papers; they require a lot of effort and experiments to better understand the parameters [14,15,16]. The finite element method associated with experimental investigations is a powerful tool to identify and analyze welding parameters and to obtain an optimal solution in a short time [17]. Usually, in simulation work, the mathematical model of the problem to be treated contains all the necessary information.
In this work, a study of weld circumferential thin cracks in AISI 304 pipe was carried out. The used AISI 304 pipe was joined by gas tungsten arc welding (GTAW).
Several previous studies focused on crack detection and characterization of cracks in austenitic stainless steel, for instance, detection and evaluation of weld defects using 3-dimension tunnel, and show excellent inspection results for a weld in stainless steel [18]. Saito et al. [19] described weld defects and evaluation of weld quality and how to achieve weld quality improvement. Park et al. [20] investigated cracking behavior of AISI 304 exposed to high temperature and revealed that strain-induced martensitic transformation in stainless steel has a negative effect on stress corrosion effect. Hu et al. [21] studied microstructure residual stress and corrosion cracking of repair welding on 304 AISI by experiment and simulation, and found that repair welding in 304 stainless steel is recommended no more than two times. All these studies are related to the evaluation of defects in using different methods.
However, there are few considerations of delta-ferrite structures, which show ferromagnetic properties, inspite of that the austenitic stainless steel AISI 304 around the welding for analyzing numerical and experimental studies. AISI 304 is classified as paramagnetic material with μ r = 1 + X m , where relative magnetic permeability μ r and the magnetic susceptibility X m , are 1 and 0, respectively. However, after heat treatment (heat welding), the property of AISI 304 as paramagnetic material will disappear and it will become a partial ferromagnetic material named delta-ferrite structure, which results in the change of the relative magnetic permeability at each region μ r 1 ,with high permeability in the weld area, low permeability in the raw material μ r = 1 and decreasing permeability in the HAZ μ r = 3 1 [22,23,24]. Therefore, it can be considered that the assembled pipe has three regions with three magnetic permeabilities. Modeling this change on this input parameter and characterizing its consequence on the output response under MATLAB, in order to be able to both reproduce the distribution of this parameter and to compare this response with experimental, is an important step of this work. For this purpose, the relative magnetic permeability is gradiently distributed in the weld and the HAZ regions according to the experimental measurement. The Monte Carlo method based on pseudo random number generation (PRNG) is used and then coupled with the finite element method. The numerical analysis using the Stochastic Finite Element Method (SFEM) that models the eddy-current testing of the problem is presented. A comparison against constant relative permeability and experimental ones was done, and the results show that it is important to consider this change in magnetic property of the material.

2. Materials

Figure 1 shows the experiment system. It consists mainly of two joined AISI 304 pipe test samples, a rotating motorized stage platform, an ECT system, a data acquisition instrument (DAQ) and a laptop computer for data control and storage. The ECT system is an Olympus Nortek 500 eddy-current flaw detector, which controls AC power supply and frequency. The output signal obtained by the ECT equipment is transmitted to a laptop computer via an analog-to-digital converter. Absolute probes with different frequency ranges were fixed and the pipe was mounted and precisely positioned on the rotary stage platform, which is controlled by software based on the LabVIEW program and rotated at a speed of 21 mm/s and scan interval of 1mm. The experiments were performed by an ASNT Level II qualified examiner by following ISO 7912 instructions [25].
Artificial cracks of the same length (5 mm) and width (0.2 mm) with different depths (0.3 mm, 0.5 mm and 1.0 mm) referred as (d0.3, d0.5 and d1.0), respectively, were manufactured by a Sinker type ZNC electrical discharge machining in the weld area; they are spaced 7 mm apart, as given by Figure 2. In order not to influence the measurements, an appropriately sized ECT probe was used. The cracks position was intended to simulate the most frequent ones, which can occur during the welding process or during the pipe daily service. The geometrical and physical parameters are summarized in Table 1. Moreover, microscopic analyses of the width and length of these cracks are checked, and the depth is measured using digital calipers and presented in Figure 3 and Figure 4, respectively.

3. Global Equations and Parameters

3.1. Random Numbers Generation

Random numbers are useful in several different kinds of applications, such as simulation, statistics, machine learning, sampling and in other areas [26,27]—in this section according to the experimental measurement of the relative magnetic permeability, which is gradiently distributed in the heat affected zone (HAZ) and weld area due to the heat welding. To simulate this stochastic model, a source of randomness is required to reproduce the real distribution of the magnetic permeability in these concerned zones. A pseudo-random number is a best way to solve this problem, by generating a sequence of independent uniform variable real between 0 and 1 or integer. Various pseudo-random number generators (PRNGs) exist, and the most popular random number generation technique is the linear congruential generator (LCG) for several reasons. LCGs are the most popular generators, implemented in the MATLAB programming software used, and have many properties; for instance, ease of use, reproducibility, uniformity, independence, large period and efficiency [28,29]. The main advantages of these properties are that they generate easily and directly pseudo-random numbers without storing them, memory savings, time savings and simulation control. A quick overview of the LCGs mainly used in computer programming is given; for more details, see references [30,31,32]. The LCGs are based on linear recursions in modular arithmetic. Their general form, represented by:
x n + 1 = ( a x n + c )   mod   m , n 0
here m > 0 is the modulus, a is the multiplier,   c is the increment and x 0 is the seed or the starting value;   0 a < m , 0 c < m ,   0   x 0 < m . Selection of the numbers m , a ,   c and x 0 is crucial for getting a random sequence of numbers.
After the step of generating pseudo-random numbers, apply to these numbers an appropriate transformation according to the number of elements contained in the surfaces of the studied areas obtained by finite element meshing. Then the algorithms are combined with the finite element code.

3.2. Electromagnetic Equation

The governing equations of the numerical model used in this paper are obtained with the consideration of assumptions that the conduction current is dominated, to describe electromagnetic eddy-current problems extracted from Maxwell’s equations, which describe the basics of electromagnetic theory given as follows [33,34]:
× H = J
× E = B t
J = J s σ   A t
Using the relation B = μ H and the magnetic flux density potential B = A . After replacing we obtain the 2D electromagnetic harmonic equation in terms of the Magnetic Vector Potential (MVP) with only the z direction component A ( 0 , 0 , A Z ) :
×   ( 1 μ ( × A Z ) ) j ω σ A Z = J S Z
where: J —the total current density, J S Z —the source current density, μ —is magnetic permeability in the specimen, HAZ and in the weld zone respectively, σ —is the electrical conductivity, ω —the angular frequency.
In the Heat affected zone and the weld zone, the magnetic permeability is noted with indices (1), (2) and given as, μ 1 = [ μ a μ T H A Z ] and μ 2 = [ μ a μ T w ] . THAZ and TW denote the total number of triangular elements obtained from the finite element meshing in the HAZ zone and weld area, respectively.
[ M ] + j ω [ N ] [ A ] = [ F ]
with: [ M ] —stiffness matrix, [ N ] —dynamic matrix, [ A ] —unknowns vector and [ F ] —source vector.

3.3. Impedance Computation

The presence of possible defects in the weld zone lead to a change in the physical characteristics, which results in the variation of the coil impedance. Several methods exist for impedance calculation; the difference lies in the choice of the state variable which has a direct relationship with the solution resulting from the numerical model and the configuration of the device to be studied. In this application the impedance Z is calculated from the MVP (the real and imaginary parts) as follows [35,36]:
R e ( Z ) = N 2 J   S 2 ω S .   2 π r   I m ( A )   d s
I m ( Z ) = N 2 J   S 2 ω S .   2 π r   R e ( A )   d s
with: N —coils number, S —surface of inductor coil, r —inductor radius.

4. Results and Discussion

In the current application, the numerical and experimental investigation of weld thin cracks in joined AISI 304 pipe were carried out, using SFEM code analysis implemented under MATLAB.
The pipe radius is 160 mm, far greater than the probe size, so the pipe wall can be considered as a conducting plate [37,38]. According to this, the studied problem is simplified and becomes two-dimensional (2D) in the (x, y) plane as shown in Figure 5.
The solving domain resolution concerns the studied electromagnetic device and the air; it is divided into six regions with different physical properties, with physical boundary conditions of homogeneous Dirichlet type applied at the fields of study. The scheme is illustrated in Figure 5, which shows that the mesh air domain that we have taken into consideration is large enough to contain the zone of influence of the probe, so that the emitted field is negligible at the border of the field of study.
The field of study is covered by finite element mesh as illustrated by Figure 6a. To reproduce the real geometry of the studied device and to approach the measurement results, it is discretized by subdividing it into subdomains, with 38,400 triangular elements and 19,269 nodes generated automatically. Eddy current distributes locally near the coil [39], to consider this fact in the simulation work. A remeshing is done at each probe displacement. This technique allows obtaining dense and fine mesh around the probe with good quality elements. The triangular mesh quality as a function of the probe displacement is shown in Figure 6b. The mesh quality is over than 0.75 and consequently more accurate simulation results.
As explained above, after a step of random-numbers generation, a computational technique was introduced by which was obtained the relative magnetic permeability. Depending on the experimental measurement for each pitch measurement, this magnetic property distribution is not the same and it varies from 1 to 20, hence the assimilation to a delta-ferrite structure.
The simulated relative magnetic permeability distribution (to reproduce the behavior as the experimental) is illustrated by Figure 7, covering a displacement of 20 mm from the middle length of the inspected devise, by cause of symmetry distribution.
The ECT probe moves along the direction of the cracks, from the position x = 0 to x = 40 mm, in step of 1 mm. The objective here is to conduct a qualitative study relating to the presence or absence of the most frequent thin cracks in circumferential girth weld, considering the influence of the heat welding on the HAZ and the weld area. The HAZ length is to be assumed 12.7 mm (½ inches), refer to the KEPIC MI Technical Standard [40]. To achieve both larger skin depth and to control the surface of inspected pipe, the measurements have been realized using six frequencies, operating frequency 20 kHz, detection frequency 40 kHz, optimum frequency 50 kHz and resonant frequency 300 kHz. In addition, 10 kHz and 100 kHz were added for comparison. The experiments were performed by an ASNT Level II qualified examiner by following ISO 7912 instructions [25].
The measurement of the eddy currents resulting from experimentation and simulation was exploited by the measurement of the related quantity, which results in the impedance measurement. The results of the comparisons were normalized and given in Figure 8, Figure 9, Figure 10, Figure 11, Figure 12 and Figure 13 for different crack depths. The impedance variation was analyzed for weld cracks and stored with the corresponding displacement coordinate of the ECT probe. The normalized impedance was computed by D e l t a   Z ( % ) = ( Z Z 0 ) / ( Z Z 0 ) m a x . With Z 0 and Z are the impedances of the raw material without crack and the impedance from the HAZ and the weld with crack, respectively.
The method applied here to characterize the thin cracks relies on the fact that the eddy-current response depends on the probe excitation frequency.
By considering the operating frequency, detection and the optimum frequency, the penetration depth of eddy currents was significant. Therefore, the eddy-current response would be sensitive to the crack surface in-depth direction. When μ r = 1 the impedance signal is smooth for each frequency. Fine cracks do not appear, or are almost indistinguishable, as shown by the results of Figure 8, Figure 9, Figure 10 and Figure 11. Therefore, the results obtained for constant relative magnetic permeability cannot provide right information regarding the presence or absence of thin cracks in the weld area.
In contrast, with μ r 1 this model is able to reproduce the experimental results, while giving a better prediction of cracks. The shape of the impedance signal is not the same for each depth and each frequency. The signal presents fluctuations at the peak, which corresponds to the change of environment (weld and crack). Thus, this is comprehensible as it corresponds to a presence of the thin cracks in the weld area. Figure 14 shows three shapes of shallow mountains that correspond to the three cracks referred as d0.3, d0.5 and d1.0. A small peak at 180 mm on the X axis indicates a small defect as shown in Figure 2. The output signal of the Nortec 500 equipment is entered into the DAQ and expressed as a 3D surface graph using LabVIEW as given in Figure 14.
Figure 12 and Figure 13 correspond respectively to 100 and 300 kHz. At these frequencies, the impedance of the probe is maximum, and the current flow is stronger at the surface and decreases rapidly in-depth direction. Thus, the current response would be particularly sensitive to surface cracking. The same signal was obtained with the two relative magnetic permeabilities. An insignificant signal difference was observed with 100 kHz.
The simulation results reproduce the trend and the shape of the experimental signals; however, a small deviation can be observed that is probably due to several parameters; the universe of the experimental is in 3D while the simulations are in 2D, the machining of the cracks, the lift-off and another factor come from the impedance measurement carried out.
The impedance variation as a function of the probe displacement reflects the change in the distribution of physical properties over the part of the pipe being inspected. The proposed approach is validated by a comparison and shows a satisfactory concordance with the experimental ones in all cases for all the frequencies used, which proves:
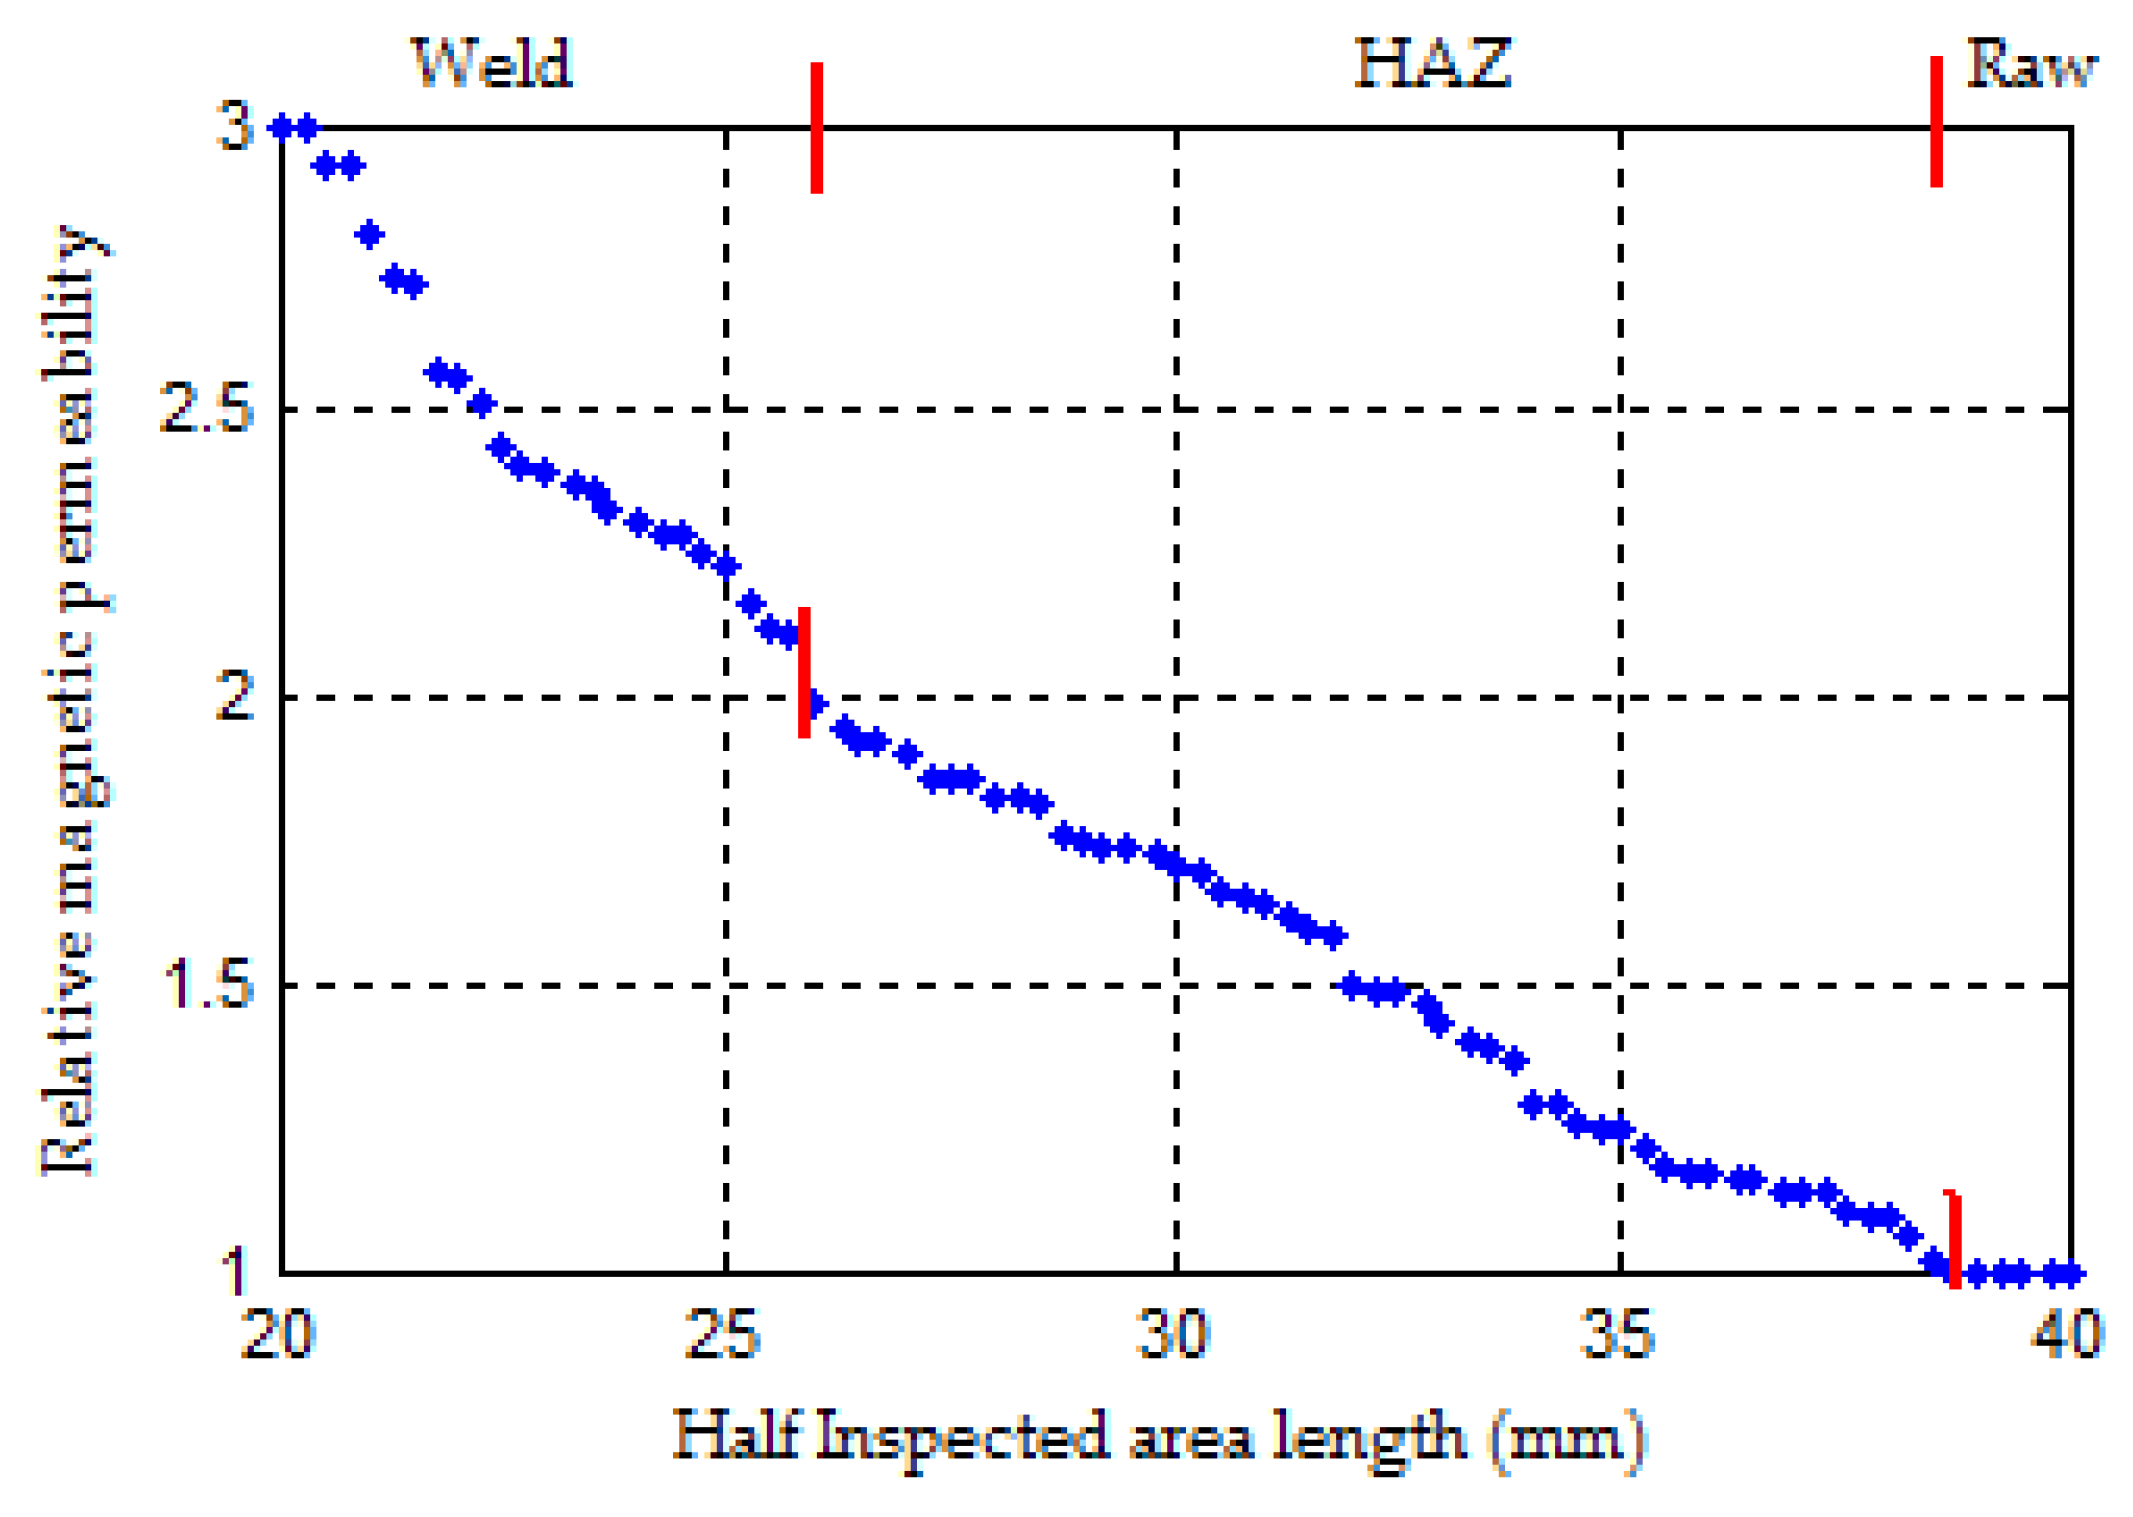
  • Eddy currents are well adapted to the detection of thin surface cracks under the stress of the heat welding which affects the relative magnetic permeability locally.
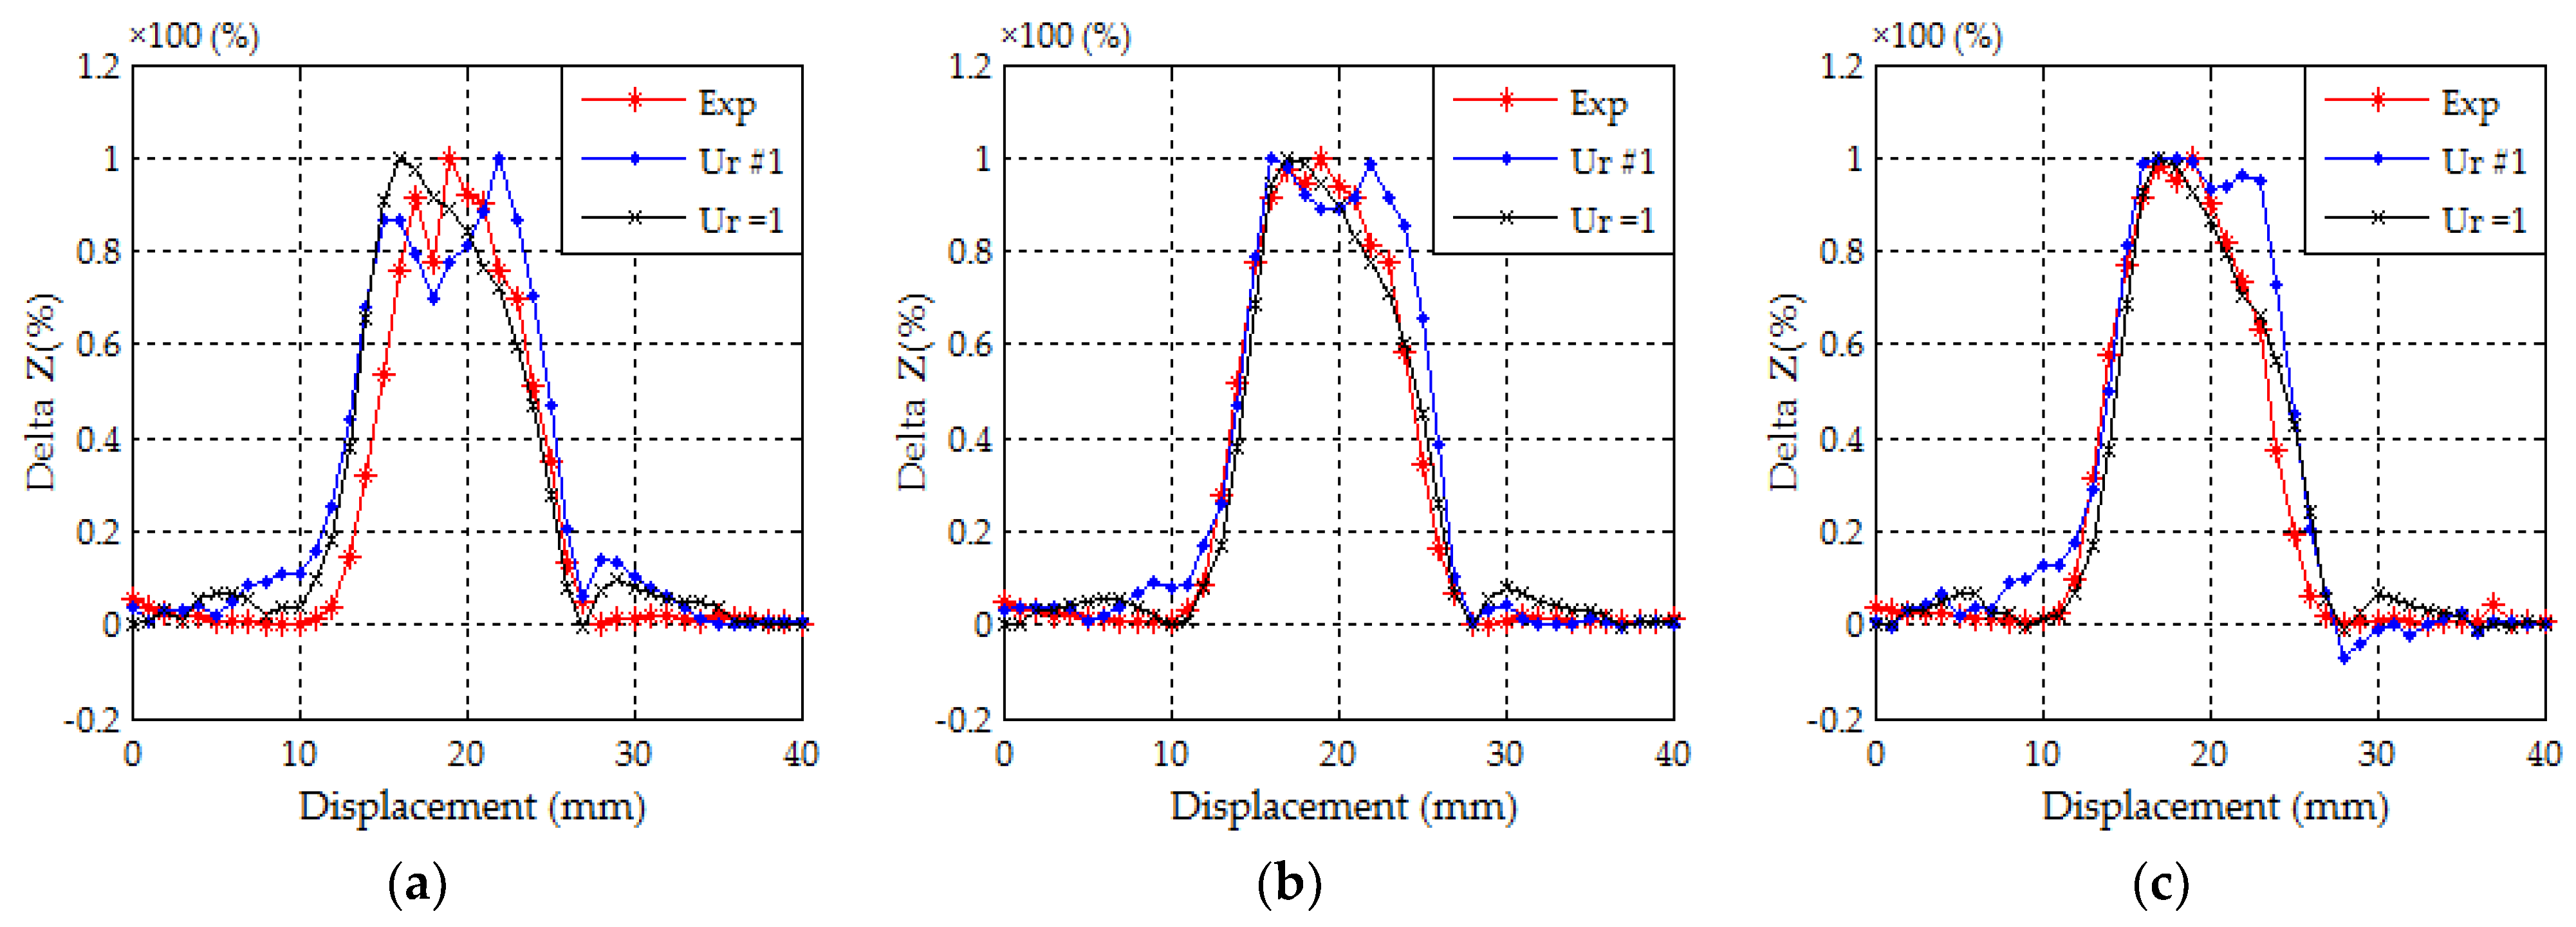
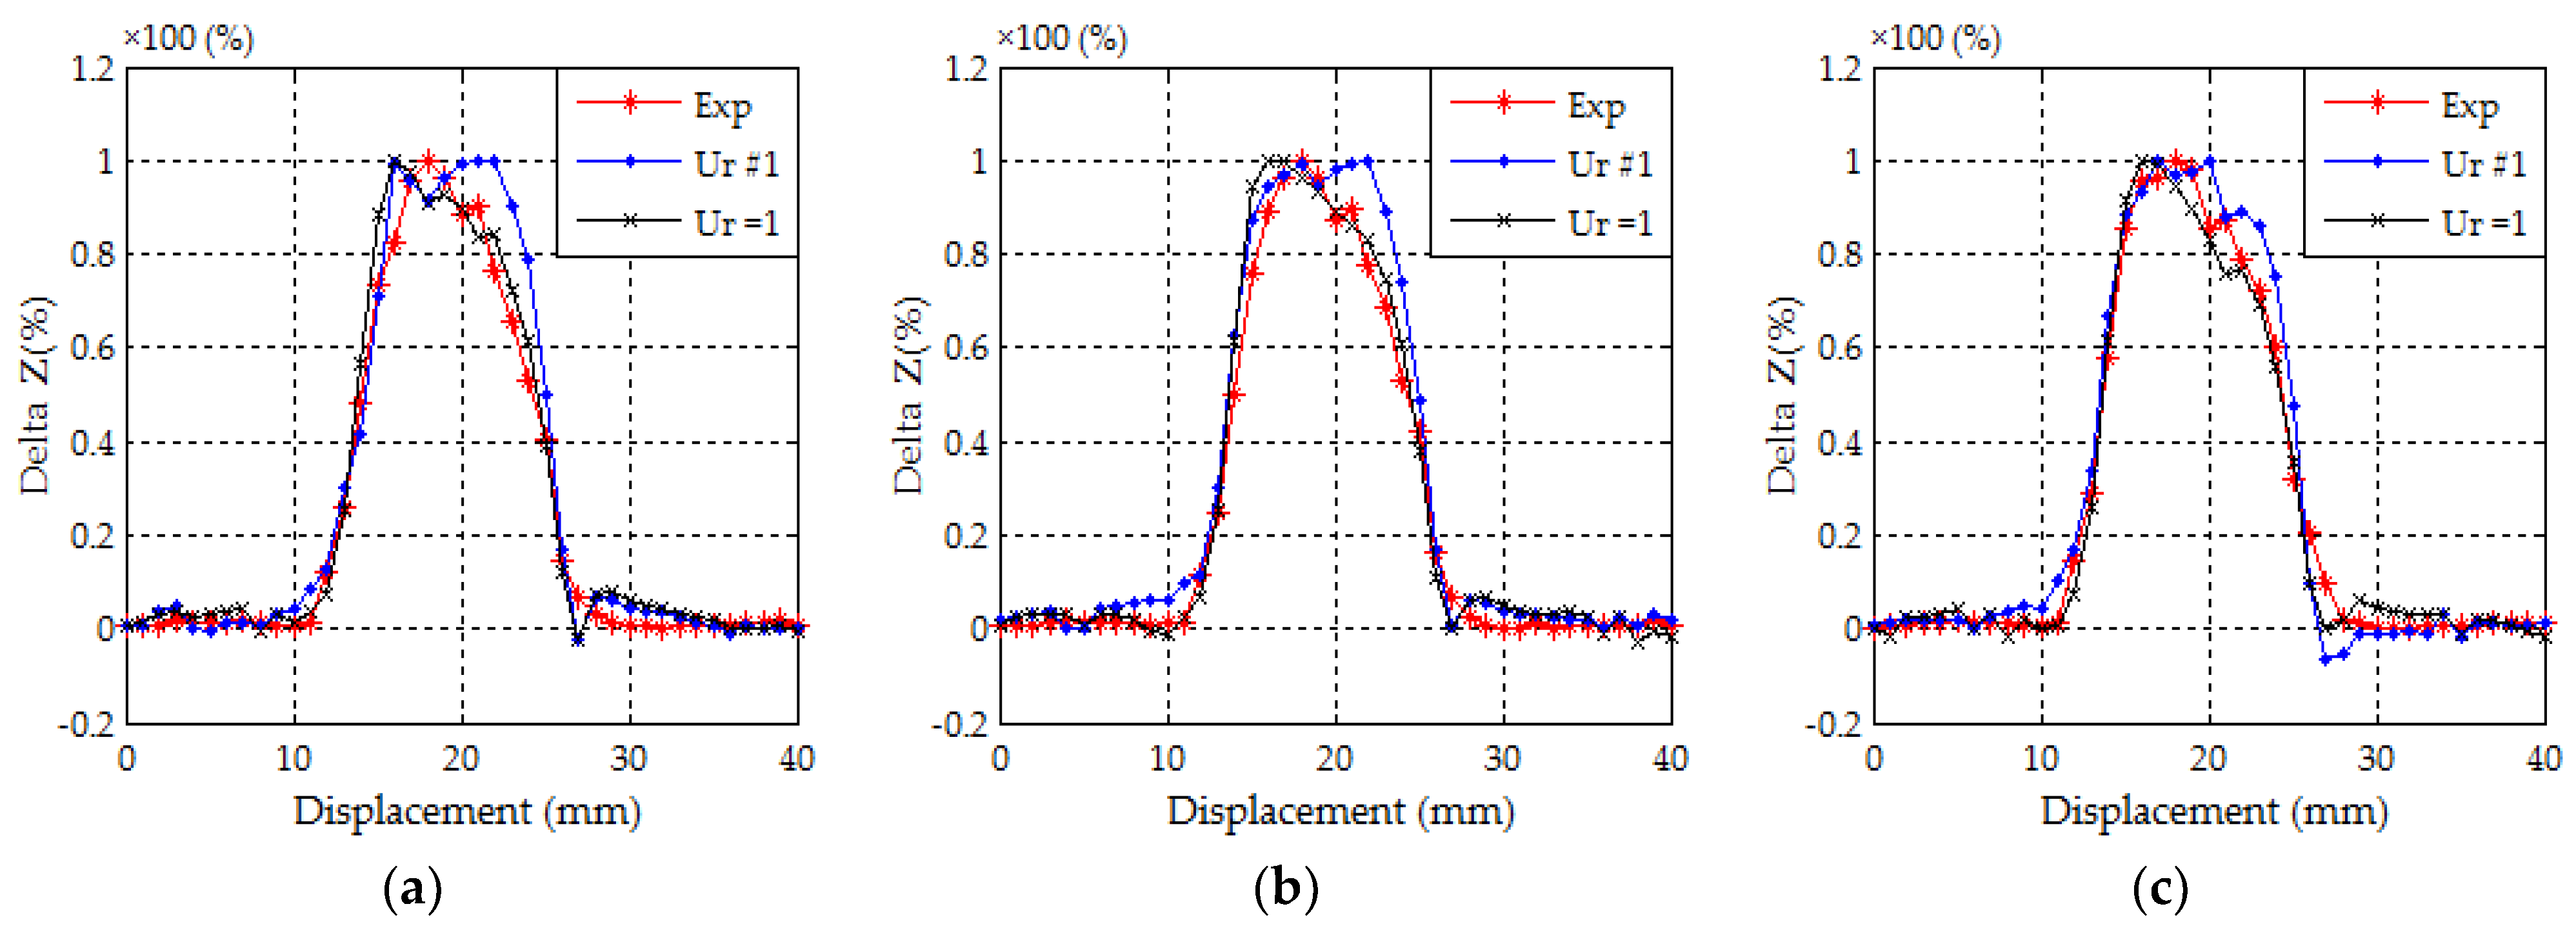
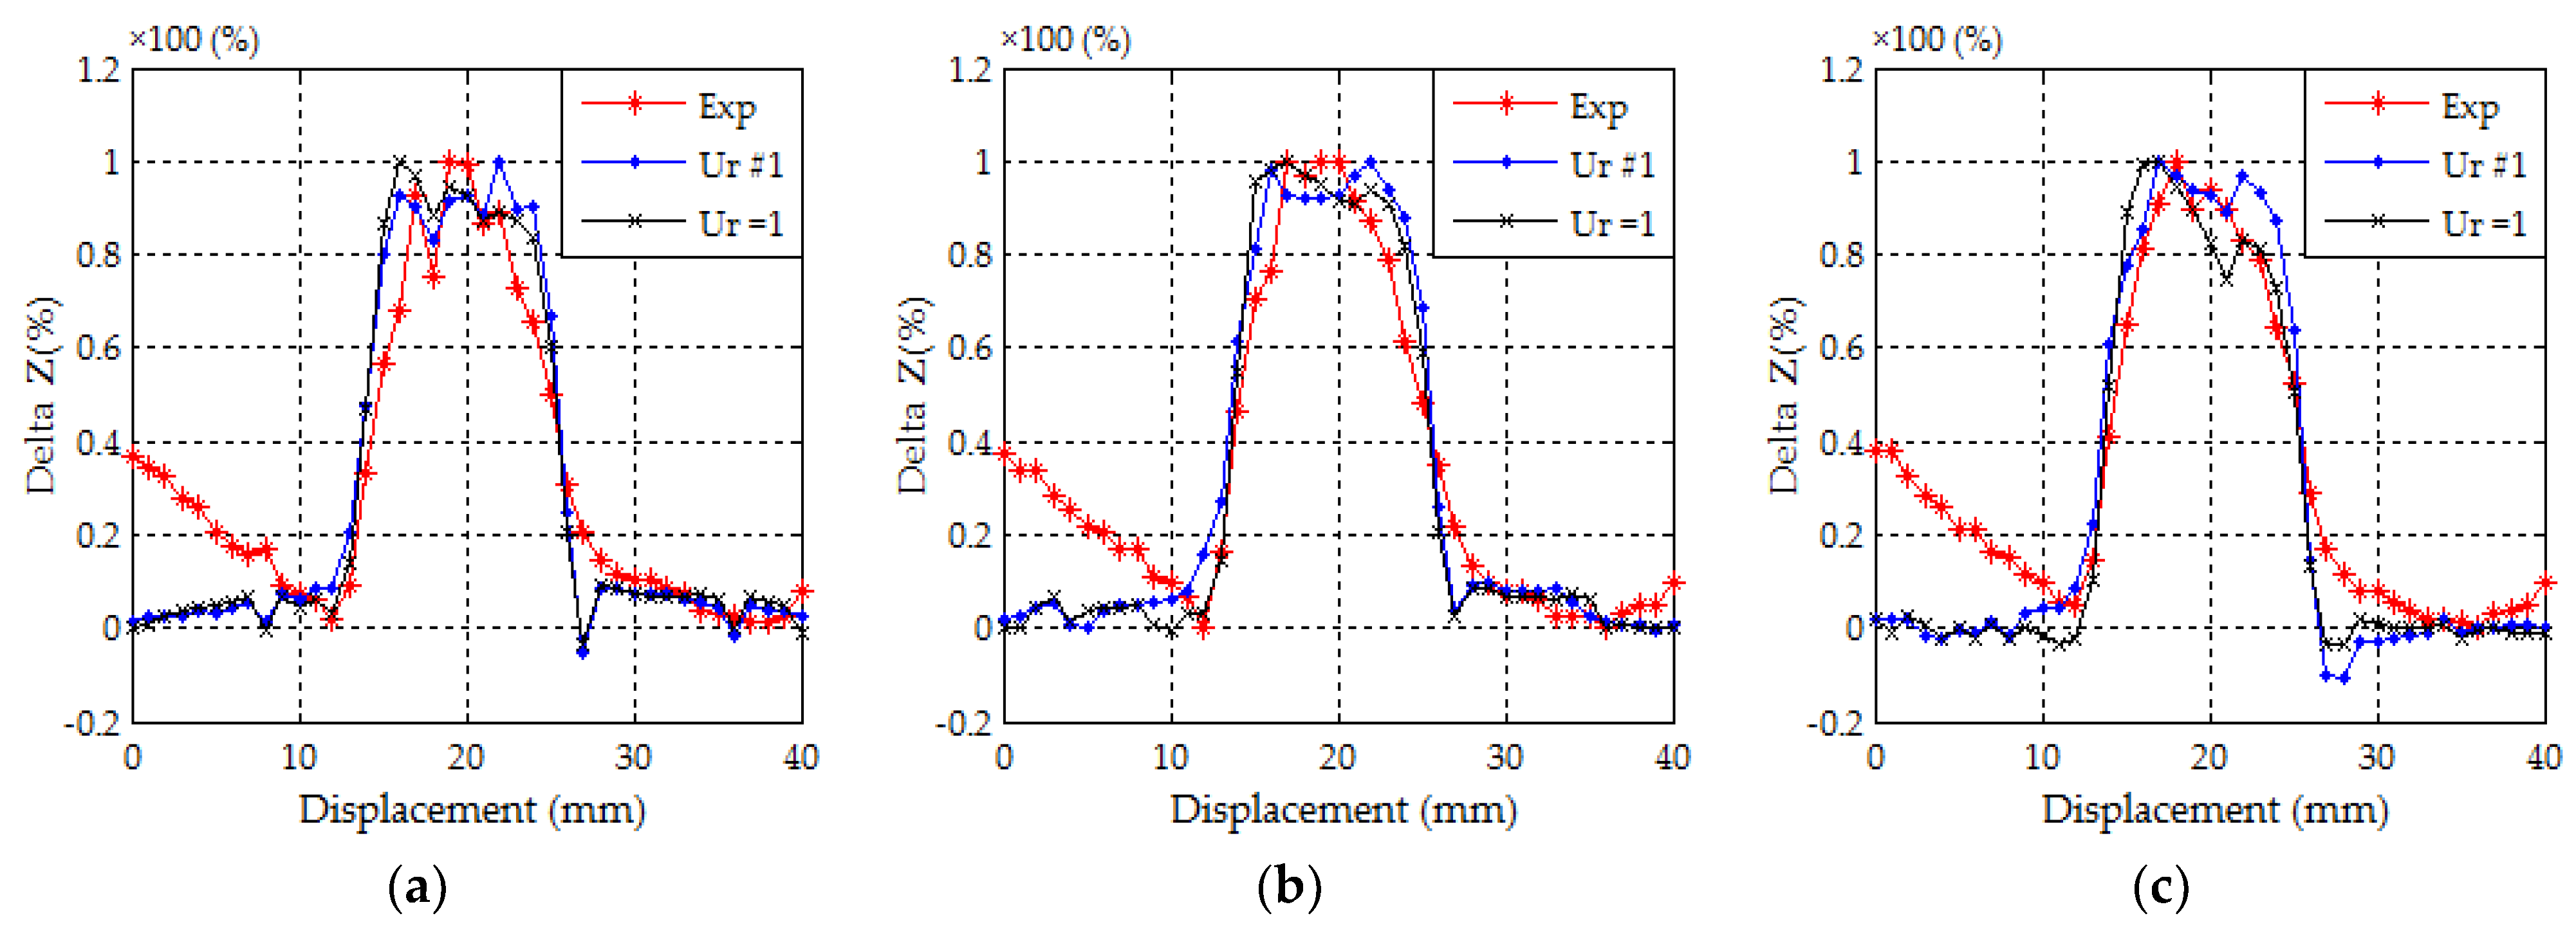
  • The validity of the modeling and the analysis approach.

5. Conclusions

The stochastic finite element method was applied to study weld cracks in AISI 304 pipe used in nuclear power plants by nondestructive testing. The relative magnetic permeability was gradiently generated using the Monte Carlo Method based on pseudo-random number generation. It is considered as an essential property in this study to characterize weld cracks areas.
A qualitative interpretation of the eddy-current probe output and comparison of both experiment and simulation were carried out. In all cases the comparisons show a good agreement between the two results. Compared to the constant relative permeability, μ r 1 showed a greater sensitivity with respect to the change caused by the presence of thin cracks in the weld. On the other hand, considering μ r 1 is more sensitive than μ r = 1 to distinguish the thin cracks with 10, 20, 40 and 50 kHz. Furthermore, the results confirm that taking into account the influence of the heat treatment induced by the welding process is more effective for this purpose. Thus, in the framework of future research, it will be interesting to use artificial intelligence based on deep learning exploiting big data applied in the field of nondestructive testing techniques for surface and subsurface scanning.

Author Contributions

Conceptualization, J.L.; methodology, J.L., A.B. and E.C.; software, A.B.; validation, A.B. and J.L.; formal analysis, A.B.; investigation, J.L. and A.B.; resources, J.L. and E.C.; data curation, J.L., A.B. and E.C.; writing—original draft preparation, A.B.; writing—review and editing, A.B. and J.L.; visualization, E.C. and J.L.; supervision, J.L.; project administration, J.L.; funding acquisition, J.L. This paper was prepared with the contributions of all authors. All authors have read and agreed to the published version of the manuscript.

Funding

This work was supported by KOREA HYDRO & NUCLEAR POWER Co., LTD. (No.2018-T-14).

Institutional Review Board Statement

Not applicable.

Informed Consent Statement

Not applicable.

Data Availability Statement

Not applicable.

Conflicts of Interest

The authors declare no conflict of interest.

References

  1. Nam, T.H.; An, E.; Kim, B.J.; Shin, S.; Ko, W.S.; Park, N.; Kang, N.; Jong, B.J. Effect of post weld heat treatment on the microstructure and mechanical properties of a submerged-arc-welded 304 stainless steel. Metals 2018, 8, 26. [Google Scholar] [CrossRef] [Green Version]
  2. Jang, D.; Kim, K.; Kim, H.C.; Jeon, J.B.; Nam, D.G.; Sohn, K.Y.; Kim, B.J. Evaluation of Mechanical property for welded austenitic stainless steel 304 by following post weld heat treatment. Korean J. Met. Mater. 2017, 55, 664–670. [Google Scholar] [CrossRef]
  3. Kawahara, Y. Application of high temperature corrosion-resistant materials and coatings under severe corrosive environment in waste-to-energy boilers. J. Therm. Spray Technol. 2007, 16, 202–213. [Google Scholar] [CrossRef]
  4. Adegboye, M.A.; Fung, W.K.; Karnik, A. Recent advances in pipelines monitoring and oil leakage detection Technologies: Principles and approaches. Sensors 2019, 19, 2548. [Google Scholar] [CrossRef] [Green Version]
  5. Dai, L.; Feng, H.; Wang, T.; Xuan, W.; Liang, Z.; Yang, X. Pipe crack recognition based on eddy current NDT and 2D impedance characteristics. Appl. Sci. 2019, 9, 689. [Google Scholar] [CrossRef] [Green Version]
  6. Mehaddene, H.; Mohellebi, H.; Berkache, A.; Berthiau, G. Experimental and numerical multi-defects analysis in ferromagnetic medium. Przegląd Elektrotechniczny 2020, 96, 57–61. [Google Scholar] [CrossRef]
  7. AbdAlla, A.N.; Faraj, M.A.; Samsuri, F.; Rifai, D.; Ali, K.; Al-Douri, Y. Challenges in improving the performance of eddy current testing: Review. Meas. Control 2019, 52, 46–64. [Google Scholar] [CrossRef] [Green Version]
  8. Zhang, H.; Wei, Z.; Xie, F.; Sun, B. Assessment of the Properties of AISI 410 Martensitic Stainless Steel by an Eddy Current Method. Materials 2019, 12, 1290. [Google Scholar] [CrossRef] [PubMed] [Green Version]
  9. ISO 12718. Non-Destructive Testing—Eddy Current Testing—Vocabulary, 2nd ed.; ISO: Geneva, Switzerland, 2019. [Google Scholar]
  10. Berkache, A.; Oudni, Z.; Mehaddene, H.; Mohellebi, H.; Lee, J. Inspection and characterization of random physical property defects by stochastic finite element method. PrzeglądElektrotechniczny 2019, 95, 96–101. [Google Scholar] [CrossRef]
  11. Kim, J.; Le, M.; Lee, J.; Hwang, Y.H. Eddy current testing and evaluation of far-side corrosion around rivet in jet-engine of aging supersonic aircraft. J. Nondestruct. Eval. 2014, 33, 471–480. [Google Scholar] [CrossRef]
  12. Tsuboi, H.; Ikeda, K.; Kurata, M.; Kainuma, K.; Nakamura, K. Eddy current analysis for the pipe welding. IEEE Trans. Magn. 1998, 34, 1234–1236. [Google Scholar] [CrossRef]
  13. Sim, S.; Le, M.; Kim, J.; Lee, J.; Kim, H.; Do, H.S. Nondestructive inspection of control rods in nuclear power plants using an encircling-type magnetic camera. Int. J. Appl. Electromagn. Mech. 2016, 52, 1561–1567. [Google Scholar] [CrossRef]
  14. Costanza, G.; Sili, A.; Tata, M.E. Weldability of austenitic stainless steel by metal arc welding with different shielding gas. Procedia Struct. Integr. 2016, 2, 3508–3514. [Google Scholar] [CrossRef] [Green Version]
  15. Cho, D.W.; Cho, W.I.; Na, S.J. Modeling and simulation of arc: Laser and hybrid welding process. J. Manuf. Process. 2013, 16, 26–55. [Google Scholar] [CrossRef]
  16. Kah, P.; Layus, P.; Hiltunen, E.; Martikainen, J. Real-time weld process monitoring. Adv. Mater. Res. 2014, 933, 117–124. [Google Scholar] [CrossRef]
  17. Wu, C.; Kim, J.W. Review on mitigation of welding-induced distortion based on FEM analysis. J. Weld. Join. 2020, 38, 56–66. [Google Scholar] [CrossRef] [Green Version]
  18. Li, W.; Ma, W.; Qi, P.; Wen-jiao, D.; Yuan, X.; Yin, X. Detection and evaluation of weld defects in stainless steel using alternating current field measurement. In Proceedings of the 44th Annual Review of Progress in QNDE, Provo, Utah, USA, 16–21 July 2017; American Institute of Physics: College Park, MD, USA, 2018; Volume 1949, p. 230019. [Google Scholar] [CrossRef] [Green Version]
  19. Saito, T.; Ichiyama, Y. Weld defects and evaluation of weld quality: Welding phenomena and process control in flash welding of steel sheets. Weld. Int. 1996, 10, 117–123. [Google Scholar] [CrossRef]
  20. Park, I.; Kim, E.-Y.; Yang, W.-J. Microstructural Investigation of Stress Corrosion Cracking in Cold-Formed AISI 304 Reactor. Metals 2021, 11, 7. [Google Scholar] [CrossRef]
  21. Hu, X.; Jiang, H.-Y.; Luo, Y.; Jin, Q.; Peng, W.; Yi, C.-M. A Study on Microstructure, Residual Stresses and Stress Corrosion Cracking of Repair Welding on 304 Stainless Steel: Part II-Effects of Reinforcement Height. Materials 2020, 13, 2434. [Google Scholar] [CrossRef] [PubMed]
  22. Oršulová, T.; Palček, P.; Kúdelčík, J. Effect of plastic deformation on the magnetic properties of selected austenitic stainless steels. Prod. Eng. Arch. 2017, 14, 15–18. [Google Scholar] [CrossRef]
  23. American Society of Mechanical Engineers. ASME Boiler and Pressure Vessel Code, 2010 ed.; ASME: New York, NY, USA, 2010; p. 108. [Google Scholar]
  24. UGITECH. Magnetism and Stainless Steel. Available online: https://www.swisssteelinternational.us/fileadmin/user_upload/Ugitec/Documents_publics/AC/MARCHES/Magnetism/7512UGITECHMagnetGB.pdf (accessed on 1 January 2009).
  25. ISO 9712. Non-Destructive Testing—Qualification and Certification of NDT Personnel, 4th ed.; ISO: Geneva, Switzerland, 2012. [Google Scholar]
  26. Pasqualini, L.; Parton, M. Pseudo random number generation through reinforcement learning and recurrent neural networks. Algorithms 2020, 13, 307. [Google Scholar] [CrossRef]
  27. Irfan, M.; Ali, A.; Khan, M.A.; ul-Haq, M.E.; Shah, S.N.M.; Saboor, A.; Ahmad, W. Pseudorandom number generator (PRNG) design using hyper-chaotic modified robust logistic map (HC-MRLM). Electronics 2020, 9, 104. [Google Scholar] [CrossRef] [Green Version]
  28. L’Ecuyer, P. Pseudorandom number generators. In Encyclopedia of Quantitative Finance; Simulation Methods in Financial Engineering; Cont, R., Ed.; John Wiley: Chichester, UK, 2010; pp. 1431–1437. [Google Scholar]
  29. Bhattacharjee, K.; Maity, K.; Das, S. Search for good pseudo-random number generators: Survey and empirical studies. arXiv 2018, arXiv:1811.04035. [Google Scholar]
  30. Greenberger, M. Notes on a new pseudo-random number generator. JACM 1961, 8, 163–167. [Google Scholar] [CrossRef]
  31. Salmon, J.K.; Moraes, M.A.; Dror, R.O.; Shaw, D.E. Parallel Random Numbers: As Easy as 1,2,3. In Proceedings of the 2011 International Conference for High Performance Computing, Networking, Storage and Analysis, Seattle, WA, USA, 12–18 November 2011. [Google Scholar] [CrossRef]
  32. Datcu, O.; Macovei, C.; Hobincu, R. Chaos based cryptographic pseudo-random number generator template with dynamic state change. Appl. Sci. 2020, 10, 451. [Google Scholar] [CrossRef] [Green Version]
  33. Silvester, P.; Chari, M.V.K. Finite element solution of saturable magnetic field problems. IEEE Trans. Power Appar. Syst. 1970, PAS-89, 1642–1651. [Google Scholar] [CrossRef]
  34. Ida, N.; Betzold, K.; Lord, W. Finite element modeling of absolute eddy current probe signals. J. Nondestruct. Eval. 1982, 3, 147–154. [Google Scholar] [CrossRef]
  35. Thomas, J.L. Simplified Modeling of Eddy Current Control of Steam Generator Tubes Report of Internship ESA IGELEC; University of Nantes: Nantes, France, 1998. [Google Scholar]
  36. Oudni, Z.; Feliachi, M.; Mohellebi, H. Assessment of the probability of failure for EC nondestructive testing based on intrusive spectral stochastic finite element method. Eur. Phys. J. Appl. Phys. 2014, 66, 30904. [Google Scholar] [CrossRef]
  37. Chen, D.; Shao, K.R.; Lavers, J.D. Very fast numerical analysis of benchmark models of eddy-current testing for steam generator tube. IEEE Trans. Magn. 2002, 38, 2355–2357. [Google Scholar] [CrossRef]
  38. Takagi, T.; Hashimoto, M.; Fukutomi, H.; Kurohwa, M.; Miya, K.; Tsuboi, H.; Tanaka, M.; Tani, J.; Serizawa, T.; Harada, Y.; et al. Benchmark models of eddy current testing for steam generator tube: Experiment and numerical analysis. Int. J. Appl. Electromagn. Mater. 1994, 5, 149–162. [Google Scholar] [CrossRef]
  39. Takagi, T.; Hashimoto, M.; Sugiura, T.; Norimatsu, S.; Arita, S.; Miya, K. 3D Numerical Simulation of Eddy Current Testing of a Block with a Crack. Rev. Prog. Nondestr. Eval. 1990, 9, 327–334. [Google Scholar] [CrossRef] [Green Version]
  40. Korea Electric Association. MI in Service Inspection of N.P.P; MIA Special ed.; 2005 ed∼2009 add; Korea Electric Association: Seoul, Korea, 2009; p. 32. [Google Scholar]
Figure 1. Experimental setup.
Applsci 11 02182 g001
Figure 2. The structure of joined pipe and the configuration type eddy current nondestructive testing technique (EC-NDT).
Applsci 11 02182 g002
Figure 3. Microscopic analysis: measurement of length and width of the cracks with (a) depth = 0.3 mm, (b) depth = 0.5 mm, and (c) depth = 1 mm.
Applsci 11 02182 g003
Figure 4. Cracks depth measurement.
Applsci 11 02182 g004
Figure 5. Solving domain and boundary conditions.
Applsci 11 02182 g005
Figure 6. (a) Mesh of the solving domain and (b) Mesh quality according to the displacement.
Applsci 11 02182 g006
Figure 7. The magnetic relative permeability distribution.
Applsci 11 02182 g007
Figure 8. Impedance variation in (%) at 10 kHz with (a) depth = 0.3 mm, (b) depth = 0.5 mm, and (c) depth = 1 mm.
Applsci 11 02182 g008
Figure 9. Impedance variation in (%) at 20 kHz with (a) depth = 0.3 mm, (b) depth = 0.5 mm, and (c) depth = 1 mm.
Applsci 11 02182 g009
Figure 10. Impedance variation in (%) at 40 kHz with (a) depth = 0.3 mm, (b) depth = 0.5 mm, and (c) depth = 1 mm.
Applsci 11 02182 g010
Figure 11. Impedance variation in (%) at 50 kHz with (a) depth = 0.3 mm, (b) depth = 0.5 mm, and (c) depth = 1 mm.
Applsci 11 02182 g011
Figure 12. Impedance variation in (%) at 100 kHz with (a) depth = 0.3 mm, (b) depth = 0.5 mm, and (c) depth = 1 mm.
Applsci 11 02182 g012
Figure 13. Impedance variation in (%) at 300 kHz with (a) depth = 0.3 mm, (b) depth = 0.5 mm, and (c) depth = 1 mm.
Applsci 11 02182 g013
Figure 14. Cracks imaging obtained with 300 kHz.
Applsci 11 02182 g014
Table 1. Test setup parameters.
Probe Test Specimen
Inner diameter
Outer diameter
Height
Numbers of turns
Lift-off
3 mmThickness9 mm
4 mm
4 mm
Conductivity
Permeability1
1.38 Ms/m
1
N/A
0.1 mm
Permeability2
Permeability3
Weld width
Random
Random
12 mm
Publisher’s Note: MDPI stays neutral with regard to jurisdictional claims in published maps and institutional affiliations.

